10-Q: Quarterly report pursuant to Section 13 or 15(d)
Published on April 26, 2022
UNITED STATES
SECURITIES AND EXCHANGE COMMISSION
Washington, D.C. 20549
FORM
|
|
QUARTERLY REPORT PURSUANT TO SECTION 13 OR 15(d) OF THE SECURITIES EXCHANGE ACT OF 1934 |
For the quarterly period ended
|
|
TRANSITION REPORT PURSUANT TO SECTION 13 OR 15(d) OF THE SECURITIES EXCHANGE ACT OF 1934 |
For the transition period from ______________ to ______________
Commission File Number:

(Exact name of registrant as specified in its charter)
|
|
|
|
|
|
(State or other jurisdiction of incorporation or organization) |
|
(I.R.S. Employer Identification No.) |
|
|
|
|
|
|
|
|
|
|
|
|
(Address or principal executive offices) |
|
(Zip Code) |
(
(Registrants’ telephone number, including area code)
(Former name, former address and former fiscal year, if changed since last report)
Securities registered pursuant to Section 12(b) of the Act:
|
|
|
Title of Each Class |
|
Trading Symbol(s) |
|
Name of Each Exchange on Which Registered |
|
Prologis, Inc. |
|
|
|
|
|
|
|
Prologis, L.P. |
|
|
|
|
|
|
|
Prologis, L.P. |
|
|
|
|
|
|
|
|
|
|
|
|
|
|
Indicate by check mark whether the registrant (1) has filed all reports required to be filed by Section 13 or 15(d) of the Securities Exchange Act of 1934 during the preceding 12 months (or for such shorter period that the registrant was required to file such reports), and (2) has been subject to such filing for the past 90 days.
|
Prologis, Inc. |
|
☒ |
No |
☐ |
|
Prologis, L.P. |
|
☒ |
No |
☐ |
Indicate by check mark whether the registrant has submitted electronically every Interactive Data File required to be submitted pursuant to Rule 405 of Regulation S-T (§232.405 of this chapter) during the preceding 12 months (or for such shorter periods that the registrant was required to submit such files).
|
Prologis, Inc. |
|
☒ |
No |
☐ |
|
Prologis, L.P. |
|
☒ |
No |
☐ |
Indicate by check mark whether the registrant is a large accelerated filer, an accelerated filer, a non-accelerated filer, smaller reporting company, or an emerging growth company. See definitions of “large accelerated filer”, “accelerated filer,” “smaller reporting company,” and “emerging growth company” in Rule 12b-2 of the Exchange Act:
|
Prologis, Inc.: |
|
|
|
|
|
|
Accelerated filer ☐ |
Non-accelerated filer ☐ |
Smaller reporting company |
Emerging growth company |
|
Prologis, L.P.: |
|
|
|
|
|
Large accelerated filer ☐ |
Accelerated filer ☐ |
|
Smaller reporting company |
Emerging growth company |
If an emerging growth company, indicate by check mark if the registrant has elected not to use the extended transition period for complying with any new or revised financial accounting standards provided pursuant to Section 13(a) of the Exchange Act. ☐
Indicate by check mark whether the registrant is a shell company (as defined in Rule 12b-2 of the Securities Exchange Act of 1934).
|
Prologis, Inc. |
Yes |
|
No |
☒ |
|
Prologis, L.P. |
Yes |
|
No |
☒ |
The number of shares of Prologis, Inc.’s common stock outstanding at April 22, 2022, was approximately
EXPLANATORY NOTE
This report combines the quarterly reports on Form 10-Q for the period ended March 31, 2022, of Prologis, Inc. and Prologis, L.P. Unless stated otherwise or the context otherwise requires, references to “Prologis, Inc.” or the “Parent” mean Prologis, Inc. and its consolidated subsidiaries; and references to “Prologis, L.P.” or the “Operating Partnership” or the “OP” mean Prologis, L.P., and its consolidated subsidiaries. The terms “the Company,” “Prologis,” “we,” “our” or “us” means the Parent and the OP collectively.
The Parent is a real estate investment trust (a “REIT”) and the general partner of the OP. At March 31, 2022, the Parent owned 97.25% common general partnership interest in the OP and substantially all of the preferred units in the OP. The remaining 2.75% common limited partnership interests are owned by unaffiliated investors and certain current and former directors and officers of the Parent.
We operate the Parent and the OP as one enterprise. The management of the Parent consists of the same members as the management of the OP. These members are officers of the Parent and employees of the OP or one of its subsidiaries. As sole general partner, the Parent has control of the OP through complete responsibility and discretion in the day-to-day management and therefore, consolidates the OP for financial reporting purposes. Because the only significant asset of the Parent is its investment in the OP, the assets and liabilities of the Parent and the OP are the same on their respective financial statements.
We believe combining the quarterly reports on Form 10-Q of the Parent and the OP into this single report results in the following benefits:
|
• |
enhances investors’ understanding of the Parent and the OP by enabling investors to view the business as a whole in the same manner as management views and operates the business; |
|
• |
eliminates duplicative disclosure and provides a more streamlined and readable presentation as a substantial portion of the Company’s disclosure applies to both the Parent and the OP; and |
|
• |
creates time and cost efficiencies through the preparation of one combined report instead of two separate reports. |
It is important to understand the few differences between the Parent and the OP in the context of how we operate the Company. The Parent does not conduct business itself, other than acting as the sole general partner of the OP and issuing public equity from time to time. The OP holds substantially all the assets of the business, directly or indirectly. The OP conducts the operations of the business and is structured as a partnership with no publicly traded equity. Except for net proceeds from equity issuances by the Parent, which are contributed to the OP in exchange for partnership units, the OP generates capital required by the business through the OP’s operations, incurrence of indebtedness and issuance of partnership units to third parties.
The presentation of noncontrolling interests, stockholders’ equity and partners’ capital are the main areas of difference between the consolidated financial statements of the Parent and those of the OP. The differences in the presentations between stockholders’ equity and partners’ capital result from the differences in the equity and capital issuances in the Parent and in the OP.
The preferred stock, common stock, additional paid-in capital, accumulated other comprehensive income (loss) and distributions in excess of net earnings of the Parent are presented as stockholders’ equity in the Parent’s consolidated financial statements. These items represent the common and preferred general partnership interests held by the Parent in the OP and are presented as general partner’s capital within partners’ capital in the OP’s consolidated financial statements. The common limited partnership interests held by the limited partners in the OP are presented as noncontrolling interest within equity in the Parent’s consolidated financial statements and as limited partners’ capital within partners’ capital in the OP’s consolidated financial statements.
To highlight the differences between the Parent and the OP, separate sections in this report, as applicable, individually discuss the Parent and the OP, including separate financial statements and separate Exhibit 31 and 32 certifications. In the sections that combine disclosure of the Parent and the OP, this report refers to actions or holdings as being actions or holdings of Prologis.
PROLOGIS
INDEX
PART I. FINANCIAL INFORMATION
ITEM 1. Financial Statements
PROLOGIS, INC.
CONSOLIDATED BALANCE SHEETS
(Unaudited)
(In thousands, except per share data)
|
|
|
|
|
|
|
|
|
|
|
March 31, 2022 |
|
|
December 31, 2021 |
|
||
|
ASSETS |
|
|
|
|
|
|
|
|
Investments in real estate properties |
$ |
|
|
|
$ |
|
|
|
Less accumulated depreciation |
|
|
|
|
|
|
|
|
Net investments in real estate properties |
|
|
|
|
|
|
|
|
Investments in and advances to unconsolidated entities |
|
|
|
|
|
|
|
|
Assets held for sale or contribution |
|
|
|
|
|
|
|
|
Net investments in real estate |
|
|
|
|
|
|
|
|
|
|
|
|
|
|
|
|
|
Cash and cash equivalents |
|
|
|
|
|
|
|
|
Other assets |
|
|
|
|
|
|
|
|
Total assets |
$ |
|
|
|
$ |
|
|
|
|
|
|
|
|
|
|
|
|
LIABILITIES AND EQUITY |
|
|
|
|
|
|
|
|
Liabilities: |
|
|
|
|
|
|
|
|
Debt |
$ |
|
|
|
$ |
|
|
|
Accounts payable and accrued expenses |
|
|
|
|
|
|
|
|
Other liabilities |
|
|
|
|
|
|
|
|
Total liabilities |
|
|
|
|
|
|
|
|
|
|
|
|
|
|
|
|
|
Equity: |
|
|
|
|
|
|
|
|
Prologis, Inc. stockholders’ equity: |
|
|
|
|
|
|
|
|
Series Q preferred stock at stated liquidation preference of $ March 31, 2022 and December 31, 2021 |
|
|
|
|
|
|
|
|
Common stock; $ March 31, 2022 and December 31, 2021, respectively |
|
|
|
|
|
|
|
|
Additional paid-in capital |
|
|
|
|
|
|
|
|
Accumulated other comprehensive loss |
|
( |
) |
|
|
( |
) |
|
Distributions in excess of net earnings |
|
( |
) |
|
|
( |
) |
|
Total Prologis, Inc. stockholders’ equity |
|
|
|
|
|
|
|
|
Noncontrolling interests |
|
|
|
|
|
|
|
|
Total equity |
|
|
|
|
|
|
|
|
Total liabilities and equity |
$ |
|
|
|
$ |
|
|
The accompanying notes are an integral part of these Consolidated Financial Statements.
1
PROLOGIS, INC.
CONSOLIDATED STATEMENTS OF INCOME
(Unaudited)
(In thousands, except per share amounts)
|
|
|
Three Months Ended |
|
|||||
|
|
|
March 31, |
|
|||||
|
|
|
2022 |
|
|
2021 |
|
||
|
Revenues: |
|
|
|
|
|
|
|
|
|
Rental |
|
$ |
|
|
|
$ |
|
|
|
Strategic capital |
|
|
|
|
|
|
|
|
|
Development management and other |
|
|
|
|
|
|
|
|
|
Total revenues |
|
|
|
|
|
|
|
|
|
Expenses: |
|
|
|
|
|
|
|
|
|
Rental |
|
|
|
|
|
|
|
|
|
Strategic capital |
|
|
|
|
|
|
|
|
|
General and administrative |
|
|
|
|
|
|
|
|
|
Depreciation and amortization |
|
|
|
|
|
|
|
|
|
Other |
|
|
|
|
|
|
|
|
|
Total expenses |
|
|
|
|
|
|
|
|
|
|
|
|
|
|
|
|
|
|
|
Operating income before gains on real estate transactions, net |
|
|
|
|
|
|
|
|
|
Gains on dispositions of development properties and land, net |
|
|
|
|
|
|
|
|
|
Gains on other dispositions of investments in real estate, net |
|
|
|
|
|
|
|
|
|
Operating income |
|
|
|
|
|
|
|
|
|
|
|
|
|
|
|
|
|
|
|
Other income (expense): |
|
|
|
|
|
|
|
|
|
Earnings from unconsolidated entities, net |
|
|
|
|
|
|
|
|
|
Interest expense |
|
|
( |
) |
|
|
( |
) |
|
Interest and other income, net |
|
|
|
|
|
|
|
|
|
Foreign currency and derivative gains, net |
|
|
|
|
|
|
|
|
|
Losses on early extinguishment of debt, net |
|
|
( |
) |
|
|
( |
) |
|
Total other income (expense) |
|
|
|
|
|
|
( |
) |
|
Earnings before income taxes |
|
|
|
|
|
|
|
|
|
Income tax expense |
|
|
( |
) |
|
|
( |
) |
|
Consolidated net earnings |
|
|
|
|
|
|
|
|
|
Less net earnings attributable to noncontrolling interests |
|
|
|
|
|
|
|
|
|
Net earnings attributable to controlling interests |
|
|
|
|
|
|
|
|
|
Less preferred stock dividends |
|
|
|
|
|
|
|
|
|
Net earnings attributable to common stockholders |
|
$ |
|
|
|
$ |
|
|
|
|
|
|
|
|
|
|
|
|
|
Weighted average common shares outstanding – Basic |
|
|
|
|
|
|
|
|
|
Weighted average common shares outstanding – Diluted |
|
|
|
|
|
|
|
|
|
|
|
|
|
|
|
|
|
|
|
Net earnings per share attributable to common stockholders – Basic |
|
$ |
|
|
|
$ |
|
|
|
|
|
|
|
|
|
|
|
|
|
Net earnings per share attributable to common stockholders – Diluted |
|
$ |
|
|
|
$ |
|
|
The accompanying notes are an integral part of these Consolidated Financial Statements.
2
PROLOGIS, INC.
CONSOLIDATED STATEMENTS OF COMPREHENSIVE INCOME
(Unaudited)
(In thousands)
|
|
|
Three Months Ended |
|
|||||
|
|
|
March 31, |
|
|||||
|
|
|
2022 |
|
|
2021 |
|
||
|
Consolidated net earnings |
|
$ |
|
|
|
$ |
|
|
|
Other comprehensive income (loss): |
|
|
|
|
|
|
|
|
|
Foreign currency translation gains, net |
|
|
|
|
|
|
|
|
|
Unrealized gains on derivative contracts, net |
|
|
|
|
|
|
|
|
|
Comprehensive income |
|
|
|
|
|
|
|
|
|
Net earnings attributable to noncontrolling interests |
|
|
( |
) |
|
|
( |
) |
|
Other comprehensive income attributable to noncontrolling interests |
|
|
( |
) |
|
|
( |
) |
|
Comprehensive income attributable to common stockholders |
|
$ |
|
|
|
$ |
|
|
|
|
|
|
|
|
|
|
|
|
The accompanying notes are an integral part of these Consolidated Financial Statements.
3
PROLOGIS, INC.
CONSOLIDATED STATEMENTS OF EQUITY
(Unaudited)
(In thousands)
Three Months Ended March 31, 2022 and 2021
|
|
|
|
|
|
Common Stock |
|
|
|
|
|
|
Accumulated |
|
|
Distributions |
|
|
|
|
|
|
|
|
|
|||||||
|
|
|
|
|
|
Number |
|
|
|
|
|
|
Additional |
|
|
Other |
|
|
in Excess of |
|
|
Non- |
|
|
|
|
|
|||||
|
|
Preferred |
|
|
of |
|
|
Par |
|
|
Paid-in |
|
|
Comprehensive |
|
|
Net |
|
|
controlling |
|
|
Total |
|
||||||||
|
|
Stock |
|
|
Shares |
|
|
Value |
|
|
Capital |
|
|
Income (Loss) |
|
|
Earnings |
|
|
Interests |
|
|
Equity |
|
||||||||
|
Balance at January 1, 2022 |
$ |
|
|
|
|
|
|
|
$ |
|
|
|
$ |
|
|
|
$ |
( |
) |
|
$ |
( |
) |
|
$ |
|
|
|
$ |
|
|
|
Consolidated net earnings |
|
- |
|
|
|
- |
|
|
|
- |
|
|
|
- |
|
|
|
- |
|
|
|
|
|
|
|
|
|
|
|
|
|
|
Effect of equity compensation plans |
|
- |
|
|
|
|
|
|
|
|
|
|
|
|
|
|
|
- |
|
|
|
- |
|
|
|
|
|
|
|
|
|
|
Capital contributions |
|
- |
|
|
|
- |
|
|
|
- |
|
|
|
- |
|
|
|
- |
|
|
|
- |
|
|
|
|
|
|
|
|
|
|
Redemption of noncontrolling interests |
|
- |
|
|
|
|
|
|
|
|
|
|
|
|
|
|
|
- |
|
|
|
- |
|
|
|
( |
) |
|
|
( |
) |
|
Foreign currency translation gains, net |
|
- |
|
|
|
- |
|
|
|
- |
|
|
|
- |
|
|
|
|
|
|
|
- |
|
|
|
|
|
|
|
|
|
|
Unrealized gains on derivative contracts, net |
|
- |
|
|
|
- |
|
|
|
- |
|
|
|
- |
|
|
|
|
|
|
|
- |
|
|
|
|
|
|
|
|
|
|
Reallocation of equity |
|
- |
|
|
|
- |
|
|
|
- |
|
|
|
( |
) |
|
|
- |
|
|
|
- |
|
|
|
|
|
|
|
- |
|
|
Dividends ($ and other distributions |
|
- |
|
|
|
- |
|
|
|
- |
|
|
|
( |
) |
|
|
- |
|
|
|
( |
) |
|
|
( |
) |
|
|
( |
) |
|
Balance at March 31, 2022 |
$ |
|
|
|
|
|
|
|
$ |
|
|
|
$ |
|
|
|
$ |
( |
) |
|
$ |
( |
) |
|
$ |
|
|
|
$ |
|
|
|
|
|
|
|
|
|
|
|
|
|
|
|
|
|
|
|
|
|
|
|
|
|
|
|
|
|
|
|
|
|
|
|
|
|
|
|
|
|
Common Stock |
|
|
|
|
|
|
Accumulated |
|
|
Distributions |
|
|
|
|
|
|
|
|
|
|||||||
|
|
|
|
|
|
Number |
|
|
|
|
|
|
Additional |
|
|
Other |
|
|
in Excess of |
|
|
Non- |
|
|
|
|
|
|||||
|
|
Preferred |
|
|
of |
|
|
Par |
|
|
Paid-in |
|
|
Comprehensive |
|
|
Net |
|
|
controlling |
|
|
Total |
|
||||||||
|
|
Stock |
|
|
Shares |
|
|
Value |
|
|
Capital |
|
|
Income (Loss) |
|
|
Earnings |
|
|
Interests |
|
|
Equity |
|
||||||||
|
Balance at January 1, 2021 |
$ |
|
|
|
|
|
|
|
$ |
|
|
|
$ |
|
|
|
$ |
( |
) |
|
$ |
( |
) |
|
$ |
|
|
|
$ |
|
|
|
Consolidated net earnings |
|
- |
|
|
|
- |
|
|
|
- |
|
|
|
- |
|
|
|
- |
|
|
|
|
|
|
|
|
|
|
|
|
|
|
Effect of equity compensation plans |
|
- |
|
|
|
|
|
|
|
|
|
|
|
|
|
|
|
- |
|
|
|
- |
|
|
|
|
|
|
|
|
|
|
Capital contributions |
|
- |
|
|
|
- |
|
|
|
- |
|
|
|
- |
|
|
|
- |
|
|
|
- |
|
|
|
|
|
|
|
|
|
|
Redemption of noncontrolling interests |
|
- |
|
|
|
|
|
|
|
- |
|
|
|
|
|
|
|
- |
|
|
|
- |
|
|
|
( |
) |
|
|
( |
) |
|
Foreign currency translation gains, net |
|
- |
|
|
|
- |
|
|
|
- |
|
|
|
- |
|
|
|
|
|
|
|
- |
|
|
|
|
|
|
|
|
|
|
Unrealized gains on derivative contracts, net |
|
- |
|
|
|
- |
|
|
|
- |
|
|
|
- |
|
|
|
|
|
|
|
- |
|
|
|
|
|
|
|
|
|
|
Reallocation of equity |
|
- |
|
|
|
- |
|
|
|
- |
|
|
|
( |
) |
|
|
- |
|
|
|
- |
|
|
|
|
|
|
|
- |
|
|
Dividends ($ and other distributions |
|
- |
|
|
|
- |
|
|
|
- |
|
|
|
( |
) |
|
|
- |
|
|
|
( |
) |
|
|
( |
) |
|
|
( |
) |
|
Balance at March 31, 2021 |
$ |
|
|
|
|
|
|
|
$ |
|
|
|
$ |
|
|
|
$ |
( |
) |
|
$ |
( |
) |
|
$ |
|
|
|
$ |
|
|
|
|
|
|
|
|
|
|
|
|
|
|
|
|
|
|
|
|
|
|
|
|
|
|
|
|
|
|
|
|
|
|
|
The accompanying notes are an integral part of these Consolidated Financial Statements.
4
PROLOGIS, INC.
CONSOLIDATED STATEMENTS OF CASH FLOWS
(Unaudited)
(In thousands)
|
|
|
Three Months Ended |
|
|||||
|
|
|
March 31, |
|
|||||
|
|
|
2022 |
|
|
2021 |
|
||
|
Operating activities: |
|
|
|
|
|
|
|
|
|
Consolidated net earnings |
|
$ |
|
|
|
$ |
|
|
|
Adjustments to reconcile net earnings to net cash provided by operating activities: |
|
|
|
|
|
|
|
|
|
Straight-lined rents and amortization of above and below market leases |
|
|
( |
) |
|
|
( |
) |
|
Equity-based compensation awards |
|
|
|
|
|
|
|
|
|
Depreciation and amortization |
|
|
|
|
|
|
|
|
|
Earnings from unconsolidated entities, net |
|
|
( |
) |
|
|
( |
) |
|
Operating distributions from unconsolidated entities |
|
|
|
|
|
|
|
|
|
Decrease (increase) in operating receivables from unconsolidated entities |
|
|
( |
) |
|
|
|
|
|
Amortization of debt discounts and debt issuance costs, net |
|
|
|
|
|
|
|
|
|
Gains on dispositions of development properties and land, net |
|
|
( |
) |
|
|
( |
) |
|
Gains on other dispositions of investments in real estate, net |
|
|
( |
) |
|
|
( |
) |
|
Unrealized foreign currency and derivative gains, net |
|
|
( |
) |
|
|
( |
) |
|
Losses on early extinguishment of debt, net |
|
|
|
|
|
|
|
|
|
Deferred income tax expense |
|
|
|
|
|
|
|
|
|
Decrease in accounts receivable and other assets |
|
|
|
|
|
|
|
|
|
Decrease in accounts payable and accrued expenses and other liabilities |
|
|
( |
) |
|
|
( |
) |
|
Net cash provided by operating activities |
|
|
|
|
|
|
|
|
|
Investing activities: |
|
|
|
|
|
|
|
|
|
Real estate development |
|
|
( |
) |
|
|
( |
) |
|
Real estate acquisitions |
|
|
( |
) |
|
|
( |
) |
|
Tenant improvements and lease commissions on previously leased space |
|
|
( |
) |
|
|
( |
) |
|
Property improvements |
|
|
( |
) |
|
|
( |
) |
|
Proceeds from dispositions and contributions of real estate |
|
|
|
|
|
|
|
|
|
Investments in and advances to unconsolidated entities |
|
|
( |
) |
|
|
( |
) |
|
Return of investment from unconsolidated entities |
|
|
|
|
|
|
|
|
|
Proceeds from the settlement of net investment hedges |
|
|
|
|
|
|
|
|
|
Payments on the settlement of net investment hedges |
|
|
( |
) |
|
|
( |
) |
|
Net cash provided by (used in) investing activities |
|
|
|
|
|
|
( |
) |
|
Financing activities: |
|
|
|
|
|
|
|
|
|
Proceeds from issuance of common stock |
|
|
|
|
|
|
|
|
|
Dividends paid on common and preferred stock |
|
|
( |
) |
|
|
( |
) |
|
Noncontrolling interests contributions |
|
|
|
|
|
|
|
|
|
Noncontrolling interests distributions |
|
|
( |
) |
|
|
( |
) |
|
Settlement of noncontrolling interests |
|
|
( |
) |
|
|
( |
) |
|
Tax paid with shares withheld |
|
|
( |
) |
|
|
( |
) |
|
Debt and equity issuance costs paid |
|
|
( |
) |
|
|
( |
) |
|
Net payments on credit facilities |
|
|
( |
) |
|
|
( |
) |
|
Repurchase of and payments on debt |
|
|
( |
) |
|
|
( |
) |
|
Proceeds from the issuance of debt |
|
|
|
|
|
|
|
|
|
Net cash provided by (used in) financing activities |
|
|
|
|
|
|
( |
) |
|
|
|
|
|
|
|
|
|
|
|
Effect of foreign currency exchange rate changes on cash |
|
|
( |
) |
|
|
( |
) |
|
Net increase in cash and cash equivalents |
|
|
|
|
|
|
|
|
|
Cash and cash equivalents, beginning of period |
|
|
|
|
|
|
|
|
|
Cash and cash equivalents, end of period |
|
$ |
|
|
|
$ |
|
|
See Note 11 for information on noncash investing and financing activities and other information.
The accompanying notes are an integral part of these Consolidated Financial Statements.
5
PROLOGIS, L.P.
CONSOLIDATED BALANCE SHEETS
(Unaudited)
(In thousands)
|
|
|
|
|
|
|
|
|
|
|
March 31, 2022 |
|
|
December 31, 2021 |
|
||
|
ASSETS |
|
|
|
|
|
|
|
|
Investments in real estate properties |
$ |
|
|
|
$ |
|
|
|
Less accumulated depreciation |
|
|
|
|
|
|
|
|
Net investments in real estate properties |
|
|
|
|
|
|
|
|
Investments in and advances to unconsolidated entities |
|
|
|
|
|
|
|
|
Assets held for sale or contribution |
|
|
|
|
|
|
|
|
Net investments in real estate |
|
|
|
|
|
|
|
|
|
|
|
|
|
|
|
|
|
Cash and cash equivalents |
|
|
|
|
|
|
|
|
Other assets |
|
|
|
|
|
|
|
|
Total assets |
$ |
|
|
|
$ |
|
|
|
|
|
|
|
|
|
|
|
|
LIABILITIES AND CAPITAL |
|
|
|
|
|
|
|
|
Liabilities: |
|
|
|
|
|
|
|
|
Debt |
$ |
|
|
|
$ |
|
|
|
Accounts payable and accrued expenses |
|
|
|
|
|
|
|
|
Other liabilities |
|
|
|
|
|
|
|
|
Total liabilities |
|
|
|
|
|
|
|
|
|
|
|
|
|
|
|
|
|
Capital: |
|
|
|
|
|
|
|
|
Partners’ capital: |
|
|
|
|
|
|
|
|
General partner – preferred |
|
|
|
|
|
|
|
|
General partner – common |
|
|
|
|
|
|
|
|
Limited partners – common |
|
|
|
|
|
|
|
|
Limited partners – Class A common |
|
|
|
|
|
|
|
|
Total partners’ capital |
|
|
|
|
|
|
|
|
Noncontrolling interests |
|
|
|
|
|
|
|
|
Total capital |
|
|
|
|
|
|
|
|
Total liabilities and capital |
$ |
|
|
|
$ |
|
|
The accompanying notes are an integral part of these Consolidated Financial Statements.
6
PROLOGIS, L.P.
CONSOLIDATED STATEMENTS OF INCOME
(Unaudited)
(In thousands, except per unit amounts)
|
|
|
Three Months Ended |
|
|||||
|
|
|
March 31, |
|
|||||
|
|
|
2022 |
|
|
2021 |
|
||
|
Revenues: |
|
|
|
|
|
|
|
|
|
Rental |
|
$ |
|
|
|
$ |
|
|
|
Strategic capital |
|
|
|
|
|
|
|
|
|
Development management and other |
|
|
|
|
|
|
|
|
|
Total revenues |
|
|
|
|
|
|
|
|
|
Expenses: |
|
|
|
|
|
|
|
|
|
Rental |
|
|
|
|
|
|
|
|
|
Strategic capital |
|
|
|
|
|
|
|
|
|
General and administrative |
|
|
|
|
|
|
|
|
|
Depreciation and amortization |
|
|
|
|
|
|
|
|
|
Other |
|
|
|
|
|
|
|
|
|
Total expenses |
|
|
|
|
|
|
|
|
|
|
|
|
|
|
|
|
|
|
|
Operating income before gains on real estate transactions, net |
|
|
|
|
|
|
|
|
|
Gains on dispositions of development properties and land, net |
|
|
|
|
|
|
|
|
|
Gains on other dispositions of investments in real estate, net |
|
|
|
|
|
|
|
|
|
Operating income |
|
|
|
|
|
|
|
|
|
|
|
|
|
|
|
|
|
|
|
Other income (expense): |
|
|
|
|
|
|
|
|
|
Earnings from unconsolidated entities, net |
|
|
|
|
|
|
|
|
|
Interest expense |
|
|
( |
) |
|
|
( |
) |
|
Interest and other income, net |
|
|
|
|
|
|
|
|
|
Foreign currency and derivative gains, net |
|
|
|
|
|
|
|
|
|
Losses on early extinguishment of debt, net |
|
|
( |
) |
|
|
( |
) |
|
Total other income (expense) |
|
|
|
|
|
|
( |
) |
|
Earnings before income taxes |
|
|
|
|
|
|
|
|
|
Income tax expense |
|
|
( |
) |
|
|
( |
) |
|
Consolidated net earnings |
|
|
|
|
|
|
|
|
|
Less net earnings attributable to noncontrolling interests |
|
|
|
|
|
|
|
|
|
Net earnings attributable to controlling interests |
|
|
|
|
|
|
|
|
|
Less preferred unit distributions |
|
|
|
|
|
|
|
|
|
Net earnings attributable to common unitholders |
|
$ |
|
|
|
$ |
|
|
|
|
|
|
|
|
|
|
|
|
|
Weighted average common units outstanding – Basic |
|
|
|
|
|
|
|
|
|
Weighted average common units outstanding – Diluted |
|
|
|
|
|
|
|
|
|
|
|
|
|
|
|
|
|
|
|
Net earnings per unit attributable to common unitholders – Basic |
|
$ |
|
|
|
$ |
|
|
|
|
|
|
|
|
|
|
|
|
|
Net earnings per unit attributable to common unitholders – Diluted |
|
$ |
|
|
|
$ |
|
|
The accompanying notes are an integral part of these Consolidated Financial Statements.
7
PROLOGIS, L.P.
CONSOLIDATED STATEMENTS OF COMPREHENSIVE INCOME
(Unaudited)
(In thousands)
|
|
|
Three Months Ended |
|
|||||
|
|
|
March 31, |
|
|||||
|
|
|
2022 |
|
|
2021 |
|
||
|
Consolidated net earnings |
|
$ |
|
|
|
$ |
|
|
|
Other comprehensive income (loss): |
|
|
|
|
|
|
|
|
|
Foreign currency translation gains, net |
|
|
|
|
|
|
|
|
|
Unrealized gains on derivative contracts, net |
|
|
|
|
|
|
|
|
|
Comprehensive income |
|
|
|
|
|
|
|
|
|
Net earnings attributable to noncontrolling interests |
|
|
( |
) |
|
|
( |
) |
|
Other comprehensive loss (income) attributable to noncontrolling interests |
|
|
( |
) |
|
|
|
|
|
Comprehensive income attributable to common unitholders |
|
$ |
|
|
|
$ |
|
|
|
|
|
|
|
|
|
|
|
|
The accompanying notes are an integral part of these Consolidated Financial Statements.
8
PROLOGIS, L.P.
CONSOLIDATED STATEMENTS OF CAPITAL
(Unaudited)
(In thousands)
Three Months Ended March 31, 2022 and 2021
|
|
General Partner |
|
|
Limited Partners |
|
|
Non- |
|
|
|
|
|
|||||||||||||||||||||||||||
|
|
Preferred |
|
|
Common |
|
|
Common |
|
|
Class A Common |
|
|
controlling |
|
|
Total |
|
||||||||||||||||||||||
|
|
Units |
|
|
Amount |
|
|
Units |
|
|
Amount |
|
|
Units |
|
|
Amount |
|
|
Units |
|
|
Amount |
|
|
Interests |
|
|
Capital |
|
||||||||||
|
Balance at January 1, 2022 |
|
|
|
|
$ |
|
|
|
|
|
|
|
$ |
|
|
|
|
|
|
|
$ |
|
|
|
|
|
|
|
$ |
|
|
|
$ |
|
|
|
$ |
|
|
|
Consolidated net earnings |
|
- |
|
|
|
- |
|
|
|
- |
|
|
|
|
|
|
|
- |
|
|
|
|
|
|
|
- |
|
|
|
|
|
|
|
|
|
|
|
|
|
|
Effect of equity compensation plans |
|
- |
|
|
|
- |
|
|
|
|
|
|
|
|
|
|
|
|
|
|
|
|
|
|
|
- |
|
|
|
- |
|
|
|
- |
|
|
|
|
|
|
Capital contributions |
|
- |
|
|
|
- |
|
|
|
- |
|
|
|
- |
|
|
|
- |
|
|
|
- |
|
|
|
- |
|
|
|
- |
|
|
|
|
|
|
|
|
|
|
Redemption of limited partners units |
|
- |
|
|
|
- |
|
|
|
|
|
|
|
|
|
|
|
( |
) |
|
|
( |
) |
|
|
- |
|
|
|
- |
|
|
|
- |
|
|
|
( |
) |
|
Foreign currency translation gains, net |
|
- |
|
|
|
- |
|
|
|
- |
|
|
|
|
|
|
|
- |
|
|
|
|
|
|
|
- |
|
|
|
|
|
|
|
|
|
|
|
|
|
|
Unrealized gains on derivative contracts, net |
|
- |
|
|
|
- |
|
|
|
- |
|
|
|
|
|
|
|
- |
|
|
|
|
|
|
|
- |
|
|
|
|
|
|
|
- |
|
|
|
|
|
|
Reallocation of capital |
|
- |
|
|
|
- |
|
|
|
- |
|
|
|
( |
) |
|
|
- |
|
|
|
|
|
|
|
- |
|
|
|
( |
) |
|
|
- |
|
|
|
- |
|
|
Distributions ($ |
|
- |
|
|
|
- |
|
|
|
- |
|
|
|
( |
) |
|
|
- |
|
|
|
( |
) |
|
|
- |
|
|
|
( |
) |
|
|
( |
) |
|
|
( |
) |
|
Balance at March 31, 2022 |
|
|
|
|
$ |
|
|
|
|
|
|
|
$ |
|
|
|
|
|
|
|
$ |
|
|
|
|
|
|
|
$ |
|
|
|
$ |
|
|
|
$ |
|
|
|
|
|
|
|
|
|
|
|
|
|
|
|
|
|
|
|
|
|
|
|
|
|
|
|
|
|
|
|
|
|
|
|
|
|
|
|
|
|
|
|
|
|
General Partner |
|
|
Limited Partners |
|
|
Non- |
|
|
|
|
|
|||||||||||||||||||||||||||
|
|
Preferred |
|
|
Common |
|
|
Common |
|
|
Class A Common |
|
|
controlling |
|
|
Total |
|
||||||||||||||||||||||
|
|
Units |
|
|
Amount |
|
|
Units |
|
|
Amount |
|
|
Units |
|
|
Amount |
|
|
Units |
|
|
Amount |
|
|
Interests |
|
|
Capital |
|
||||||||||
|
Balance at January 1, 2021 |
|
|
|
|
$ |
|
|
|
|
|
|
|
$ |
|
|
|
|
|
|
|
$ |
|
|
|
|
|
|
|
$ |
|
|
|
$ |
|
|
|
$ |
|
|
|
Consolidated net earnings |
|
- |
|
|
|
- |
|
|
|
- |
|
|
|
|
|
|
|
- |
|
|
|
|
|
|
|
- |
|
|
|
|
|
|
|
|
|
|
|
|
|
|
Effect of equity compensation plans |
|
- |
|
|
|
- |
|
|
|
|
|
|
|
|
|
|
|
|
|
|
|
|
|
|
|
- |
|
|
|
- |
|
|
|
- |
|
|
|
|
|
|
Capital contributions |
|
- |
|
|
|
- |
|
|
|
- |
|
|
|
- |
|
|
|
- |
|
|
|
- |
|
|
|
- |
|
|
|
- |
|
|
|
|
|
|
|
|
|
|
Redemption of limited partners units |
|
- |
|
|
|
- |
|
|
|
|
|
|
|
|
|
|
|
( |
) |
|
|
( |
) |
|
|
- |
|
|
|
- |
|
|
|
- |
|
|
|
( |
) |
|
Foreign currency translation gains (losses), net |
|
- |
|
|
|
- |
|
|
|
- |
|
|
|
|
|
|
|
- |
|
|
|
|
|
|
|
- |
|
|
|
|
|
|
|
( |
) |
|
|
|
|
|
Unrealized gains on derivative contracts, net |
|
- |
|
|
|
- |
|
|
|
- |
|
|
|
|
|
|
|
- |
|
|
|
|
|
|
|
- |
|
|
|
|
|
|
|
- |
|
|
|
|
|
|
Reallocation of capital |
|
- |
|
|
|
- |
|
|
|
- |
|
|
|
( |
) |
|
|
- |
|
|
|
|
|
|
|
- |
|
|
|
|
|
|
|
- |
|
|
|
- |
|
|
Distributions ($ |
|
- |
|
|
|
- |
|
|
|
- |
|
|
|
( |
) |
|
|
- |
|
|
|
( |
) |
|
|
- |
|
|
|
( |
) |
|
|
( |
) |
|
|
( |
) |
|
Balance at March 31, 2021 |
|
|
|
|
$ |
|
|
|
|
|
|
|
$ |
|
|
|
|
|
|
|
$ |
|
|
|
|
|
|
|
$ |
|
|
|
$ |
|
|
|
$ |
|
|
|
|
|
|
|
|
|
|
|
|
|
|
|
|
|
|
|
|
|
|
|
|
|
|
|
|
|
|
|
|
|
|
|
|
|
|
|
|
|
|
|
The accompanying notes are an integral part of these Consolidated Financial Statements.
9
PROLOGIS, L.P.
CONSOLIDATED STATEMENTS OF CASH FLOWS
(Unaudited)
(In thousands)
|
|
|
Three Months Ended |
|
|||||
|
|
|
March 31, |
|
|||||
|
|
|
2022 |
|
|
2021 |
|
||
|
Operating activities: |
|
|
|
|
|
|
|
|
|
Consolidated net earnings |
|
$ |
|
|
|
$ |
|
|
|
Adjustments to reconcile net earnings to net cash provided by operating activities: |
|
|
|
|
|
|
|
|
|
Straight-lined rents and amortization of above and below market leases |
|
|
( |
) |
|
|
( |
) |
|
Equity-based compensation awards |
|
|
|
|
|
|
|
|
|
Depreciation and amortization |
|
|
|
|
|
|
|
|
|
Earnings from unconsolidated entities, net |
|
|
( |
) |
|
|
( |
) |
|
Operating distributions from unconsolidated entities |
|
|
|
|
|
|
|
|
|
Decrease (increase) in operating receivables from unconsolidated entities |
|
|
( |
) |
|
|
|
|
|
Amortization of debt discounts and debt issuance costs, net |
|
|
|
|
|
|
|
|
|
Gains on dispositions of development properties and land, net |
|
|
( |
) |
|
|
( |
) |
|
Gains on other dispositions of investments in real estate, net |
|
|
( |
) |
|
|
( |
) |
|
Unrealized foreign currency and derivative gains, net |
|
|
( |
) |
|
|
( |
) |
|
Losses on early extinguishment of debt, net |
|
|
|
|
|
|
|
|
|
Deferred income tax expense |
|
|
|
|
|
|
|
|
|
Decrease in accounts receivable and other assets |
|
|
|
|
|
|
|
|
|
Decrease in accounts payable and accrued expenses and other liabilities |
|
|
( |
) |
|
|
( |
) |
|
Net cash provided by operating activities |
|
|
|
|
|
|
|
|
|
Investing activities: |
|
|
|
|
|
|
|
|
|
Real estate development |
|
|
( |
) |
|
|
( |
) |
|
Real estate acquisitions |
|
|
( |
) |
|
|
( |
) |
|
Tenant improvements and lease commissions on previously leased space |
|
|
( |
) |
|
|
( |
) |
|
Property improvements |
|
|
( |
) |
|
|
( |
) |
|
Proceeds from dispositions and contributions of real estate |
|
|
|
|
|
|
|
|
|
Investments in and advances to unconsolidated entities |
|
|
( |
) |
|
|
( |
) |
|
Return of investment from unconsolidated entities |
|
|
|
|
|
|
|
|
|
Proceeds from the settlement of net investment hedges |
|
|
|
|
|
|
|
|
|
Payments on the settlement of net investment hedges |
|
|
( |
) |
|
|
( |
) |
|
Net cash provided by (used in) investing activities |
|
|
|
|
|
|
( |
) |
|
Financing activities: |
|
|
|
|
|
|
|
|
|
Proceeds from issuance of common partnership units in exchange for contributions from Prologis, Inc. |
|
|
|
|
|
|
|
|
|
Distributions paid on common and preferred units |
|
|
( |
) |
|
|
( |
) |
|
Noncontrolling interests contributions |
|
|
|
|
|
|
|
|
|
Noncontrolling interests distributions |
|
|
( |
) |
|
|
( |
) |
|
Redemption of common limited partnership units |
|
|
( |
) |
|
|
( |
) |
|
Tax paid with shares of the Parent withheld |
|
|
( |
) |
|
|
( |
) |
|
Debt and equity issuance costs paid |
|
|
( |
) |
|
|
( |
) |
|
Net payments on credit facilities |
|
|
( |
) |
|
|
( |
) |
|
Repurchase of and payments on debt |
|
|
( |
) |
|
|
( |
) |
|
Proceeds from the issuance of debt |
|
|
|
|
|
|
|
|
|
Net cash provided by (used in) financing activities |
|
|
|
|
|
|
( |
) |
|
|
|
|
|
|
|
|
|
|
|
Effect of foreign currency exchange rate changes on cash |
|
|
( |
) |
|
|
( |
) |
|
Net increase in cash and cash equivalents |
|
|
|
|
|
|
|
|
|
Cash and cash equivalents, beginning of period |
|
|
|
|
|
|
|
|
|
Cash and cash equivalents, end of period |
|
$ |
|
|
|
$ |
|
|
See Note 11 for information on noncash investing and financing activities and other information.
The accompanying notes are an integral part of these Consolidated Financial Statements.
10
PROLOGIS, INC. AND PROLOGIS, L.P.
NOTES TO THE CONSOLIDATED FINANCIAL STATEMENTS
(Unaudited)
NOTE 1. GENERAL
Business. Prologis, Inc. (or the “Parent”) commenced operations as a fully integrated real estate company in 1997, elected to be taxed as a real estate investment trust (“REIT”) under the Internal Revenue Code of 1986, as amended (the “Internal Revenue Code” or “IRC”), and believes the current organization and method of operation will enable it to maintain its status as a REIT. The Parent is the general partner of Prologis, L.P. (or the “Operating Partnership” or “OP”). Through the OP, we are engaged in the ownership, acquisition, development and management of logistics facilities with a focus on key markets in 19 countries on four continents. We invest in real estate through wholly owned subsidiaries and other entities through which we co-invest with partners and investors. We maintain a significant level of ownership in these co-investment ventures, which may be consolidated or unconsolidated based on our level of control of the entity. Our current business strategy consists of
For each share of preferred or common stock the Parent issues, the OP issues a corresponding preferred or common partnership unit, as applicable, to the Parent in exchange for the contribution of the proceeds from the stock issuance. At March 31, 2022, the Parent owned a
As the sole general partner of the OP, the Parent has complete responsibility and discretion in the day-to-day management and control of the OP and we operate the Parent and the OP as one enterprise. The management of the Parent consists of the same members as the management of the OP. These members are officers of the Parent and employees of the OP or one of its subsidiaries. As general partner with control of the OP, the Parent is the primary beneficiary and therefore consolidates the OP. Because the Parent’s only significant asset is its investment in the OP, the assets and liabilities of the Parent and the OP are the same on their respective financial statements.
Basis of Presentation. The accompanying Consolidated Financial Statements are prepared in accordance with United States (“U.S.”) generally accepted accounting principles (“GAAP”) and are presented in our reporting currency, the U.S. dollar. Intercompany transactions with consolidated entities have been eliminated.
The accompanying unaudited interim financial information has been prepared according to the rules and regulations of the U.S. Securities and Exchange Commission (“SEC”). Certain information and note disclosures normally included in our annual financial statements prepared in accordance with GAAP have been condensed or omitted in accordance with such rules and regulations. Our management believes that the disclosures presented in these financial statements are adequate to make the information presented not misleading. In our opinion, all adjustments and eliminations, consisting only of normal recurring adjustments, necessary to present fairly the financial position and results of operations for both the Parent and the OP for the reported periods have been included. The results of operations for such interim periods are not necessarily indicative of the results for the full year. The accompanying unaudited interim financial information should be read in conjunction with our Annual Report on Form 10-K for the year ended December 31, 2021, as filed with the SEC, and other public information.
Accounting Pronouncements.
Reference Rate Reform. In March 2020, the Financial Accounting Standards Board issued an Accounting Standard Update (“ASU”) that provided practical expedients to address existing guidance on contract modifications and hedge accounting due to the expected market transition from the London Inter-bank Offered Rate (“LIBOR”) and other interbank offered rates (together “IBORs”) to alternative reference rates, such as the Secured Overnight Financing Rate. We refer to this transition as “reference rate reform.” The ASU was effective upon issuance on a prospective basis beginning January 1, 2020, and we elected to adopt the ASU over time as our reference rate reform activities occurred.
In March 2021, the Financial Conduct Authority formally announced that the publication of LIBOR was ending and confirmed that U.S. dollar LIBOR-indexed rates would cease to be published after June 30, 2023. At March 31, 2022, our aggregate lender commitments in U.S. dollar on our global senior credit facilities remain indexed to U.S. dollar LIBOR. We anticipate modifications to these facilities prior to June 30, 2023, to not have a material impact on our Consolidated Financial Statements. We do not anticipate modifying any derivative financial instruments, as none are impacted by this ASU at March 31, 2022.
11
NOTE 2. REAL ESTATE
Investments in real estate properties consisted of the following (dollars and square feet in thousands):
|
|
Square Feet |
|
|
Number of Buildings |
|
|
|
|
||||||||||||||
|
|
Mar 31, |
|
|
Dec 31, |
|
|
Mar 31, |
|
|
Dec 31, |
|
|
Mar 31, |
|
Dec 31, |
|
||||||
|
|
2022 |
|
|
2021 |
|
|
2022 |
|
|
2021 |
|
|
2022 |
|
2021 |
|
||||||
|
Operating properties: |
|
|
|
|
|
|
|
|
|
|
|
|
|
|
|
|
|
|
|
|
|
|
|
Buildings and improvements |
|
|
|
|
|
|
|
|
|
|
|
|
|
|
|
|
$ |
|
|
$ |
|
|
|
Improved land |
|
|
|
|
|
|
|
|
|
|
|
|
|
|
|
|
|
|
|
|
|
|
|
Development portfolio, including land costs: |
|
|
|
|
|
|
|
|
|
|
|
|
|
|
|
|
|
|
|
|
|
|
|
Prestabilized |
|
|
|
|
|
|
|
|
|
|
|
|
|
|
|
|
|
|
|
|
|
|
|
Properties under development |
|
|
|
|
|
|
|
|
|
|
|
|
|
|
|
|
|
|
|
|
|
|
|
Land (1) |
|
|
|
|
|
|
|
|
|
|
|
|
|
|
|
|
|
|
|
|
|
|
|
Other real estate investments (2) |
|
|
|
|
|
|
|
|
|
|
|
|
|
|
|
|
|
|
|
|
|
|
|
Total investments in real estate properties |
|
|
|
|
|
|
|
|
|
|
|
|
|
|
|
|
|
|
|
|
|
|
|
Less accumulated depreciation |
|
|
|
|
|
|
|
|
|
|
|
|
|
|
|
|
|
|
|
|
|
|
|
Net investments in real estate properties |
|
|
|
|
|
|
|
|
|
|
|
|
|
|
|
|
$ |
|
|
$ |
|
|
|
|
|
|
|
|
|
|
|
|
|
|
|
|
|
|
|
|
|
|
|
|
|
|
|
(1) |
|
|
(2) |
Included in other real estate investments were: (i) non-strategic real estate assets acquired that we do not intend to operate long-term; (ii) land parcels we own and lease to third parties; (iii) non-industrial real estate assets that we intend to redevelop into industrial properties; and (iv) costs associated with potential acquisitions and future development projects, including purchase options on land. |
Acquisitions
The following table summarizes our real estate acquisition activity (dollars and square feet in thousands):
|
|
|
Three Months Ended March 31, |
|
|||||
|
|
|
2022 |
|
|
2021 |
|
||
|
Number of operating properties |
|
|
|
|
|
|
|
|
|
Square feet |
|
|
|
|
|
|
|
|
|
Acquisition cost of net investments in real estate, excluding land and other real estate investments |
|
$ |
|
|
|
$ |
|
|
|
|
|
|
|
|
|
|
|
|
|
Acres of land |
|
|
|
|
|
|
|
|
|
Acquisition cost of land |
|
$ |
|
|
|
$ |
|
|
|
|
|
|
|
|
|
|
|
|
|
Acquisition cost of other real estate investments |
|
$ |
|
|
|
$ |
|
|
12
Dispositions
The following table summarizes our dispositions of net investments in real estate which include contributions to unconsolidated co-investment ventures and dispositions to third parties (dollars and square feet in thousands):
|
|
|
Three Months Ended March 31, |
|
|||||
|
|
|
2022 |
|
|
2021 |
|
||
|
Dispositions of development properties and land, net (1) |
|
|
|
|
|
|
|
|
|
Number of properties |
|
|
|
|
|
|
|
|
|
Square feet |
|
|
|
|
|
|
|
|
|
Net proceeds |
|
$ |
|
|
|
$ |
|
|
|
Gains on dispositions of development properties and land, net |
|
$ |
|
|
|
$ |
|
|
|
|
|
|
|
|
|
|
|
|
|
Other dispositions of investments in real estate, net |
|
|
|
|
|
|
|
|
|
Number of properties |
|
|
|
|
|
|
|
|
|
Square feet |
|
|
|
|
|
|
|
|
|
Net proceeds |
|
$ |
|
|
|
$ |
|
|
|
Gains on other dispositions of investments in real estate, net |
|
$ |
|
|
|
$ |
|
|
|
(1) |
|
Leases
We recognized lease right-of-use assets of $
NOTE 3. UNCONSOLIDATED ENTITIES
Summary of Investments
We have investments in entities through a variety of ventures. We co-invest in entities that own multiple properties with partners and investors and we provide asset management and property management services to these entities, which we refer to as co-investment ventures. These entities may be consolidated or unconsolidated depending on the structure, our partner’s participation and other rights and our level of control of the entity. This note details our investments in unconsolidated co-investment ventures, which are related parties and accounted for using the equity method of accounting. See Note 6 for more detail regarding our consolidated investments that are not wholly owned.
We also have investments in other ventures, generally with one partner, which we account for using the equity method. We refer to our investments in both unconsolidated co-investment ventures and other ventures, collectively, as unconsolidated entities.
The following table summarizes our investments in and advances to unconsolidated entities (in thousands):
|
|
|
March 31, |
|
|
December 31, |
|
||
|
|
|
2022 |
|
|
2021 |
|
||
|
Unconsolidated co-investment ventures |
|
$ |
|
|
|
$ |
|
|
|
Other ventures |
|
|
|
|
|
|
|
|
|
Total |
|
$ |
|
|
|
$ |
|
|
13
Unconsolidated Co-Investment Ventures
The following table summarizes the Strategic Capital Revenues we recognized in the Consolidated Statements of Income related to our unconsolidated co-investment ventures (in thousands):
|
|
|
Three Months Ended March 31, |
|
|||||
|
|
|
2022 |
|
|
2021 |
|
||
|
Recurring fees |
|
$ |
|
|
|
$ |
|
|
|
Transactional fees |
|
|
|
|
|
|
|
|
|
Promote revenue |
|
|
|
|
|
|
|
|
|
Total strategic capital revenues from unconsolidated co-investment ventures (1) |
|
$ |
|
|
|
$ |
|
|
|
(1) |
|
The following table summarizes the key property information, financial position and operating information of our unconsolidated co-investment ventures on a U.S. GAAP basis (not our proportionate share) and the amounts we recognized in the Consolidated Financial Statements related to these ventures (dollars and square feet in millions):
|
|
U.S. |
|
|
Other Americas (1) |
|
|
Europe |
|
|
Asia |
|
|
Total |
|
|||||||||||||||||||||||||
|
At: |
Mar 31, 2022 |
|
|
Dec 31, 2021 |
|
|
Mar 31, 2022 |
|
|
Dec 31, 2021 |
|
|
Mar 31, 2022 |
|
|
Dec 31, 2021 |
|
|
Mar 31, 2022 |
|
|
Dec 31, 2021 |
|
|
Mar 31, 2022 |
|
|
Dec 31, 2021 |
|
||||||||||
|
Key property information: |
|
|
|
|
|
|
|
|
|
|
|
|
|
|
|
|
|
|
|
|
|
|
|
|
|
|
|
|
|
|
|
|
|
|
|
|
|
|
|
|
Ventures |
|
|
|
|
|
|
|
|
|
|
|
|
|
|
|
|
|
|
|
|
|
|
|
|
|
|
|
|
|
|
|
|
|
|
|
|
|
|
|
|
Operating properties |
|
|
|
|
|
|
|
|
|
|
|
|
|
|
|
|
|
|
|
|
|
|
|
|
|
|
|
|
|
|
|
|
|
|
|
|
|
|
|
|
Square feet |
|
|
|
|
|
|
|
|
|
|
|
|
|
|
|
|
|
|
|
|
|
|
|
|
|
|
|
|
|
|
|
|
|
|
|
|
|
|
|
|
|
|
|
|
|
|
|
|
|
|
|
|
|
|
|
|
|
|
|
|
|
|
|
|
|
|
|
|
|
|
|
|
|
|
|
|
|
|
|
|
|
Financial position: |
|
|
|
|
|
|
|
|
|
|
|
|
|
|
|
|
|
|
|
|
|
|
|
|
|
|
|
|
|
|
|
|
|
|
|
|
|
|
|
|
Total assets ($) |
|
|
|
|
|
|
|
|
|
|
|
|
|
|
|
|
|
|
|
|
|
|
|
|
|
|
|
|
|
|
|
|
|
|
|
|
|
|
|
|
Third-party debt ($) |
|
|
|
|
|
|
|
|
|
|
|
|
|
|
|
|
|
|
|
|
|
|
|
|
|
|
|
|
|
|
|
|
|
|
|
|
|
|
|
|
Total liabilities ($) |
|
|
|
|
|
|
|
|
|
|
|
|
|
|
|
|
|
|
|
|
|
|
|
|
|
|
|
|
|
|
|
|
|
|
|
|
|
|
|
|
|
|
|
|
|
|
|
|
|
|
|
|
|
|
|
|
|
|
|
|
|
|
|
|
|
|
|
|
|
|
|
|
|
|
|
|
|
|
|
|
|
Our investment balance ($) (2) |
|
|
|
|
|
|
|
|
|
|
|
|
|
|
|
|
|
|
|
|
|
|
|
|
|
|
|
|
|
|
|
|
|
|
|
|
|
|
|
|
Our weighted average ownership (3) |
|
|
% |
|
|
|
% |
|
|
|
% |
|
|
|
% |
|
|
|
% |
|
|
|
% |
|
|
|
% |
|
|
|
% |
|
|
|
% |
|
|
|
% |
|
|
|
|
|
|
|
|
|
|
|
|
|
|
|
|
|
|
|
|
|
|
|
|
|
|
|
|
|
|
|
|
|
|
|
|
|
|
|
|
|
|
|
U.S. |
|
|
Other Americas (1) |
|
|
Europe |
|
|
Asia |
|
|
Total |
|
|||||||||||||||||||||||||
|
Operating Information: |
Mar 31, 2022 |
|
|
Mar 31, 2021 |
|
|
Mar 31, 2022 |
|
|
Mar 31, 2021 |
|
|
Mar 31, 2022 |
|
|
Mar 31, 2021 |
|
|
Mar 31, 2022 |
|
|
Mar 31, 2021 |
|
|
Mar 31, 2022 |
|
|
Mar 31, 2021 |
|
||||||||||
|
For the three months ended: |
|
|
|
|
|
|
|
|
|
|
|
|
|
|
|
|
|
|
|
|
|
|
|
|
|
|
|
|
|
|
|
|
|
|
|
|
|
|
|
|
Total revenues ($) |
|
|
|
|
|
|
|
|
|
|
|
|
|
|
|
|
|
|
|
|
|
|
|
|
|
|
|
|
|
|
|
|
|
|
|
|
|
|
|
|
Net earnings ($) |
|
|
|
|
|
|
|
|
|
|
|
|
|
|
|
|
|
|
|
|
|
|
|
|
|
|
|
|
|
|
|
|
|
|
|
|
|
|
|
|
|
|
|
|
|
|
|
|
|
|
|
|
|
|
|
|
|
|
|
|
|
|
|
|
|
|
|
|
|
|
|
|
|
|
|
|
|
|
|
|
|
Our earnings from unconsolidated co-investment ventures, net ($) |
|
|
|
|
|
|
|
|
|
|
|
|
|
|
|
|
|
|
|
|
|
|
|
|
|
|
|
|
|
|
|
|
|
|
|
|
|
|
|
|
(1) |
|
|
(2) |
Prologis’ investment balance is presented at our adjusted basis. The difference between our ownership interest of a venture’s equity and our investment balance at March 31, 2022 and December 31, 2021, results principally from four types of transactions: (i) deferred gains from the contribution of property to a venture prior to January 1, 2018; (ii) recording additional costs associated with our investment in the venture; (iii) receivables, principally for fees and promotes ($ |
|
(3) |
|
Equity Commitments Related to Certain Unconsolidated Co-Investment Ventures
At March 31, 2022, our outstanding equity commitments were $
14
NOTE 4. ASSETS HELD FOR SALE OR CONTRIBUTION
We had investments in certain real estate properties that met the criteria to be classified as held for sale or contribution at March 31, 2022 and December 31, 2021. At the time of classification, these properties were expected to be sold to third parties or were recently stabilized and expected to be contributed to unconsolidated co-investment ventures within twelve months. The amounts included in Assets Held for Sale or Contribution represented real estate investment balances and the related assets and liabilities.
Assets held for sale or contribution consisted of the following (dollars and square feet in thousands):
|
|
|
March 31, |
|
|
December 31, |
|
||
|
|
|
2022 |
|
|
2021 |
|
||
|
Number of operating properties |
|
|
|
|
|
|
|
|
|
Square feet |
|
|
|
|
|
|
|
|
|
Total assets held for sale or contribution |
|
$ |
|
|
|
$ |
|
|
|
Total liabilities associated with assets held for sale or contribution – included in Other Liabilities |
|
$ |
|
|
|
$ |
|
|
NOTE 5. DEBT
All debt is incurred by the OP or its consolidated subsidiaries. The following table summarizes our debt (dollars in thousands):
|
|
March 31, 2022 |
|
|
December 31, 2021 |
|
||||||||||||||||
|
|
Weighted Average |
|
|
Amount |
|
|
Weighted Average |
|
|
Amount |
|
||||||||||
|
|
Interest Rate (1) |
|
|
Term (2) |
|
|
Outstanding (3) |
|
|
Interest Rate (1) |
|
|
Term (2) |
|
|
Outstanding (3) |
|
||||
|
Credit facilities |
|
|
|
|
|
|
|
$ |
|
|
|
|
|
|
|
|
|
|
$ |
|
|
|
Senior notes |
|
|
|
|
|
|
|
|
|
|
|
|
|
|
|
|
|
|
|
|
|
|
Term loans and unsecured other |
|
|
|
|
|
|
|
|
|
|
|
|
|
|
|
|
|
|
|
|
|
|
Secured mortgage |
|
|
|
|
|
|
|
|
|
|
|
|
|
|
|
|
|
|
|
|
|
|
Total |
|
|
|
|
|
|
|
$ |
|
|
|
|
|
|
|
|
|
|
$ |
|
|
|
(1) |
The weighted average interest rates presented represent the effective interest rates (including amortization of debt issuance costs and noncash premiums or discounts) at the end of the period for the debt outstanding and include the impact of designated interest rate swaps, which effectively fix the interest rate on certain variable rate debt. |
|
(2) |
The weighted average term represents the remaining maturity in years on the debt outstanding at period end. |
|
(3) |
We borrow in the functional currencies of the countries where we invest. Included in the outstanding balances were borrowings denominated in the following currencies: |
|
|
|
|
March 31, 2022 |
|
|
December 31, 2021 |
|
||||||||||||||||||
|
|
|
|
Weighted Average Interest Rate |
|
|
Amount Outstanding |
|
|
% of Total |
|
|
Weighted Average Interest Rate |
|
|
Amount Outstanding |
|
|
% of Total |
|
||||||
|
|
British pound sterling |
|
|
|
% |
|
$ |
|
|
|
|
|
% |
|
|
|
% |
|
$ |
|
|
|
|
|
% |
|
|
Canadian dollar |
|
|
|
% |
|
|
|
|
|
|
|
% |
|
|
|
% |
|
|
|
|
|
|
|
% |
|
|
Euro |
|
|
|
% |
|
|
|
|
|
|
|
% |
|
|
|
% |
|
|
|
|
|
|
|
% |
|
|
Japanese yen |
|
|
|
% |
|
|
|
|
|
|
|
% |
|
|
|
% |
|
|
|
|
|
|
|
% |
|
|
U.S. dollar |
|
|
|
% |
|
|
|
|
|
|
|
% |
|
|
|
% |
|
|
|
|
|
|
|
% |
|
|
Total |
|
|
|
% |
|
$ |
|
|
|
|
|
% |
|
|
|
% |
|
$ |
|
|
|
|
|
% |
Credit Facilities
We have two global senior credit facilities, the 2019 Global Facility and the 2021 Global Facility. We may draw in British pounds sterling, Canadian dollars, euro, Japanese yen, Mexican pesos and U.S. dollars on a revolving basis up to $
We also have a Japanese yen revolver (the “Yen Credit Facility”) with total commitments of ¥
15
We refer to the 2019 Global Facility, the 2021 Global Facility and the Yen Credit Facility, collectively, as our “Credit Facilities.” Pricing for the Credit Facilities, including the spread over the applicable benchmark and the rates applicable to facility fees and letter of credit fees, varies based on the public debt ratings of the OP.
Liquidity
The following table summarizes information about our available liquidity at March 31, 2022 (in millions):
|
|
|
|
|
|
|
Aggregate lender commitments |
|
|
|
|
|
Credit Facilities |
|
$ |
|
|
|
Less: |
|
|
|
|
|
Borrowings outstanding |
|
|
|
|
|
Outstanding letters of credit |
|
|
|
|
|
Current availability |
|
$ |
|
|
|
Cash and cash equivalents |
|
|
|
|
|
Total liquidity |
|
$ |
|
|
Senior Notes
The following table summarizes the issuances of senior notes during the three months ended March 31, 2022 (principal in thousands):
|
|
|
Aggregate Principal |
|
|
Issuance Date Weighted Average |
|
|
|
||||||||||
|
Issuance Date |
|
Borrowing Currency |
|
|
USD (1) |
|
|
Interest Rate (2) |
|
|
Term (3) |
|
|
Maturity Dates |
||||
|
January |
|
£ |
|
|
|
$ |
|
|
|
|
|
|
|
|
|
|
|
|
|
February (4) |
|
€ |
|
|
|
$ |
|
|
|
|
|
|
|
|
|
|
|
|
|
Total |
|
|
|
|
|
$ |
|
|
|
|
|
|
|
|
|
|
|
|
|
|
|
|
|
|
|
|
|
|
|
|
|
|
|
|
|
|
|
|
|
(1) |
The exchange rate used to calculate into U.S. dollars was the spot rate at the settlement date. |
|
(2) |
The weighted average interest rate represents the fixed or variable interest rates of the related debt at the issuance date. |
|
(3) |
The weighted average term represents the remaining maturity in years on the related debt at the issuance date. |
|
(4) |
Net proceeds from the issuance of these notes were used to finance green projects eligible under our green bond framework, repay or refinance indebtedness and for general corporate purposes. |
Long-Term Debt Maturities
Scheduled principal payments due on our debt for the remainder of 2022 and for each year through the period ended December 31, 2026, and thereafter were as follows at March 31, 2022 (in thousands):
|
|
|
Unsecured |
|
|
|
|
|
|
|
|||||||
|
|
|
Senior |
|
|
Term Loans |
|
|
Secured |
|
|
|
|
|
|||
|
Maturity |
|
Notes |
|
|
and Other |
|
|
Mortgage |
|
|
Total |
|
||||
|
2022 (1) |
|
$ |
|
|
|
$ |
|
|
|
$ |
|
|
|
$ |
|
|
|
2023 (1) |
|
|
|
|
|
|
|
|
|
|
|
|
|
|
|
|
|
2024 |
|
|
|
|
|
|
|
|
|
|
|
|
|
|
|
|
|
2025 |
|
|
|
|
|
|
|
|
|
|
|
|
|
|
|
|
|
2026 |
|
|
|
|
|
|
|
|
|
|
|
|
|
|
|
|
|
Thereafter |
|
|
|
|
|
|
|
|
|
|
|
|
|
|
|
|
|
Subtotal |
|
|
|
|
|
|
|
|
|
|
|
|
|
|
|
|
|
Unamortized premiums (discounts), net |
|
|
( |
) |
|
|
|
|
|
|
|
|
|
|
|
|
|
Unamortized debt issuance costs, net |
|
|
( |
) |
|
|
( |
) |
|
|
( |
) |
|
|
( |
) |
|
Total |
|
$ |
|
|
|
$ |
|
|
|
$ |
|
|
|
$ |
|
|
16
|
(1) |
We expect to repay the amounts maturing in the |
Financial Debt Covenants
Our senior notes, term loans and Credit Facilities outstanding at March 31, 2022 were subject to certain financial covenants under their related documents. At March 31, 2022, we were in compliance with all of our financial debt covenants.
Guarantee of Finance Subsidiary Debt
We have finance subsidiaries as part of our operations in Europe (Prologis Euro Finance LLC), Japan (Prologis Yen Finance LLC) and the U.K. (Prologis Sterling Finance LLC) in order to mitigate our foreign currency risk by borrowing in the currencies in which we invest. These entities are
NOTE 6. NONCONTROLLING INTERESTS
Prologis, L.P.
We report noncontrolling interests related to several entities we consolidate but of which we do not own 100% of the equity. These entities include two real estate partnerships that have issued limited partnership units to third parties. Depending on the specific partnership agreements, these limited partnership units are redeemable for cash or, at our option, shares of the Parent’s common stock, generally at a rate of
Prologis, Inc.
The noncontrolling interests of the Parent include the noncontrolling interests described above for the OP, as well as the limited partnership units in the OP that are not owned by the Parent. The outstanding limited partnership units receive quarterly cash distributions equal to the quarterly dividends paid on our common stock pursuant to the terms of the applicable partnership agreements.
The following table summarizes these entities (dollars in thousands):
|
|
Our Ownership Percentage |
|
|
Noncontrolling Interests |
|
|
Total Assets |
|
|
Total Liabilities |
|
||||||||||||||||||||
|
|
Mar 31, 2022 |
|
|
Dec 31, 2021 |
|
|
Mar 31, 2022 |
|
|
Dec 31, 2021 |
|
|
Mar 31, 2022 |
|
|
Dec 31, 2021 |
|
|
Mar 31, 2022 |
|
|
Dec 31, 2021 |
|
||||||||
|
Prologis U.S. Logistics Venture |
|
|
% |
|
|
|
% |
|
$ |
|
|
|
$ |
|
|
|
$ |
|
|
|
$ |
|
|
|
$ |
|
|
|
$ |
|
|
|
Other consolidated entities (1) |
|
|
|
|
|
|
|
|
|
|
|
|
|
|
|
|
|
|
|
|
|
|
|
|
|
|
|
|
|
||
|
Prologis, L.P. |
|
|
|
|
|
|
|
|
|
|
|
|
|
|
|
|
|
|
|
|
|
|
|
|
|
|
|
|
|
|
|
|
Limited partners in Prologis, L.P. (2)(3) |
|
|
|
|
|
|
|
|
|
|
|
|
|
|
|
|
|
|
|
|
|
|
|
|
|
||||||
|
Prologis, Inc. |
|
|
|
|
|
|
|
|
$ |
|
|
|
$ |
|
|
|
$ |
|
|
|
$ |
|
|
|
$ |
|
|
|
$ |
|
|
|
|
|
|
|
|
|
|
|
|
|
|
|
|
|
|
|
|
|
|
|
|
|
|
|
|
|
|
|
|
|
|
|
|
(1) |
Includes |
|
(2) |
We had |
|
(3) |
There were limited partnership units in the OP, excluding the Class A Units, that were exchangeable into cash or, at our option, |
17
NOTE 7. LONG-TERM COMPENSATION
Equity-Based Compensation Plans and Programs
Prologis Outperformance Plan (“POP”)
We have allocated participation points or a percentage of the compensation pool to participants under our POP corresponding to performance periods beginning every January 1. The fair value of the awards is measured at the grant date and amortized over the period from the grant date to the date at which the awards vest, which ranges from
We granted participation points for the 2022 – 2024 performance period in January 2022, with a fair value of $
The Outperformance Hurdle was met for the 2019 – 2021 performance period, which resulted in awards of $
Other Equity-Based Compensation Plans and Programs
Our other equity-based compensation plans and programs include (i) the Prologis Promote Plan (“PPP”); (ii) the annual long-term incentive (“LTI”) equity award program (“Annual LTI Award”); and (iii) the annual bonus exchange program. Awards under these plans and programs may be issued in the form of restricted stock units (“RSUs”) or LTIP Units at the participant’s election. RSUs and LTIP Units are valued based on the market price of the Parent’s common stock on the date the award is granted and the grant date value is charged to compensation expense over the service period.
18
Summary of Award Activity
RSUs
The following table summarizes the activity for RSUs for the three months ended March 31, 2022 (units in thousands):
|
|
|
|
|
|
|
Weighted Average |
|
|
|
|
|
Unvested RSUs |
|
|
Grant Date Fair Value |
|
||
|
Balance at January 1, 2022 |
|
|
|
|
|
$ |
|
|
|
Granted |
|
|
|
|
|
|
|
|
|
Vested and distributed |
|
|
( |
) |
|
|
|
|
|
Forfeited |
|
|
( |
) |
|
|
|
|
|
Balance at March 31, 2022 |
|
|
|
|
|
$ |
|
|
LTIP Units
The following table summarizes the activity for LTIP Units for the three months ended March 31, 2022 (units in thousands):
|
|
|
Unvested |
|
|
Weighted Average |
|
||
|
|
|
LTIP Units |
|
|
Grant Date Fair Value |
|
||
|
Balance at January 1, 2022 |
|
|
|
|
|
$ |
|
|
|
Granted |
|
|
|
|
|
|
|
|
|
Vested LTIP Units |
|
|
( |
) |
|
|
|
|
|
Balance at March 31, 2022 |
|
|
|
|
|
$ |
|
|
NOTE 8. EARNINGS PER COMMON SHARE OR UNIT
We determine basic earnings per share or unit based on the weighted average number of shares of common stock or units outstanding during the period. We compute diluted earnings per share or unit based on the weighted average number of shares or units outstanding combined with the incremental weighted average effect from all outstanding potentially dilutive instruments.
The computation of our basic and diluted earnings per share and unit was as follows (in thousands, except per share and unit amounts):
|
|
|
Three Months Ended |
|
|||||
|
|
|
March 31, |
|
|||||
|
Prologis, Inc. |
|
2022 |
|
|
2021 |
|
||
|
Net earnings attributable to common stockholders – Basic |
|
$ |
|
|
|
$ |
|
|
|
Net earnings attributable to exchangeable limited partnership units (1) |
|
|
|
|
|
|
|
|
|
Adjusted net earnings attributable to common stockholders – Diluted |
|
$ |
|
|
|
$ |
|
|
|
|
|
|
|
|
|
|
|
|
|
Weighted average common shares outstanding – Basic |
|
|
|
|
|
|
|
|
|
Incremental weighted average effect on exchange of limited partnership units (1) |
|
|
|
|
|
|
|
|
|
Incremental weighted average effect of equity awards |
|
|
|
|
|
|
|
|
|
Weighted average common shares outstanding – Diluted (2) |
|
|
|
|
|
|
|
|
|
|
|
|
|
|
|
|
|
|
|
Net earnings per share attributable to common stockholders: |
|
|
|
|
|
|
|
|
|
Basic |
|
$ |
|
|
|
$ |
|
|
|
Diluted |
|
$ |
|
|
|
$ |
|
|
19
|
|
|
Three Months Ended |
|
|||||
|
|
|
March 31, |
|
|||||
|
Prologis, L.P. |
|
2022 |
|
|
2021 |
|
||
|
Net earnings attributable to common unitholders |
|
$ |
|
|
|
$ |
|
|
|
Net earnings attributable to Class A Units |
|
|
( |
) |
|
|
( |
) |
|
Net earnings attributable to common unitholders – Basic |
|
|
|
|
|
|
|
|
|
Net earnings attributable to Class A Units |
|
|
|
|
|
|
|
|
|
Net earnings attributable to exchangeable other limited partnership units |
|
|
|
|
|
|
|
|
|
Adjusted net earnings attributable to common unitholders – Diluted |
|
$ |
|
|
|
$ |
|
|
|
|
|
|
|
|
|
|
|
|
|
Weighted average common partnership units outstanding – Basic |
|
|
|
|
|
|
|
|
|
Incremental weighted average effect on exchange of Class A Units |
|
|
|
|
|
|
|
|
|
Incremental weighted average effect on exchange of other limited partnership units |
|
|
|
|
|
|
|
|
|
Incremental weighted average effect of equity awards of Prologis, Inc. |
|
|
|
|
|
|
|
|
|
Weighted average common units outstanding – Diluted (2) |
|
|
|
|
|
|
|
|
|
|
|
|
|
|
|
|
|
|
|
Net earnings per unit attributable to common unitholders: |
|
|
|
|
|
|
|
|
|
Basic |
|
$ |
|
|
|
$ |
|
|
|
Diluted |
|
$ |
|
|
|
$ |
|
|
|
(1) |
|
|
(2) |
|
|
|
|
|
Three Months Ended |
|
|||||
|
|
|
|
March 31, |
|
|||||
|
|
|
|
2022 |
|
|
2021 |
|
||
|
|
Class A Units |
|
|
|
|
|
|
|
|
|
|
Other limited partnership units |
|
|
|
|
|
|
|
|
|
|
Equity awards |
|
|
|
|
|
|
|
|
|
|
Prologis, L.P. |
|
|
|
|
|
|
|
|
|
|
Common limited partnership units |
|
|
|
|
|
|
|
|
|
|
Prologis, Inc. |
|
|
|
|
|
|
|
|
NOTE 9. FINANCIAL INSTRUMENTS AND FAIR VALUE MEASUREMENTS
Derivative Financial Instruments
In the normal course of business, our operations are exposed to market risks, including the effect of changes in foreign currency exchange rates and interest rates. We may enter into derivative financial instruments to offset these underlying market risks. There have been no significant changes in our policy or strategy from what was disclosed in our Annual Report on Form 10-K for the year ended December 31, 2021.
20
The following table presents the fair value of our derivative financial instruments recognized within Other Assets and Other Liabilities on the Consolidated Balance Sheets (in thousands):
|
|
|
March 31, 2022 |
|
|
December 31, 2021 |
|
||||||||||
|
|
|
Asset |
|
|
Liability |
|
|
Asset |
|
|
Liability |
|
||||
|
Undesignated derivatives |
|
|
|
|
|
|
|
|
|
|
|
|
|
|
|
|
|
Foreign currency contracts |
|
|
|
|
|
|
|
|
|
|
|
|
|
|
|
|
|
Forwards |
|
|
|
|
|
|
|
|
|
|
|
|
|
|
|
|
|
Brazilian real |
|
$ |
|
|
|
$ |
|
|
|
$ |
|
|
|
$ |
|
|
|
British pound sterling |
|
|
|
|
|
|
|
|
|
|
|
|
|
|
|
|
|
Canadian dollar |
|
|
|
|
|
|
|
|
|
|
|
|
|
|
|
|
|
Chinese renminbi |
|
|
|
|
|
|
|
|
|
|
|
|
|
|
|
|
|
Euro |
|
|
|
|
|
|
|
|
|
|
|
|
|
|
|
|
|
Japanese yen |
|
|
|
|
|
|
|
|
|
|
|
|
|
|
|
|
|
Swedish krona |
|
|
|
|
|
|
|
|
|
|
|
|
|
|
|
|
|
|
|
|
|
|
|
|
|
|
|
|
|
|
|
|
|
|
|
Designated derivatives |
|
|
|
|
|
|
|
|
|
|
|
|
|
|
|
|
|
Foreign currency contracts |
|
|
|
|
|
|
|
|
|
|
|
|
|
|
|
|
|
Net investment hedges |
|
|
|
|
|
|
|
|
|
|
|
|
|
|
|
|
|
British pound sterling |
|
|
|
|
|
|
|
|
|
|
|
|
|
|
|
|
|
Canadian dollar |
|
|
|
|
|
|
|
|
|
|
|
|
|
|
|
|
|
|
|
|
|
|
|
|
|
|
|
|
|
|
|
|
|
|
|
Interest rate swaps |
|
|
|
|
|
|
|
|
|
|
|
|
|
|
|
|
|
Cash flow hedges |
|
|
|
|
|
|
|
|
|
|
|
|
|
|
|
|
|
Euro |
|
|
|
|
|
|
|
|
|
|
|
|
|
|
|
|
|
Total fair value of derivatives |
|
$ |
|
|
|
$ |
|
|
|
$ |
|
|
|
$ |
|
|
|
|
|
|
|
|
|
|
|
|
|
|
|
|
|
|
|
|
Undesignated Derivative Financial Instruments
Foreign Currency Contracts
The following table summarizes the activity of our undesignated foreign currency contracts for the three months ended March 31 (in millions, except for weighted average forward rates and number of active contracts):
|
|
2022 |
|
|
2021 |
|
||||||||||||||||||||||||||||||||||||||||||||||||||
|
|
CAD |
|
|
EUR |
|
|
GBP |
|
|
JPY |
|
|
SEK |
|
|
Other |
|
|
Total |
|
|
CAD |
|
|
EUR |
|
|
GBP |
|
|
JPY |
|
|
SEK |
|
|
Other |
|
|
Total |
|
||||||||||||||
|
Notional amounts at January 1 ($) |
|
|
|
|
|
|
|
|
|
|
|
|
|
|
|
|
|
|
|
|
|
|
|
|
|
|
|
|
|
|
|
|
|
|
|
|
|
|
|
|
|
|
|
|
|
|
|
|
|
|
|
|
|
|
|
|
New contracts ($) |
|
|
|
|
|
|
|
|
|
( |
) |
|
|
|
|
|
|
|
|
|
|
|
|
|
|
|
|
|
|
|
|
|
|
|
|
|
|
|
|
|
|
|
|
|
|
|
|
|
|
|
|
|
|
|
|
|
Matured, expired or settled contracts ($) |
|
( |
) |
|
|
( |
) |
|
|
( |
) |
|
|
( |
) |
|
|
( |
) |
|
|
( |
) |
|
|
( |
) |
|
|
( |
) |
|
|
( |
) |
|
|
( |
) |
|
|
( |
) |
|
|
( |
) |
|
|
( |
) |
|
|
( |
) |
|
Notional amounts at March 31 ($) |
|
|
|
|
|
|
|
|
|
|
|
|
|
|
|
|
|
|
|
|
|
|
|
|
|
|
|
|
|
|
|
|
|
|
|
|
|
|
|
|
|
|
|
|
|
|
|
|
|
|
|
|
|
|
|
|
|
|
|
|
|
|
|
|
|
|
|
|
|
|
|
|
|
|
|
|
|
|
|
|
|
|
|
|
|
|
|
|
|
|
|
|
|
|
|
|
|
|
|
|
|
|
|
|
|
|
|
|
|
|
|
|
|
Weighted average forward rate at March 31 |
|
|
|
|
|
|
|
|
|
|
|
|
|
|
|
|
|
|
|
|
|
|
|
|
|
|
|
|
|
|
|
|
|
|
|
|
|
|
|
|
|
|
|
|
|
|
|
|
|
|
|
|
|
|
|
|
Active contracts at March 31 |
|
|
|
|
|
|
|
|
|
|
|
|
|
|
|
|
|
|
|
|
|
|
|
|
|
|
|
|
|
|
|
|
|
|
|
|
|
|
|
|
|
|
|
|
|
|
|
|
|
|
|
|
|
|
|
The following table summarizes the undesignated derivative financial instruments exercised and associated realized and unrealized gains (losses) in Foreign Currency and Derivative Gains, Net in the Consolidated Statements of Income (in millions, except for number of exercised contracts):
|
|
|
Three Months Ended |
|
|||||
|
|
|
March 31, |
|
|||||
|
|
|
2022 |
|
|
2021 |
|
||
|
Exercised contracts |
|
|
|
|
|
|
|
|
|
Realized gains (losses) on the matured, expired or settled contracts |
|
$ |
|
|
|
$ |
( |
) |
|
Unrealized gains on the change in fair value of outstanding contracts |
|
$ |
|
|
|
$ |
|
|
21
Designated Derivative Financial Instruments
Changes in the fair value of derivatives that are designated as net investment hedges of our foreign operations and cash flow hedges are recorded in Accumulated Other Comprehensive Income (Loss) (“AOCI/L”) and reflected within the Other Comprehensive Income (Loss) table below.
Foreign Currency Contracts
The following table summarizes the activity of our foreign currency contracts designated as net investment hedges for the three months ended March 31 (in millions, except for weighted average forward rates and number of active contracts):
|
|
|
2022 |
|
|
2021 |
|
||||||||||||||||||||||
|
|
|
BRL |
|
|
CAD |
|
|
GBP |
|
|
Total |
|
|
CAD |
|
|
GBP |
|
|
Total |
|
|||||||
|
Notional amounts at January 1 ($) |
|
|
|
|
|
|
|
|
|
|
|
|
|
|
|
|
|
|
|
|
|
|
|
|
|
|
|
|
|
New contracts ($) |
|
|
|
|
|
|
|
|
|
|
|
|
|
|
|
|
|
|
|
|
|
|
|
|
|
|
|
|
|
Matured, expired or settled contracts ($) |
|
|
( |
) |
|
|
( |
) |
|
|
( |
) |
|
|
( |
) |
|
|
( |
) |
|
|
|
|
|
|
( |
) |
|
Notional amounts at March 31 ($) |
|
|
|
|
|
|
|
|
|
|
|
|
|
|
|
|
|
|
|
|
|
|
|
|
|
|
|
|
|
|
|
|
|
|
|
|
|
|
|
|
|
|
|
|
|
|
|
|
|
|
|
|
|
|
|
|
|
|
|
Weighted average forward rate at March 31 |
|
|
|
|
|
|
|
|
|
|
|
|
|
|
|
|
|
|
|
|
|
|
|
|
|
|
|
|
|
Active contracts at March 31 |
|
|
|
|
|
|
|
|
|
|
|
|
|
|
|
|
|
|
|
|
|
|
|
|
|
|
|
|
Interest Rate Swaps
The following table summarizes the activity of our interest rate swaps designated as cash flow hedges for the three months ended March 31 (in millions):
|
|
|
2022 |
|
|
2021 |
|
|
||||||||||||||
|
|
|
EUR |
|
|
Total |
|
|
EUR |
|
|
USD |
|
|
Total |
|
|
|||||
|
Notional amounts at January 1 ($) |
|
|
|
|
|
|
|
|
|
|
|
|
|
|
|
|
|
|
|
|
|
|
New contracts ($) |
|
|
|
|
|
|
|
|
|
|
|
|
|
|
|
|
|
|
|
|
|
|
Matured, expired or settled contracts ($) |
|
|
( |
) |
|
|
( |
) |
|
|
|
|
|
|
|
|
|
|
|
|
|
|
Notional amounts at March 31 ($) |
|
|
|
|
|
|
|
|
|
|
|
|
|
|
|
|
|
|
|
|
|
Designated Nonderivative Financial Instruments
The following table summarizes our debt and accrued interest, designated as a hedge of our net investment in international subsidiaries at the quarter ended (in millions):
|
|
|
March 31, 2022 |
|
|
December 31, 2021 |
|
||
|
British pound sterling |
|
$ |
|
|
|
$ |
|
|
The following table summarizes the unrealized gains (losses) in Foreign Currency and Derivative Gains, Net on the remeasurement of the unhedged portion of our debt and accrued interest, including euro and British pound sterling denominated debt (in millions):
|
|
|
Three Months Ended |
|
|||||
|
|
|
March 31, |
|
|||||
|
|
|
2022 |
|
|
2021 |
|
||
|
Unrealized gains on the unhedged portion |
|
$ |
|
|
|
$ |
|
|
Other Comprehensive Income (Loss)
The change in Other Comprehensive Income (Loss) in the Consolidated Statements of Comprehensive Income during the periods presented was due to the translation into U.S. dollars from the consolidation of the financial statements of our consolidated subsidiaries whose functional currency is not the U.S. dollar. The change in fair value of the effective portion of our derivative financial instruments that have been designated as net investment hedges and cash flow hedges and the translation of the hedged portion of our debt, as discussed above, are also included in Other Comprehensive Income (Loss).
22
The following table presents these changes in Other Comprehensive Income (Loss) (in thousands):
|
|
|
Three Months Ended March 31, |
|
|||||
|
|
|
2022 |
|
|
2021 |
|
||
|
Derivative net investment hedges |
|
$ |
|
|
|
$ |
( |
) |
|
Debt designated as nonderivative net investment hedges |
|
|
|
|
|
|
( |
) |
|
Cumulative translation adjustment |
|
|
|
|
|
|
|
|
|
Total foreign currency translation gains, net |
|
$ |
|
|
|
$ |
|
|
|
|
|
|
|
|
|
|
|
|
|
Cash flow hedges (1) |
|
$ |
|
|
|
$ |
|
|
|
Our share of derivatives from unconsolidated co-investment ventures |
|
|
|
|
|
|
|
|
|
Total unrealized gains on derivative contracts, net |
|
$ |
|
|
|
$ |
|
|
|
Total change in other comprehensive income |
|
$ |
|
|
|
$ |
|
|
|
(1) |
We estimate an additional expense of $ |
Fair Value Measurements
There have been no significant changes in our policy from what was disclosed in our Annual Report on Form 10-K for the year ended December 31, 2021.
Fair Value Measurements on a Recurring Basis
At March 31, 2022 and December 31, 2021, other than the derivatives discussed previously, we had no significant financial assets or financial liabilities that were measured at fair value on a recurring basis in the Consolidated Financial Statements. All of our derivatives held at March 31, 2022 and December 31, 2021, were classified as Level 2 of the fair value hierarchy.
Fair Value Measurements on Nonrecurring Basis
Acquired properties and assets we expect to sell or contribute are significant nonfinancial assets that met the criteria to be measured at fair value on a nonrecurring basis. At March 31, 2022 and December 31, 2021, we estimated the fair value of our properties using Level 2 or Level 3 inputs from the fair value hierarchy. See more information on our acquired properties in Notes 2 and assets held for sale or contribution in Note 4.
Fair Value of Financial Instruments
At March 31, 2022 and December 31, 2021, the carrying amounts of certain financial instruments, including cash and cash equivalents, accounts and notes receivable, accounts payable and accrued expenses were representative of their fair values. The differences in the fair value of our debt from the carrying value in the table below were the result of differences in interest rates or borrowing spreads that were available to us at March 31, 2022 and December 31, 2021, as compared with those in effect when the debt was issued or assumed, including reduced borrowing spreads due to our improved credit ratings. The fair value of the senior notes decreased during the three months ended March 31, 2022 due to the increase in bond yields in the market as compared to the weighted average interest rates on our senior notes. The senior notes and secured mortgage debt may contain prepayment penalties or yield maintenance provisions that could make the cost of refinancing the debt at lower rates exceed the benefit that would be derived from doing so. We evaluate this on an on-going basis based on market conditions and other factors.
The following table reflects the carrying amounts and estimated fair values of our debt (in thousands):
|
|
|
March 31, 2022 |
|
|
December 31, 2021 |
|
||||||||||
|
|
|
Carrying Value |
|
|
Fair Value |
|
|
Carrying Value |
|
|
Fair Value |
|
||||
|
Credit Facilities |
|
$ |
|
|
|
$ |
|
|
|
$ |
|
|
|
$ |
|
|
|
Senior notes |
|
|
|
|
|
|
|
|
|
|
|
|
|
|
|
|
|
Term loans and unsecured other |
|
|
|
|
|
|
|
|
|
|
|
|
|
|
|
|
|
Secured mortgage |
|
|
|
|
|
|
|
|
|
|
|
|
|
|
|
|
|
Total |
|
$ |
|
|
|
$ |
|
|
|
$ |
|
|
|
$ |
|
|
23
NOTE 10. BUSINESS SEGMENTS
Our current business strategy includes
|
• |
Real Estate Operations. This operating segment represents the ownership and development of operating properties and is the largest component of our revenue and earnings. We collect rent from our customers through operating leases, including reimbursements for the majority of our property operating costs. Each operating property is considered to be an individual operating segment with similar economic characteristics; these properties are combined within the reportable business segment based on geographic location. Our Real Estate Operations segment also includes development activities that lead to rental operations, including land held for development and properties currently under development, and other real estate investments. Within this line of business, we utilize the following: (i) our land bank; (ii) the development and leasing expertise of our local teams; and (iii) our customer relationships. |
|
• |
Strategic Capital. This operating segment represents the management of unconsolidated co-investment ventures. We generate strategic capital revenues primarily from our unconsolidated co-investment ventures through asset management and property management services and we earn additional revenues by providing leasing, acquisition, construction, development, financing and disposition services. Depending on the structure of the venture and the returns provided to our partners, we also earn revenues through promotes periodically during the life of a venture or upon liquidation. Each unconsolidated co-investment venture we manage is considered to be an individual operating segment with similar economic characteristics; these ventures are combined within the reportable business segment based on geographic location. |
Reconciliations are presented below for: (i) each reportable business segment’s revenues from external customers to Total Revenues; (ii) each reportable business segment’s net operating income from external customers to Operating Income and Earnings Before Income Taxes; and (iii) each reportable business segment’s assets to Total Assets. Our chief operating decision makers rely primarily on net operating income and similar measures to make decisions about allocating resources and assessing segment performance. The applicable components of Total Revenues, Operating Income, Earnings Before Income Taxes and Total Assets are allocated to each reportable business segment’s revenues, net operating income and assets. Items that are not directly assignable to a segment, such as certain corporate income and expenses, are not allocated but reflected as reconciling items.
24
The following reconciliations are presented in thousands:
|
|
|
Three Months Ended March 31, |
|
|||||
|
|
|
|
2022 |
|
|
|
2021 |
|
|
Revenues: |
|
|
|
|
|
|
|
|
|
Real estate operations segment: |
|
|
|
|
|
|
|
|
|
U.S. |
|
$ |
|
|
|
$ |
|
|
|
Other Americas |
|
|
|
|
|
|
|
|
|
Europe |
|
|
|
|
|
|
|
|
|
Asia |
|
|
|
|
|
|
|
|
|
Total real estate operations segment |
|
|
|
|
|
|
|
|
|
Strategic capital segment: |
|
|
|
|
|
|
|
|
|
U.S. |
|
|
|
|
|
|
|
|
|
Other Americas |
|
|
|
|
|
|
|
|
|
Europe |
|
|
|
|
|
|
|
|
|
Asia |
|
|
|
|
|
|
|
|
|
Total strategic capital segment |
|
|
|
|
|
|
|
|
|
|
|
|
|
|
|
|
|
|
|
Total revenues |
|
|
|
|
|
|
|
|
|
|
|
|
|
|
|
|
|
|
|
Segment net operating income: |
|
|
|
|
|
|
|
|
|
Real estate operations segment: |
|
|
|
|
|
|
|
|
|
U.S. (1) |
|
|
|
|
|
|
|
|
|
Other Americas |
|
|
|
|
|
|
|
|
|
Europe |
|
|
|
|
|
|
|
|
|
Asia |
|
|
|
|
|
|
|
|
|
Total real estate operations segment |
|
|
|
|
|
|
|
|
|
Strategic capital segment: |
|
|
|
|
|
|
|
|
|
U.S. (1) |
|
|
|
|
|
|
|
|
|
Other Americas |
|
|
|
|
|
|
|
|
|
Europe |
|
|
|
|
|
|
|
|
|
Asia |
|
|
|
|
|
|
|
|
|
Total strategic capital segment |
|
|
|
|
|
|
|
|
|
|
|
|
|
|
|
|
|
|
|
Total segment net operating income |
|
|
|
|
|
|
|
|
|
|
|
|
|
|
|
|
|
|
|
Reconciling items: |
|
|
|
|
|
|
|
|
|
General and administrative expenses |
|
|
( |
) |
|
|
( |
) |
|
Depreciation and amortization expenses |
|
|
( |
) |
|
|
( |
) |
|
Gains on dispositions of development properties and land, net |
|
|
|
|
|
|
|
|
|
Gains on other dispositions of investments in real estate, net |
|
|
|
|
|
|
|
|
|
Operating income |
|
|
|
|
|
|
|
|
|
|
|
|
|
|
|
|
|
|
|
Earnings from unconsolidated entities, net |
|
|
|
|
|
|
|
|
|
Interest expense |
|
|
( |
) |
|
|
( |
) |
|
Interest and other income, net |
|
|
|
|
|
|
|
|
|
Foreign currency and derivative gains, net |
|
|
|
|
|
|
|
|
|
Losses on early extinguishment of debt, net |
|
|
( |
) |
|
|
( |
) |
|
Earnings before income taxes |
|
$ |
|
|
|
$ |
|
|
25
|
|
|
March 31, 2022 |
|
|
December 31, 2021 |
|
||
|
Segment assets: |
|
|
|
|
|
|
|
|
|
Real estate operations segment: |
|
|
|
|
|
|
|
|
|
U.S. |
|
$ |
|
|
|
$ |
|
|
|
Other Americas |
|
|
|
|
|
|
|
|
|
Europe |
|
|
|
|
|
|
|
|
|
Asia |
|
|
|
|
|
|
|
|
|
Total real estate operations segment |
|
|
|
|
|
|
|
|
|
Strategic capital segment: (2) |
|
|
|
|
|
|
|
|
|
U.S. |
|
|
|
|
|
|
|
|
|
Europe |
|
|
|
|
|
|
|
|
|
Asia |
|
|
|
|
|
|
|
|
|
Total strategic capital segment |
|
|
|
|
|
|
|
|
|
Total segment assets |
|
|
|
|
|
|
|
|
|
|
|
|
|
|
|
|
|
|
|
Reconciling items: |
|
|
|
|
|
|
|
|
|
Investments in and advances to unconsolidated entities |
|
|
|
|
|
|
|
|
|
Assets held for sale or contribution |
|
|
|
|
|
|
|
|
|
Cash and cash equivalents |
|
|
|
|
|
|
|
|
|
Other assets |
|
|
|
|
|
|
|
|
|
Total reconciling items |
|
|
|
|
|
|
|
|
|
Total assets |
|
$ |
|
|
|
$ |
|
|
|
(1) |
This includes compensation and personnel costs for employees who were located in the U.S. but also support other geographies. |
|
(2) |
Represents management contracts and goodwill recorded in connection with business combinations associated with the Strategic Capital segment. Goodwill was $ |
NOTE 11. SUPPLEMENTAL CASH FLOW INFORMATION
Our significant noncash investing and financing activities for the three months ended March 31, 2022 and 2021 included the following:
|
• |
We recognized lease right-of-use assets and lease liabilities related to leases in which we are the lessee within Other Assets and Other Liabilities on the Consolidated Balance Sheets, including any new leases, renewals and modifications of $ |
|
• |
We capitalized $ |
|
• |
We received $ |
|
• |
We issued |
We paid $
We paid $
26
Report of Independent Registered Public Accounting Firm
To the Stockholders and Board of Directors
Prologis, Inc.:
Results of Review of Interim Financial Information
We have reviewed the consolidated balance sheet of Prologis, Inc. and subsidiaries (the Company) as of March 31, 2022, the related consolidated statements of income, comprehensive income, and equity for the three-month periods ended March 31, 2022 and 2021, the related consolidated statements of cash flows for the three-month periods ended March 31, 2022 and 2021, and the related notes (collectively, the consolidated interim financial information). Based on our reviews, we are not aware of any material modifications that should be made to the consolidated interim financial information for it to be in conformity with U.S. generally accepted accounting principles.
We have previously audited, in accordance with the standards of the Public Company Accounting Oversight Board (United States) (PCAOB), the consolidated balance sheet of the Company as of December 31, 2021, and the related consolidated statements of income, comprehensive income, equity, and cash flows for the year then ended (not presented herein); and in our report dated February 9, 2022, we expressed an unqualified opinion on those consolidated financial statements. In our opinion, the information set forth in the accompanying consolidated balance sheet as of December 31, 2021, is fairly stated, in all material respects, in relation to the consolidated balance sheet from which it has been derived.
Basis for Review Results
This consolidated interim financial information is the responsibility of the Company’s management. We are a public accounting firm registered with the PCAOB and are required to be independent with respect to the Company in accordance with the U.S. federal securities laws and the applicable rules and regulations of the Securities and Exchange Commission and the PCAOB.
We conducted our reviews in accordance with the standards of the PCAOB. A review of consolidated interim financial information consists principally of applying analytical procedures and making inquiries of persons responsible for financial and accounting matters. It is substantially less in scope than an audit conducted in accordance with the standards of the PCAOB, the objective of which is the expression of an opinion regarding the financial statements taken as a whole. Accordingly, we do not express such an opinion.
/s/ KPMG LLP
Denver, Colorado
April 26, 2022
27
Report of Independent Registered Public Accounting Firm
To the Partners of Prologis, L.P. and the Board of Directors of Prologis, Inc.:
Results of Review of Interim Financial Information
We have reviewed the consolidated balance sheet of Prologis, L.P. and subsidiaries (the Operating Partnership) as of March 31, 2022, the related consolidated statements of income, comprehensive income, and capital for the three-month periods ended March 31, 2022 and 2021, the related consolidated statements of cash flows for the three-month periods ended March 31, 2022 and 2021, and the related notes (collectively, the consolidated interim financial information). Based on our reviews, we are not aware of any material modifications that should be made to the consolidated interim financial information for it to be in conformity with U.S. generally accepted accounting principles.
We have previously audited, in accordance with the standards of the Public Company Accounting Oversight Board (United States) (PCAOB), the consolidated balance sheet of the Operating Partnership as of December 31, 2021, and the related consolidated statements of income, comprehensive income, capital, and cash flows for the year then ended (not presented herein); and in our report dated February 9, 2022, we expressed an unqualified opinion on those consolidated financial statements. In our opinion, the information set forth in the accompanying consolidated balance sheet as of December 31, 2021, is fairly stated, in all material respects, in relation to the consolidated balance sheet from which it has been derived.
Basis for Review Results
This consolidated interim financial information is the responsibility of the Operating Partnership’s management. We are a public accounting firm registered with the PCAOB and are required to be independent with respect to the Operating Partnership in accordance with the U.S. federal securities laws and the applicable rules and regulations of the Securities and Exchange Commission and the PCAOB.
We conducted our reviews in accordance with the standards of the PCAOB. A review of consolidated interim financial information consists principally of applying analytical procedures and making inquiries of persons responsible for financial and accounting matters. It is substantially less in scope than an audit conducted in accordance with the standards of the PCAOB, the objective of which is the expression of an opinion regarding the financial statements taken as a whole. Accordingly, we do not express such an opinion.
/s/ KPMG LLP
Denver, Colorado
April 26, 2022
28
ITEM 2. Management’s Discussion and Analysis of Financial Condition and Results of Operations
The following should be read in conjunction with the Consolidated Financial Statements and related Notes included in Item 1 of this report and our Annual Report on Form 10-K for the year ended December 31, 2021, as filed with the United States (“U.S.”) Securities and Exchange Commission (“SEC”).
The statements in this report that are not historical facts are forward-looking statements within the meaning of Section 27A of the Securities Act of 1933, as amended, and Section 21E of the Securities Exchange Act of 1934, as amended. These forward-looking statements are based on current expectations, estimates and projections about the industry and markets in which we operate as well as management’s beliefs and assumptions. Such statements involve uncertainties that could significantly impact our financial results. Words such as “expects,” “anticipates,” “intends,” “plans,” “believes,” “seeks,” and “estimates” including variations of such words and similar expressions are intended to identify such forward-looking statements, which generally are not historical in nature. All statements that address operating performance, events or developments that we expect or anticipate will occur in the future — including statements relating to rent and occupancy growth, acquisition and development activity, contribution and disposition activity, general conditions in the geographic areas where we operate, our debt, capital structure and financial position, our ability to earn revenues from co-investment ventures, form new co-investment ventures and the availability of capital in existing or new co-investment ventures — are forward-looking statements. These statements are not guarantees of future performance and involve certain risks, uncertainties and assumptions that are difficult to predict. Although we believe the expectations reflected in any forward-looking statements are based on reasonable assumptions, we can give no assurance that our expectations will be attained, and therefore actual outcomes and results may differ materially from what is expressed or forecasted in such forward-looking statements. Some of the factors that may affect outcomes and results include, but are not limited to: (i) international, national, regional and local economic and political climates and conditions; (ii) changes in global financial markets, interest rates and foreign currency exchange rates; (iii) increased or unanticipated competition for our properties; (iv) risks associated with acquisitions, dispositions and development of properties, including increased development costs due to additional regulatory requirements related to climate change; (v) maintenance of Real Estate Investment Trust (“REIT”) status, tax structuring and changes in income tax laws and rates; (vi) availability of financing and capital, the levels of debt that we maintain and our credit ratings; (vii) risks related to our investments in our co-investment ventures, including our ability to establish new co-investment ventures; (viii) risks of doing business internationally, including currency risks; (ix) environmental uncertainties, including risks of natural disasters; (x) risks related to the coronavirus (“COVID-19”) pandemic; and (xi) those additional factors discussed under Part I, Item 1A. Risk Factors in our Annual Report on Form 10-K for the year ended December 31, 2021. We undertake no duty to update any forward-looking statements appearing in this report except as may be required by law.
Prologis, Inc. is a self-administered and self-managed REIT and is the sole general partner of Prologis, L.P. through which it holds substantially all of its assets. We operate Prologis, Inc. and Prologis, L.P. as one enterprise and, therefore, our discussion and analysis refers to Prologis, Inc. and its consolidated subsidiaries, including Prologis, L.P. We invest in real estate through wholly owned subsidiaries and other entities through which we co-invest with partners and investors. We have a significant ownership interest in the co-investment ventures, which may be consolidated or unconsolidated based on our level of control of the entity.
We operate and manage our business on an owned and managed (“O&M”) basis and therefore evaluate the operating performance of the properties for our O&M portfolio, which includes our consolidated properties and properties owned by our unconsolidated co-investment ventures. We make operating decisions based on our total O&M portfolio, as we manage the properties without regard to their ownership. We also evaluate our results based on our proportionate economic ownership of each property included in the O&M portfolio (“our share”) to reflect our share of the financial results of the O&M portfolio.
Included in our discussion below are references to funds from operations (“FFO”) and net operating income (“NOI”), neither of which are U.S. generally accepted accounting principles (“GAAP”). See below for a reconciliation of Net Earnings Attributable to Common Stockholders/Unitholders in the Consolidated Statements of Income to our FFO measures and a reconciliation of NOI to Operating Income, the most directly comparable GAAP measures.
MANAGEMENT’S OVERVIEW
We are the global leader in logistics real estate with a focus on high-barrier, high growth markets. We own, manage and develop well-located, high-quality logistics facilities in 19 countries across four continents. Our portfolio focuses on the world’s most vibrant centers of commerce and our scale across these locations allows us to respond to our customers’ diverse logistics requirements. Our teams actively manage our portfolio to provide comprehensive real estate services, including leasing, property management, development, acquisitions and dispositions. We invest significant capital each year into new logistics properties principally through our development activity and third-party acquisitions. Our property dispositions allow us to recycle capital and contribute to self-funding these development and acquisition activities.
The broadening of e-commerce adoption is driving requirements for increased warehouse space to store and distribute goods. This has led to surging customer demand which has continued to outpace supply. We believe this demand surge is driven by three primary factors: (i) overall consumption and household growth; (ii) customer supply chains re-positioning to address the significant shift to e-commerce and heightened service expectations; and (iii) our customers’ desire for more supply chain resiliency. With the inventory-to-sales ratio below pre-pandemic levels, our customers not only need to build inventories to address this shortfall, but also build additional safety stock. We believe these forces will keep demand strong for years to come.
29
The scale of our 1.0 billion square foot portfolio allows us to help our customers in several unique ways. We continue to focus on innovative ways to meet our customers’ needs through Prologis Essentials. This business includes product and service solutions for our customers’ operations, workforce, energy, transportation and data and analytic needs. Our integrated suite of solutions allows our customers to benefit from our global scale and leverage our strategic partnerships with vendors and local expertise to obtain services and products more efficiently. We use our proprietary data and analytics to provide our customers actionable insights on everything from inventory, shipping, security, communications management and fleet visibility.
Prologis Essentials has a strong sustainability component to its suite of services, which supports our customers’ progress toward their sustainability goals. This includes new development and redevelopment of buildings to specifications that align with leading sustainable building standards and implementation of energy solutions such as solar power and LED lighting. We also are facilitating the introduction of electric vehicle (“EV”) fleets in logistics by making long-term investments in our portfolio and talent to be well prepared for the future of EV trucking and logistics.
At March 31, 2022, our total O&M portfolio at 100%, including properties and development projects, totaled $104.1 billion (based on gross book value and total expected investment (“TEI”) at completion) across 1.0 billion square feet (93 million square meters) and four continents. Our share of the total O&M portfolio was $65.5 billion. We lease modern logistics facilities to a diverse base of approximately 5,800 customers.
Our business comprises two operating segments: Real Estate Operations and Strategic Capital.
Below is information summarizing consolidated activity within our segments (in millions):
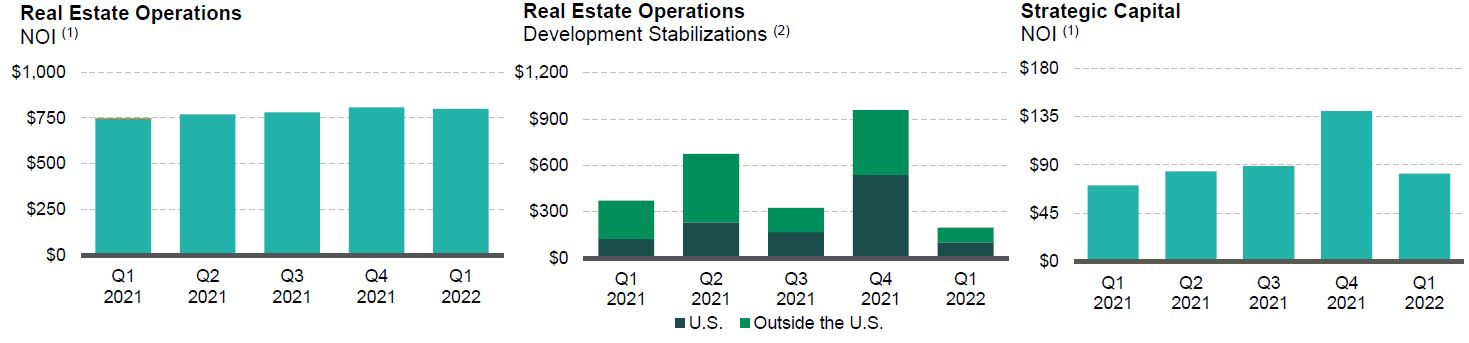
|
(1) |
NOI from Real Estate Operations is calculated directly from our Consolidated Financial Statements as Rental Revenues and Development Management and Other Revenues less Rental Expenses and Other Expenses. NOI from Strategic Capital is calculated directly from our Consolidated Financial Statements as Strategic Capital Revenues less Strategic Capital Expenses. |
|
(2) |
A developed property moves into the operating portfolio when it meets our definition of stabilization, which is the earlier of when a property that was developed has been completed for one year, is contributed to a co-investment venture following completion or is 90% occupied. Amounts represent our TEI, which includes the estimated cost of development or expansion, land, construction and leasing costs. |
Real Estate Operations
Rental. Rental operations comprise the largest component of our operating segments and generally contribute 85% to 90% of our consolidated revenues, earnings and FFO. We collect rent from our customers through operating leases, including reimbursements for the majority of our property operating costs. For leases that commenced during the three months ended March 31, 2022, within the consolidated operating portfolio, the weighted average lease term was 61 months. We expect to generate internal growth by increasing rents, maintaining high occupancy rates and controlling expenses. The primary driver of our revenue growth will be rolling in-place leases to current market rents as leases expire, as discussed further below. We believe our active portfolio management, combined with the skills of our property, leasing, maintenance, capital, energy, sustainability and risk management teams allow us to maximize NOI across our portfolio. Substantially all of our consolidated rental revenue, NOI and cash flows are generated in the U.S.
Development. Given the scarcity of modern logistics facilities in our target markets, our development business provides the opportunity to build to the requirements of our current and future customers and deepen our market presence. We believe we have a competitive advantage due to (i) the strategic locations of our global land bank and redevelopment sites; (ii) the development expertise of our local teams; (iii) the depth of our customer relationships; and (iv) our ability to integrate sustainable design features and practices that result in cost-savings and operational efficiencies for our customers to help them reach their sustainability goals. Successful development and redevelopment efforts provide significant earnings growth as projects are leased, generate income and increase the net asset value of our Real Estate Operations segment. Generally, we develop properties in the U.S. for long-term hold and outside the U.S. for contribution to our unconsolidated co-investment ventures.
30
Strategic Capital
Our strategic capital segment allows us to partner with many of the world’s largest institutional investors. Our strategic capital business is capitalized principally through private and public equity comprised of 95% perpetual open-ended or long-term ventures and two publicly traded vehicles (Nippon Prologis REIT, Inc. in Japan and FIBRA Prologis in Mexico). We align our interests with our partners by holding significant ownership interests in all of our eight unconsolidated co-investment ventures (ranging from 15% to 50%). This structure allows us to reduce our exposure to foreign currency movements for investments outside the U.S.
This segment produces durable, long-term cash flows and generally contributes 10% to 15% of our recurring consolidated revenues, earnings and FFO. We generate strategic capital revenues from our unconsolidated co-investment ventures, principally through asset management and property management services. Asset management fees are primarily driven by the real estate valuation of the respective ventures. We earn additional revenues by providing leasing, acquisition, construction management, development and disposition services. In certain ventures, we also have the ability to earn revenues through incentive fees (“promotes” or “promote revenues”) periodically during the life of a venture or upon liquidation based primarily on the appreciation of the portfolio. We plan to profitably grow this business by increasing our assets under management in existing or new ventures. The majority of strategic capital revenues are generated outside the U.S.
FUTURE GROWTH
We believe the quality and scale of our global portfolio, our ability to build out the global land bank, our strategic capital business, the expertise of our team, the depth of our customer relationships and the strength of our balance sheet are differentiators that allow us to drive growth in revenues, NOI, earnings, FFO and cash flows.
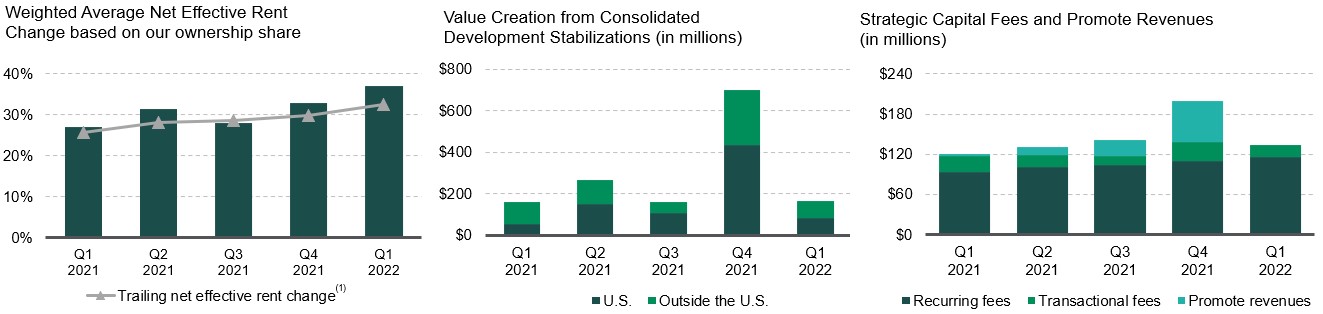
|
(1) |
Calculated using the trailing twelve months immediately prior to the period ended. |
|
• |
Rent Growth. We expect rents in our markets to continue to grow due to the increasing demand for well-located logistics real estate. Due to strong market rent growth over the last several years, our in-place leases have considerable upside potential to drive future incremental organic NOI growth. We estimate that our net effective lease mark-to-market is approximately 47%, which represents the growth rate from in-place rents to current market rents based on our weighted average ownership of the O&M portfolio at March 31, 2022. Therefore, even if there was no additional rent growth in the future, we expect our lease renewals to translate into significant increases in future rental income, on a consolidated basis and through the earnings we recognize from our unconsolidated co-investment ventures based on our ownership. We have experienced positive rent change on rollover (comparing the net effective rent (“NER”) of the new lease to the prior lease for the same space) in every quarter since 2013. |
|
• |
Value Creation from Development. A successful development and redevelopment program requires maintaining control of well-located land and redevelopment sites and sourcing a future pipeline through acquisition opportunities, including our innovative approach with Covered Land Plays, which are income producing assets acquired with the intention to redevelop for higher and better use as industrial properties. The global nature of our development program provides a wide landscape of opportunities to pursue based on our judgement of market conditions, opportunities and risks. We believe that the carrying value of our global land bank is meaningfully below its current fair value. Due to the strategic nature of our global land bank, development expertise of our teams and strength of our customer relationships, we expect to create value as we build new properties. |
We measure the estimated value creation of a development project as the margin above our TEI. Based on our current estimates, our consolidated land, including options and Covered Land Plays, has the potential to support the development of $24.6 billion ($27.8 billion on an O&M basis) of TEI of new logistics space. As properties stabilize, we expect to realize the value creation principally through contributions to unconsolidated co-investment ventures and increases in the NOI of the consolidated portfolio. Our investment in the development portfolio was $3.3 billion at March 31, 2022.
|
• |
Strategic Capital Advantages. We continue to successfully raise capital to support the long-term growth of the co-investment ventures while maintaining our substantial investments in these vehicles. At March 31, 2022, the gross book value of the operating portfolio held by our eight unconsolidated co-investment ventures was $45.3 billion across 460 million square feet. The valuations of the real estate portfolios owned by the unconsolidated co-investment ventures increased significantly during 2021, and we have experienced the same trends in the first quarter of 2022. The increase in valuations translates into higher asset management fees. We expect that continued market rent growth may result in an increase in the asset valuations of the unconsolidated co-investment ventures, which will drive significant returns to the investors and increase the potential for earning promote revenues over the next couple of years. Our Strategic Capital business generates durable fee streams, with asset management fees marked to fair values each quarter, all while requiring minimal capital other than our investment in the venture. |
31
|
• |
Balance Sheet Strength. At March 31, 2022, the weighted average remaining maturity of our consolidated debt was 10 years and the weighted average effective interest rate was 1.5%, primarily as a result of our refinancing activities over the last several years. Through our refinancing activities we have substantially addressed all our debt maturities through 2026 and have taken advantage of low interest rates. At March 31, 2022, we had total available liquidity of $6.8 billion and continue to maintain low leverage as a percentage of our real estate investments and our market capitalization. As a result of our low leverage, available liquidity and investment capacity in the co-investment ventures, we have significant capacity to capitalize on value-added investment opportunities as they arise. |
|
• |
Economies of Scale from Growth. We have scalable systems and infrastructure in place to grow both our consolidated and O&M portfolios with limited incremental general and administrative (“G&A”) expense. We believe we can continue to grow NOI and strategic capital revenues organically and through accretive development and acquisition activity while further reducing G&A as a percentage of our investments in real estate. |
|
• |
Staying “Ahead of What’s Next™”. We are focused on creating value beyond real estate by enhancing our customers’ experience, leveraging our scale to obtain procurement savings and innovating through data analytics and digitization efforts. Through Prologis Essentials we support our customers through service and product offerings, including innovative solutions to operations, transport, technology, energy, and labor challenges that can make our customers’ decision process easier and their enterprise more efficient. Additionally, we invest in sustainable logistics building design features and practices, such as the addition of solar panels, LED lighting and EV charging, that also allows us to assist our customers with their sustainability objectives. |
SUMMARY OF 2022
Our financial condition and operating results were strong during the three months ended March 31, 2022. E-commerce continues to grow well above its historical average and demand for space is robust based on our proprietary data. Having the right logistics real estate in the right location is critical for our customers, which is evident with our O&M occupancy at 97.4% at March 31, 2022. O&M leasing activity continued to be strong for our O&M portfolio as we commenced approximately 49 million square feet of leases during the first quarter of 2022. Our outlook for the remainder of 2022 is equally as promising as we expect further increases in market rents and asset valuations to drive our operating results as well as our execution of profitable deployment activities. While the logistics markets remain strong, we are continuing to monitor the war in the Ukraine and other events around the globe and to date we have not seen an impact on our business. We have been contributing to refugee assistance efforts, including providing space to local nonprofits under our Space for Good program and staying close to colleagues personally affected by the conflict.
During the three months ended March 31, 2022, we generated net proceeds of $1.7 billion and realized net gains of $795 million, principally from the contribution of properties to our unconsolidated co-investment venture in Europe and dispositions of non-strategic assets to third parties in the U.S.
We completed the following consolidated financing activities that included the issuance of $1.8 billion of senior notes (principal in millions). At March 31, 2022, the weighted average remaining maturity was 10 years and the weighted average effective interest rate was 1.5% for our consolidated debt:
|
|
|
|
Aggregate Principal |
|
|
Issuance Date Weighted Average |
|
|
|
||||||||||
|
|
Issuance Date |
|
Borrowing Currency |
|
|
USD (1) |
|
|
Interest Rate (2) |
|
|
Term (3) |
|
|
Maturity Dates |
||||
|
|
January |
|
£ |
60 |
|
|
$ |
81 |
|
|
2.1% |
|
|
|
20.0 |
|
|
December 2041 |
|
|
|
February (4) |
|
€ |
1,550 |
|
|
$ |
1,768 |
|
|
1.0% |
|
|
|
8.5 |
|
|
February 2024 – 2034 |
|
|
|
Total |
|
|
|
|
|
$ |
1,849 |
|
|
1.1% |
|
|
|
9.0 |
|
|
|
|
|
|
|
|
|
|
|
|
|
|
|
|
|
|
|
|
|
|
|
|
|
|
|
(1) |
The exchange rate used to calculate into U.S. dollars was the spot rate at the settlement date. |
|
|
(2) |
The weighted average interest rate represents the fixed or variable interest rates of the related debt at the issuance date. |
|
|
(3) |
The weighted average term represents the remaining maturity in years on the related debt at the issuance date. |
32
|
|
(4) |
Net proceeds from the issuance of these notes were used to finance green projects eligible under our green bond framework, repay or refinance indebtedness and for general corporate purposes. |
At March 31, 2022, we had total available liquidity of $6.8 billion, principally due to aggregate availability under our credit facilities of $4.9 billion and unrestricted cash balances of $1.9 billion.
Throughout this discussion, we reflect amounts in U.S. dollars, our reporting currency. Included in these amounts are consolidated and unconsolidated investments denominated in foreign currencies, principally the British pound sterling, Canadian dollar, euro and Japanese yen that are impacted by fluctuations in exchange rates when translated to U.S. dollars. We mitigate our exposure to foreign currency fluctuations by investing outside the U.S. through co-investment ventures, borrowing in the functional currency of our subsidiaries and utilizing derivative financial instruments.
RESULTS OF OPERATIONS – THREE MONTHS ENDED MARCH 31, 2022 AND 2021
We evaluate our business operations based on the NOI of our two operating segments: Real Estate Operations and Strategic Capital. NOI by segment is a non-GAAP performance measure that is calculated using revenues and expenses directly from our financial statements. We consider NOI by segment to be an appropriate supplemental measure of our performance because it helps management and investors understand our operating results.
Below is a reconciliation of our NOI by segment to Operating Income per the Consolidated Financial Statements for the three months ended March 31 (in millions). Each segment’s NOI is reconciled to line items in the Consolidated Financial Statements as provided in the related discussion below.
|
|
|
2022 |
|
|
2021 |
|
||
|
Real Estate Operations – NOI |
|
$ |
800 |
|
|
$ |
747 |
|
|
Strategic Capital – NOI |
|
|
82 |
|
|
|
71 |
|
|
General and administrative expenses |
|
|
(74 |
) |
|
|
(78 |
) |
|
Depreciation and amortization expenses |
|
|
(397 |
) |
|
|
(398 |
) |
|
Operating income before gains on real estate transactions, net |
|
|
411 |
|
|
|
342 |
|
|
Gains on dispositions of development properties and land, net |
|
|
210 |
|
|
|
174 |
|
|
Gains on other dispositions of investments in real estate, net |
|
|
585 |
|
|
|
16 |
|
|
Operating income |
|
$ |
1,206 |
|
|
$ |
532 |
|
See Note 10 to the Consolidated Financial Statements for more information on our segments and a reconciliation of each business segment’s NOI to Operating Income and Earnings Before Income Taxes.
Real Estate Operations
This operating segment principally includes rental revenue and rental expenses recognized from our consolidated properties. We allocate the costs of our property management and leasing functions to the Real Estate Operations segment through Rental Expenses and the Strategic Capital segment through Strategic Capital Expenses based on the square footage of the relative portfolios. In addition, this segment is impacted by our development, acquisition and disposition activities.
Below are the components of Real Estate Operations NOI for the three months ended March 31, derived directly from line items in the Consolidated Financial Statements (in millions):
|
|
|
2022 |
|
|
2021 |
|
||
|
Rental revenues |
|
$ |
1,077 |
|
|
$ |
1,022 |
|
|
Development management and other revenues |
|
|
8 |
|
|
|
6 |
|
|
Rental expenses |
|
|
(276 |
) |
|
|
(278 |
) |
|
Other expenses |
|
|
(9 |
) |
|
|
(3 |
) |
|
Real Estate Operations – NOI |
|
$ |
800 |
|
|
$ |
747 |
|
|
|
|
|
|
|
|
|
|
|
33
The change in Real Estate Operations (“REO”) NOI for the three months ended March 31, 2022 compared to the same period in 2021 of $53 million was impacted by the following activities (in millions):
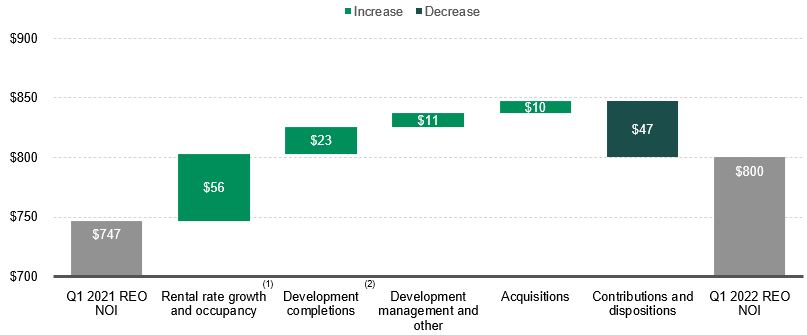
|
(1) |
During both periods, we experienced positive rental rate growth. Rental rate growth is a combination of higher rental rates on rollover of leases (or rent change) and contractual rent increases on existing leases. If a lease has a contractual rent increase driven by a metric that is not known at the time the lease commences, such as the consumer price index or a similar metric, the rent increase is not included in rent leveling and therefore impacts the rental revenue we recognize. Significant rent change during both periods continues to be a key driver in increasing rental income. See below for key metrics on rent change on rollover and occupancy for the consolidated operating portfolio. |
|
(2) |
We calculate changes in NOI from development completions period over period by comparing the change in NOI generated on the pool of developments that completed on or after January 1, 2021 through March 31, 2022. |
Below are key operating metrics of our consolidated operating portfolio, which excludes non-strategic industrial properties.
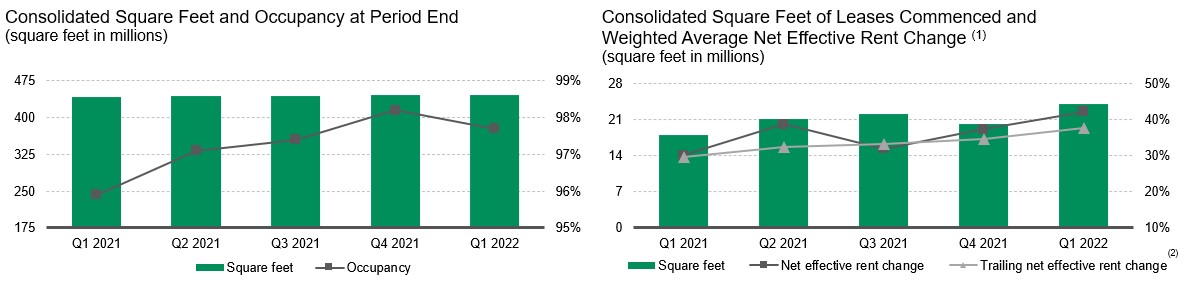
|
(1) |
Consolidated square feet of leases commenced and weighted average net effective rent change were calculated for leases with initial terms of one year or greater. |
|
(2) |
Calculated using the trailing twelve months immediately prior to the period ended. |
34
Development Activity
The following table summarizes consolidated development activity for the three months ended March 31 (dollars and square feet in millions):
|
|
|
2022 |
|
|
2021 |
|
||
|
Starts: |
|
|
|
|
|
|
|
|
|
Number of new development buildings during the period |
|
|
31 |
|
|
|
13 |
|
|
Square feet |
|
|
7 |
|
|
|
5 |
|
|
TEI |
|
$ |
1,041 |
|
|
$ |
556 |
|
|
Percentage of build-to-suits based on TEI |
|
|
36.6 |
% |
|
|
59.9 |
% |
|
|
|
|
|
|
|
|
|
|
|
Stabilizations: |
|
|
|
|
|
|
|
|
|
Number of development buildings stabilized during the period |
|
|
6 |
|
|
|
13 |
|
|
Square feet |
|
|
3 |
|
|
|
4 |
|
|
TEI |
|
$ |
197 |
|
|
$ |
372 |
|
|
Percentage of build-to-suits based on TEI |
|
|
51.2 |
% |
|
|
15.8 |
% |
|
Weighted average stabilized yield (1) |
|
|
6.0 |
% |
|
|
5.8 |
% |
|
Estimated value at completion |
|
$ |
360 |
|
|
$ |
533 |
|
|
Estimated weighted average margin (2) |
|
|
82.9 |
% |
|
|
43.2 |
% |
|
Estimated value creation |
|
$ |
163 |
|
|
$ |
161 |
|
|
(1) |
We calculate the weighted average stabilized yield as estimated NOI assuming stabilized occupancy divided by TEI. |
|
(2) |
Estimated weighted average margin is calculated on development properties as estimated value creation, less estimated closing costs and taxes, if any, on properties expected to be sold or contributed, divided by TEI. |
At March 31, 2022, the consolidated development portfolio, including properties under development and pre-stabilized properties, was expected to be completed before September 2023 with a TEI of $5.5 billion and was 51.2% leased. Our investment in the development portfolio was $3.3 billion at March 31, 2022, leaving $2.2 billion remaining to be spent. The rise in construction costs that began in 2021 has continued into the first quarter of 2022. Our procurement capabilities have allowed us to minimize the impact on our development activities. We continue to maintain high margins as a result of lower capitalization rates and higher market rents.
Capital Expenditures
We capitalize costs incurred in improving and leasing our operating properties as part of the investment basis or within other assets. The following graph summarizes capitalized expenditures, excluding development costs, and property improvements per average square foot of our consolidated operating properties during each quarter:
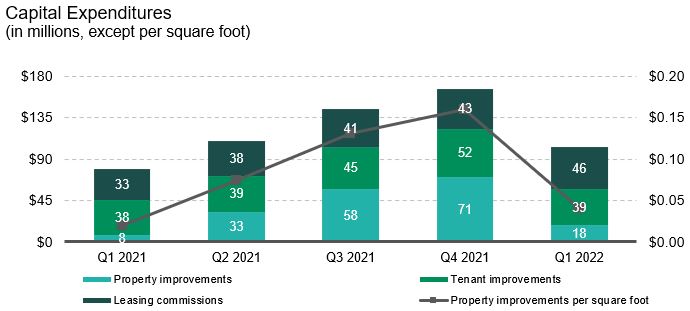
Strategic Capital
This operating segment includes revenues from asset management and property management services performed, transactional services for acquisition, disposition and leasing activity and promote revenue earned from the unconsolidated entities. Revenues associated with the Strategic Capital segment fluctuate because of changes in the size of the portfolios through acquisitions and dispositions, the fair value of the properties and other transactional activity including foreign currency exchange rates and timing of promotes. These revenues are reduced by the direct costs associated with the asset and property-level management expenses for the properties owned by these ventures. We allocate the costs of our property management and leasing functions to the Strategic Capital segment through Strategic Capital Expenses and to the Real Estate Operations segment through Rental Expenses based on the
35
square footage of the relative portfolios. For further details regarding the key property information and summarized financial condition and operating results of our unconsolidated co-investment ventures, refer to Note 3 to the Consolidated Financial Statements.
Below are the components of Strategic Capital NOI for the three months ended March 31, derived directly from the line items in the Consolidated Financial Statements (in millions):
|
|
|
2022 |
|
|
2021 |
|
||
|
Strategic capital revenues |
|
$ |
134 |
|
|
$ |
120 |
|
|
Strategic capital expenses |
|
|
(52 |
) |
|
|
(49 |
) |
|
Strategic Capital – NOI |
|
$ |
82 |
|
|
$ |
71 |
|
Below is additional detail of our Strategic Capital revenues, expenses and NOI for the three months ended March 31 (in millions):
|
|
|
U.S. (1) |
|
|
Other Americas |
|
|
Europe |
|
|
Asia |
|
|
Total |
|
|||||||||||||||||||||||||
|
|
|
2022 |
|
|
2021 |
|
|
2022 |
|
|
2021 |
|
|
2022 |
|
|
2021 |
|
|
2022 |
|
|
2021 |
|
|
2022 |
|
|
2021 |
|
||||||||||
|
Strategic capital revenues ($) |
|
|
|
|
|
|
|
|
|
|
|
|
|
|
|
|
|
|
|
|
|
|
|
|
|
|
|
|
|
|
|
|
|
|
|
|
|
|
|
|
|
Recurring fees (2) |
|
|
42 |
|
|
|
30 |
|
|
|
11 |
|
|
|
9 |
|
|
|
43 |
|
|
|
36 |
|
|
|
20 |
|
|
|
19 |
|
|
|
116 |
|
|
|
94 |
|
|
Transactional fees (3) |
|
|
9 |
|
|
|
4 |
|
|
|
1 |
|
|
|
2 |
|
|
|
3 |
|
|
|
5 |
|
|
|
5 |
|
|
|
13 |
|
|
|
18 |
|
|
|
24 |
|
|
Promote revenue (4) |
|
|
- |
|
|
|
- |
|
|
|
- |
|
|
|
- |
|
|
|
- |
|
|
|
2 |
|
|
|
- |
|
|
|
- |
|
|
|
- |
|
|
|
2 |
|
|
Total strategic capital revenues ($) |
|
|
51 |
|
|
|
34 |
|
|
|
12 |
|
|
|
11 |
|
|
|
46 |
|
|
|
43 |
|
|
|
25 |
|
|
|
32 |
|
|
|
134 |
|
|
|
120 |
|
|
Strategic capital expenses ($) |
|
|
(23 |
) |
|
|
(25 |
) |
|
|
(5 |
) |
|
|
(3 |
) |
|
|
(14 |
) |
|
|
(11 |
) |
|
|
(10 |
) |
|
|
(10 |
) |
|
|
(52 |
) |
|
|
(49 |
) |
|
Strategic Capital – NOI ($) |
|
|
28 |
|
|
|
9 |
|
|
|
7 |
|
|
|
8 |
|
|
|
32 |
|
|
|
32 |
|
|
|
15 |
|
|
|
22 |
|
|
|
82 |
|
|
|
71 |
|
|
|
|
|
|
|
|
|
|
|
|
|
|
|
|
|
|
|
|
|
|
|
|
|
|
|
|
|
|
|
|
|
|
|
|
|
|
|
|
|
|
|
|
(1) |
The U.S. expenses include compensation and personnel costs for employees who are based in the U.S. but also support other geographies. |
|
(2) |
Recurring fees include asset management and property management fees. The increase in fees is due primarily to higher asset management fees driven by the increases in the fair value of the properties based on third party valuations. |
|
(3) |
Transactional fees include leasing commissions and acquisition, disposition, development and other fees. |
|
(4) |
We generally earn promote revenue directly from third-party investors in the co-investment ventures based on the cumulative returns of the venture over a three-year period or the stabilization of individual development projects owned by the venture. An increase in asset valuations in the co-investment ventures is one of the significant drivers of returns that can translate into earning future promote revenues. Approximately 40% of the promote earned by us from the co-investment ventures is paid to our employees as a combination of cash and stock awards pursuant to the terms of the PPP and expensed through Strategic Capital Expenses, as vested. |
G&A Expenses
G&A expenses were $74 million and $78 million for the three months ended March 31, 2022 and 2021, respectively. We capitalize certain internal costs, including salaries and related expenses, that are incremental and directly related to the development activities.
The following table summarizes capitalized G&A for the three months ended March 31 (dollars in millions):
|
|
|
2022 |
|
|
2021 |
|
||
|
Building and land development activities |
|
$ |
25 |
|
|
$ |
25 |
|
|
Operating building improvements and other |
|
|
11 |
|
|
|
7 |
|
|
Total capitalized G&A expenses |
|
$ |
36 |
|
|
$ |
32 |
|
|
Capitalized salaries and related costs as a percent of total salaries and related costs |
|
|
23.4 |
% |
|
|
21.1 |
% |
36
Depreciation and Amortization Expenses
Depreciation and amortization expenses were $397 million and $398 million for the three months ended March 31, 2022 and 2021, respectively.
The change in depreciation and amortization expenses during the three months ended March 31, 2022 from the same period in 2021 of approximately $1 million was impacted by the following activities (in millions):
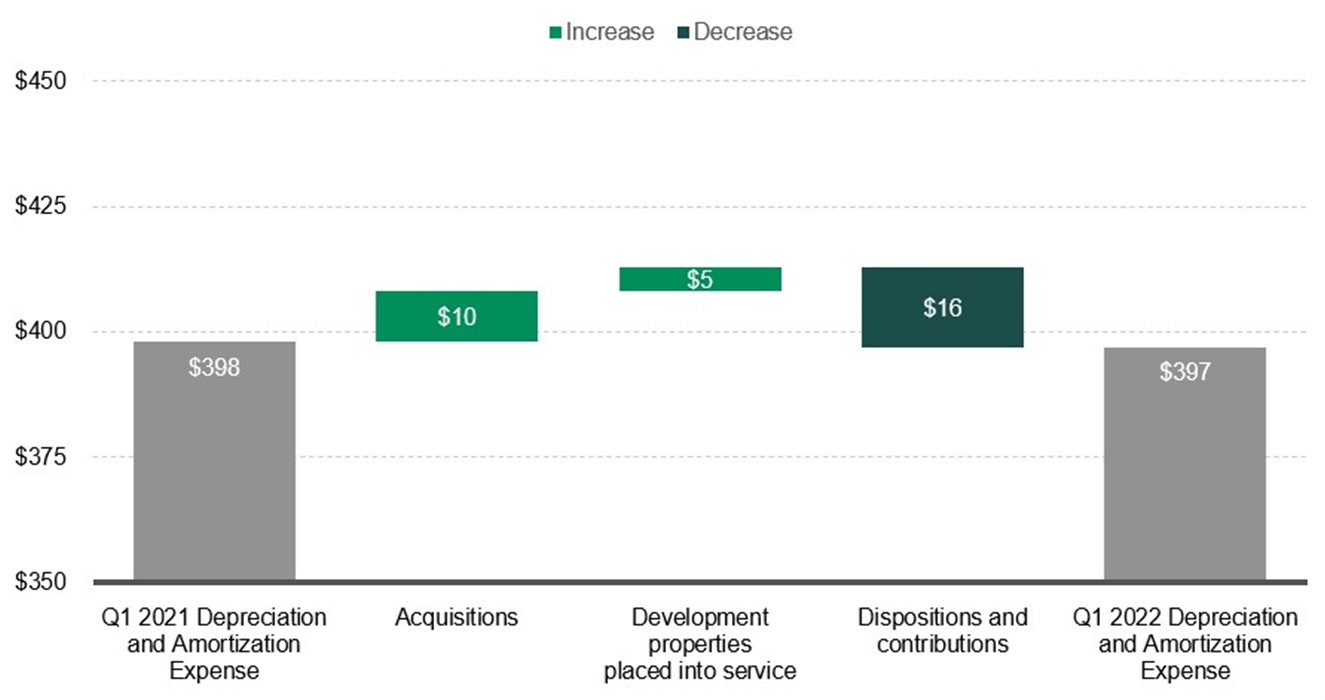
Gains on Real Estate Transactions, Net
Gains on the disposition of development properties and land were $210 million and $174 million for the three months ended March 31, 2022 and 2021, respectively, and primarily included gains from the contribution of properties we developed to our unconsolidated co-investment ventures in Europe and Japan. Gains on other dispositions of investments in real estate were $585 million and $16 million for the three months ended March 31, 2022 and 2021, respectively, and included sales of non-strategic operating properties. We utilized the proceeds from these transactions primarily to fund our development activities during both periods. See Note 2 to the Consolidated Financial Statements for further information on these transactions.
Our Owned and Managed (“O&M”) Operating Portfolio
We manage our business and review our operating fundamentals on an O&M basis, which includes our consolidated properties and properties owned by our unconsolidated co-investment ventures. We believe reviewing the fundamentals this way allows management to understand the entire impact to the financial statements, as it will affect both the Real Estate Operations and Strategic Capital segments, as well as the net earnings we recognize from our unconsolidated co-investment ventures based on our ownership. We do not control the unconsolidated co-investment ventures for purposes of GAAP and the presentation of the ventures’ operating information does not represent a legal claim.
Our O&M operating portfolio does not include our development portfolio, value-added properties, non-industrial properties or properties we do not have the intent to hold long-term that are classified as either held for sale or within other real estate investments. Value-added properties are properties we have either acquired at a discount and believe we could provide greater returns post-stabilization or properties we expect to repurpose to a higher and better use. See below for information on our O&M operating portfolio (square feet in millions):
|
|
March 31, 2022 |
|
|
December 31, 2021 |
|
||||||||||||||||||
|
|
Number of Properties |
|
|
Square Feet |
|
|
Percentage Occupied |
|
|
Number of Properties |
|
|
Square Feet |
|
|
Percentage Occupied |
|
||||||
|
Consolidated |
|
2,297 |
|
|
|
446 |
|
|
|
97.7 |
% |
|
|
2,300 |
|
|
|
446 |
|
|
|
98.2 |
% |
|
Unconsolidated |
|
2,003 |
|
|
|
460 |
|
|
|
97.2 |
% |
|
|
1,987 |
|
|
|
456 |
|
|
|
97.3 |
% |
|
Total |
|
4,300 |
|
|
|
906 |
|
|
|
97.4 |
% |
|
|
4,287 |
|
|
|
902 |
|
|
|
97.7 |
% |
37
Below are the key leasing metrics of our O&M operating portfolio.
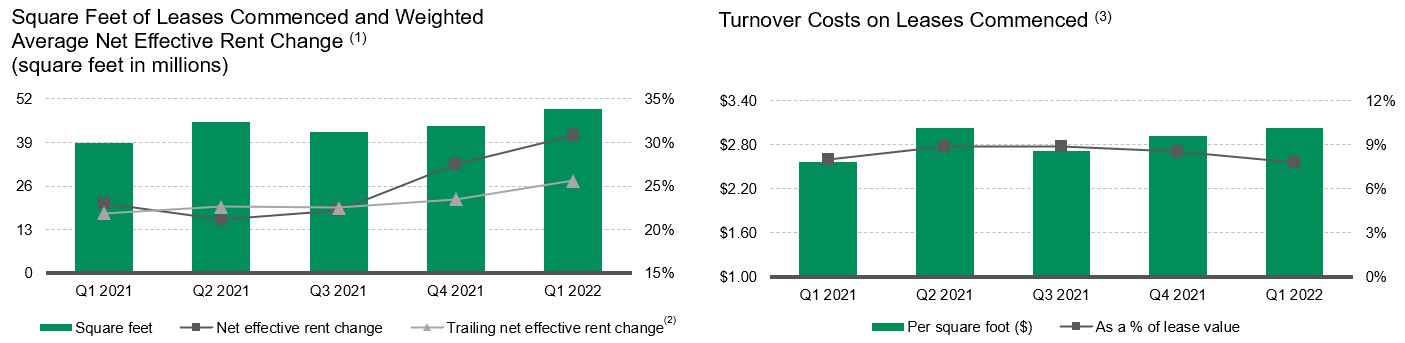
|
(1) |
Square feet of leases commenced and weighted average net effective rent change were calculated for leases with initial terms of one year or greater. We retained approximately 70% or more of our customers, based on the total square feet of leases commenced during these periods. |
|
(2) |
Calculated using the trailing twelve months immediately prior to the period ended. |
|
(3) |
Turnover costs include external leasing commissions and tenant improvements and represent the obligations incurred in connection with the lease commencement for leases greater than one year. |
Same Store Analysis
Our same store metrics are non-GAAP financial measures, which are commonly used in the real estate industry and expected from the financial community, on both a net effective and cash basis. We evaluate the performance of the operating properties we own and manage using a “same store” analysis because the population of properties in this analysis is consistent from period to period, which allows us and investors to analyze our ongoing business operations. We determine our same store metrics on property NOI, which is calculated as rental revenue less rental expense for the applicable properties in the same store population for both consolidated and unconsolidated properties based on our ownership interest, as further defined below.
We define our same store population for the three months ended March 31, 2022 as the properties in our O&M operating portfolio, including the property NOI for both consolidated properties and properties owned by the unconsolidated co-investment ventures, at January 1, 2021 and owned throughout the same three-month period in both 2021 and 2022. We believe the drivers of property NOI for the consolidated portfolio are generally the same for the properties owned by the ventures in which we invest and therefore we evaluate the same store metrics of the O&M portfolio based on Prologis’ ownership in the properties (“Prologis Share”). The same store population excludes properties held for sale to third parties, along with development properties that were not stabilized at the beginning of the period (January 1, 2021) and properties acquired or disposed of to third parties during the period. To derive an appropriate measure of period-to-period operating performance, we remove the effects of foreign currency exchange rate movements by using the reported period-end exchange rate to translate from local currency into the U.S. dollar for both periods.
38
As non-GAAP financial measures, the same store metrics have certain limitations as an analytical tool and may vary among real estate companies. As a result, we provide a reconciliation of Rental Revenues less Rental Expenses (“Property NOI”) (from our Consolidated Financial Statements prepared in accordance with U.S. GAAP) to our Same Store Property NOI measures, as follows for the three months ended March 31 (dollars in millions):
|
|
|
|
|
|
|
|
|
|
Percentage |
|
|
|
|
2022 |
|
|
2021 |
|
|
Change |
|
|||
|
Reconciliation of Consolidated Property NOI to Same Store Property NOI measures: |
|
||||||||||
|
|
|
|
|
|
|
|
|
|
|
|
|
|
Rental revenues |
$ |
1,077 |
|
|
$ |
1,022 |
|
|
|
|
|
|
Rental expenses |
|
(276 |
) |
|
|
(278 |
) |
|
|
|
|
|
Consolidated Property NOI |
|
801 |
|
|
|
744 |
|
|
|
|
|
|
|
|
|
|
|
|
|
|
|
|
|
|
|
Adjustments to derive same store results: |
|
|
|
|
|
|
|
|
|
|
|
|
Property NOI from consolidated properties not included in same store portfolio and other adjustments (1) |
|
(106 |
) |
|
|
(85 |
) |
|
|
|
|
|
Property NOI from unconsolidated co-investment ventures included in same store portfolio (1)(2) |
|
635 |
|
|
|
594 |
|
|
|
|
|
|
Third parties' share of Property NOI from properties included in same store portfolio (1)(2) |
|
(511 |
) |
|
|
(489 |
) |
|
|
|
|
|
Prologis Share of Same Store Property NOI – Net Effective (2) |
$ |
819 |
|
|
$ |
764 |
|
|
|
7.1 |
% |
|
Consolidated properties straight-line rent and fair value lease adjustments included in same store portfolio (3) |
|
(20 |
) |
|
|
(28 |
) |
|
|
|
|
|
Unconsolidated co-investment ventures straight-line rent and fair value lease adjustments included in same store portfolio (3) |
|
(16 |
) |
|
|
(20 |
) |
|
|
|
|
|
Third parties' share of straight-line rent and fair value lease adjustments included in same store portfolio (2)(3) |
|
13 |
|
|
|
16 |
|
|
|
|
|
|
Prologis Share of Same Store Property NOI – Cash (2)(3) |
$ |
796 |
|
|
$ |
732 |
|
|
|
8.7 |
% |
|
(1) |
We exclude properties held for sale to third parties, along with development properties that were not stabilized at the beginning of the period and properties acquired or disposed of to third parties during the period. We also exclude net termination and renegotiation fees to allow us to evaluate the growth or decline in each property’s rental revenues without regard to one-time items that are not indicative of the property’s recurring operating performance. Net termination and renegotiation fees represent the gross fee negotiated to allow a customer to terminate or renegotiate their lease, offset by the write-off of the asset recorded due to the adjustment to straight-line rents over the lease term. Same Store Property NOI is adjusted to include an allocation of property management expenses for our consolidated properties based on the property management services provided to each property (generally, based on a percentage of revenues). On consolidation, these amounts are eliminated and the actual costs of providing property management and leasing services are recognized as part of our consolidated rental expense. |
|
(2) |
We include the Property NOI for the same store portfolio for both consolidated properties and properties owned by the co-investment ventures based on our investment in the underlying properties. In order to calculate our share of Same Store Property NOI from the co-investment ventures in which we own less than 100%, we use the co-investment ventures’ underlying Property NOI for the same store portfolio and apply our ownership percentage at March 31, 2022 to the Property NOI for both periods, including the properties contributed during the period. We adjust the total Property NOI from the same store portfolio of the co-investment ventures by subtracting the third parties’ share of both consolidated and unconsolidated co-investment ventures. |
During the periods presented, certain wholly owned properties were contributed to a co-investment venture and are included in the same store portfolio. Neither our consolidated results nor those of the co-investment ventures, when viewed individually, would be comparable on a same store basis because of the changes in composition of the respective portfolios from period to period (e.g. the results of a contributed property are included in our consolidated results through the contribution date and in the results of the venture subsequent to the contribution date based on our ownership interest at the end of the period). As a result, only line items labeled “Prologis Share of Same Store Property NOI” are comparable period over period.
|
(3) |
We further remove certain noncash items (straight-line rent and amortization of fair value lease adjustments) included in the financial statements prepared in accordance with U.S. GAAP to reflect a Same Store Property NOI – Cash measure. |
We manage our business and compensate our executives based on the same store results of our O&M portfolio at 100% as we manage our portfolio on an ownership blind basis. We calculate those results by including 100% of the properties included in our same store portfolio.
39
Other Components of Income (Expense)
Earnings from Unconsolidated Entities, Net
We recognized net earnings from unconsolidated entities, which are accounted for using the equity method, of $77 million and $67 million for the three months ended March 31, 2022 and 2021, respectively.
The earnings we recognize can be impacted by: (i) variances in revenues and expenses of each venture; (ii) the size and occupancy rate of the portfolio of properties owned by each venture; (iii) gains or losses from the dispositions of properties and extinguishment of debt; (iv) our ownership interest in each venture; and (v) fluctuations in foreign currency exchange rates used to translate our share of net earnings to U.S. dollars.
See the discussion of our unconsolidated entities above in the Strategic Capital segment discussion and in Note 3 to the Consolidated Financial Statements for a further breakdown of our share of net earnings recognized.
Interest Expense
The following table details our net interest expense for the three months ended March 31 (dollars in millions):
|
|
|
2022 |
|
|
2021 |
|
||
|
Gross interest expense |
|
$ |
73 |
|
|
$ |
79 |
|
|
Amortization of debt discount and debt issuance costs, net |
|
|
2 |
|
|
|
2 |
|
|
Capitalized amounts |
|
|
(11 |
) |
|
|
(10 |
) |
|
Net interest expense |
|
$ |
64 |
|
|
$ |
71 |
|
|
Weighted average effective interest rate during the period |
|
|
1.6 |
% |
|
|
1.8 |
% |
See Note 5 to the Consolidated Financial Statements and the Liquidity and Capital Resources section below, for further discussion of our debt and borrowing costs.
Foreign Currency and Derivative Gains, Net
We are exposed to foreign currency exchange risk related to investments in and earnings from our foreign investments. We may use derivative financial instruments to manage foreign currency exchange rate risk related to our earnings. We recognize the change in fair value of the undesignated derivative contracts in unrealized gains and losses. Upon settlement of these transactions, we recognize realized gains or losses.
We primarily hedge our foreign currency risk related to our investments by borrowing in the currencies in which we invest thereby providing a natural hedge. We have issued debt in a currency that is not the same functional currency of the borrowing entity and have designated a portion of the debt as a nonderivative net investment hedge. We recognize the remeasurement and settlement of the translation adjustment on the unhedged portion of the debt and accrued interest in unrealized gains or losses.
The following table details our foreign currency and derivative gains, net for the three months ended March 31 (in millions):
|
|
|
2022 |
|
|
2021 |
|
||
|
Realized foreign currency and derivative gains (losses), net: |
|
|
|
|
|
|
|
|
|
Gains (losses) on the settlement of undesignated derivatives |
|
$ |
15 |
|
|
$ |
(1 |
) |
|
Losses on the settlement of transactions with third parties |
|
|
(1 |
) |
|
|
- |
|
|
Total realized foreign currency and derivative gains (losses), net |
|
|
14 |
|
|
|
(1 |
) |
|
|
|
|
|
|
|
|
|
|
|
Unrealized foreign currency and derivative gains (losses), net: |
|
|
|
|
|
|
|
|
|
Gains on the change in fair value of undesignated derivatives and unhedged debt |
|
|
30 |
|
|
|
84 |
|
|
Gains (losses) on remeasurement of certain assets and liabilities |
|
|
3 |
|
|
|
(3 |
) |
|
Total unrealized foreign currency and derivative gains, net |
|
|
33 |
|
|
|
81 |
|
|
Total foreign currency and derivative gains, net |
|
$ |
47 |
|
|
$ |
80 |
|
|
|
|
|
|
|
|
|
|
|
See Note 9 to the Consolidated Financial Statements for more information about our derivative and nonderivative transactions.
Income Tax Expense
We recognize income tax expense related to our taxable REIT subsidiaries and in the local, state and foreign jurisdictions in which we operate. Our current income tax expense (benefit) fluctuates from period to period based primarily on the timing of our taxable income, including gains on the disposition of properties and fees earned from the co-investment ventures. Deferred income tax expense
40
(benefit) is generally a function of the period’s temporary differences and the utilization of net operating losses generated in prior years that had been previously recognized as deferred income tax assets in taxable subsidiaries.
The following table summarizes our income tax expense (benefit) for the three months ended March 31 (in millions):
|
|
|
2022 |
|
|
2021 |
|
||
|
Current income tax expense (benefit): |
|
|
|
|
|
|
|
|
|
Income tax expense |
|
$ |
23 |
|
|
$ |
14 |
|
|
Income tax expense (benefit) on dispositions |
|
|
(1 |
) |
|
|
8 |
|
|
Income tax expense on dispositions related to acquired tax liabilities |
|
|
- |
|
|
|
3 |
|
|
Total current income tax expense |
|
|
22 |
|
|
|
25 |
|
|
|
|
|
|
|
|
|
|
|
|
Deferred income tax expense (benefit): |
|
|
|
|
|
|
|
|
|
Income tax expense |
|
|
7 |
|
|
|
4 |
|
|
Income tax benefit on dispositions related to acquired tax liabilities |
|
|
- |
|
|
|
(3 |
) |
|
Total deferred income tax expense |
|
|
7 |
|
|
|
1 |
|
|
Total income tax expense |
|
$ |
29 |
|
|
$ |
26 |
|
Net Earnings Attributable to Noncontrolling Interests
This amount represents the third-party investors’ share of the earnings generated in consolidated entities in which we do not own 100% of the equity, reduced by the third-party share of fees or promotes payable to us and earned during the period. We had net earnings attributable to noncontrolling interests of $69 million and $32 million for the three months ended March 31, 2022 and 2021, respectively. Included in these amounts were $32 million and $10 million for the three months ended March 31, 2022 and 2021, of net earnings attributable to the common limited partnership unitholders of Prologis, L.P.
See Note 6 to the Consolidated Financial Statements for further information on our noncontrolling interests.
Other Comprehensive Income (Loss)
The key driver of changes in Accumulated Other Comprehensive Income (Loss) (“AOCI/L”) during the three months ended March 31, 2022 and 2021, was the currency translation adjustment derived from changes in exchange rates during both periods primarily on our net investments in real estate outside the U.S. and the borrowings we issue in the functional currencies of the countries where we invest. These borrowings serve as a natural hedge of our foreign investments. In addition, we use derivative financial instruments, such as foreign currency forward and option contracts to manage foreign currency exchange rate risk related to our foreign investments, that when designated the change in fair value is included in AOCI/L.
See Note 9 to the Consolidated Financial Statements for more information on changes in other comprehensive income (loss) and about our derivative and nonderivative transactions.
LIQUIDITY AND CAPITAL RESOURCES
Overview
We consider our ability to generate cash from operating activities, distributions from our co-investment ventures, contributions and dispositions of properties and available financing sources to be adequate to meet our anticipated future development, acquisition, operating, debt service, dividend and distribution requirements.
Near-Term Principal Cash Sources and Uses
In addition to dividends and distributions, we expect our primary cash needs will consist of the following:
|
• |
completion of the development and leasing of the properties in our consolidated development portfolio (at March 31, 2022, 124 properties in our development portfolio were 51.2% leased with a current investment of $3.3 billion and a TEI of $5.5 billion when completed and leased, leaving $2.2 billion of estimated additional required investment); |
|
• |
development of new properties that we may hold for long-term investment or subsequently contribute to unconsolidated co-investment ventures, including the acquisition of land; |
|
• |
the acquisition of other real estate investments that we acquire with the intention of redeveloping into industrial properties; |
|
• |
capital expenditures and leasing costs on properties in our operating portfolio; |
41
|
• |
repayment of debt and scheduled principal payments of $792 million in the remainder of 2022 and $165 million in 2023; |
|
• |
additional investments in current and future unconsolidated co-investment ventures and other ventures; and |
|
• |
acquisition of operating properties or portfolios of operating properties (depending on market and other conditions) for direct, long-term investment in our consolidated portfolio (this might include acquisitions from our co-investment ventures). |
We expect to fund our cash needs principally from the following sources (subject to market conditions):
|
• |
net cash flow from property operations; |
|
• |
fees earned for services performed on behalf of co-investment ventures, including promotes; |
|
• |
distributions received from co-investment ventures; |
|
• |
proceeds from contributions of properties to current or future co-investment ventures; |
|
• |
proceeds from the disposition of properties or other investments to third parties; |
|
• |
available unrestricted cash balances ($1.9 billion at March 31, 2022); |
|
• |
borrowing capacity under our current credit facility arrangements ($4.9 billion available at March 31, 2022); and |
|
• |
proceeds from the issuance of debt. |
Long-term, we may also voluntarily repurchase our outstanding debt or equity securities (depending on prevailing market conditions, our liquidity, contractual restrictions and other factors) through cash purchases, open-market purchases, privately negotiated transactions, tender offers or otherwise. We may also fund our cash needs from the issuance of equity securities, subject to market conditions, and through the sale of a portion of our investments in co-investment ventures.
Debt
The following table summarizes information about our consolidated debt by currency (dollars in millions):
|
|
|
March 31, 2022 |
|
|
|
|
|
|
December 31, 2021 |
|
|
|
|
|
||||||||||
|
|
|
Weighted Average Interest Rate |
|
|
Amount Outstanding |
|
|
% of Total |
|
|
Weighted Average Interest Rate |
|
|
Amount Outstanding |
|
|
% of Total |
|
||||||
|
British pound sterling |
|
|
2.1 |
% |
|
$ |
1,340 |
|
|
|
7.3 |
% |
|
|
2.1 |
% |
|
$ |
1,377 |
|
|
|
7.8 |
% |
|
Canadian dollar |
|
|
2.9 |
% |
|
|
288 |
|
|
|
1.6 |
% |
|
|
2.7 |
% |
|
|
284 |
|
|
|
1.6 |
% |
|
Euro |
|
|
1.0 |
% |
|
|
8,580 |
|
|
|
46.7 |
% |
|
|
1.0 |
% |
|
|
7,408 |
|
|
|
41.8 |
% |
|
Japanese yen |
|
|
0.9 |
% |
|
|
2,722 |
|
|
|
14.8 |
% |
|
|
0.9 |
% |
|
|
2,879 |
|
|
|
16.2 |
% |
|
U.S. dollar |
|
|
2.5 |
% |
|
|
5,439 |
|
|
|
29.6 |
% |
|
|
2.6 |
% |
|
|
5,767 |
|
|
|
32.6 |
% |
|
Total debt (1) |
|
|
1.5 |
% |
|
$ |
18,369 |
|
|
|
100.0 |
% |
|
|
1.6 |
% |
|
$ |
17,715 |
|
|
|
100.0 |
% |
|
(1) |
The weighted average remaining maturity for total debt outstanding at March 31, 2022 and December 31, 2021 was 10 years. |
Our credit ratings at March 31, 2022, were A3 from Moody’s with a stable outlook and A- from Standard & Poor’s with a positive outlook. These ratings allow us to borrow at an advantageous interest rate. Adverse changes in our credit ratings could negatively impact our business and, in particular, our refinancing and other capital market activities, our ability to manage debt maturities, our future growth and our development and acquisition activity. A securities rating is not a recommendation to buy, sell or hold securities and is subject to revision or withdrawal at any time by the rating organization.
At March 31, 2022, we were in compliance with all of our financial debt covenants. These covenants include a number of customary financial covenants, such as maintaining debt service coverage ratios, leverage ratios and fixed charge coverage ratios.
See Note 5 to the Consolidated Financial Statements for further discussion on our debt.
Equity Commitments Related to Certain Co-Investment Ventures
Certain co-investment ventures have equity commitments from us and our venture partners. Our venture partners fulfill their equity commitment with cash. We may fulfill our equity commitment through contributions of properties or cash.
42
The following table summarizes the remaining equity commitments at March 31, 2022 (dollars in millions):
|
|
Equity Commitments (1) |
|
|
|
|||||||||
|
|
Prologis |
|
|
Venture Partners |
|
|
Total |
|
|
Expiration Date |
|||
|
Prologis Targeted U.S. Logistics Fund |
$ |
- |
|
|
$ |
2,125 |
|
|
$ |
2,125 |
|
|
2023 – 2025 (2) |
|
Prologis European Logistics Fund |
|
- |
|
|
|
1,723 |
|
|
|
1,723 |
|
|
2023 – 2025 (2) |
|
Prologis China Core Logistics Fund |
|
- |
|
|
|
134 |
|
|
|
134 |
|
|
2022 – 2024 (2) |
|
Prologis China Logistics Venture |
|
272 |
|
|
|
1,543 |
|
|
|
1,815 |
|
|
2023 – 2028 |
|
Prologis Brazil Logistics Venture |
|
47 |
|
|
|
188 |
|
|
|
235 |
|
|
2026 |
|
Total |
$ |
319 |
|
|
$ |
5,713 |
|
|
$ |
6,032 |
|
|
|
|
(1) |
The equity commitments for the co-investment ventures that operate in a different functional currency than the U.S. dollar were calculated using the foreign currency exchange rate at March 31, 2022. |
|
(2) |
Venture partners have the option to cancel their equity commitment starting 18 months after the initial commitment date. |
See the Cash Flow Summary below for more information about our investment activity in our co-investment ventures.
Cash Flow Summary
The following table summarizes our cash flow activity for the three months ended March 31 (in millions):
|
|
|
2022 |
|
|
2021 |
|
||
|
Net cash provided by operating activities |
|
$ |
842 |
|
|
$ |
817 |
|
|
Net cash provided by (used in) investing activities |
|
$ |
283 |
|
|
$ |
(107 |
) |
|
Net cash provided by (used in) financing activities |
|
$ |
242 |
|
|
$ |
(592 |
) |
|
Net increase in cash and cash equivalents, including the effect of foreign currency exchange rates on cash |
|
$ |
1,357 |
|
|
$ |
78 |
|
Operating Activities
Cash provided by and used in operating activities, exclusive of changes in receivables and payables, was impacted by the following significant activities during the three months ended March 31, 2022 and 2021:
|
• |
Real estate operations. We receive the majority of our operating cash through the net revenues of our Real Estate Operations segment, including the recovery of our operating costs. Cash flows generated by the Real Estate Operations segment are impacted by our acquisition, development and disposition activities which are drivers of NOI recognized during each period. See the Results of Operations section above for further explanation of our Real Estate Operations segment. The revenues from this segment include noncash adjustments for straight-lined rents and amortization of above and below market leases of $37 million in both 2022 and 2021. |
|
• |
Strategic capital. We also generate operating cash through our Strategic Capital segment by providing asset management and property management and other services to our unconsolidated co-investment ventures. See the Results of Operations section above for the key drivers of the net revenues from our Strategic Capital segment. Included in Strategic Capital Revenues is the third-party investors’ share that is owed for promotes, which is recognized in operating activities in the period the cash is received, generally the quarter after the revenue is recognized. |
|
• |
G&A expenses and equity-based compensation awards. We incurred $74 million and $78 million of G&A expenses in 2022 and 2021, respectively. We recognized equity-based, noncash compensation expenses of $41 million and $35 million in 2022 and 2021, respectively, which were recorded to Rental Expenses in the Real Estate Operations segment, Strategic Capital Expenses in the Strategic Capital segment and G&A Expenses. |
|
• |
Operating distributions from unconsolidated entities. We received $96 million and $116 million of distributions as a return on our investment from the cash flows generated from the operations of our unconsolidated entities in 2022 and 2021, respectively. |
|
• |
Cash paid for interest, net of amounts capitalized. We paid interest, net of amounts capitalized, of $63 million and $90 million in 2022 and 2021, respectively. |
|
• |
Cash paid for income taxes, net of refunds. We paid income taxes, net of refunds, of $31 million and $36 million in 2022 and 2021, respectively. |
43
Investing Activities
Cash provided by investing activities is driven by proceeds from the sale of real estate assets that included the contribution of properties we developed to our unconsolidated co-investment ventures as well as the sale of operating properties. Cash used in investing activities is primarily driven by our capital deployment activities of investing in real estate development, acquisitions and capital expenditures further discussed above. Acquisition activity included land for future development, operating properties and other real estate assets, including Covered Land Plays to support increased development activities in the future. See Note 2 to the Consolidated Financial Statements for further information on these activities. In addition, the following significant transactions also impacted our cash used in and provided by investing activities during the three months ended March 31, 2022 and 2021:
|
• |
Investments in and advances to our unconsolidated entities. We invested cash in our unconsolidated entities that represented our proportionate share, of $35 million and $142 million in 2022 and 2021, respectively. The ventures used the funds for the acquisition of properties, development and repayment of debt. See Note 3 to the Consolidated Financial Statements for more detail on our unconsolidated co-investment ventures. |
|
• |
Return of investment from unconsolidated entities. We received distributions from unconsolidated entities as a return of investment of $14 million and $38 million in 2022 and 2021, respectively. Included in these amounts were distributions from venture activities including proceeds from property sales, debt refinancing and the redemption of our investment in certain unconsolidated entities. |
Financing Activities
Cash provided by and used in financing activities is principally driven by proceeds from and payments on credit facilities and other debt, along with dividends paid on common and preferred stock and noncontrolling interest contributions and distributions.
Our repurchase of and payments on debt and proceeds from the issuance of debt consisted of the following activity for the three months ended March 31 (in millions):
|
|
|
2022 |
|
|
2021 |
|
||
|
Repurchase of and payments on debt (including extinguishment costs) |
|
|
|
|
|
|
|
|
|
Regularly scheduled debt principal payments and payments at maturity |
|
$ |
174 |
|
|
$ |
2 |
|
|
Secured mortgage debt |
|
|
159 |
|
|
|
285 |
|
|
Senior notes |
|
|
- |
|
|
|
1,645 |
|
|
Total |
|
$ |
333 |
|
|
$ |
1,932 |
|
|
|
|
|
|
|
|
|
|
|
|
Proceeds from the issuance of debt |
|
|
|
|
|
|
|
|
|
Senior notes |
|
$ |
1,841 |
|
|
$ |
2,030 |
|
|
Total |
|
$ |
1,841 |
|
|
$ |
2,030 |
|
Unconsolidated Co-Investment Venture Debt
We had investments in and advances to our unconsolidated co-investment ventures of $7.9 billion at March 31, 2022. These ventures had total third-party debt of $12.0 billion at March 31, 2022 with a weighted average remaining maturity of 8 years and weighted average interest rate of 2.6%. The weighted average loan-to-value ratio for all unconsolidated co-investment ventures was 25.4% at March 31, 2022 based on gross book value. Loan-to-value, a non-GAAP measure, was calculated as the percentage of total third-party debt to the gross book value of real estate for each venture and weighted based on the cumulative gross book value of all unconsolidated co-investment ventures.
At March 31, 2022, we did not guarantee any third-party debt of the unconsolidated co-investment ventures.
Dividend and Distribution Requirements
Our dividend policy on our common stock is to distribute a percentage of our cash flow to ensure that we will meet the dividend requirements of the IRC, relative to maintaining our REIT status, while still allowing us to retain cash to fund our capital deployment and other investment activities.
Under the IRC, REITs may be subject to certain federal income and excise taxes on undistributed taxable income.
We paid quarterly cash dividends of $0.79 and $0.63 per common share in the first quarter of 2022 and 2021, respectively. Our future common stock dividends, if and as declared, may vary and will be determined by the Board based upon the circumstances prevailing at the time, including our financial condition, operating results and REIT distribution requirements, and may be adjusted at the discretion of the Board during the year.
44
We make distributions on the common limited partnership units outstanding at the same per unit amount as our common stock dividend. The Class A Units in the OP are entitled to a quarterly distribution equal to $0.64665 per unit so long as the common units receive a quarterly distribution of at least $0.40 per unit. We paid a quarterly cash distribution of $0.64665 per Class A Unit in both the first quarter of 2022 and 2021.
At March 31, 2022, our Series Q preferred stock had an annual dividend rate of 8.54% per share and the dividends are payable quarterly in arrears.
Pursuant to the terms of our preferred stock, we are restricted from declaring or paying any dividend with respect to our common stock unless and until all cumulative dividends with respect to the preferred stock have been paid and sufficient funds have been set aside for dividends that have been declared for the relevant dividend period with respect to the preferred stock.
Other Commitments
On an ongoing basis, we are engaged in various stages of negotiations for the acquisition or disposition of individual properties or portfolios of properties.
NEW ACCOUNTING PRONOUNCEMENTS
See Note 1 to the Consolidated Financial Statements.
FUNDS FROM OPERATIONS ATTRIBUTABLE TO COMMON STOCKHOLDERS/UNITHOLDERS (“FFO”)
FFO is a non-GAAP financial measure that is commonly used in the real estate industry. The most directly comparable GAAP measure to FFO is net earnings.
The National Association of Real Estate Investment Trusts (“NAREIT”) defines FFO as earnings computed under GAAP to exclude historical cost depreciation and gains and losses from the sales net of any related tax, along with impairment charges, of previously depreciated properties. We also exclude the gains on revaluation of equity investments upon acquisition of a controlling interest and the gain recognized from a partial sale of our investment, as these are similar to gains from the sales of previously depreciated properties. We exclude similar adjustments from our unconsolidated entities and the third parties’ share of our consolidated co-investment ventures.
Our FFO Measures
Our FFO measures begin with NAREIT’s definition and we make certain adjustments to reflect our business and the way that management plans and executes our business strategy. While not infrequent or unusual, the additional items we adjust for in calculating FFO, as modified by Prologis and Core FFO, both as defined below, are subject to significant fluctuations from period to period. Although these items may have a material impact on our operations and are reflected in our financial statements, the removal of the effects of these items allows us to better understand the core operating performance of our properties over the long term. These items have both positive and negative short-term effects on our results of operations in inconsistent and unpredictable directions that are not relevant to our long-term outlook.
We calculate our FFO measures, as defined below, based on our proportionate ownership share of both our unconsolidated and consolidated ventures. We reflect our share of our FFO measures for unconsolidated ventures by applying our average ownership percentage for the period to the applicable reconciling items on an entity by entity basis. We reflect our share for consolidated ventures in which we do not own 100% of the equity by adjusting our FFO measures to remove the noncontrolling interests share of the applicable reconciling items based on our average ownership percentage for the applicable periods.
These FFO measures are used by management as supplemental financial measures of operating performance and we believe that it is important that stockholders, potential investors and financial analysts understand the measures management uses. We do not use our FFO measures as, nor should they be considered to be, alternatives to net earnings computed under GAAP, as indicators of our operating performance, as alternatives to cash from operating activities computed under GAAP or as indicators of our ability to fund our cash needs.
We analyze our operating performance principally by the rental revenue of our real estate and the revenues from our strategic capital business, net of operating, administrative and financing expenses. This income stream is not directly impacted by fluctuations in the market value of our investments in real estate or debt securities.
45
FFO, as modified by Prologis attributable to common stockholders/unitholders (“FFO, as modified by Prologis”)
To arrive at FFO, as modified by Prologis, we adjust the NAREIT defined FFO measure to exclude the impact of foreign currency related items and deferred tax, specifically:
|
• |
deferred income tax benefits and deferred income tax expenses recognized by our subsidiaries; |
|
• |
current income tax expense related to acquired tax liabilities that were recorded as deferred tax liabilities in an acquisition, to the extent the expense is offset with a deferred income tax benefit in earnings that is excluded from our defined FFO measure; and |
|
• |
foreign currency exchange gains and losses resulting from (i) debt transactions between us and our foreign entities, (ii) third-party debt that is used to hedge our investment in foreign entities, (iii) derivative financial instruments related to any such debt transactions, and (iv) mark-to-market adjustments associated with other derivative financial instruments. |
We use FFO, as modified by Prologis, so that management, analysts and investors are able to evaluate our performance against other REITs that do not have similar operations or operations in jurisdictions outside the U.S.
Core FFO attributable to common stockholders/unitholders (“Core FFO”)
In addition to FFO, as modified by Prologis, we also use Core FFO. To arrive at Core FFO, we adjust FFO, as modified by Prologis, to exclude the following recurring and nonrecurring items that we recognize directly in FFO, as modified by Prologis:
|
• |
gains or losses from the disposition of land and development properties that were developed with the intent to contribute or sell; |
|
• |
income tax expense related to the sale of investments in real estate; |
|
• |
impairment charges recognized related to our investments in real estate generally as a result of our change in intent to contribute or sell these properties; |
|
• |
gains or losses from the early extinguishment of debt and redemption and repurchase of preferred stock; and |
|
• |
expenses related to natural disasters. |
We use Core FFO, including by segment and region, to: (i) assess our operating performance as compared to other real estate companies; (ii) evaluate our performance and the performance of our properties in comparison with expected results and results of previous periods; (iii) evaluate the performance of our management; (iv) budget and forecast future results to assist in the allocation of resources; (v) provide guidance to the financial markets to understand our expected operating performance; and (vi) evaluate how a specific potential investment will impact our future results.
Limitations on the use of our FFO measures
While we believe our modified FFO measures are important supplemental measures, neither NAREIT’s nor our measures of FFO should be used alone because they exclude significant economic components of net earnings computed under GAAP and are, therefore, limited as an analytical tool. Accordingly, these are only a few of the many measures we use when analyzing our business. Some of the limitations are:
|
• |
The current income tax expenses that are excluded from our modified FFO measures represent the taxes that are payable. |
|
• |
Depreciation and amortization of real estate assets are economic costs that are excluded from FFO. FFO is limited, as it does not reflect the cash requirements that may be necessary for future replacements of the real estate assets. Furthermore, the amortization of capital expenditures and leasing costs necessary to maintain the operating performance of logistics facilities are not reflected in FFO. |
|
• |
Gains or losses from property dispositions and impairment charges related to expected dispositions represent changes in value of the properties. By excluding these gains and losses, FFO does not capture realized changes in the value of disposed properties arising from changes in market conditions. |
|
• |
The deferred income tax benefits and expenses that are excluded from our modified FFO measures result from the creation of a deferred income tax asset or liability that may have to be settled at some future point. Our modified FFO measures do not currently reflect any income or expense that may result from such settlement. |
|
• |
The foreign currency exchange gains and losses that are excluded from our modified FFO measures are generally recognized based on movements in foreign currency exchange rates through a specific point in time. The ultimate settlement of our foreign |
46
|
currency-denominated net assets is indefinite as to timing and amount. Our FFO measures are limited in that they do not reflect the current period changes in these net assets that result from periodic foreign currency exchange rate movements. |
|
• |
The gains and losses on extinguishment of debt or preferred stock that we exclude from our Core FFO, may provide a benefit or cost to us as we may be settling our obligation at less or more than our future obligation. |
|
• |
The natural disaster expenses that we exclude from Core FFO are costs that we have incurred. |
We compensate for these limitations by using our FFO measures only in conjunction with net earnings computed under GAAP when making our decisions. This information should be read with our complete Consolidated Financial Statements prepared under GAAP. To assist investors in compensating for these limitations, we reconcile our modified FFO measures to our net earnings computed under GAAP for three months ended March 31 as follows (in millions):
|
|
|
2022 |
|
|
2021 |
|
||
|
Reconciliation of net earnings attributable to common stockholders to FFO measures: |
|
|
|
|
|
|
|
|
|
Net earnings attributable to common stockholders |
|
$ |
1,149 |
|
|
$ |
366 |
|
|
|
|
|
|
|
|
|
|
|
|
Add (deduct) NAREIT defined adjustments: |
|
|
|
|
|
|
|
|
|
Real estate related depreciation and amortization |
|
|
385 |
|
|
|
388 |
|
|
Gains on other dispositions of investments in real estate, net of taxes |
|
|
(589 |
) |
|
|
(16 |
) |
|
Reconciling items related to noncontrolling interests |
|
|
17 |
|
|
|
(19 |
) |
|
Our share of reconciling items included in earnings related to unconsolidated entities |
|
|
82 |
|
|
|
79 |
|
|
NAREIT defined FFO attributable to common stockholders/unitholders |
|
|
1,044 |
|
|
|
798 |
|
|
|
|
|
|
|
|
|
|
|
|
Add (deduct) our modified adjustments: |
|
|
|
|
|
|
|
|
|
Unrealized foreign currency and derivative gains, net |
|
|
(33 |
) |
|
|
(81 |
) |
|
Deferred income tax expense |
|
|
7 |
|
|
|
1 |
|
|
Current income tax expense on dispositions related to acquired tax liabilities |
|
|
- |
|
|
|
3 |
|
|
Our share of reconciling items included in earnings related to unconsolidated entities |
|
|
- |
|
|
|
(1 |
) |
|
FFO, as modified by Prologis attributable to common stockholders/unitholders |
|
|
1,018 |
|
|
|
720 |
|
|
|
|
|
|
|
|
|
|
|
|
Adjustments to arrive at Core FFO: |
|
|
|
|
|
|
|
|
|
Gains on dispositions of development properties and land, net |
|
|
(210 |
) |
|
|
(174 |
) |
|
Current income tax expense on dispositions |
|
|
4 |
|
|
|
8 |
|
|
Losses on early extinguishment of debt and other, net |
|
|
18 |
|
|
|
187 |
|
|
Reconciling items related to noncontrolling interests |
|
|
4 |
|
|
|
- |
|
|
Our share of reconciling items included in earnings related to unconsolidated entities |
|
|
- |
|
|
|
1 |
|
|
Core FFO attributable to common stockholders/unitholders |
|
$ |
834 |
|
|
$ |
742 |
|
ITEM 3. Quantitative and Qualitative Disclosures About Market Risk
We are exposed to the impact of foreign exchange-related variability and earnings volatility on our foreign investments and interest rate changes. See our risk factors in Part 1, Item 1A. Risk Factors in our Annual Report on Form 10-K for the year ended December 31, 2021. See also Note 9 in the Consolidated Financial Statements in Item 1 for more information about our foreign operations and derivative financial instruments.
We monitor our market risk exposures using a sensitivity analysis. Our sensitivity analysis estimates the exposure to market risk sensitive instruments assuming a hypothetical 10% adverse change in foreign currency exchange rates or interest rates at March 31, 2022. The results of the sensitivity analysis are summarized in the following sections. The sensitivity analysis is of limited predictive value. As a result, revenues and expenses, as well as our ultimate realized gains or losses with respect to foreign currency exchange rate and interest rate fluctuations will depend on the exposures that arise during a future period, hedging strategies at the time and the prevailing foreign currency exchange rates and interest rates.
Foreign Currency Risk
We are exposed to foreign currency exchange variability related to investments in and earnings from our foreign investments. Foreign currency market risk is the possibility that our results of operations or financial position could be better or worse than planned because of changes in foreign currency exchange rates. We primarily hedge our foreign currency risk by borrowing in the currencies in which we invest thereby providing a natural hedge. Additionally, we hedge our foreign currency risk by entering into derivative financial instruments that we designate as net investment hedges, as these amounts offset the translation adjustments on the underlying net assets of our foreign investments. At March 31, 2022, after consideration of our ability to borrow in the foreign currencies in which we invest and also derivative and nonderivative financial instruments as discussed in Note 9 to the Consolidated Financial Statements, we
47
had minimal net equity denominated in a currency other than the U.S. dollar.
For the three months ended March 31, 2022, $120 million or 9.8% of our total consolidated revenue was denominated in foreign currencies. We enter into other foreign currency contracts, such as forwards, to reduce fluctuations in foreign currency associated with the translation of the future earnings of our international subsidiaries. We have forward contracts that were not designated as hedges, denominated principally in British pound sterling, Canadian dollar, euro and Japanese yen and have an aggregate notional amount of $1.9 billion to mitigate risk associated with the translation of the future earnings of our subsidiaries denominated in these currencies. The gain or loss on settlement of these contracts is included in our earnings and offsets the lower or higher translation of earnings from our investments denominated in currencies other than the U.S. dollar. Although the impact to net earnings is mitigated through higher translated U.S. dollar earnings from these currencies, a weakening of the U.S. dollar against these currencies by 10% could result in a $187 million cash payment on settlement of these contracts.
Interest Rate Risk
We are also exposed to the impact of interest rate changes on future earnings and cash flows. To mitigate that risk, we generally borrow with fixed rate debt and we may use derivative instruments to fix the interest rate on our variable rate debt. At March 31, 2022, $16.7 billion of our debt bore interest at fixed rates and therefore the fair value of these instruments was affected by changes in market interest rates. At March 31, 2022, $1.7 billion of our debt bore interest at variable rates. The following table summarizes the future repayment of debt and scheduled principal payments at March 31, 2022 (dollars in millions):
|
|
|
2022 |
|
|
2023 |
|
|
2024 |
|
|
2025 |
|
|
Thereafter |
|
|
Total |
|
|
Fair Value |
|
|||||||
|
Fixed rate debt |
|
$ |
459 |
|
|
$ |
29 |
|
|
$ |
7 |
|
|
$ |
188 |
|
|
$ |
16,062 |
|
|
$ |
16,745 |
|
|
$ |
15,552 |
|
|
Weighted average interest rate (1) |
|
|
-0.3 |
% |
|
|
3.6 |
% |
|
|
3.8 |
% |
|
|
3.1 |
% |
|
|
1.7 |
% |
|
|
1.7 |
% |
|
|
|
|
|
|
|
|
|
|
|
|
|
|
|
|
|
|
|
|
|
|
|
|
|
|
|
|
|
|
|
|
|
|
|
Variable rate debt |
|
|
|
|
|
|
|
|
|
|
|
|
|
|
|
|
|
|
|
|
|
|
|
|
|
|
|
|
|
Term loans |
|
$ |
- |
|
|
$ |
136 |
|
|
$ |
- |
|
|
$ |
- |
|
|
$ |
904 |
|
|
$ |
1,040 |
|
|
$ |
1,040 |
|
|
Senior notes |
|
|
333 |
|
|
|
- |
|
|
|
333 |
|
|
|
- |
|
|
|
- |
|
|
|
666 |
|
|
|
668 |
|
|
Total variable rate debt |
|
$ |
333 |
|
|
$ |
136 |
|
|
$ |
333 |
|
|
$ |
- |
|
|
$ |
904 |
|
|
$ |
1,706 |
|
|
$ |
1,708 |
|
|
(1) |
The weighted average interest rates represent the effective interest rates (including amortization of debt issuance costs and noncash premiums and discounts) at March 31, 2022 for the debt outstanding and include the impact of designated interest rate swaps, which effectively fix the interest rate on certain variable rate debt. |
At March 31, 2022, the weighted average effective interest rate on our variable rate debt was 0.4%. Changes in interest rates can cause interest expense to fluctuate on our variable rate debt. On the basis of our sensitivity analysis, a 10% increase in interest rates on our average outstanding variable rate debt balances would result in additional annual interest expense of $1 million for the quarter ended March 31, 2022, which equates to a change in interest rates of 4 basis points on our average outstanding variable rate debt balances and less than 1 basis point on our average total debt portfolio balances.
ITEM 4. Controls and Procedures
Controls and Procedures (Prologis, Inc.)
Prologis, Inc. carried out an evaluation under the supervision and with the participation of management, including the Chief Executive Officer and Chief Financial Officer, of the effectiveness of the disclosure controls and procedures (as defined in Rule 13a-14(c)) under the Securities and Exchange Act of 1934 (the “Exchange Act”) at March 31, 2022. Based on this evaluation, the Chief Executive Officer and the Chief Financial Officer have concluded that the disclosure controls and procedures are effective to ensure that information required to be disclosed by us in reports that we file or submit under the Exchange Act is recorded, processed, summarized and reported within the time periods specified in the SEC rules and forms.
Changes in Internal Control over Financial Reporting
There have not been any changes in Prologis, Inc.’s internal control over financial reporting (as defined in Rule 13a-15(f) under the Exchange Act) that occurred during the quarter ended March 31, 2022 that have materially affected, or are reasonably likely to materially affect, Prologis, Inc.’s internal control over financial reporting.
48
Controls and Procedures (Prologis, L.P.)
Prologis, L.P. carried out an evaluation under the supervision and with the participation of management, including the Chief Executive Officer and Chief Financial Officer, of the effectiveness of the disclosure controls and procedures (as defined in Rule 13a-14(c)) under the Exchange Act at March 31, 2022. Based on this evaluation, the Chief Executive Officer and the Chief Financial Officer have concluded that the disclosure controls and procedures are effective to ensure that information required to be disclosed by us in reports that we file or submit under the Exchange Act is recorded, processed, summarized and reported within the time periods specified in the SEC rules and forms.
Changes in Internal Control over Financial Reporting
There have not been any changes in Prologis, L.P.’s internal control over financial reporting (as defined in Rule 13a-15(f) under the Exchange Act) that occurred during the quarter ended March 31, 2022 that have materially affected, or are reasonably likely to materially affect, Prologis, L.P.’s internal control over financial reporting.
PART II. OTHER INFORMATION
ITEM 1. Legal Proceedings
Prologis and our unconsolidated entities are party to a variety of legal proceedings arising in the ordinary course of business. With respect to any such matters to which we are currently a party, the ultimate disposition of any such matters will not result in a material adverse effect on our business, financial position or results of operations.
ITEM 1A. Risk Factors
At March 31, 2022, no material changes had occurred in our risk factors as discussed in Item 1A. in our Annual Report on Form 10-K for the year ended December 31, 2021.
ITEM 2. Unregistered Sales of Equity Securities and Use of Proceeds
During the quarterly period ended March 31, 2022, we issued 0.1 million shares of common stock of Prologis, Inc. in connection with the redemption of common units of Prologis, L.P. in reliance on the exemption from registration requirements of the Securities Act of 1933, as amended, afforded by Section 4(a)(2) thereof.
ITEM 3. Defaults Upon Senior Securities
None.
ITEM 4. Mine Safety Disclosures
Not Applicable.
ITEM 5. Other Information
None.
ITEM 6. Exhibits
The exhibits required by this item are set forth on the Exhibit Index attached hereto.
49
INDEX TO EXHIBITS
Certain of the following documents are filed herewith. Certain other of the following documents that have been previously filed with the Securities and Exchange Commission (“SEC”) and, pursuant to Rule 12-b-32, are incorporated herein by reference.
|
|
|
|
4.1 |
|
|
|
|
|
4.2 |
|
|
|
|
|
4.3 |
|
|
|
|
|
4.4 |
|
|
|
|
|
4.5 |
|
|
|
|
|
4.6 |
|
|
|
|
|
15.1† |
|
|
|
|
|
15.2† |
|
|
|
|
|
22.1† |
|
|
|
|
|
31.1† |
|
|
|
|
|
31.2† |
|
|
|
|
|
31.3† |
|
|
|
|
|
31.4† |
|
|
|
|
|
32.1† |
|
|
|
|
|
32.2† |
|
|
|
|
|
101.INS† |
Inline XBRL Instance Document – the instance document does not appear in the Interactive Data File because its XBRL tags are embedded within the Inline XBRL Document. |
|
|
|
|
101.SCH† |
Inline XBRL Taxonomy Extension Schema |
|
|
|
|
101.CAL† |
Inline XBRL Taxonomy Extension Calculation Linkbase |
|
|
|
|
101.DEF† |
Inline XBRL Taxonomy Extension Definition Linkbase |
|
|
|
|
101.LAB† |
Inline XBRL Taxonomy Extension Label Linkbase |
|
|
|
|
101.PRE† |
Inline XBRL Taxonomy Extension Presentation Linkbase |
|
|
|
|
104 |
Cover Page Interactive Data File (formatted as Inline XBRL and contained in Exhibit 101). |
|
|
|
|
† |
Filed herewith
|
|
|
|
50
SIGNATURES
Pursuant to the requirements of Section 13 or 15(d) of the Exchange Act, the registrants have duly caused this report to be signed on their behalf by the undersigned, thereunto duly authorized.
|
|
PROLOGIS, INC. |
|
|
|
|
|
|
|
By: |
/s/ Timothy D. Arndt |
|
|
|
Timothy D. Arndt |
|
|
|
Chief Financial Officer |
|
|
|
|
|
|
By: |
/s/ Lori A. Palazzolo |
|
|
|
Lori A. Palazzolo |
|
|
|
Managing Director and Chief Accounting Officer |
|
|
|
|
|
|
PROLOGIS, L.P. |
|
|
|
By: |
Prologis, Inc., its general partner |
|
|
|
|
|
|
By: |
/s/ Timothy D. Arndt |
|
|
|
Timothy D. Arndt |
|
|
|
Chief Financial Officer |
|
|
|
|
|
|
By: |
/s/ Lori A. Palazzolo |
|
|
|
Lori A. Palazzolo |
|
|
|
Managing Director and Chief Accounting Officer |
|
|
|
|
Date: April 26, 2022
51