
UNITED STATES
SECURITIES AND EXCHANGE COMMISSION
Washington, D.C. 20549
FORM
|
☒ |
QUARTERLY REPORT PURSUANT TO SECTION 13 OR 15(d) OF THE SECURITIES EXCHANGE ACT OF 1934 |
For the quarterly period ended
|
☐ |
TRANSITION REPORT PURSUANT TO SECTION 13 OR 15(d) OF THE SECURITIES EXCHANGE ACT OF 1934 |
For the transition period from ______________ to ______________
Commission File Number:
Prologis, L.P.
(Exact name of registrant as specified in its charter)
|
Maryland (Prologis, Inc.) Delaware (Prologis, L.P.) |
|
94-3281941 (Prologis, Inc.) 94-3285362 (Prologis, L.P.) |
|
(State or other jurisdiction of incorporation or organization) |
|
(I.R.S. Employer Identification No.) |
|
|
|
|
|
|
|
|
|
(Address or principal executive offices) |
|
(Zip Code) |
(
(Registrants’ telephone number, including area code)
(Former name, former address and former fiscal year, if changed since last report)
Securities registered pursuant to Section 12(b) of the Act:
|
|
|
Title of Each Class |
|
Trading Symbol(s) |
|
Name of Each Exchange on Which Registered |
|
Prologis, Inc. |
|
Common Stock, $0.01 par value |
|
|
|
New York Stock Exchange |
|
Prologis, L.P. |
|
1.375% Notes due 2020 |
|
PLD/20A |
|
New York Stock Exchange |
|
Prologis, L.P. |
|
1.375% Notes due 2021 |
|
PLD/21 |
|
New York Stock Exchange |
|
Prologis, L.P. |
|
3.000% Notes due 2022 |
|
PLD/22 |
|
New York Stock Exchange |
|
Prologis, L.P. |
|
3.375% Notes due 2024 |
|
PLD/24 |
|
New York Stock Exchange |
|
Prologis, L.P. |
|
3.000% Notes due 2026 |
|
PLD/26 |
|
New York Stock Exchange |
|
Prologis, L.P. |
|
2.250% Notes due 2029 |
|
PLD/29 |
|
New York Stock Exchange |
|
Prologis, L.P. |
|
Floating Rate Notes due 2020 |
|
PLD/20B |
|
New York Stock Exchange |
Indicate by check mark whether the registrant (1) has filed all reports required to be filed by Section 13 or 15(d) of the Securities Exchange Act of 1934 during the preceding 12 months (or for such shorter period that the registrant was required to file such reports), and (2) has been subject to such filing for the past 90 days.
|
Prologis, Inc. |
|
☒ |
No |
☐ |
|
Prologis, L.P. |
Yes |
☒ |
No |
☐ |
Indicate by check mark whether the registrant has submitted electronically every Interactive Data File required to be submitted pursuant to Rule 405 of Regulation S-T (§232.405 of this chapter) during the preceding 12 months (or for such shorter periods that the registrant was required to submit such files).
|
Prologis, Inc. |
Yes |
☒ |
No |
☐ |
|
Prologis, L.P. |
Yes |
☒ |
No |
☐ |
Indicate by check mark whether the registrant is a large accelerated filer, an accelerated filer, a non-accelerated filer, smaller reporting company, or an emerging growth company. See definitions of “large accelerated filer”, “accelerated filer,” “smaller reporting company,” and “emerging growth company” in Rule 12b-2 of the Exchange Act:
|
Prologis, Inc.: |
|
|
|
|
|
|
Large accelerated filer ☒ |
|
Accelerated filer ☐ |
Non-accelerated filer ☐ |
Smaller reporting company ☐ |
Emerging growth company ☐ |
|
Prologis, L.P.: |
|
|
|
|
|
|
Large accelerated filer ☐ |
|
Accelerated filer ☐ |
Non-accelerated filer ☒ |
Smaller reporting company ☐ |
Emerging growth company ☐ |
If an emerging growth company, indicate by check mark if the registrant has elected not to use the extended transition period for complying with any new or revised financial accounting standards provided pursuant to Section 13(a) of the Exchange Act. ☐
Indicate by check mark whether the registrant is a shell company (as defined in Rule 12b-2 of the Securities Exchange Act of 1934).
|
Prologis, Inc. |
Yes |
☐ |
No |
☒ |
|
Prologis, L.P. |
Yes |
☐ |
No |
☒ |
The number of shares of Prologis, Inc.’s common stock outstanding at July 17, 2019, was approximately
EXPLANATORY NOTE
This report combines the quarterly reports on Form 10-Q for the period ended June 30, 2019, of Prologis, Inc. and Prologis, L.P. Unless stated otherwise or the context otherwise requires, references to “Prologis, Inc.” or the “Parent” mean Prologis, Inc. and its consolidated subsidiaries; and references to “Prologis, L.P.” or the “Operating Partnership” or the “OP” mean Prologis, L.P., and its consolidated subsidiaries. The terms “the Company,” “Prologis,” “we,” “our” or “us” means the Parent and the OP collectively.
The Parent is a real estate investment trust (a “REIT”) and the general partner of the OP. At June 30, 2019, the Parent owned 97.12% common general partnership interest in the OP and 100% of the preferred units in the OP. The remaining 2.88% common limited partnership interests are owned by unaffiliated investors and certain current and former directors and officers of the Parent.
We operate the Parent and the OP as one enterprise. The management of the Parent consists of the same members as the management of the OP. These members are officers of the Parent and employees of the OP or one of its subsidiaries. As sole general partner, the Parent has control of the OP through complete responsibility and discretion in the day-to-day management and therefore, consolidates the OP for financial reporting purposes. Because the only significant asset of the Parent is its investment in the OP, the assets and liabilities of the Parent and the OP are the same on their respective financial statements.
We believe combining the quarterly reports on Form 10-Q of the Parent and the OP into this single report results in the following benefits:
|
• |
enhances investors’ understanding of the Parent and the OP by enabling investors to view the business as a whole in the same manner as management views and operates the business; |
|
• |
eliminates duplicative disclosure and provides a more streamlined and readable presentation as a substantial portion of the Company’s disclosure applies to both the Parent and the OP; and |
|
• |
creates time and cost efficiencies through the preparation of one combined report instead of two separate reports. |
It is important to understand the few differences between the Parent and the OP in the context of how we operate the Company. The Parent does not conduct business itself, other than acting as the sole general partner of the OP and issuing public equity from time to time. The OP holds substantially all the assets of the business, directly or indirectly. The OP conducts the operations of the business and is structured as a partnership with no publicly traded equity. Except for net proceeds from equity issuances by the Parent, which are contributed to the OP in exchange for partnership units, the OP generates capital required by the business through the OP’s operations, incurrence of indebtedness and issuance of partnership units to third parties.
The presentation of noncontrolling interests, stockholders’ equity and partners’ capital are the main areas of difference between the consolidated financial statements of the Parent and those of the OP. The differences in the presentations between stockholders’ equity and partners’ capital result from the differences in the equity and capital issuances in the Parent and in the OP.
The preferred stock, common stock, additional paid-in capital, accumulated other comprehensive income (loss) and distributions in excess of net earnings of the Parent are presented as stockholders’ equity in the Parent’s consolidated financial statements. These items represent the common and preferred general partnership interests held by the Parent in the OP and are presented as general partner’s capital within partners’ capital in the OP’s consolidated financial statements. The common limited partnership interests held by the limited partners in the OP are presented as noncontrolling interest within equity in the Parent’s consolidated financial statements and as limited partners’ capital within partners’ capital in the OP’s consolidated financial statements.
To highlight the differences between the Parent and the OP, separate sections in this report, as applicable, individually discuss the Parent and the OP, including separate financial statements and separate Exhibit 31 and 32 certifications. In the sections that combine disclosure of the Parent and the OP, this report refers to actions or holdings as being actions or holdings of Prologis.
PROLOGIS
INDEX
PART I. FINANCIAL INFORMATION
ITEM 1. Financial Statements
PROLOGIS, INC.
CONSOLIDATED BALANCE SHEETS
(In thousands, except per share data)
|
|
|
|
|
|
|
|
|
|
|
June 30, 2019 |
|
|
December 31, |
|
||
|
|
(Unaudited) |
|
|
2018 |
|
||
|
ASSETS |
|
|
|
|
|
|
|
|
Investments in real estate properties |
$ |
|
|
|
$ |
|
|
|
Less accumulated depreciation |
|
|
|
|
|
|
|
|
Net investments in real estate properties |
|
|
|
|
|
|
|
|
Investments in and advances to unconsolidated entities |
|
|
|
|
|
|
|
|
Assets held for sale or contribution |
|
|
|
|
|
|
|
|
Net investments in real estate |
|
|
|
|
|
|
|
|
|
|
|
|
|
|
|
|
|
Lease right-of-use assets |
|
|
|
|
|
|
|
|
Cash and cash equivalents |
|
|
|
|
|
|
|
|
Other assets |
|
|
|
|
|
|
|
|
Total assets |
$ |
|
|
|
$ |
|
|
|
|
|
|
|
|
|
|
|
|
LIABILITIES AND EQUITY |
|
|
|
|
|
|
|
|
Liabilities: |
|
|
|
|
|
|
|
|
Debt |
$ |
|
|
|
$ |
|
|
|
Lease liabilities |
|
|
|
|
|
|
|
|
Accounts payable and accrued expenses |
|
|
|
|
|
|
|
|
Other liabilities |
|
|
|
|
|
|
|
|
Total liabilities |
|
|
|
|
|
|
|
|
|
|
|
|
|
|
|
|
|
Equity: |
|
|
|
|
|
|
|
|
Prologis, Inc. stockholders’ equity: |
|
|
|
|
|
|
|
|
Series Q preferred stock at stated liquidation preference of $ shares issued and outstanding and December 31, 2018 |
|
|
|
|
|
|
|
|
Common stock; $ June 30, 2019 and December 31, 2018, respectively |
|
|
|
|
|
|
|
|
Additional paid-in capital |
|
|
|
|
|
|
|
|
Accumulated other comprehensive loss |
|
( |
) |
|
|
( |
) |
|
Distributions in excess of net earnings |
|
( |
) |
|
|
( |
) |
|
Total Prologis, Inc. stockholders’ equity |
|
|
|
|
|
|
|
|
Noncontrolling interests |
|
|
|
|
|
|
|
|
Total equity |
|
|
|
|
|
|
|
|
Total liabilities and equity |
$ |
|
|
|
$ |
|
|
The accompanying notes are an integral part of these Consolidated Financial Statements.
1
PROLOGIS, INC.
CONSOLIDATED STATEMENTS OF INCOME
(Unaudited)
(In thousands, except per share amounts)
|
|
|
Three Months Ended |
|
|
Six Months Ended |
|
||||||||||
|
|
|
June 30, |
|
|
June 30, |
|
||||||||||
|
|
|
2019 |
|
|
2018 |
|
|
2019 |
|
|
2018 |
|
||||
|
Revenues: |
|
|
|
|
|
|
|
|
|
|
|
|
|
|
|
|
|
Rental |
|
$ |
|
|
|
$ |
|
|
|
$ |
|
|
|
$ |
|
|
|
Strategic capital |
|
|
|
|
|
|
|
|
|
|
|
|
|
|
|
|
|
Development management and other |
|
|
|
|
|
|
|
|
|
|
|
|
|
|
|
|
|
Total revenues |
|
|
|
|
|
|
|
|
|
|
|
|
|
|
|
|
|
Expenses: |
|
|
|
|
|
|
|
|
|
|
|
|
|
|
|
|
|
Rental |
|
|
|
|
|
|
|
|
|
|
|
|
|
|
|
|
|
Strategic capital |
|
|
|
|
|
|
|
|
|
|
|
|
|
|
|
|
|
General and administrative |
|
|
|
|
|
|
|
|
|
|
|
|
|
|
|
|
|
Depreciation and amortization |
|
|
|
|
|
|
|
|
|
|
|
|
|
|
|
|
|
Other |
|
|
|
|
|
|
|
|
|
|
|
|
|
|
|
|
|
Total expenses |
|
|
|
|
|
|
|
|
|
|
|
|
|
|
|
|
|
|
|
|
|
|
|
|
|
|
|
|
|
|
|
|
|
|
|
Operating income before gains on real estate transactions, net |
|
|
|
|
|
|
|
|
|
|
|
|
|
|
|
|
|
Gains on real estate transactions, net |
|
|
|
|
|
|
|
|
|
|
|
|
|
|
|
|
|
Operating income |
|
|
|
|
|
|
|
|
|
|
|
|
|
|
|
|
|
|
|
|
|
|
|
|
|
|
|
|
|
|
|
|
|
|
|
Other income (expense): |
|
|
|
|
|
|
|
|
|
|
|
|
|
|
|
|
|
Earnings from unconsolidated entities, net |
|
|
|
|
|
|
|
|
|
|
|
|
|
|
|
|
|
Interest expense |
|
|
( |
) |
|
|
( |
) |
|
|
( |
) |
|
|
( |
) |
|
Interest and other income, net |
|
|
|
|
|
|
|
|
|
|
|
|
|
|
|
|
|
Foreign currency and derivative gains, net |
|
|
|
|
|
|
|
|
|
|
|
|
|
|
|
|
|
Gains (losses) on early extinguishment of debt, net |
|
|
( |
) |
|
|
|
|
|
|
( |
) |
|
|
( |
) |
|
Total other income (expense) |
|
|
( |
) |
|
|
|
|
|
|
|
|
|
|
|
|
|
Earnings before income taxes |
|
|
|
|
|
|
|
|
|
|
|
|
|
|
|
|
|
Total income tax expense |
|
|
|
|
|
|
|
|
|
|
|
|
|
|
|
|
|
Consolidated net earnings |
|
|
|
|
|
|
|
|
|
|
|
|
|
|
|
|
|
Less net earnings attributable to noncontrolling interests |
|
|
|
|
|
|
|
|
|
|
|
|
|
|
|
|
|
Net earnings attributable to controlling interests |
|
|
|
|
|
|
|
|
|
|
|
|
|
|
|
|
|
Less preferred stock dividends |
|
|
|
|
|
|
|
|
|
|
|
|
|
|
|
|
|
Net earnings attributable to common stockholders |
|
$ |
|
|
|
$ |
|
|
|
$ |
|
|
|
$ |
|
|
|
|
|
|
|
|
|
|
|
|
|
|
|
|
|
|
|
|
|
Weighted average common shares outstanding – Basic |
|
|
|
|
|
|
|
|
|
|
|
|
|
|
|
|
|
Weighted average common shares outstanding – Diluted |
|
|
|
|
|
|
|
|
|
|
|
|
|
|
|
|
|
|
|
|
|
|
|
|
|
|
|
|
|
|
|
|
|
|
|
Net earnings per share attributable to common stockholders – Basic |
|
$ |
|
|
|
$ |
|
|
|
$ |
|
|
|
$ |
|
|
|
|
|
|
|
|
|
|
|
|
|
|
|
|
|
|
|
|
|
Net earnings per share attributable to common stockholders – Diluted |
|
$ |
|
|
|
$ |
|
|
|
$ |
|
|
|
$ |
|
|
The accompanying notes are an integral part of these Consolidated Financial Statements.
2
PROLOGIS, INC.
CONSOLIDATED STATEMENTS OF COMPREHENSIVE INCOME
(Unaudited)
(In thousands)
|
|
|
Three Months Ended |
|
|
Six Months Ended |
|
||||||||||
|
|
|
June 30, |
|
|
June 30, |
|
||||||||||
|
|
|
2019 |
|
|
2018 |
|
|
2019 |
|
|
2018 |
|
||||
|
Consolidated net earnings |
|
$ |
|
|
|
$ |
|
|
|
$ |
|
|
|
$ |
|
|
|
Other comprehensive income (loss): |
|
|
|
|
|
|
|
|
|
|
|
|
|
|
|
|
|
Foreign currency translation gains (losses), net |
|
|
( |
) |
|
|
( |
) |
|
|
|
|
|
|
( |
) |
|
Unrealized gains (losses) on derivative contracts, net |
|
|
( |
) |
|
|
|
|
|
|
( |
) |
|
|
( |
) |
|
Comprehensive income |
|
|
|
|
|
|
|
|
|
|
|
|
|
|
|
|
|
Net earnings attributable to noncontrolling interests |
|
|
( |
) |
|
|
( |
) |
|
|
( |
) |
|
|
( |
) |
|
Other comprehensive loss (income) attributable to noncontrolling interests |
|
|
|
|
|
|
|
|
|
|
( |
) |
|
|
|
|
|
Comprehensive income attributable to common stockholders |
|
$ |
|
|
|
$ |
|
|
|
$ |
|
|
|
$ |
|
|
|
|
|
|
|
|
|
|
|
|
|
|
|
|
|
|
|
|
The accompanying notes are an integral part of these Consolidated Financial Statements.
3
PROLOGIS, INC.
CONSOLIDATED STATEMENTS OF EQUITY
(Unaudited)
(In thousands)
Three Months Ended June 30, 2019 and 2018
|
|
|
|
|
|
Common Stock |
|
|
|
|
|
|
Accumulated |
|
|
Distributions |
|
|
|
|
|
|
|
|
|
|||||||
|
|
|
|
|
|
Number |
|
|
|
|
|
|
Additional |
|
|
Other |
|
|
in Excess of |
|
|
Non- |
|
|
|
|
|
|||||
|
|
Preferred |
|
|
of |
|
|
Par |
|
|
Paid-in |
|
|
Comprehensive |
|
|
Net |
|
|
controlling |
|
|
Total |
|
||||||||
|
|
Stock |
|
|
Shares |
|
|
Value |
|
|
Capital |
|
|
Income (Loss) |
|
|
Earnings |
|
|
Interests |
|
|
Equity |
|
||||||||
|
Balance at April 1, 2019 |
$ |
|
|
|
|
|
|
|
$ |
|
|
|
$ |
|
|
|
$ |
( |
) |
|
$ |
( |
) |
|
$ |
|
|
|
$ |
|
|
|
Consolidated net earnings |
|
- |
|
|
|
- |
|
|
|
- |
|
|
|
- |
|
|
|
- |
|
|
|
|
|
|
|
|
|
|
|
|
|
|
Effect of equity compensation plans |
|
- |
|
|
|
|
|
|
|
|
|
|
|
|
|
|
|
- |
|
|
|
- |
|
|
|
|
|
|
|
|
|
|
Capital contributions |
|
- |
|
|
|
- |
|
|
|
- |
|
|
|
- |
|
|
|
- |
|
|
|
- |
|
|
|
|
|
|
|
|
|
|
Redemption of noncontrolling interests |
|
- |
|
|
|
|
|
|
|
|
|
|
|
|
|
|
|
- |
|
|
|
- |
|
|
|
( |
) |
|
|
( |
) |
|
Foreign currency translation losses, net |
|
- |
|
|
|
- |
|
|
|
- |
|
|
|
- |
|
|
|
( |
) |
|
|
- |
|
|
|
( |
) |
|
|
( |
) |
|
Unrealized losses on derivative contracts, net |
|
- |
|
|
|
- |
|
|
|
- |
|
|
|
- |
|
|
|
( |
) |
|
|
- |
|
|
|
( |
) |
|
|
( |
) |
|
Reallocation of equity |
|
- |
|
|
|
- |
|
|
|
- |
|
|
|
( |
) |
|
|
- |
|
|
|
- |
|
|
|
|
|
|
|
- |
|
|
Dividends ($ and other |
|
- |
|
|
|
- |
|
|
|
- |
|
|
|
( |
) |
|
|
- |
|
|
|
( |
) |
|
|
( |
) |
|
|
( |
) |
|
Balance at June 30, 2019 |
$ |
|
|
|
|
|
|
|
$ |
|
|
|
$ |
|
|
|
$ |
( |
) |
|
$ |
( |
) |
|
$ |
|
|
|
$ |
|
|
|
Balance at April 1, 2018 |
$ |
|
|
|
|
|
|
|
$ |
|
|
|
$ |
|
|
|
$ |
( |
) |
|
$ |
( |
) |
|
$ |
|
|
|
$ |
|
|
|
Consolidated net earnings |
|
- |
|
|
|
- |
|
|
|
- |
|
|
|
- |
|
|
|
- |
|
|
|
|
|
|
|
|
|
|
|
|
|
|
Effect of equity compensation plans |
|
- |
|
|
|
|
|
|
|
|
|
|
|
|
|
|
|
- |
|
|
|
- |
|
|
|
|
|
|
|
|
|
|
Capital contributions |
|
- |
|
|
|
- |
|
|
|
- |
|
|
|
- |
|
|
|
- |
|
|
|
- |
|
|
|
|
|
|
|
|
|
|
Redemption of noncontrolling interests |
|
- |
|
|
|
- |
|
|
|
- |
|
|
|
( |
) |
|
|
- |
|
|
|
- |
|
|
|
( |
) |
|
|
( |
) |
|
Foreign currency translation losses, net |
|
- |
|
|
|
- |
|
|
|
- |
|
|
|
- |
|
|
|
( |
) |
|
|
- |
|
|
|
( |
) |
|
|
( |
) |
|
Unrealized gains on derivative contracts, net |
|
- |
|
|
|
- |
|
|
|
- |
|
|
|
- |
|
|
|
|
|
|
|
- |
|
|
|
|
|
|
|
|
|
|
Reallocation of equity |
|
- |
|
|
|
- |
|
|
|
- |
|
|
|
|
|
|
|
- |
|
|
|
- |
|
|
|
( |
) |
|
|
- |
|
|
Dividends ($ and other |
|
- |
|
|
|
- |
|
|
|
- |
|
|
|
( |
) |
|
|
- |
|
|
|
( |
) |
|
|
( |
) |
|
|
( |
) |
|
Balance at June 30, 2018 |
$ |
|
|
|
|
|
|
|
$ |
|
|
|
$ |
|
|
|
$ |
( |
) |
|
$ |
( |
) |
|
$ |
|
|
|
$ |
|
|
Six Months Ended June 30, 2019 and 2018
|
|
|
|
|
|
Common Stock |
|
|
|
|
|
|
Accumulated |
|
|
Distributions |
|
|
|
|
|
|
|
|
|
|||||||
|
|
|
|
|
|
Number |
|
|
|
|
|
|
Additional |
|
|
Other |
|
|
in Excess of |
|
|
Non- |
|
|
|
|
|
|||||
|
|
Preferred |
|
|
of |
|
|
Par |
|
|
Paid-in |
|
|
Comprehensive |
|
|
Net |
|
|
controlling |
|
|
Total |
|
||||||||
|
|
Stock |
|
|
Shares |
|
|
Value |
|
|
Capital |
|
|
Income (Loss) |
|
|
Earnings |
|
|
Interests |
|
|
Equity |
|
||||||||
|
Balance at January 1, 2019 |
$ |
|
|
|
|
|
|
|
$ |
|
|
|
$ |
|
|
|
$ |
( |
) |
|
$ |
( |
) |
|
$ |
|
|
|
$ |
|
|
|
Consolidated net earnings |
|
- |
|
|
|
- |
|
|
|
- |
|
|
|
- |
|
|
|
- |
|
|
|
|
|
|
|
|
|
|
|
|
|
|
Effect of equity compensation plans |
|
- |
|
|
|
|
|
|
|
|
|
|
|
|
|
|
|
- |
|
|
|
- |
|
|
|
|
|
|
|
|
|
|
Capital contributions |
|
- |
|
|
|
- |
|
|
|
- |
|
|
|
- |
|
|
|
- |
|
|
|
- |
|
|
|
|
|
|
|
|
|
|
Redemption of noncontrolling interests |
|
- |
|
|
|
|
|
|
|
|
|
|
|
|
|
|
|
- |
|
|
|
- |
|
|
|
( |
) |
|
|
( |
) |
|
Contribution to Brazil venture |
|
- |
|
|
|
- |
|
|
|
- |
|
|
|
- |
|
|
|
- |
|
|
|
- |
|
|
|
( |
) |
|
|
( |
) |
|
Foreign currency translation gains, net |
|
- |
|
|
|
- |
|
|
|
- |
|
|
|
- |
|
|
|
|
|
|
|
- |
|
|
|
|
|
|
|
|
|
|
Unrealized losses on derivative contracts, net |
|
- |
|
|
|
- |
|
|
|
- |
|
|
|
- |
|
|
|
( |
) |
|
|
- |
|
|
|
( |
) |
|
|
( |
) |
|
Reallocation of equity |
|
- |
|
|
|
- |
|
|
|
- |
|
|
|
( |
) |
|
|
- |
|
|
|
- |
|
|
|
|
|
|
|
- |
|
|
Dividends ($ and other |
|
- |
|
|
|
- |
|
|
|
- |
|
|
|
( |
) |
|
|
- |
|
|
|
( |
) |
|
|
( |
) |
|
|
( |
) |
|
Balance at June 30, 2019 |
$ |
|
|
|
|
|
|
|
$ |
|
|
|
$ |
|
|
|
$ |
( |
) |
|
$ |
( |
) |
|
$ |
|
|
|
$ |
|
|
|
Balance at January 1, 2018 |
$ |
|
|
|
|
|
|
|
$ |
|
|
|
$ |
|
|
|
$ |
( |
) |
|
$ |
( |
) |
|
$ |
|
|
|
$ |
|
|
|
Consolidated net earnings |
|
- |
|
|
|
- |
|
|
|
- |
|
|
|
- |
|
|
|
- |
|
|
|
|
|
|
|
|
|
|
|
|
|
|
Effect of equity compensation plans |
|
- |
|
|
|
|
|
|
|
|
|
|
|
|
|
|
|
- |
|
|
|
- |
|
|
|
|
|
|
|
|
|
|
Capital contributions |
|
- |
|
|
|
- |
|
|
|
- |
|
|
|
- |
|
|
|
- |
|
|
|
- |
|
|
|
|
|
|
|
|
|
|
Redemption of noncontrolling interests |
|
- |
|
|
|
- |
|
|
|
- |
|
|
|
( |
) |
|
|
- |
|
|
|
- |
|
|
|
( |
) |
|
|
( |
) |
|
Foreign currency translation losses, net |
|
- |
|
|
|
- |
|
|
|
- |
|
|
|
- |
|
|
|
( |
) |
|
|
- |
|
|
|
( |
) |
|
|
( |
) |
|
Unrealized losses on derivative contracts, net |
|
- |
|
|
|
- |
|
|
|
- |
|
|
|
- |
|
|
|
( |
) |
|
|
- |
|
|
|
( |
) |
|
|
( |
) |
|
Reallocation of equity |
|
- |
|
|
|
- |
|
|
|
- |
|
|
|
( |
) |
|
|
- |
|
|
|
- |
|
|
|
|
|
|
|
- |
|
|
Dividends ($ and other |
|
- |
|
|
|
- |
|
|
|
- |
|
|
|
( |
) |
|
|
- |
|
|
|
( |
) |
|
|
( |
) |
|
|
( |
) |
|
Balance at June 30, 2018 |
$ |
|
|
|
|
|
|
|
$ |
|
|
|
$ |
|
|
|
$ |
( |
) |
|
$ |
( |
) |
|
$ |
|
|
|
$ |
|
|
The accompanying notes are an integral part of these Consolidated Financial Statements.
4
PROLOGIS, INC.
CONSOLIDATED STATEMENTS OF CASH FLOWS
(Unaudited)
(In thousands)
|
|
|
Six Months Ended |
|
|||||
|
|
|
June 30, |
|
|||||
|
|
|
2019 |
|
|
2018 |
|
||
|
Operating activities: |
|
|
|
|
|
|
|
|
|
Consolidated net earnings |
|
$ |
|
|
|
$ |
|
|
|
Adjustments to reconcile net earnings to net cash provided by operating activities: |
|
|
|
|
|
|
|
|
|
Straight-lined rents and amortization of above and below market leases |
|
|
( |
) |
|
|
( |
) |
|
Equity-based compensation awards |
|
|
|
|
|
|
|
|
|
Depreciation and amortization |
|
|
|
|
|
|
|
|
|
Earnings from unconsolidated entities, net |
|
|
( |
) |
|
|
( |
) |
|
Operating distributions from unconsolidated entities |
|
|
|
|
|
|
|
|
|
Decrease in operating receivables from unconsolidated entities |
|
|
|
|
|
|
|
|
|
Amortization of debt discounts, net and debt issuance costs |
|
|
|
|
|
|
|
|
|
Gains on real estate transactions, net |
|
|
( |
) |
|
|
( |
) |
|
Unrealized foreign currency and derivative gains, net |
|
|
( |
) |
|
|
( |
) |
|
Losses on early extinguishment of debt, net |
|
|
|
|
|
|
|
|
|
Deferred income tax expense (benefit) |
|
|
|
|
|
|
( |
) |
|
Increase in accounts receivable, lease right-of-use assets and other assets |
|
|
( |
) |
|
|
( |
) |
|
Decrease in accounts payable and accrued expenses, lease liabilities and other liabilities |
|
|
( |
) |
|
|
( |
) |
|
Net cash provided by operating activities |
|
|
|
|
|
|
|
|
|
Investing activities: |
|
|
|
|
|
|
|
|
|
Real estate development |
|
|
( |
) |
|
|
( |
) |
|
Real estate acquisitions |
|
|
( |
) |
|
|
( |
) |
|
Tenant improvements and lease commissions on previously leased space |
|
|
( |
) |
|
|
( |
) |
|
Property improvements |
|
|
( |
) |
|
|
( |
) |
|
Proceeds from dispositions and contributions of real estate properties |
|
|
|
|
|
|
|
|
|
Investments in and advances to unconsolidated entities |
|
|
( |
) |
|
|
( |
) |
|
Return of investment from unconsolidated entities |
|
|
|
|
|
|
|
|
|
Proceeds from repayment of notes receivable backed by real estate |
|
|
|
|
|
|
|
|
|
Proceeds from the settlement of net investment hedges |
|
|
|
|
|
|
|
|
|
Payments on the settlement of net investment hedges |
|
|
( |
) |
|
|
( |
) |
|
Net cash provided by (used in) investing activities |
|
|
|
|
|
|
( |
) |
|
Financing activities: |
|
|
|
|
|
|
|
|
|
Proceeds from issuance of common stock |
|
|
|
|
|
|
|
|
|
Dividends paid on common and preferred stock |
|
|
( |
) |
|
|
( |
) |
|
Noncontrolling interests contributions |
|
|
|
|
|
|
|
|
|
Noncontrolling interests distributions |
|
|
( |
) |
|
|
( |
) |
|
Settlement of noncontrolling interests |
|
|
( |
) |
|
|
( |
) |
|
Tax paid for shares withheld |
|
|
( |
) |
|
|
( |
) |
|
Debt issuance costs paid |
|
|
( |
) |
|
|
( |
) |
|
Net proceeds from (payments on) credit facilities |
|
|
|
|
|
|
( |
) |
|
Repurchase of and payments on debt |
|
|
( |
) |
|
|
( |
) |
|
Proceeds from the issuance of debt |
|
|
|
|
|
|
|
|
|
Net cash used in financing activities |
|
|
( |
) |
|
|
( |
) |
|
|
|
|
|
|
|
|
|
|
|
Effect of foreign currency exchange rate changes on cash |
|
|
|
|
|
|
( |
) |
|
Net increase in cash and cash equivalents |
|
|
|
|
|
|
|
|
|
Cash and cash equivalents, beginning of period |
|
|
|
|
|
|
|
|
|
Cash and cash equivalents, end of period |
|
$ |
|
|
|
$ |
|
|
See Note 12 for information on noncash investing and financing activities and other information.
The accompanying notes are an integral part of these Consolidated Financial Statements.
5
PROLOGIS, L.P.
CONSOLIDATED BALANCE SHEETS
(In thousands)
|
|
|
|
|
|
|
|
|
|
|
June 30, 2019 |
|
|
December 31, |
|
||
|
|
(Unaudited) |
|
|
2018 |
|
||
|
ASSETS |
|
|
|
|
|
|
|
|
Investments in real estate properties |
$ |
|
|
|
$ |
|
|
|
Less accumulated depreciation |
|
|
|
|
|
|
|
|
Net investments in real estate properties |
|
|
|
|
|
|
|
|
Investments in and advances to unconsolidated entities |
|
|
|
|
|
|
|
|
Assets held for sale or contribution |
|
|
|
|
|
|
|
|
Net investments in real estate |
|
|
|
|
|
|
|
|
|
|
|
|
|
|
|
|
|
Lease right-of-use assets |
|
|
|
|
|
|
|
|
Cash and cash equivalents |
|
|
|
|
|
|
|
|
Other assets |
|
|
|
|
|
|
|
|
Total assets |
$ |
|
|
|
$ |
|
|
|
|
|
|
|
|
|
|
|
|
LIABILITIES AND CAPITAL |
|
|
|
|
|
|
|
|
Liabilities: |
|
|
|
|
|
|
|
|
Debt |
$ |
|
|
|
$ |
|
|
|
Lease liabilities |
|
|
|
|
|
|
|
|
Accounts payable and accrued expenses |
|
|
|
|
|
|
|
|
Other liabilities |
|
|
|
|
|
|
|
|
Total liabilities |
|
|
|
|
|
|
|
|
|
|
|
|
|
|
|
|
|
Capital: |
|
|
|
|
|
|
|
|
Partners’ capital: |
|
|
|
|
|
|
|
|
General partner – preferred |
|
|
|
|
|
|
|
|
General partner – common |
|
|
|
|
|
|
|
|
Limited partners – common |
|
|
|
|
|
|
|
|
Limited partners – Class A common |
|
|
|
|
|
|
|
|
Total partners’ capital |
|
|
|
|
|
|
|
|
Noncontrolling interests |
|
|
|
|
|
|
|
|
Total capital |
|
|
|
|
|
|
|
|
Total liabilities and capital |
$ |
|
|
|
$ |
|
|
The accompanying notes are an integral part of these Consolidated Financial Statements.
6
PROLOGIS, L.P.
CONSOLIDATED STATEMENTS OF INCOME
(Unaudited)
(In thousands, except per unit amounts)
|
|
|
Three Months Ended |
|
|
Six Months Ended |
|
||||||||||
|
|
|
June 30, |
|
|
June 30, |
|
||||||||||
|
|
|
2019 |
|
|
2018 |
|
|
2019 |
|
|
2018 |
|
||||
|
Revenues: |
|
|
|
|
|
|
|
|
|
|
|
|
|
|
|
|
|
Rental |
|
$ |
|
|
|
$ |
|
|
|
$ |
|
|
|
$ |
|
|
|
Strategic capital |
|
|
|
|
|
|
|
|
|
|
|
|
|
|
|
|
|
Development management and other |
|
|
|
|
|
|
|
|
|
|
|
|
|
|
|
|
|
Total revenues |
|
|
|
|
|
|
|
|
|
|
|
|
|
|
|
|
|
Expenses: |
|
|
|
|
|
|
|
|
|
|
|
|
|
|
|
|
|
Rental |
|
|
|
|
|
|
|
|
|
|
|
|
|
|
|
|
|
Strategic capital |
|
|
|
|
|
|
|
|
|
|
|
|
|
|
|
|
|
General and administrative |
|
|
|
|
|
|
|
|
|
|
|
|
|
|
|
|
|
Depreciation and amortization |
|
|
|
|
|
|
|
|
|
|
|
|
|
|
|
|
|
Other |
|
|
|
|
|
|
|
|
|
|
|
|
|
|
|
|
|
Total expenses |
|
|
|
|
|
|
|
|
|
|
|
|
|
|
|
|
|
|
|
|
|
|
|
|
|
|
|
|
|
|
|
|
|
|
|
Operating income before gains on real estate transactions, net |
|
|
|
|
|
|
|
|
|
|
|
|
|
|
|
|
|
Gains on real estate transactions, net |
|
|
|
|
|
|
|
|
|
|
|
|
|
|
|
|
|
Operating income |
|
|
|
|
|
|
|
|
|
|
|
|
|
|
|
|
|
|
|
|
|
|
|
|
|
|
|
|
|
|
|
|
|
|
|
Other income (expense): |
|
|
|
|
|
|
|
|
|
|
|
|
|
|
|
|
|
Earnings from unconsolidated entities, net |
|
|
|
|
|
|
|
|
|
|
|
|
|
|
|
|
|
Interest expense |
|
|
( |
) |
|
|
( |
) |
|
|
( |
) |
|
|
( |
) |
|
Interest and other income, net |
|
|
|
|
|
|
|
|
|
|
|
|
|
|
|
|
|
Foreign currency and derivative gains, net |
|
|
|
|
|
|
|
|
|
|
|
|
|
|
|
|
|
Gains (losses) on early extinguishment of debt, net |
|
|
( |
) |
|
|
|
|
|
|
( |
) |
|
|
( |
) |
|
Total other income (expense) |
|
|
( |
) |
|
|
|
|
|
|
|
|
|
|
|
|
|
Earnings before income taxes |
|
|
|
|
|
|
|
|
|
|
|
|
|
|
|
|
|
Total income tax expense |
|
|
|
|
|
|
|
|
|
|
|
|
|
|
|
|
|
Consolidated net earnings |
|
|
|
|
|
|
|
|
|
|
|
|
|
|
|
|
|
Less net earnings attributable to noncontrolling interests |
|
|
|
|
|
|
|
|
|
|
|
|
|
|
|
|
|
Net earnings attributable to controlling interests |
|
|
|
|
|
|
|
|
|
|
|
|
|
|
|
|
|
Less preferred unit distributions |
|
|
|
|
|
|
|
|
|
|
|
|
|
|
|
|
|
Net earnings attributable to common unitholders |
|
$ |
|
|
|
$ |
|
|
|
$ |
|
|
|
$ |
|
|
|
|
|
|
|
|
|
|
|
|
|
|
|
|
|
|
|
|
|
Weighted average common units outstanding – Basic |
|
|
|
|
|
|
|
|
|
|
|
|
|
|
|
|
|
Weighted average common units outstanding – Diluted |
|
|
|
|
|
|
|
|
|
|
|
|
|
|
|
|
|
|
|
|
|
|
|
|
|
|
|
|
|
|
|
|
|
|
|
Net earnings per unit attributable to common unitholders – Basic |
|
$ |
|
|
|
$ |
|
|
|
$ |
|
|
|
$ |
|
|
|
|
|
|
|
|
|
|
|
|
|
|
|
|
|
|
|
|
|
Net earnings per unit attributable to common unitholders – Diluted |
|
$ |
|
|
|
$ |
|
|
|
$ |
|
|
|
$ |
|
|
The accompanying notes are an integral part of these Consolidated Financial Statements.
7
PROLOGIS, L.P.
CONSOLIDATED STATEMENTS OF COMPREHENSIVE INCOME
(Unaudited)
(In thousands)
|
|
|
Three Months Ended |
|
|
Six Months Ended |
|
||||||||||
|
|
|
June 30, |
|
|
June 30, |
|
||||||||||
|
|
|
2019 |
|
|
2018 |
|
|
2019 |
|
|
2018 |
|
||||
|
Consolidated net earnings |
|
$ |
|
|
|
$ |
|
|
|
$ |
|
|
|
$ |
|
|
|
Other comprehensive income (loss): |
|
|
|
|
|
|
|
|
|
|
|
|
|
|
|
|
|
Foreign currency translation gains (losses), net |
|
|
( |
) |
|
|
( |
) |
|
|
|
|
|
|
( |
) |
|
Unrealized gains (losses) on derivative contracts, net |
|
|
( |
) |
|
|
|
|
|
|
( |
) |
|
|
( |
) |
|
Comprehensive income |
|
|
|
|
|
|
|
|
|
|
|
|
|
|
|
|
|
Net earnings attributable to noncontrolling interests |
|
|
( |
) |
|
|
( |
) |
|
|
( |
) |
|
|
( |
) |
|
Other comprehensive loss (income) attributable to noncontrolling interests |
|
|
( |
) |
|
|
|
|
|
|
( |
) |
|
|
|
|
|
Comprehensive income attributable to common unitholders |
|
$ |
|
|
|
$ |
|
|
|
$ |
|
|
|
$ |
|
|
|
|
|
|
|
|
|
|
|
|
|
|
|
|
|
|
|
|
The accompanying notes are an integral part of these Consolidated Financial Statements.
8
PROLOGIS, L.P.
CONSOLIDATED STATEMENTS OF CAPITAL
(Unaudited)
(In thousands)
Three Months Ended June 30, 2019 and 2018
|
|
General Partner |
|
|
Limited Partners |
|
|
Non- |
|
|
|
|
|
|||||||||||||||||||||||||||
|
|
Preferred |
|
|
Common |
|
|
Common |
|
|
Class A Common |
|
|
controlling |
|
|
|
|
|
|||||||||||||||||||||
|
|
Units |
|
|
Amount |
|
|
Units |
|
|
Amount |
|
|
Units |
|
|
Amount |
|
|
Units |
|
|
Amount |
|
|
Interests |
|
|
Total |
|
||||||||||
|
Balance at April 1, 2019 |
|
|
|
|
$ |
|
|
|
|
|
|
|
$ |
|
|
|
|
|
|
|
$ |
|
|
|
|
|
|
|
$ |
|
|
|
$ |
|
|
|
$ |
|
|
|
Consolidated net earnings |
|
- |
|
|
|
- |
|
|
|
- |
|
|
|
|
|
|
|
- |
|
|
|
|
|
|
|
- |
|
|
|
|
|
|
|
|
|
|
|
|
|
|
Effect of equity compensation plans |
|
- |
|
|
|
- |
|
|
|
|
|
|
|
|
|
|
|
|
|
|
|
|
|
|
|
- |
|
|
|
- |
|
|
|
- |
|
|
|
|
|
|
Capital contributions |
|
- |
|
|
|
- |
|
|
|
- |
|
|
|
- |
|
|
|
- |
|
|
|
- |
|
|
|
- |
|
|
|
- |
|
|
|
|
|
|
|
|
|
|
Redemption of limited partners units |
|
- |
|
|
|
- |
|
|
|
|
|
|
|
|
|
|
|
( |
) |
|
|
( |
) |
|
|
- |
|
|
|
- |
|
|
|
- |
|
|
|
( |
) |
|
Foreign currency translation gains (losses), net |
|
- |
|
|
|
- |
|
|
|
- |
|
|
|
( |
) |
|
|
- |
|
|
|
( |
) |
|
|
- |
|
|
|
( |
) |
|
|
|
|
|
|
( |
) |
|
Unrealized losses on derivative contracts, net |
|
- |
|
|
|
- |
|
|
|
- |
|
|
|
( |
) |
|
|
- |
|
|
|
( |
) |
|
|
- |
|
|
|
( |
) |
|
|
- |
|
|
|
( |
) |
|
Reallocation of capital |
|
- |
|
|
|
- |
|
|
|
- |
|
|
|
( |
) |
|
|
- |
|
|
|
|
|
|
|
- |
|
|
|
|
|
|
|
- |
|
|
|
- |
|
|
Distributions ($ |
|
- |
|
|
|
- |
|
|
|
- |
|
|
|
( |
) |
|
|
- |
|
|
|
( |
) |
|
|
- |
|
|
|
( |
) |
|
|
( |
) |
|
|
( |
) |
|
Balance at June 30, 2019 |
|
|
|
|
$ |
|
|
|
|
|
|
|
$ |
|
|
|
|
|
|
|
$ |
|
|
|
|
|
|
|
$ |
|
|
|
$ |
|
|
|
$ |
|
|
|
Balance at April 1, 2018 |
|
|
|
|
$ |
|
|
|
|
|
|
|
$ |
|
|
|
|
|
|
|
$ |
|
|
|
|
|
|
|
$ |
|
|
|
$ |
|
|
|
$ |
|
|
|
Consolidated net earnings |
|
- |
|
|
|
- |
|
|
|
- |
|
|
|
|
|
|
|
- |
|
|
|
|
|
|
|
- |
|
|
|
|
|
|
|
|
|
|
|
|
|
|
Effect of equity compensation plans |
|
- |
|
|
|
- |
|
|
|
|
|
|
|
|
|
|
|
|
|
|
|
|
|
|
|
- |
|
|
|
- |
|
|
|
- |
|
|
|
|
|
|
Capital contributions |
|
- |
|
|
|
- |
|
|
|
- |
|
|
|
- |
|
|
|
- |
|
|
|
- |
|
|
|
- |
|
|
|
- |
|
|
|
|
|
|
|
|
|
|
Redemption of noncontrolling interests |
|
- |
|
|
|
- |
|
|
|
- |
|
|
|
( |
) |
|
|
- |
|
|
|
- |
|
|
|
- |
|
|
|
- |
|
|
|
( |
) |
|
|
( |
) |
|
Redemption of limited partners units |
|
- |
|
|
|
- |
|
|
|
- |
|
|
|
- |
|
|
|
( |
) |
|
|
( |
) |
|
|
( |
) |
|
|
( |
) |
|
|
- |
|
|
|
( |
) |
|
Foreign currency translation losses, net |
|
- |
|
|
|
- |
|
|
|
- |
|
|
|
( |
) |
|
|
- |
|
|
|
( |
) |
|
|
- |
|
|
|
( |
) |
|
|
( |
) |
|
|
( |
) |
|
Unrealized gains on derivative contracts, net |
|
- |
|
|
|
- |
|
|
|
- |
|
|
|
|
|
|
|
- |
|
|
|
|
|
|
|
- |
|
|
|
|
|
|
|
- |
|
|
|
|
|
|
Reallocation of capital |
|
- |
|
|
|
- |
|
|
|
- |
|
|
|
|
|
|
|
- |
|
|
|
( |
) |
|
|
- |
|
|
|
|
|
|
|
- |
|
|
|
- |
|
|
Distributions ($ |
|
- |
|
|
|
- |
|
|
|
- |
|
|
|
( |
) |
|
|
- |
|
|
|
( |
) |
|
|
- |
|
|
|
( |
) |
|
|
( |
) |
|
|
( |
) |
|
Balance at June 30, 2018 |
|
|
|
|
$ |
|
|
|
|
|
|
|
$ |
|
|
|
|
|
|
|
$ |
|
|
|
|
|
|
|
$ |
|
|
|
$ |
|
|
|
$ |
|
|
Six Months Ended June 30, 2019 and 2018
|
|
General Partner |
|
|
Limited Partners |
|
|
Non- |
|
|
|
|
|
|||||||||||||||||||||||||||
|
|
Preferred |
|
|
Common |
|
|
Common |
|
|
Class A Common |
|
|
controlling |
|
|
|
|
|
|||||||||||||||||||||
|
|
Units |
|
|
Amount |
|
|
Units |
|
|
Amount |
|
|
Units |
|
|
Amount |
|
|
Units |
|
|
Amount |
|
|
Interests |
|
|
Total |
|
||||||||||
|
Balance at January 1, 2019 |
|
|
|
|
$ |
|
|
|
|
|
|
|
$ |
|
|
|
|
|
|
|
$ |
|
|
|
|
|
|
|
$ |
|
|
|
$ |
|
|
|
$ |
|
|
|
Consolidated net earnings |
|
- |
|
|
|
- |
|
|
|
- |
|
|
|
|
|
|
|
- |
|
|
|
|
|
|
|
- |
|
|
|
|
|
|
|
|
|
|
|
|
|
|
Effect of equity compensation plans |
|
- |
|
|
|
- |
|
|
|
|
|
|
|
|
|
|
|
|
|
|
|
|
|
|
|
- |
|
|
|
- |
|
|
|
- |
|
|
|
|
|
|
Capital contributions |
|
- |
|
|
|
- |
|
|
|
- |
|
|
|
- |
|
|
|
- |
|
|
|
- |
|
|
|
- |
|
|
|
- |
|
|
|
|
|
|
|
|
|
|
Redemption of noncontrolling interests |
|
- |
|
|
|
- |
|
|
|
- |
|
|
|
( |
) |
|
|
- |
|
|
|
- |
|
|
|
- |
|
|
|
- |
|
|
|
( |
) |
|
|
( |
) |
|
Redemption of limited partners units |
|
- |
|
|
|
- |
|
|
|
|
|
|
|
|
|
|
|
( |
) |
|
|
( |
) |
|
|
- |
|
|
|
- |
|
|
|
- |
|
|
|
( |
) |
|
Contribution to Brazil venture |
|
- |
|
|
|
- |
|
|
|
- |
|
|
|
- |
|
|
|
- |
|
|
|
- |
|
|
|
- |
|
|
|
- |
|
|
|
( |
) |
|
|
( |
) |
|
Foreign currency translation gains, net |
|
- |
|
|
|
- |
|
|
|
- |
|
|
|
|
|
|
|
- |
|
|
|
|
|
|
|
- |
|
|
|
|
|
|
|
|
|
|
|
|
|
|
Unrealized losses on derivative contracts, net |
|
- |
|
|
|
- |
|
|
|
- |
|
|
|
( |
) |
|
|
- |
|
|
|
( |
) |
|
|
- |
|
|
|
( |
) |
|
|
- |
|
|
|
( |
) |
|
Reallocation of capital |
|
- |
|
|
|
- |
|
|
|
- |
|
|
|
( |
) |
|
|
- |
|
|
|
|
|
|
|
- |
|
|
|
|
|
|
|
- |
|
|
|
- |
|
|
Distributions ($ |
|
- |
|
|
|
- |
|
|
|
- |
|
|
|
( |
) |
|
|
- |
|
|
|
( |
) |
|
|
- |
|
|
|
( |
) |
|
|
( |
) |
|
|
( |
) |
|
Balance at June 30, 2019 |
|
|
|
|
$ |
|
|
|
|
|
|
|
$ |
|
|
|
|
|
|
|
$ |
|
|
|
|
|
|
|
$ |
|
|
|
$ |
|
|
|
$ |
|
|
|
Balance at January 1, 2018 |
|
|
|
|
$ |
|
|
|
|
|
|
|
$ |
|
|
|
|
|
|
|
$ |
|
|
|
|
|
|
|
$ |
|
|
|
$ |
|
|
|
$ |
|
|
|
Consolidated net earnings |
|
- |
|
|
|
- |
|
|
|
- |
|
|
|
|
|
|
|
- |
|
|
|
|
|
|
|
- |
|
|
|
|
|
|
|
|
|
|
|
|
|
|
Effect of equity compensation plans |
|
- |
|
|
|
- |
|
|
|
|
|
|
|
|
|
|
|
|
|
|
|
|
|
|
|
- |
|
|
|
- |
|
|
|
- |
|
|
|
|
|
|
Capital contributions |
|
- |
|
|
|
- |
|
|
|
- |
|
|
|
- |
|
|
|
- |
|
|
|
- |
|
|
|
- |
|
|
|
- |
|
|
|
|
|
|
|
|
|
|
Redemption of noncontrolling interests |
|
- |
|
|
|
- |
|
|
|
- |
|
|
|
( |
) |
|
|
- |
|
|
|
- |
|
|
|
- |
|
|
|
- |
|
|
|
( |
) |
|
|
( |
) |
|
Redemption of limited partners units |
|
- |
|
|
|
- |
|
|
|
- |
|
|
|
- |
|
|
|
( |
) |
|
|
( |
) |
|
|
( |
) |
|
|
( |
) |
|
|
- |
|
|
|
( |
) |
|
Foreign currency translation losses, net |
|
- |
|
|
|
- |
|
|
|
- |
|
|
|
( |
) |
|
|
- |
|
|
|
( |
) |
|
|
- |
|
|
|
( |
) |
|
|
( |
) |
|
|
( |
) |
|
Unrealized losses on derivative contracts, net |
|
- |
|
|
|
- |
|
|
|
- |
|
|
|
( |
) |
|
|
- |
|
|
|
( |
) |
|
|
- |
|
|
|
( |
) |
|
|
- |
|
|
|
( |
) |
|
Reallocation of capital |
|
- |
|
|
|
- |
|
|
|
- |
|
|
|
( |
) |
|
|
- |
|
|
|
|
|
|
|
- |
|
|
|
|
|
|
|
- |
|
|
|
- |
|
|
Distributions ($ |
|
- |
|
|
|
- |
|
|
|
- |
|
|
|
( |
) |
|
|
- |
|
|
|
( |
) |
|
|
- |
|
|
|
( |
) |
|
|
( |
) |
|
|
( |
) |
|
Balance at June 30, 2018 |
|
|
|
|
$ |
|
|
|
|
|
|
|
$ |
|
|
|
|
|
|
|
$ |
|
|
|
|
|
|
|
$ |
|
|
|
$ |
|
|
|
$ |
|
|
The accompanying notes are an integral part of these Consolidated Financial Statements.
9
PROLOGIS, L.P.
CONSOLIDATED STATEMENTS OF CASH FLOWS
(Unaudited)
(In thousands)
|
|
|
Six Months Ended |
|
|||||
|
|
|
June 30, |
|
|||||
|
|
|
2019 |
|
|
2018 |
|
||
|
Operating activities: |
|
|
|
|
|
|
|
|
|
Consolidated net earnings |
|
$ |
|
|
|
$ |
|
|
|
Adjustments to reconcile net earnings to net cash provided by operating activities: |
|
|
|
|
|
|
|
|
|
Straight-lined rents and amortization of above and below market leases |
|
|
( |
) |
|
|
( |
) |
|
Equity-based compensation awards |
|
|
|
|
|
|
|
|
|
Depreciation and amortization |
|
|
|
|
|
|
|
|
|
Earnings from unconsolidated entities, net |
|
|
( |
) |
|
|
( |
) |
|
Operating distributions from unconsolidated entities |
|
|
|
|
|
|
|
|
|
Decrease in operating receivables from unconsolidated entities |
|
|
|
|
|
|
|
|
|
Amortization of debt discounts, net and debt issuance costs |
|
|
|
|
|
|
|
|
|
Gains on real estate transactions, net |
|
|
( |
) |
|
|
( |
) |
|
Unrealized foreign currency and derivative gains, net |
|
|
( |
) |
|
|
( |
) |
|
Losses on early extinguishment of debt, net |
|
|
|
|
|
|
|
|
|
Deferred income tax expense (benefit) |
|
|
|
|
|
|
( |
) |
|
Increase in accounts receivable, lease right-of-use assets and other assets |
|
|
( |
) |
|
|
( |
) |
|
Decrease in accounts payable and accrued expenses, lease liabilities and other liabilities |
|
|
( |
) |
|
|
( |
) |
|
Net cash provided by operating activities |
|
|
|
|
|
|
|
|
|
Investing activities: |
|
|
|
|
|
|
|
|
|
Real estate development |
|
|
( |
) |
|
|
( |
) |
|
Real estate acquisitions |
|
|
( |
) |
|
|
( |
) |
|
Tenant improvements and lease commissions on previously leased space |
|
|
( |
) |
|
|
( |
) |
|
Property improvements |
|
|
( |
) |
|
|
( |
) |
|
Proceeds from dispositions and contributions of real estate properties |
|
|
|
|
|
|
|
|
|
Investments in and advances to unconsolidated entities |
|
|
( |
) |
|
|
( |
) |
|
Return of investment from unconsolidated entities |
|
|
|
|
|
|
|
|
|
Proceeds from repayment of notes receivable backed by real estate |
|
|
|
|
|
|
|
|
|
Proceeds from the settlement of net investment hedges |
|
|
|
|
|
|
|
|
|
Payments on the settlement of net investment hedges |
|
|
( |
) |
|
|
( |
) |
|
Net cash provided by (used in) investing activities |
|
|
|
|
|
|
( |
) |
|
Financing activities: |
|
|
|
|
|
|
|
|
|
Proceeds from issuance of common partnership units in exchange for contributions from Prologis, Inc. |
|
|
|
|
|
|
|
|
|
Distributions paid on common and preferred units |
|
|
( |
) |
|
|
( |
) |
|
Noncontrolling interests contributions |
|
|
|
|
|
|
|
|
|
Noncontrolling interests distributions |
|
|
( |
) |
|
|
( |
) |
|
Settlement of noncontrolling interests |
|
|
( |
) |
|
|
( |
) |
|
Redemption of common limited partnership units |
|
|
( |
) |
|
|
( |
) |
|
Tax paid for shares of the Parent withheld |
|
|
( |
) |
|
|
( |
) |
|
Debt issuance costs paid |
|
|
( |
) |
|
|
( |
) |
|
Net proceeds from (payments on) credit facilities |
|
|
|
|
|
|
( |
) |
|
Repurchase of and payments on debt |
|
|
( |
) |
|
|
( |
) |
|
Proceeds from the issuance of debt |
|
|
|
|
|
|
|
|
|
Net cash used in financing activities |
|
|
( |
) |
|
|
( |
) |
|
|
|
|
|
|
|
|
|
|
|
Effect of foreign currency exchange rate changes on cash |
|
|
|
|
|
|
( |
) |
|
Net increase in cash and cash equivalents |
|
|
|
|
|
|
|
|
|
Cash and cash equivalents, beginning of period |
|
|
|
|
|
|
|
|
|
Cash and cash equivalents, end of period |
|
$ |
|
|
|
$ |
|
|
See Note 12 for information on noncash investing and financing activities and other information.
The accompanying notes are an integral part of these Consolidated Financial Statements.
10
PROLOGIS, INC. AND PROLOGIS, L.P.
NOTES TO THE CONSOLIDATED FINANCIAL STATEMENTS
(Unaudited)
NOTE 1. GENERAL
Business. Prologis, Inc. (or the “Parent”) commenced operations as a fully integrated real estate company in 1997, elected to be taxed as a real estate investment trust (“REIT”) under the Internal Revenue Code of 1986, as amended (the “Internal Revenue Code”), and believes the current organization and method of operation will enable it to maintain its status as a REIT. The Parent is the general partner of Prologis, L.P. (or the “Operating Partnership” or “OP”). Through the OP, we are engaged in the ownership, acquisition, development and management of logistics facilities with a focus on key markets in 19 countries on four continents. We invest in real estate through wholly owned subsidiaries and other entities through which we co-invest with partners and investors. We maintain a significant level of ownership in these co-investment ventures, which may be consolidated or unconsolidated based on our level of control of the entity. Our current business strategy consists of
For each share of preferred or common stock the Parent issues, the OP issues a corresponding preferred or common partnership unit, as applicable, to the Parent in exchange for the contribution of the proceeds from the stock issuance. At June 30, 2019, the Parent owned a
As the sole general partner of the OP, the Parent has complete responsibility and discretion in the day-to-day management and control of the OP and we operate the Parent and the OP as one enterprise. The management of the Parent consists of the same members as the management of the OP. These members are officers of the Parent and employees of the OP or one of its subsidiaries. As general partner with control of the OP, the Parent is the primary beneficiary and therefore consolidates the OP. Because the Parent’s only significant asset is its investment in the OP, the assets and liabilities of the Parent and the OP are the same on their respective financial statements.
Basis of Presentation. The accompanying Consolidated Financial Statements are prepared in accordance with United States (“U.S.”) generally accepted accounting principles (“GAAP”) and are presented in our reporting currency, the U.S. dollar. References herein to the translation of activity for significant nonrecurring transactions are at the rate in effect at the date of the transaction. All material intercompany transactions with consolidated entities have been eliminated.
The accompanying unaudited interim financial information has been prepared according to the rules and regulations of the U.S. Securities and Exchange Commission (“SEC”). Certain information and note disclosures normally included in our annual financial statements prepared in accordance with GAAP have been condensed or omitted in accordance with such rules and regulations. Our management believes that the disclosures presented in these financial statements are adequate to make the information presented not misleading. In our opinion, all adjustments and eliminations, consisting only of normal recurring adjustments, necessary to present fairly the financial position and results of operations for both the Parent and the OP for the reported periods have been included. The results of operations for such interim periods are not necessarily indicative of the results for the full year. The accompanying unaudited interim financial information should be read in conjunction with our Annual Report on Form 10-K for the year ended December 31, 2018, as filed with the SEC, and other public information.
Reclassifications. Upon adoption of the new lease standard, rental recoveries for 2018 have been reclassified to Rental Revenues in the Consolidated Statements of Income to conform to the 2019 financial statement presentation.
New Accounting Pronouncements.
New Accounting Standards Adopted
Leases. In February 2016, the Financial Accounting Standards Board (“FASB”) issued an accounting standard update (“ASU”) that provided the principles for the recognition, measurement, presentation and disclosure of leases. The guidance amended the existing accounting standards, including the requirement that lessees recognize right-of-use assets and lease liabilities for leases with terms greater than twelve months in the Consolidated Balance Sheets. Additional guidance and targeted improvements to the February 2016 ASU were made through the issuance of supplementary ASUs in July 2018, December 2018 and March 2019. We refer to all three ASUs collectively as the “new lease standard.”
11
We adopted the new lease standard on January 1, 2019 and applied it to leases that were in place on the effective date. Results for reporting periods beginning January 1, 2019 are presented under the new lease standard.
We elected the package of practical expedients and were not required to reassess the following upon adoption: (i) whether an expired or existing contract met the definition of a lease; (ii) the lease classification at January 1, 2019 for existing leases; and (iii) whether leasing costs previously capitalized as initial direct costs would continue to be amortized. This allowed us to continue to account for our
existing ground and office space leases as operating leases, however, any new or renewed ground leases after January 1, 2019 may be classified as financing leases unless they meet certain conditions to be considered a lease involving land owned by a government unit or authority. Upon adoption, we did not have an adjustment to the opening balance of retained earnings due to the election of these practical expedients.
|
• |
As a lessor. The new lease standard required that lessors expense, on an as-incurred basis, certain initial direct costs that are not incremental in negotiating a lease. Initial direct costs include the salaries and related costs for employees directly working on leasing activities. Prior to January 1, 2019, these costs were capitalizable in Other Assets and therefore the new lease standard resulted in certain of these costs being expensed as incurred through Rental Expenses. During the three and six months ended June 30, 2018, we capitalized $ |
We adopted the practical expedient that allowed us to not separate expenses reimbursed by our customers (“rental recoveries”) from the associated rental revenue if certain criteria were met. We assessed these criteria and concluded that the timing and straight-line pattern of transfer to the lessee for rental revenue and the associated rental recoveries are the same and as our leases qualify as operating leases, we accounted for and presented rental revenue and rental recoveries as a single component under Rental Revenues in our Consolidated Statements of Income for the three and six months ended June 30, 2019. As a result of our adoption of this practical expedient, we also presented $
|
• |
As a lessee. At January 1, 2019 we recognized Lease Right-of-Use (“ROU”) Assets and Lease Liabilities, principally for our ground and office space leases, in which we are the lessee, on the Consolidated Balance Sheets. |
See Note 3 for further disclosure around our adoption of the new lease standard.
Derivatives and Hedging. In August 2017, the FASB issued an ASU that simplified the application of hedge accounting guidance in current GAAP and improved the reporting of hedging relationships to better portray the economic results of an entity’s risk management activities in its consolidated financial statements. Among the simplification updates, the ASU eliminated the requirement in current GAAP to separately recognize periodic hedge ineffectiveness. Mismatches between the changes in value of the hedged item and hedging instrument may still occur but they will no longer be separately reported. The ASU required the presentation of the earnings effect of the hedging instrument in the same income statement line item in which the earnings effect of the hedged item is reported. We adopted the ASU on January 1, 2019 on a modified retrospective basis and there was no adjustment to the opening balance of retained earnings.
NOTE 2. DCT TRANSACTION
We acquired DCT Industrial Trust Inc. and DCT Industrial Operating Partnership LP (collectively “DCT”) on
The DCT Transaction was completed for $
Through the DCT Transaction, we acquired a portfolio of logistics real estate assets that consisted of
The aggregate equity consideration of approximately $
|
Number of Prologis shares and units issued upon conversion of DCT shares and units at August 21, 2018 |
|
|
|
|
Multiplied by price of Prologis' common stock on August 21, 2018 |
$ |
|
|
|
Fair value of Prologis shares and units issued |
$ |
|
|
12
We accounted for the DCT Transaction as an asset acquisition and as a result the transaction costs of $
Under acquisition accounting, the total purchase price was allocated to the DCT net tangible and identifiable intangible assets acquired and liabilities assumed based on their relative fair values as follows (in millions):
|
Net investments in real estate |
$ |
|
|
|
Intangible assets, net of intangible liabilities |
|
|
|
|
Cash and other assets |
|
|
|
|
Debt |
|
( |
) |
|
Accounts payable, accrued expenses and other liabilities |
|
( |
) |
|
Noncontrolling interests |
|
( |
) |
|
Total purchase price, including transaction costs |
$ |
|
|
NOTE 3. REAL ESTATE
Investments in real estate properties consisted of the following (dollars and square feet in thousands):
|
|
Square Feet |
|
|
Number of Buildings |
|
|
|
|
||||||||||||||
|
|
June 30, |
|
|
December 31, |
|
|
June 30, |
|
|
December 31, |
|
|
June 30, |
|
December 31, |
|
||||||
|
|
2019 |
|
|
2018 |
|
|
2019 |
|
|
2018 |
|
|
2019 |
|
2018 |
|
||||||
|
Operating properties: |
|
|
|
|
|
|
|
|
|
|
|
|
|
|
|
|
|
|
|
|
|
|
|
Buildings and improvements |
|
|
|
|
|
|
|
|
|
|
|
|
|
|
|
|
$ |
|
|
$ |
|
|
|
Improved land |
|
|
|
|
|
|
|
|
|
|
|
|
|
|
|
|
|
|
|
|
|
|
|
Development portfolio, including land costs: |
|
|
|
|
|
|
|
|
|
|
|
|
|
|
|
|
|
|
|
|
|
|
|
Prestabilized |
|
|
|
|
|
|
|
|
|
|
|
|
|
|
|
|
|
|
|
|
|
|
|
Properties under development |
|
|
|
|
|
|
|
|
|
|
|
|
|
|
|
|
|
|
|
|
|
|
|
Land (1) |
|
|
|
|
|
|
|
|
|
|
|
|
|
|
|
|
|
|
|
|
|
|
|
Other real estate investments (2) |
|
|
|
|
|
|
|
|
|
|
|
|
|
|
|
|
|
|
|
|
|
|
|
Total investments in real estate properties |
|
|
|
|
|
|
|
|
|
|
|
|
|
|
|
|
|
|
|
|
|
|
|
Less accumulated depreciation |
|
|
|
|
|
|
|
|
|
|
|
|
|
|
|
|
|
|
|
|
|
|
|
Net investments in real estate properties |
|
|
|
|
|
|
|
|
|
|
|
|
|
|
|
|
$ |
|
|
$ |
|
|
|
|
|
|
|
|
|
|
|
|
|
|
|
|
|
|
|
|
|
|
|
|
|
|
|
(1) |
At June 30, 2019 and December 31, 2018, our land is comprised of |
|
(2) |
Included in other real estate investments were: (i) non-logistics real estate; (ii) land parcels that are ground leased to third parties; (iii) our corporate headquarters; (iv) costs related to future development projects, including purchase options on land; (v) earnest money deposits associated with potential acquisitions; and (vi) infrastructure costs related to projects we are developing on behalf of others. |
Acquisitions
The following table summarizes our real estate acquisition activity (dollars and square feet in thousands, except for acres of land):
|
|
|
Three Months Ended June 30, |
|
|
Six Months Ended June 30, |
|
||||||||||
|
|
|
2019 |
|
|
2018 |
|
|
2019 |
|
|
2018 |
|
||||
|
Number of operating properties |
|
|
|
|
|
|
|
|
|
|
|
|
|
|
|
|
|
Square feet of operating properties |
|
|
|
|
|
|
|
|
|
|
|
|
|
|
|
|
|
Acres of land |
|
|
|
|
|
|
|
|
|
|
|
|
|
|
|
|
|
Acquisition cost of net investments in real estate properties (1) |
|
$ |
|
|
|
$ |
|
|
|
$ |
|
|
|
$ |
|
|
|
(1) |
Includes the acquisition cost of properties classified in other real estate investments of $ |
On July 15, 2019, we entered into a merger agreement to acquire the wholly-owned real estate assets of Industrial Property Trust Inc. (“IPT”) for approximately $
13
customary closing conditions. Following the closing, we intend to hold the portfolio through either one or both of our U.S. co-investment ventures.
Dispositions
The following table summarizes our gains on real estate transactions, net (dollars and square feet in thousands):
|
|
|
Three Months Ended June 30, |
|
|
Six Months Ended June 30, |
|
||||||||||
|
|
|
2019 |
|
|
2018 |
|
|
2019 |
|
|
2018 |
|
||||
|
Contributions to unconsolidated entities |
|
|
|
|
|
|
|
|
|
|
|
|
|
|
|
|
|
Number of properties |
|
|
|
|
|
|
|
|
|
|
|
|
|
|
|
|
|
Square feet |
|
|
|
|
|
|
|
|
|
|
|
|
|
|
|
|
|
Net proceeds (1) (2) |
|
$ |
|
|
|
$ |
|
|
|
$ |
|
|
|
$ |
|
|
|
Gains on contributions, net (1) (2) |
|
$ |
|
|
|
$ |
|
|
|
$ |
|
|
|
$ |
|
|
|
Dispositions to third parties |
|
|
|
|
|
|
|
|
|
|
|
|
|
|
|
|
|
Number of properties |
|
|
|
|
|
|
|
|
|
|
|
|
|
|
|
|
|
Square feet |
|
|
|
|
|
|
|
|
|
|
|
|
|
|
|
|
|
Net proceeds (1) |
|
$ |
|
|
|
$ |
|
|
|
$ |
|
|
|
$ |
|
|
|
Gains on dispositions, net (1) |
|
$ |
|
|
|
$ |
|
|
|
$ |
|
|
|
$ |
|
|
|
|
|
|
|
|
|
|
|
|
|
|
|
|
|
|
|
|
|
Total gains on contributions and dispositions, net |
|
$ |
|
|
|
$ |
|
|
|
$ |
|
|
|
$ |
|
|
|
Gain on partial redemption of investment in an unconsolidated co-investment venture (3) |
|
|
|
|
|
|
|
|
|
|
|
|
|
|
|
|
|
Total gains on real estate transactions, net |
|
$ |
|
|
|
$ |
|
|
|
$ |
|
|
|
$ |
|
|
|
(1) |
Includes the contribution and disposition of land parcels. |
|
(2) |
In January 2019, we formed Prologis Brazil Logistics Venture (“PBLV”), a Brazilian unconsolidated co-investment venture, with one partner. We contributed an initial portfolio of real estate properties to PBLV consisting of |
|
(3) |
See Note 4 for more information on this transaction. |
Leases
As a Lessor
We lease our operating properties to customers under agreements that are classified as operating leases. We recognize the total minimum lease payments provided for under the leases on a straight-line basis over the lease term. Generally, under the terms of our leases, the majority of our rental expenses, including common area maintenance, real estate taxes and insurance, are recovered from our customers. We record amounts reimbursed by customers in the period that the applicable expenses are incurred, which is generally ratably throughout the term of the lease. The reimbursements are recognized in Rental Revenues in the Consolidated Statements of Income as we are the primary obligor with respect to purchasing and selecting goods and services from third-party vendors and bearing the associated credit risk. We perform credit analyses of our customers prior to the execution of our leases and continue these analyses on an ongoing basis in order to ensure the collectability of rental revenue.
The following table summarizes the minimum lease payments due from our customers on leases with lease periods
|
2019 |
|
$ |
|
|
|
2020 |
|
|
|
|
|
2021 |
|
|
|
|
|
2022 |
|
|
|
|
|
2023 |
|
|
|
|
|
Thereafter |
|
|
|
|
|
Total |
|
$ |
|
|
These amounts do not reflect future rental revenue from the renewal or replacement of existing leases and exclude reimbursements of operating expenses and rental increases that are not fixed.
14
As a Lessee
We have approximately
The following table summarizes the fixed, future minimum rental payments, excluding variable costs, which are discounted by our incremental borrowing rates to calculate the lease liabilities of our operating leases in which we are the lessee and for which the lease has commenced (in thousands):
|
|
|
June 30, 2019 |
|
|
December 31, 2018 |
|
||
|
2019 |
|
$ |
|
|
|
$ |
|
|
|
2020 |
|
|
|
|
|
|
|
|
|
2021 |
|
|
|
|
|
|
|
|
|
2022 |
|
|
|
|
|
|
|
|
|
2023 |
|
|
|
|
|
|
|
|
|
Thereafter |
|
|
|
|
|
|
|
|
|
Total undiscounted rental payments |
|
|
|
|
|
$ |
|
|
|
Less imputed interest |
|
|
|
|
|
|
|
|
|
Total lease liabilities |
|
$ |
|
|
|
|
|
|
The weighted average remaining lease term for our operating leases was 32 and
NOTE 4. UNCONSOLIDATED ENTITIES
Summary of Investments
We have investments in entities through a variety of ventures. We co-invest in entities that own multiple properties with partners and investors and we provide asset and property management services to these entities, which we refer to as co-investment ventures. These entities may be consolidated or unconsolidated, depending on the structure, our partner’s participation and other rights and our level of control of the entity. This note details our investments in unconsolidated co-investment ventures, which are related parties and are accounted for using the equity method of accounting. See Note 7 for more detail regarding our consolidated investments that are not wholly owned.
We also have other ventures, generally with one partner and that we do not manage, which we account for using the equity method. We refer to our investments in all entities accounted for using the equity method, both unconsolidated co-investment ventures and other ventures, collectively, as unconsolidated entities.
The following table summarizes our investments in and advances to our unconsolidated entities (in thousands):
|
|
|
June 30, |
|
|
December 31, |
|
||
|
|
|
2019 |
|
|
2018 |
|
||
|
Unconsolidated co-investment ventures |
|
$ |
|
|
|
$ |
|
|
|
Other ventures |
|
|
|
|
|
|
|
|
|
Total |
|
$ |
|
|
|
$ |
|
|
Unconsolidated Co-Investment Ventures
The following table summarizes the Strategic Capital Revenues we recognized in the Consolidated Statements of Income related to our unconsolidated co-investment ventures (in thousands):
|
|
|
Three Months Ended June 30, |
|
|
Six Months Ended June 30, |
|
||||||||||
|
|
|
2019 |
|
|
2018 |
|
|
2019 |
|
|
2018 |
|
||||
|
Recurring fees |
|
$ |
|
|
|
$ |
|
|
|
$ |
|
|
|
$ |
|
|
|
Transactional fees |
|
|
|
|
|
|
|
|
|
|
|
|
|
|
|
|
|
Promote revenue |
|
|
|
|
|
|
|
|
|
|
|
|
|
|
|
|
|
Total strategic capital revenues from unconsolidated co-investment ventures (1) |
|
$ |
|
|
|
$ |
|
|
|
$ |
|
|
|
$ |
|
|
15
|
(1) |
|
The following table summarizes the key property information, financial position and operating information of our unconsolidated co-investment ventures (not our proportionate share) and the amounts we recognized in the Consolidated Financial Statements related to our unconsolidated co-investment ventures (dollars and square feet in millions):
|
|
U.S. |
|
|
Other Americas |
|
|
Europe |
|
|
Asia |
|
|
Total |
|
|||||||||||||||||||||||||
|
As of: |
Jun 30, 2019 |
|
|
Dec 31, 2018 |
|
|
Jun 30, 2019 (1) |
|
|
Dec 31, 2018 |
|
|
Jun 30, 2019 |
|
|
Dec 31, 2018 |
|
|
Jun 30, 2019 |
|
|
Dec 31, 2018 |
|
|
Jun 30, 2019 |
|
|
Dec 31, 2018 |
|
||||||||||
|
Key property information: |
|
|
|
|
|
|
|
|
|
|
|
|
|
|
|
|
|
|
|
|
|
|
|
|
|
|
|
|
|
|
|
|
|
|
|
|
|
|
|
|
Ventures |
|
|
|
|
|
|
|
|
|
|
|
|
|
|
|
|
|
|
|
|
|
|
|
|
|
|
|
|
|
|
|
|
|
|
|
|
|
|
|
|
Operating properties |
|
|
|
|
|
|
|
|
|
|
|
|
|
|
|
|
|
|
|
|
|
|
|
|
|
|
|
|
|
|
|
|
|
|
|
|
|
|
|
|
Square feet |
|
|
|
|
|
|
|
|
|
|
|
|
|
|
|
|
|
|
|
|
|
|
|
|
|
|
|
|
|
|
|
|
|
|
|
|
|
|
|
|
|
|
|
|
|
|
|
|
|
|
|
|
|
|
|
|
|
|
|
|
|
|
|
|
|
|
|
|
|
|
|
|
|
|
|
|
|
|
|
|
|
Financial position: |
|
|
|
|
|
|
|
|
|
|
|
|
|
|
|
|
|
|
|
|
|
|
|
|
|
|
|
|
|
|
|
|
|
|
|
|
|
|
|
|
Total assets ($) |
|
|
|
|
|
|
|
|
|
|
|
|
|
|
|
|
|
|
|
|
|
|
|
|
|
|
|
|
|
|
|
|
|
|
|
|
|
|
|
|
Third-party debt ($) |
|
|
|
|
|
|
|
|
|
|
|
|
|
|
|
|
|
|
|
|
|
|
|
|
|
|
|
|
|
|
|
|
|
|
|
|
|
|
|
|
Total liabilities ($) |
|
|
|
|
|
|
|
|
|
|
|
|
|
|
|
|
|
|
|
|
|
|
|
|
|
|
|
|
|
|
|
|
|
|
|
|
|
|
|
|
|
|
|
|
|
|
|
|
|
|
|
|
|
|
|
|
|
|
|
|
|
|
|
|
|
|
|
|
|
|
|
|
|
|
|
|
|
|
|
|
|
Our investment balance ($) (2) |
|
|
|
|
|
|
|
|
|
|
|
|
|
|
|
|
|
|
|
|
|
|
|
|
|
|
|
|
|
|
|
|
|
|
|
|
|
|
|
|
Our weighted average ownership (3) (4) |
|
|
% |
|
|
|
% |
|
|
|
% |
|
|
|
% |
|
|
|
% |
|
|
|
% |
|
|
|
% |
|
|
|
% |
|
|
|
% |
|
|
|
% |
|
|
|
|
|
|
|
|
|
|
|
|
|
|
|
|
|
|
|
|
|
|
|
|
|
|
|
|
|
|
|
|
|
|
|
|
|
|
|
|
|
|
|
U.S. |
|
|
Other Americas |
|
|
Europe |
|
|
Asia |
|
|
Total |
|
|||||||||||||||||||||||||
|
Operating Information: |
Jun 30, 2019 |
|
|
Jun 30, 2018 |
|
|
Jun 30, 2019 (1) |
|
|
Jun 30, 2018 |
|
|
Jun 30, 2019 |
|
|
Jun 30, 2018 |
|
|
Jun 30, 2019 |
|
|
Jun 30, 2018 |
|
|
Jun 30, 2019 |
|
|
Jun 30, 2018 |
|
||||||||||
|
For the three months ended: |
|
|
|
|
|
|
|
|
|
|
|
|
|
|
|
|
|
|
|
|
|
|
|
|
|
|
|
|
|
|
|
|
|
|
|
|
|
|
|
|
Total revenues ($) |
|
|
|
|
|
|
|
|
|
|
|
|
|
|
|
|
|
|
|
|
|
|
|
|
|
|
|
|
|
|
|
|
|
|
|
|
|
|
|
|
Net earnings ($) |
|
|
|
|
|
|
|
|
|
|
|
|
|
|
|
|
|
|
|
|
|
|
|
|
|
|
|
|
|
|
|
|
|
|
|
|
|
|
|
|
|
|
|
|
|
|
|
|
|
|
|
|
|
|
|
|
|
|
|
|
|
|
|
|
|
|
|
|
|
|
|
|
|
|
|
|
|
|
|
|
|
Our earnings from unconsolidated co-investment ventures, net ($) |
|
|
|
|
|
|
|
|
|
|
|
|
|
|
|
|
|
|
|
|
|
|
|
|
|
|
|
|
|
|
|
|
|
|
|
|
|
|
|
|
|
|
|
|
|
|
|
|
|
|
|
|
|
|
|
|
|
|
|
|
|
|
|
|
|
|
|
|
|
|
|
|
|
|
|
|
|
|
|
|
|
For the six months ended: |
|
|
|
|
|
|
|
|
|
|
|
|
|
|
|
|
|
|
|
|
|
|
|
|
|
|
|
|
|
|
|
|
|
|
|
|
|
|
|
|
Total revenues ($) |
|
|
|
|
|
|
|
|
|
|
|
|
|
|
|
|
|
|
|
|
|
|
|
|
|
|
|
|
|
|
|
|
|
|
|
|
|
|
|
|
Net earnings ($) |
|
|
|
|
|
|
|
|
|
|
|
|
|
|
|
|
|
|
|
|
|
|
|
|
|
|
|
|
|
|
|
|
|
|
|
|
|
|
|
|
|
|
|
|
|
|
|
|
|
|
|
|
|
|
|
|
|
|
|
|
|
|
|
|
|
|
|
|
|
|
|
|
|
|
|
|
|
|
|
|
|
Our earnings from unconsolidated co-investment ventures, net ($) |
|
|
|
|
|
|
|
|
|
|
|
|
|
|
|
|
|
|
|
|
|
|
|
|
|
|
|
|
|
|
|
|
|
|
|
|
|
|
|
|
(1) |
|
|
(2) |
|
|
(3) |
|
|
(4) |
|
Equity Commitments Related to Certain Unconsolidated Co-Investment Ventures
At June 30, 2019, our remaining equity commitments were $
16
NOTE 5. ASSETS HELD FOR SALE OR CONTRIBUTION
We have investments in certain real estate properties that met the criteria to be classified as held for sale or contribution at June 30, 2019 and December 31, 2018. At the time of classification, these properties were expected to be sold to third parties or were recently stabilized and expected to be contributed to unconsolidated co-investment ventures within twelve months. The amounts included in Assets Held for Sale or Contribution represented real estate investment balances and the related assets and liabilities for each property.
Assets held for sale or contribution consisted of the following (dollars and square feet in thousands):
|
|
|
June 30, |
|
|
December 31, |
|
||
|
|
|
2019 |
|
|
2018 |
|
||
|
Number of operating properties |
|
|
|
|
|
|
|
|
|
Square feet |
|
|
|
|
|
|
|
|
|
Total assets held for sale or contribution |
|
$ |
|
|
|
$ |
|
|
|
Total liabilities associated with assets held for sale or contribution – included in Other Liabilities |
|
$ |
|
|
|
$ |
|
|
NOTE 6. DEBT
All debt is incurred by the OP or its consolidated subsidiaries.
|
|
|
June 30, 2019 |
|
|
December 31, 2018 |
|
||||||||||
|
|
|
Weighted Average Interest Rate (1) |
|
|
Amount Outstanding (2) |
|
|
Weighted Average Interest Rate (1) |
|
|
Amount Outstanding (2) |
|
||||
|
Credit facilities |
|
|
|
% |
|
$ |
|
|
|
|
|
% |
|
$ |
|
|
|
Senior notes |
|
|
|
% |
|
|
|
|
|
|
|
% |
|
|
|
|
|
Term loans and unsecured other |
|
|
|
% |
|
|
|
|
|
|
|
% |
|
|
|
|
|
Secured mortgage |
|
|
|
% |
|
|
|
|
|
|
|
% |
|
|
|
|
|
Total |
|
|
|
% |
|
$ |
|
|
|
|
|
% |
|
$ |
|
|
|
(1) |
The interest rates presented represent the effective interest rates (including amortization of debt issuance costs and the noncash premiums or discounts) at the end of the period for the debt outstanding and include the impact of undesignated and designated interest rate swaps, which effectively fix the interest rate on our variable rate debt. |
|
(2) |
We borrow in the functional currencies of the countries where we invest. Included in the outstanding balances were borrowings denominated in the following currencies: |
|
|
|
|
June 30, 2019 |
|
|
December 31, 2018 |
|
||||||||||
|
|
|
|
Amount Outstanding |
|
|
% of Total |
|
|
Amount Outstanding |
|
|
% of Total |
|
||||
|
|
British pound sterling |
|
$ |
|
|
|
|
|
% |
|
$ |
|
|
|
|
|
% |
|
|
Canadian dollar |
|
|
|
|
|
|
|
% |
|
|
|
|
|
|
|
% |
|
|
Euro |
|
|
|
|
|
|
|
% |
|
|
|
|
|
|
|
% |
|
|
Japanese yen |
|
|
|
|
|
|
|
% |
|
|
|
|
|
|
|
% |
|
|
U.S. dollar |
|
|
|
|
|
|
|
% |
|
|
|
|
|
|
|
% |
|
|
Total |
|
$ |
|
|
|
|
|
|
|
$ |
|
|
|
|
|
|
Credit Facilities
In January 2019, we recast our global senior credit facility (the “Global Facility”), under which we may draw in British pounds sterling, Canadian dollars, euro, Japanese yen, Mexican pesos and U.S. dollars on a revolving basis up to $
We also have a Japanese yen revolver (the “Revolver”) with availability of ¥
17
ratings of the OP. The Revolver is scheduled to mature in
We refer to the Global Facility and the Revolver, collectively, as our “Credit Facilities.”
The following table summarizes information about our Credit Facilities at June 30, 2019 (in millions):
|
|
|
|
|
|
|
Aggregate lender commitments |
|
$ |
|
|
|
Less: |
|
|
|
|
|
Borrowings outstanding |
|
|
|
|
|
Outstanding letters of credit |
|
|
|
|
|
Current availability |
|
$ |
|
|
Senior Notes
In March 2019, we completed a private placement for ¥
Term Loans
In January 2019, we entered into
In March 2019, we entered into an unsecured Japanese yen term loan agreement (the “March 2019 Yen Term Loan”) under which we can draw Japanese yen in an aggregate amount not to exceed ¥
We repaid the outstanding balance of ¥
During the six months ended June 30, 2019 and 2018, we paid down $
Long-Term Debt Maturities
Principal payments due on our debt for the remainder of 2019 and for each year through the period ended December 31, 2023, and thereafter were as follows at June 30, 2019 (in thousands):
|
|
|
Unsecured |
|
|
|
|
|
|
|
|||||||||||
|
|
|
Credit |
|
|
Senior |
|
|
Term Loans |
|
|
Secured |
|
|
|
|
|
||||
|
Maturity |
|
Facilities |
|
|
Notes |
|
|
and Other |
|
|
Mortgage |
|
|
Total |
|
|||||
|
2019 (1) |
|
$ |
|
|
|
$ |
|
|
|
$ |
|
|
|
$ |
|
|
|
$ |
|
|
|
2020 (1) (2) |
|
|
|
|
|
|
|
|
|
|
|
|
|
|
|
|
|
|
|
|
|
2021 |
|
|
|
|
|
|
|
|
|
|
|
|
|
|
|
|
|
|
|
|
|
2022 |
|
|
|
|
|
|
|
|
|
|
|
|
|
|
|
|
|
|
|
|
|
2023 (3) |
|
|
|
|
|
|
|
|
|
|
|
|
|
|
|
|
|
|
|
|
|
Thereafter |
|
|
|
|
|
|
|
|
|
|
|
|
|
|
|
|
|
|
|
|
|
Subtotal |
|
|
|
|
|
|
|
|
|
|
|
|
|
|
|
|
|
|
|
|
|
Premiums (discounts), net |
|
|
|
|
|
|
( |
) |
|
|
|
|
|
|
|
|
|
|
( |
) |
|
Debt issuance costs, net |
|
|
|
|
|
|
( |
) |
|
|
( |
) |
|
|
( |
) |
|
|
( |
) |
|
Total |
|
$ |
|
|
|
$ |
|
|
|
$ |
|
|
|
$ |
|
|
|
$ |
|
|
|
(1) |
We expect to repay the amounts maturing in the next twelve months with cash generated from operations, proceeds from dispositions of real estate properties, or as necessary, with additional borrowings. |
|
(2) |
Included in the 2020 maturities was the 2017 Term Loan that can be extended until 2022. |
|
(3) |
Included in the 2023 maturities was the Global Facility that can be extended until 2024. |
18
Financial Debt Covenants
We have $
Guarantee of Finance Subsidiary Debt
In 2018, we formed finance subsidiaries as part of our operations in Europe (Prologis Euro Finance LLC), Japan (Prologis Yen Finance LLC) and the United Kingdom (Prologis Sterling Finance LLC).
These entities are
NOTE 7. NONCONTROLLING INTERESTS
Prologis, L.P.
We report noncontrolling interests related to several entities we consolidate but of which we do not own 100% of the equity. These entities include two real estate partnerships that have issued limited partnership units to third parties. Depending on the specific partnership agreements, these limited partnership units are redeemable for cash or, at our option, into shares of the Parent’s common stock, generally at a rate of
Prologis, Inc.
The noncontrolling interests of the Parent include the noncontrolling interests described above for the OP, as well as the limited partnership units in the OP that are not owned by the Parent.
The following table summarizes our ownership percentages and noncontrolling interests and the consolidated entities’ total assets and total liabilities (dollars in thousands):
|
|
Our Ownership Percentage |
|
|
Noncontrolling Interests |
|
|
Total Assets |
|
|
Total Liabilities |
|
||||||||||||||||||||
|
|
Jun 30, 2019 |
|
|
Dec 31, 2018 |
|
|
Jun 30, 2019 |
|
|
Dec 31, 2018 |
|
|
Jun 30, 2019 |
|
|
Dec 31, 2018 |
|
|
Jun 30, 2019 |
|
|
Dec 31, 2018 |
|
||||||||
|
Prologis U.S. Logistics Venture |
|
|
% |
|
|
|
% |
|
$ |
|
|
|
$ |
|
|
|
$ |
|
|
|
$ |
|
|
|
$ |
|
|
|
$ |
|
|
|
Other consolidated entities (1) |
|
|
|
|
|
|
|
|
|
|
|
|
|
|
|
|
|
|
|
|
|
|
|
|
|
|
|
|
|
||
|
Prologis, L.P. |
|
|
|
|
|
|
|
|
|
|
|
|
|
|
|
|
|
|
|
|
|
|
|
|
|
|
|
|
|
|
|
|
Limited partners in Prologis, L.P. (2) (3) |
|
|
|
|
|
|
|
|
|
|
|
|
|
|
|
|
|
|
|
|
|
|
|
|
|
||||||
|
Prologis, Inc. |
|
|
|
|
|
|
|
|
$ |
|
|
|
$ |
|
|
|
$ |
|
|
|
$ |
|
|
|
$ |
|
|
|
$ |
|
|
|
|
|
|
|
|
|
|
|
|
|
|
|
|
|
|
|
|
|
|
|
|
|
|
|
|
|
|
|
|
|
|
|
|
(1) |
|
|
(2) |
|
|
(3) |
|
NOTE 8. LONG-TERM COMPENSATION
Equity-Based Compensation Plans and Programs
Prologis Outperformance Plan (“POP”)
We allocate participation points to participants under our POP corresponding to three-year performance periods beginning every January 1. The fair value of the awards is measured at the grant date and amortized over the period from the grant date to the date at
19
which the awards vest, which ranges from
We granted participation points for the 2019 – 2021 performance period in January 2019, with a fair value of $
The Outperformance Hurdle was met for the 2016 – 2018 performance period, which resulted in awards being earned at December 31, 2018. Initial awards of $
Other Equity-Based Compensation Plans and Programs
Our other equity-based compensation plans and programs include (i) the Prologis Promote Plan (“PPP”); (ii) the annual long-term incentive (“LTI”) equity award program (“Annual LTI Award”); and (iii) the annual bonus exchange program. Awards under these plans and programs may be issued in the form of restricted stock units (“RSUs”) or LTIP Units at the participant’s election. RSUs and LTIP Units are valued based on the market price of the Parent’s common stock on the date the award is granted and the grant date value is charged to compensation expense over the service period, which beginning in February 2018 was lengthened from three to
Summary of Award Activity
RSUs
The following table summarizes the activity for RSUs for the six months ended June 30, 2019 (units in thousands):
|
|
|
|
|
|
|
Weighted Average |
|
|
|
|
|
Unvested RSUs |
|
|
Grant Date Fair Value |
|
||
|
Balance at January 1, 2019 |
|
|
|
|
|
$ |
|
|
|
Granted |
|
|
|
|
|
|
|
|
|
Vested and distributed |
|
|
( |
) |
|
|
|
|
|
Forfeited |
|
|
( |
) |
|
|
|
|
|
Balance at June 30, 2019 |
|
|
|
|
|
$ |
|
|
|
|
|
|
|
|
|
|
|
|
LTIP Units
The following table summarizes the activity for LTIP Units for the six months ended June 30, 2019 (units in thousands):
|
|
|
Vested |
|
|
Unvested |
|
|
Unvested Weighted Average |
|
|||
|
|
|
LTIP Units |
|
|
LTIP Units |
|
|
Grant Date Fair Value |
|
|||
|
Balance at January 1, 2019 |
|
|
|
|
|
|
|
|
|
$ |
|
|
|
Granted |
|
|
- |
|
|
|
|
|
|
|
|
|
|
Vested LTIP Units |
|
|
|
|
|
|
( |
) |
|
|
|
|
|
Vested POP LTIP Units (1) |
|
|
|
|
|
|
- |
|
|
N/A |
|
|
|
Conversion to common limited partnership units |
|
|
( |
) |
|
|
- |
|
|
N/A |
|
|
|
Balance at June 30, 2019 |
|
|
|
|
|
|
|
|
|
$ |
|
|
20
|
(1) |
Vested units were based on the POP performance criteria being met for the 2016 – 2018 performance period and represented the earned award amount. See above for further discussion on the POP. |
NOTE 9. EARNINGS PER COMMON SHARE OR UNIT
We determine basic earnings per share or unit based on the weighted average number of shares of common stock or units outstanding during the period. We compute diluted earnings per share or unit based on the weighted average number of shares or units outstanding combined with the incremental weighted average effect from all outstanding potentially dilutive instruments.
The computation of our basic and diluted earnings per share and unit was as follows (in thousands, except per share and unit amounts):
|
|
|
Three Months Ended |
|
|
Six Months Ended |
|
||||||||||
|
|
|
June 30, |
|
|
June 30, |
|
||||||||||
|
Prologis, Inc. |
|
2019 |
|
|
2018 |
|
|
2019 |
|
|
2018 |
|
||||
|
Net earnings attributable to common stockholders – Basic |
|
$ |
|
|
|
$ |
|
|
|
$ |
|
|
|
$ |
|
|
|
Net earnings attributable to exchangeable limited partnership units (1) |
|
|
|
|
|
|
|
|
|
|
|
|
|
|
|
|
|
Adjusted net earnings attributable to common stockholders – Diluted |
|
$ |
|
|
|
$ |
|
|
|
$ |
|
|
|
$ |
|
|
|
|
|
|
|
|
|
|
|
|
|
|
|
|
|
|
|
|
|
Weighted average common shares outstanding – Basic |
|
|
|
|
|
|
|
|
|
|
|
|
|
|
|
|
|
Incremental weighted average effect on exchange of limited partnership units (1) |
|
|
|
|
|
|
|
|
|
|
|
|
|
|
|
|
|
Incremental weighted average effect of equity awards |
|
|
|
|
|
|
|
|
|
|
|
|
|
|
|
|
|
Weighted average common shares outstanding – Diluted (2) |
|
|
|
|
|
|
|
|
|
|
|
|
|
|
|
|
|
|
|
|
|
|
|
|
|
|
|
|
|
|
|
|
|
|
|
Net earnings per share attributable to common stockholders: |
|
|
|
|
|
|
|
|
|
|
|
|
|
|
|
|
|
Basic |
|
$ |
|
|
|
$ |
|
|
|
$ |
|
|
|
$ |
|
|
|
Diluted |
|
$ |
|
|
|
$ |
|
|
|
$ |
|
|
|
$ |
|
|
|
|
|
Three Months Ended |
|
|
Six Months Ended |
|
||||||||||
|
|
|
June 30, |
|
|
June 30, |
|
||||||||||
|
Prologis, L.P. |
|
2019 |
|
|
2018 |
|
|
2019 |
|
|
2018 |
|
||||
|
Net earnings attributable to common unitholders |
|
$ |
|
|
|
$ |
|
|
|
$ |
|
|
|
$ |
|
|
|
Net earnings attributable to Class A Units |
|
|
( |
) |
|
|
( |
) |
|
|
( |
) |
|
|
( |
) |
|
Net earnings attributable to common unitholders – Basic |
|
|
|
|
|
|
|
|
|
|
|
|
|
|
|
|
|
Net earnings attributable to Class A Units |
|
|
|
|
|
|
|
|
|
|
|
|
|
|
|
|
|
Net earnings attributable to exchangeable other limited partnership units |
|
|
|
|
|
|
|
|
|
|
|
|
|
|
|
|
|
Adjusted net earnings attributable to common unitholders – Diluted |
|
$ |
|
|
|
$ |
|
|
|
$ |
|
|
|
$ |
|
|
|
|
|
|
|
|
|
|
|
|
|
|
|
|
|
|
|
|
|
Weighted average common partnership units outstanding – Basic |
|
|
|
|
|
|
|
|
|
|
|
|
|
|
|
|
|
Incremental weighted average effect on exchange of Class A Units |
|
|
|
|
|
|
|
|
|
|
|
|
|
|
|
|
|
Incremental weighted average effect on exchange of other limited partnership units |
|
|
|
|
|
|
|
|
|
|
|
|
|
|
|
|
|
Incremental weighted average effect of equity awards of Prologis, Inc. |
|
|
|
|
|
|
|
|
|
|
|
|
|
|
|
|
|
Weighted average common units outstanding – Diluted (2) |
|
|
|
|
|
|
|
|
|
|
|
|
|
|
|
|
|
|
|
|
|
|
|
|
|
|
|
|
|
|
|
|
|
|
|
Net earnings per unit attributable to common unitholders: |
|
|
|
|
|
|
|
|
|
|
|
|
|
|
|
|
|
Basic |
|
$ |
|
|
|
$ |
|
|
|
$ |
|
|
|
$ |
|
|
|
Diluted |
|
$ |
|
|
|
$ |
|
|
|
$ |
|
|
|
$ |
|
|
|
(1) |
The exchangeable limited partnership units include the units as discussed in Note 7. Earnings allocated to the exchangeable OP units not held by the Parent have been included in the numerator and exchangeable common units have been included in the denominator for the purpose of computing diluted earnings per share for all periods as the per share and unit amount is the same. |
21
|
(2) |
Our total weighted average potentially dilutive shares and units outstanding consisted of the following: |
|
|
|
|
Three Months Ended |
|
|
Six Months Ended |
|
||||||||||
|
|
|
|
June 30, |
|
|
June 30, |
|
||||||||||
|
|
|
|
2019 |
|
|
2018 |
|
|
2019 |
|
|
2018 |
|
||||
|
|
Class A Units |
|
|
|
|
|
|
|
|
|
|
|
|
|
|
|
|
|
|
Other limited partnership units |
|
|
|
|
|
|
|
|
|
|
|
|
|
|
|
|
|
|
Equity awards |
|
|
|
|
|
|
|
|
|
|
|
|
|
|
|
|
|
|
Prologis, L.P. |
|
|
|
|
|
|
|
|
|
|
|
|
|
|
|
|
|
|
Common limited partnership units |
|
|
|
|
|
|
|
|
|
|
|
|
|
|
|
|
|
|
Prologis, Inc. |
|
|
|
|
|
|
|
|
|
|
|
|
|
|
|
|
NOTE 10. FINANCIAL INSTRUMENTS AND FAIR VALUE MEASUREMENTS
Derivative Financial Instruments
In the normal course of business, our operations are exposed to market risks, including the effect of changes in foreign currency exchange rates and interest rates. We may enter into derivative financial instruments to offset these underlying market risks. There have been no significant changes in our policy or strategy from what was disclosed in our Annual Report on Form 10-K for the year ended December 31, 2018.
The following table presents the fair value of our derivative financial instruments recognized within Other Assets and Other Liabilities on the Consolidated Balance Sheets (in thousands):
|
|
|
June 30, 2019 |
|
|
December 31, 2018 |
|
||||||||||
|
|
|
Asset |
|
|
Liability |
|
|
Asset |
|
|
Liability |
|
||||
|
Undesignated derivatives |
|
|
|
|
|
|
|
|
|
|
|
|
|
|
|
|
|
Foreign currency contracts |
|
|
|
|
|
|
|
|
|
|
|
|
|
|
|
|
|
Forwards |
|
|
|
|
|
|
|
|
|
|
|
|
|
|
|
|
|
Brazilian real |
|
$ |
|
|
|
$ |
|
|
|
$ |
|
|
|
$ |
|
|
|
British pound sterling |
|
|
|
|
|
|
|
|
|
|
|
|
|
|
|
|
|
Canadian dollar |
|
|
|
|
|
|
|
|
|
|
|
|
|
|
|
|
|
Euro |
|
|
|
|
|
|
|
|
|
|
|
|
|
|
|
|
|
Japanese yen |
|
|
|
|
|
|
|
|
|
|
|
|
|
|
|
|
|
Mexican peso |
|
|
|
|
|
|
|
|
|
|
|
|
|
|
|
|
|
|
|
|
|
|
|
|
|
|
|
|
|
|
|
|
|
|
|
Interest rate swaps |
|
|
|
|
|
|
|
|
|
|
|
|
|
|
|
|
|
U.S. dollar |
|
|
|
|
|
|
|
|
|
|
|
|
|
|
|
|
|
|
|
|
|
|
|
|
|
|
|
|
|
|
|
|
|
|
|
Designated derivatives |
|
|
|
|
|
|
|
|
|
|
|
|
|
|
|
|
|
Foreign currency contracts |
|
|
|
|
|
|
|
|
|
|
|
|
|
|
|
|
|
Net investment hedges |
|
|
|
|
|
|
|
|
|
|
|
|
|
|
|
|
|
Brazilian real |
|
|
|
|
|
|
|
|
|
|
|
|
|
|
|
|
|
British pound sterling |
|
|
|
|
|
|
|
|
|
|
|
|
|
|
|
|
|
Canadian dollar |
|
|
|
|
|
|
|
|
|
|
|
|
|
|
|
|
|
|
|
|
|
|
|
|
|
|
|
|
|
|
|
|
|
|
|
Interest rate swaps |
|
|
|
|
|
|
|
|
|
|
|
|
|
|
|
|
|
Cash flow hedges |
|
|
|
|
|
|
|
|
|
|
|
|
|
|
|
|
|
Euro |
|
|
|
|
|
|
|
|
|
|
|
|
|
|
|
|
|
Total fair value of derivatives |
|
$ |
|
|
|
$ |
|
|
|
$ |
|
|
|
$ |
|
|
|
|
|
|
|
|
|
|
|
|
|
|
|
|
|
|
|
|
22
Undesignated Derivative Financial Instruments
Foreign Currency Contracts
The following table summarizes the activity of our undesignated foreign currency contracts for the six months ended June 30 (in millions, except for weighted average forward rates and number of active contracts):
|
|
|
2019 |
|
|
2018 |
|
||||||||||||||||||||||||||||||||||||||||||
|
|
|
BRL |
|
|
CAD |
|
|
EUR |
|
|
GBP |
|
|
JPY |
|
|
MXN |
|
|
CAD |
|
|
CNY |
|
|
EUR |
|
|
GBP |
|
|
JPY |
|
|
MXN |
|
||||||||||||
|
Notional amounts at January 1 |
|
$ |
|
|
|
$ |
|
|
|
$ |
|
|
|
$ |
|
|
|
$ |
|
|
|
$ |
|
|
|
$ |
|
|
|
$ |
|
|
|
$ |
|
|
|
$ |
|
|
|
$ |
|
|
|
$ |
|
|
|
New contracts |
|
|
|
|
|
|
|
|
|
|
|
|
|
|
|
|
|
|
|
|
|
|
|
|
|
|
|
|
|
|
|
|
|
|
|
|
|
|
|
|
|
|
|
|
|
|
|
|
|
Matured, expired or settled contracts |
|
|
( |
) |
|
|
( |
) |
|
|
( |
) |
|
|
( |
) |
|
|
( |
) |
|
|
( |
) |
|
|
( |
) |
|
|
( |
) |
|
|
( |
) |
|
|
( |
) |
|
|
( |
) |
|
|
( |
) |
|
Notional amounts at June 30 |
|
$ |
|
|
|
$ |
|
|
|
$ |
|
|
|
$ |
|
|
|
$ |
|
|
|
$ |
|
|
|
$ |
|
|
|
$ |
|
|
|
$ |
|
|
|
$ |
|
|
|
$ |
|
|
|
$ |
|
|
|
|
|
|
|
|
|
|
|
|
|
|
|
|
|
|
|
|
|
|
|
|
|
|
|
|
|
|
|
|
|
|
|
|
|
|
|
|
|
|
|
|
|
|
|
|
|
|
|
|
|
Weighted average forward rate at June 30 |
|
|
- |
|
|
|
|
|
|
|
|
|
|
|
|
|
|
|
|
|
|
|
- |
|
|
|
|
|
|
|
- |
|
|
|
|
|
|
|
|
|
|
|
|
|
|
|
- |
|
|
Active contracts at June 30 |
|
|
|
|
|
|
|
|
|
|
|
|
|
|
|
|
|
|
|
|
|
|
|
|
|
|
|
|
|
|
|
|
|
|
|
|
|
|
|
|
|
|
|
|
|
|
|
|
The following table summarizes the undesignated derivative financial instruments exercised and associated realized gains (losses) and unrealized gains (losses) in Foreign Currency and Derivative Gains, Net in the Consolidated Statements of Income (in millions, except for number of exercised contracts):
|
|
|
Three Months Ended June 30, |
|
|
Six Months Ended June 30, |
|
||||||||||
|
|
|
2019 |
|
|
2018 |
|
|
2019 |
|
|
2018 |
|
||||
|
Exercised contracts |
|
|
|
|
|
|
|
|
|
|
|
|
|
|
|
|
|
Realized gains (losses) on the matured, expired or settled contracts |
|
$ |
|
|
|
$ |
( |
) |
|
$ |
|
|
|
$ |
( |
) |
|
Unrealized gains (losses) on the change in fair value of outstanding contracts |
|
$ |
( |
) |
|
$ |
|
|
|
$ |
|
|
|
$ |
|
|
Designated Derivative Financial Instruments
Foreign Currency Contracts
The following table summarizes the activity of our foreign currency contracts designated as net investment hedges for the six months ended June 30 (in millions, except for weighted average forward rates and number of active contracts):
|
|
|
2019 |
|
|
2018 |
|
||||||||||||||
|
|
|
BRL |
|
|
CAD |
|
|
GBP |
|
|
CAD |
|
|
EUR |
|
|||||
|
Notional amounts at January 1 |
|
$ |
|
|
|
$ |
|
|
|
$ |
|
|
|
$ |
|
|
|
$ |
|
|
|
New contracts |
|
|
|
|
|
|
|
|
|
|
|
|
|
|
|
|
|
|
|
|
|
Matured, expired or settled contracts |
|
|
( |
) |
|
|
( |
) |
|
|
( |
) |
|
|
( |
) |
|
|
|
|
|
Notional amounts at June 30 |
|
$ |
|
|
|
$ |
|
|
|
$ |
|
|
|
$ |
|
|
|
$ |
|
|
|
|
|
|
|
|
|
|
|
|
|
|
|
|
|
|
|
|
|
|
|
|
|
Weighted average forward rate at June 30 |
|
|
- |
|
|
|
|
|
|
|
|
|
|
|
|
|
|
|
|
|
|
Active contracts at June 30 |
|
|
|
|
|
|
|
|
|
|
|
|
|
|
|
|
|
|
|
|
Interest Rate Swaps
The following table summarizes the activity of our interest rate swaps designated as cash flow hedges for the six months ended June 30 (in millions):
|
|
|
2019 |
|
|
2018 |
|
||||||||||
|
|
|
EUR |
|
|
CAD |
|
|
EUR |
|
|
USD |
|
||||
|
Notional amounts at January 1 |
|
$ |
|
|
|
$ |
|
|
|
$ |
|
|
|
$ |
|
|
|
New contracts |
|
|
|
|
|
|
|
|
|
|
|
|
|
|
|
|
|
Matured, expired or settled contracts |
|
|
|
|
|
|
( |
) |
|
|
|
|
|
|
( |
) |
|
Notional amounts at June 30 |
|
$ |
|
|
|
$ |
|
|
|
$ |
|
|
|
$ |
|
|
23
Designated Nonderivative Financial Instruments
The following table summarizes our debt and accrued interest, designated as a hedge of our net investment in international subsidiaries (in millions):
|
|
|
June 30, 2019 |
|
|
December 31, 2018 |
|
||
|
British pound sterling |
|
$ |
|
|
|
$ |
|
|
|
Euro |
|
$ |
|
|
|
$ |
|
|
The following table summarizes the recognized unrealized gains in Foreign Currency and Derivative Gains, Net on the remeasurement of the unhedged portion of our debt and accrued interest (in millions):
|
|
|
Three Months Ended June 30, |
|
|
Six Months Ended June 30, |
|
||||||||||
|
|
|
2019 |
|
|
2018 |
|
|
2019 |
|
|
2018 |
|
||||
|
Unrealized gains on the unhedged portion |
|
$ |
|
|
|
$ |
|
|
|
$ |
|
|
|
$ |
|
|
Other Comprehensive Income (Loss)
The change in Other Comprehensive Income (Loss) in the Consolidated Statements of Comprehensive Income during the periods presented is due to the translation into U.S. dollars on consolidation of the financial statements of our consolidated subsidiaries whose functional currency is not the U.S. dollar. The change in fair value of the effective portion of our derivative financial instruments that have been designated as net investment hedges and cash flow hedges and the translation of our nonderivative financial instruments as discussed above are also included in Other Comprehensive Income (Loss).
The following table presents these changes in Other Comprehensive Income (Loss) (in thousands):
|
|
|
Three Months Ended June 30, |
|
|
Six Months Ended June 30, |
|
||||||||||
|
|
|
2019 |
|
|
2018 |
|
|
2019 |
|
|
2018 |
|
||||
|
Derivative net investment hedges |
|
$ |
|
|
|
$ |
|
|
|
$ |
( |
) |
|
$ |
|
|
|
Nonderivative net investment hedges |
|
|
( |
) |
|
|
|
|
|
|
|
|
|
|
|
|
|
Cumulative translation adjustment |
|
|
( |
) |
|
|
( |
) |
|
|
( |
) |
|
|
( |
) |
|
Total foreign currency translation gains (losses), net |
|
$ |
( |
) |
|
$ |
( |
) |
|
$ |
|
|
|
$ |
( |
) |
|
|
|
|
|
|
|
|
|
|
|
|
|
|
|
|
|
|
|
Cash flow hedges (1) |
|
$ |
|
|
|
$ |
|
|
|
$ |
|
|
|
$ |
( |
) |
|
Our share of derivatives from unconsolidated co-investment ventures |
|
|
( |
) |
|
|
|
|
|
|
( |
) |
|
|
|
|
|
Total unrealized gains (losses) on derivative contracts, net |
|
$ |
( |
) |
|
$ |
|
|
|
$ |
( |
) |
|
$ |
( |
) |
|
Total change in other comprehensive income (loss) |
|
$ |
( |
) |
|
$ |
( |
) |
|
$ |
|
|
|
$ |
( |
) |
|
(1) |
We estimate an additional expense of $ |
Fair Value Measurements
There have been no significant changes in our policy from what was disclosed in our Annual Report on Form 10-K for the year ended December 31, 2018.
Fair Value Measurements on a Recurring Basis
At June 30, 2019 and December 31, 2018, other than the derivatives discussed previously, we did not have any significant financial assets or financial liabilities that were measured at fair value on a recurring basis in the Consolidated Financial Statements. All of our derivatives held at June 30, 2019 and December 31, 2018, were classified as Level 2 of the fair value hierarchy.
Fair Value Measurements on Nonrecurring Basis
Acquired properties and assets we expect to sell or contribute met the criteria to be measured on a nonrecurring basis at fair value and the lower of their carrying amount or their estimated fair value less the costs to sell, respectively, at June 30, 2019 and December 31, 2018. At June 30, 2019 and December 31, 2018, we estimate the fair value of our properties using Level 2 or Level 3 inputs from the fair value hierarchy. See more information on our acquired properties and assets held for sale or contribution in Notes 2, 3 and 5, respectively.
24
Fair Value of Financial Instruments
At June 30, 2019 and December 31, 2018, the carrying amounts of certain financial instruments, including cash and cash equivalents, accounts and notes receivable, accounts payable and accrued expenses were representative of their fair values.
The differences in the fair value of our debt from the carrying value in the table below were the result of differences in interest rates or borrowing spreads that were available to us at June 30, 2019 and December 31, 2018, as compared with those in effect when the debt was issued or assumed, including reduced borrowing spreads due to our improved credit ratings. The senior notes and many of the issuances of secured mortgage debt contain pre-payment penalties or yield maintenance provisions that could make the cost of refinancing the debt at lower rates exceed the benefit that would be derived from doing so.
The following table reflects the carrying amounts and estimated fair values of our debt (in thousands):
|
|
|
June 30, 2019 |
|
|
December 31, 2018 |
|
||||||||||
|
|
|
Carrying Value |
|
|
Fair Value |
|
|
Carrying Value |
|
|
Fair Value |
|
||||
|
Credit Facilities |
|
$ |
|
|
|
$ |
|
|
|
$ |
|
|
|
$ |
|
|
|
Senior notes |
|
|
|
|
|
|
|
|
|
|
|
|
|
|
|
|
|
Term loans and unsecured other |
|
|
|
|
|
|
|
|
|
|
|
|
|
|
|
|
|
Secured mortgage |
|
|
|
|
|
|
|
|
|
|
|
|
|
|
|
|
|
Total |
|
$ |
|
|
|
$ |
|
|
|
$ |
|
|
|
$ |
|
|
NOTE 11. BUSINESS SEGMENTS
Our current business strategy includes
|
• |
Real Estate Operations. This operating segment represents the ownership and development of operating properties and is the largest component of our revenue and earnings. We collect rent from our customers through operating leases, including reimbursements for the majority of our property operating costs. Each operating property is considered to be an individual operating segment with similar economic characteristics; these properties are combined within the reportable business segment based on geographic location. Our Real Estate Operations segment also includes development activities that lead to rental operations, including land held for development and properties currently under development. Within this line of business, we utilize the following: (i) our land bank; (ii) the development expertise of our local teams; and (iii) our customer relationships. Land we own and lease to customers under ground leases, along with land and buildings we lease, is also included in this segment. |
|
• |
Strategic Capital. This operating segment represents the management of unconsolidated co-investment ventures. We generate strategic capital revenues primarily from our unconsolidated co-investment ventures through asset management and property management services and we earn additional revenues by providing leasing, acquisition, construction, development, financing, legal and disposition services. Depending on the structure of the venture and the returns provided to our partners, we also earn revenues through promotes periodically during the life of a venture or upon liquidation. Each unconsolidated co-investment venture we manage is considered to be an individual operating segment with similar economic characteristics; these ventures are combined within the reportable business segment based on geographic location. |
25
Reconciliations are presented below for: (i) each reportable business segment’s revenues from external customers to Total Revenues; (ii) each reportable business segment’s net operating income from external customers to Operating Income and Earnings Before Income Taxes; and (iii) each reportable business segment’s assets to Total Assets. Our chief operating decision makers rely primarily on net operating income and similar measures to make decisions about allocating resources and assessing segment performance. The applicable components of Total Revenues, Operating Income, Earnings Before Income Taxes and Total Assets are allocated to each reportable business segment’s revenues, net operating income and assets. Items that are not directly assignable to a segment, such as certain corporate income and expenses, are not allocated but reflected as reconciling items.
The following reconciliations are presented in thousands:
|
|
|
Three Months Ended June 30, |
|
|
Six Months Ended June 30, |
|
||||||||||
|
|
|
|
2019 |
|
|
|
2018 |
|
|
|
2019 |
|
|
|
2018 |
|
|
Revenues: |
|
|
|
|
|
|
|
|
|
|
|
|
|
|
|
|
|
Real estate operations segment: |
|
|
|
|
|
|
|
|
|
|
|
|
|
|
|
|
|
U.S. |
|
$ |
|
|
|
$ |
|
|
|
$ |
|
|
|
$ |
|
|
|
Other Americas |
|
|
|
|
|
|
|
|
|
|
|
|
|
|
|
|
|
Europe |
|
|
|
|
|
|
|
|
|
|
|
|
|
|
|
|
|
Asia |
|
|
|
|
|
|
|
|
|
|
|
|
|
|
|
|
|
Total real estate operations segment |
|
|
|
|
|
|
|
|
|
|
|
|
|
|
|
|
|
Strategic capital segment: |
|
|
|
|
|
|
|
|
|
|
|
|
|
|
|
|
|
U.S. |
|
|
|
|
|
|
|
|
|
|
|
|
|
|
|
|
|
Other Americas |
|
|
|
|
|
|
|
|
|
|
|
|
|
|
|
|
|
Europe |
|
|
|
|
|
|
|
|
|
|
|
|
|
|
|
|
|
Asia |
|
|
|
|
|
|
|
|
|
|
|
|
|
|
|
|
|
Total strategic capital segment |
|
|
|
|
|
|
|
|
|
|
|
|
|
|
|
|
|
|
|
|
|
|
|
|
|
|
|
|
|
|
|
|
|
|
|
Total revenues |
|
|
|
|
|
|
|
|
|
|
|
|
|
|
|
|
|
|
|
|
|
|
|
|
|
|
|
|
|
|
|
|
|
|
|
Segment net operating income: |
|
|
|
|
|
|
|
|
|
|
|
|
|
|
|
|
|
Real estate operations segment: |
|
|
|
|
|
|
|
|
|
|
|
|
|
|
|
|
|
U.S. (1) |
|
|
|
|
|
|
|
|
|
|
|
|
|
|
|
|
|
Other Americas |
|
|
|
|
|
|
|
|
|
|
|
|
|
|
|
|
|
Europe |
|
|
|
|
|
|
|
|
|
|
|
|
|
|
|
|
|
Asia |
|
|
|
|
|
|
|
|
|
|
|
|
|
|
|
|
|
Total real estate operations segment |
|
|
|
|
|
|
|
|
|
|
|
|
|
|
|
|
|
Strategic capital segment: |
|
|
|
|
|
|
|
|
|
|
|
|
|
|
|
|
|
U.S. (1) |
|
|
|
|
|
|
|
|
|
|
|
|
|
|
|
|
|
Other Americas |
|
|
|
|
|
|
|
|
|
|
|
|
|
|
|
|
|
Europe |
|
|
|
|
|
|
|
|
|
|
|
|
|
|
|
|
|
Asia |
|
|
|
|
|
|
|
|
|
|
|
|
|
|
|
|
|
Total strategic capital segment |
|
|
|
|
|
|
|
|
|
|
|
|
|
|
|
|
|
|
|
|
|
|
|
|
|
|
|
|
|
|
|
|
|
|
|
Total segment net operating income |
|
|
|
|
|
|
|
|
|
|
|
|
|
|
|
|
|
|
|
|
|
|
|
|
|
|
|
|
|
|
|
|
|
|
|
Reconciling items: |
|
|
|
|
|
|
|
|
|
|
|
|
|
|
|
|
|
General and administrative expenses |
|
|
( |
) |
|
|
( |
) |
|
|
( |
) |
|
|
( |
) |
|
Depreciation and amortization expenses |
|
|
( |
) |
|
|
( |
) |
|
|
( |
) |
|
|
( |
) |
|
Gains on real estate transactions, net |
|
|
|
|
|
|
|
|
|
|
|
|
|
|
|
|
|
Operating income |
|
|
|
|
|
|
|
|
|
|
|
|
|
|
|
|
|
Earnings from unconsolidated entities, net |
|
|
|
|
|
|
|
|
|
|
|
|
|
|
|
|
|
Interest expense |
|
|
( |
) |
|
|
( |
) |
|
|
( |
) |
|
|
( |
) |
|
Interest and other income, net |
|
|
|
|
|
|
|
|
|
|
|
|
|
|
|
|
|
Foreign currency and derivative gains, net |
|
|
|
|
|
|
|
|
|
|
|
|
|
|
|
|
|
Gains (losses) on early extinguishment of debt, net |
|
|
( |
) |
|
|
|
|
|
|
( |
) |
|
|
( |
) |
|
Earnings before income taxes |
|
$ |
|
|
|
$ |
|
|
|
$ |
|
|
|
$ |
|
|
|
|
|
|
|
|
|
|
|
|
|
|
|
|
|
|
|
|
26
|
|
|
June 30, 2019 |
|
|
December 31, 2018 |
|
||
|
Segment assets: |
|
|
|
|
|
|
|
|
|
Real estate operations segment: |
|
|
|
|
|
|
|
|
|
U.S. |
|
$ |
|
|
|
$ |
|
|
|
Other Americas |
|
|
|
|
|
|
|
|
|
Europe |
|
|
|
|
|
|
|
|
|
Asia |
|
|
|
|
|
|
|
|
|
Total real estate operations segment |
|
|
|
|
|
|
|
|
|
Strategic capital segment: (2) |
|
|
|
|
|
|
|
|
|
U.S. |
|
|
|
|
|
|
|
|
|
Europe |
|
|
|
|
|
|
|
|
|
Asia |
|
|
|
|
|
|
|
|
|
Total strategic capital segment |
|
|
|
|
|
|
|
|
|
Total segment assets |
|
|
|
|
|
|
|
|
|
|
|
|
|
|
|
|
|
|
|
Reconciling items: |
|
|
|
|
|
|
|
|
|
Investments in and advances to unconsolidated entities |
|
|
|
|
|
|
|
|
|
Assets held for sale or contribution |
|
|
|
|
|
|
|
|
|
Lease right-of-use assets |
|
|
|
|
|
|
|
|
|
Cash and cash equivalents |
|
|
|
|
|
|
|
|
|
Other assets |
|
|
|
|
|
|
|
|
|
Total reconciling items |
|
|
|
|
|
|
|
|
|
Total assets |
|
$ |
|
|
|
$ |
|
|
|
(1) |
This includes compensation and personnel costs for employees who were located in the U.S. but also support other regions. |
|
(2) |
Represents management contracts and goodwill recorded in connection with business combinations associated with the Strategic Capital segment. Goodwill was $ |
NOTE 12. SUPPLEMENTAL CASH FLOW INFORMATION
Our significant noncash investing and financing activities for the six months ended June 30, 2019 and 2018 included the following:
|
• |
We recognized Lease ROU Assets and Lease Liabilities on the Consolidated Balance Sheets, including any new leases, renewals, modifications and terminations after January 1, 2019, of $ |
|
• |
We capitalized $ |
|
• |
We received $ |
|
• |
We issued |
We paid $
We paid $
27
REPORT OF INDEPENDENT REGISTERED PUBLIC ACCOUNTING FIRM
To the Stockholders and Board of Directors
Prologis, Inc.:
Results of Review of Interim Financial Information
We have reviewed the consolidated balance sheet of Prologis, Inc. and subsidiaries (the Company) as of June 30, 2019, the related consolidated statements of income and comprehensive income for the three-month and six-month periods ended June 30, 2019 and 2018, the related consolidated statements of equity for the three-month and six-month periods ended June 30, 2019 and 2018, the related consolidated statements of cash flows for the six-month periods ended June 30, 2019 and 2018, and the related notes (collectively, the consolidated interim financial information). Based on our reviews, we are not aware of any material modifications that should be made to the consolidated interim financial information for it to be in conformity with U.S. generally accepted accounting principles.
We have previously audited, in accordance with the standards of the Public Company Accounting Oversight Board (United States) (PCAOB), the consolidated balance sheet of the Company as of December 31, 2018, and the related consolidated statements of income, comprehensive income, equity, and cash flows for the year then ended (not presented herein); and in our report dated February 13, 2019, we expressed an unqualified opinion on those consolidated financial statements. In our opinion, the information set forth in the accompanying consolidated balance sheet as of December 31, 2018 is fairly stated, in all material respects, in relation to the consolidated balance sheet from which it has been derived.
Adoption of a New Accounting Pronouncement
As discussed in Note 1 to the consolidated financial statements, the Company has changed its method of accounting for leases at January 1, 2019, on a prospective basis due to the adoption of Accounting Standards Codification Topic 842, Leases.
Basis for Review Results
This consolidated interim financial information is the responsibility of the Company’s management. We are a public accounting firm registered with the PCAOB and are required to be independent with respect to the Company in accordance with the U.S. federal securities laws and the applicable rules and regulations of the Securities and Exchange Commission and the PCAOB.
We conducted our reviews in accordance with the standards of the PCAOB. A review of consolidated interim financial information consists principally of applying analytical procedures and making inquiries of persons responsible for financial and accounting matters. It is substantially less in scope than an audit conducted in accordance with the standards of the PCAOB, the objective of which is the expression of an opinion regarding the financial statements taken as a whole. Accordingly, we do not express such an opinion.
/s/ KPMG LLP
Denver, Colorado
July 19, 2019
28
REPORT OF INDEPENDENT REGISTERED PUBLIC ACCOUNTING FIRM
To the Partners
Prologis, L.P.:
Results of Review of Interim Financial Information
We have reviewed the consolidated balance sheet of Prologis, L.P. and subsidiaries (the Company) as of June 30, 2019, the related consolidated statements of income and comprehensive income for the three-month and six-month periods ended June 30, 2019 and 2018, the related consolidated statements of capital for the three-month and six-month periods ended June 30, 2019 and 2018, the related consolidated statements of cash flows for the six-month periods ended June 30, 2019 and 2018, and the related notes (collectively, the consolidated interim financial information). Based on our reviews, we are not aware of any material modifications that should be made to the consolidated interim financial information for it to be in conformity with U.S. generally accepted accounting principles.
We have previously audited, in accordance with the standards of the Public Company Accounting Oversight Board (United States) (PCAOB), the consolidated balance sheet of the Company as of December 31, 2018, and the related consolidated statements of income, comprehensive income, capital, and cash flows for the year then ended (not presented herein); and in our report dated February 13, 2019, we expressed an unqualified opinion on those consolidated financial statements. In our opinion, the information set forth in the accompanying consolidated balance sheet as of December 31, 2018 is fairly stated, in all material respects, in relation to the consolidated balance sheet from which it has been derived.
Adoption of a New Accounting Pronouncement
As discussed in Note 1 to the consolidated financial statements, the Company has changed its method of accounting for leases at January 1, 2019, on a prospective basis due to the adoption of Accounting Standards Codification Topic 842, Leases.
Basis for Review Results
This consolidated interim financial information is the responsibility of the Company’s management. We are a public accounting firm registered with the PCAOB and are required to be independent with respect to the Company in accordance with the U.S. federal securities laws and the applicable rules and regulations of the Securities and Exchange Commission and the PCAOB.
We conducted our reviews in accordance with the standards of the PCAOB. A review of consolidated interim financial information consists principally of applying analytical procedures and making inquiries of persons responsible for financial and accounting matters. It is substantially less in scope than an audit conducted in accordance with the standards of the PCAOB, the objective of which is the expression of an opinion regarding the financial statements taken as a whole. Accordingly, we do not express such an opinion.
/s/ KPMG LLP
Denver, Colorado
July 19, 2019
29
ITEM 2. Management’s Discussion and Analysis of Financial Condition and Results of Operations
The following should be read in conjunction with the Consolidated Financial Statements and related Notes included in Item 1 of this report and our Annual Report on Form 10-K for the year ended December 31, 2018, as filed with the United States (“U.S.”) Securities and Exchange Commission (“SEC”).
The statements in this report that are not historical facts are forward-looking statements within the meaning of Section 27A of the Securities Act of 1933, as amended, and Section 21E of the Securities Exchange Act of 1934, as amended. These forward-looking statements are based on current expectations, estimates and projections about the industry and markets in which we operate as well as management’s beliefs and assumptions. Such statements involve uncertainties that could significantly impact our financial results. Words such as “expects,” “anticipates,” “intends,” “plans,” “believes,” “seeks,” and “estimates” including variations of such words and similar expressions are intended to identify such forward-looking statements, which generally are not historical in nature. All statements that address operating performance, events or developments that we expect or anticipate will occur in the future — including statements relating to rent and occupancy growth, development activity, contribution and disposition activity, general conditions in the geographic areas where we operate, our debt, capital structure and financial position, our ability to form new co-investment ventures and the availability of capital in existing or new co-investment ventures — are forward-looking statements. These statements are not guarantees of future performance and involve certain risks, uncertainties and assumptions that are difficult to predict. Although we believe the expectations reflected in any forward-looking statements are based on reasonable assumptions, we can give no assurance that our expectations will be attained, and therefore actual outcomes and results may differ materially from what is expressed or forecasted in such forward-looking statements. Some of the factors that may affect outcomes and results include, but are not limited to: (i) national, international, regional and local economic and political climates; (ii) changes in global financial markets, interest rates and foreign currency exchange rates; (iii) increased or unanticipated competition for our properties; (iv) risks associated with acquisitions, dispositions and development of properties; (v) maintenance of real estate investment trust (“REIT”) status, tax structuring and changes in income tax laws and rates; (vi) availability of financing and capital, the levels of debt that we maintain and our credit ratings; (vii) risks related to our investments in our co-investment ventures, including our ability to establish new co-investment ventures; (viii) risks of doing business internationally, including currency risks; (ix) environmental uncertainties, including risks of natural disasters; and (x) those additional factors discussed under Part I, Item 1A. Risk Factors in our Annual Report on Form 10-K for the year ended December 31, 2018. We undertake no duty to update any forward-looking statements appearing in this report except as may be required by law.
Prologis, Inc. is a self-administered and self-managed REIT and is the sole general partner of Prologis, L.P. through which it holds substantially all of its assets. We operate Prologis, Inc. and Prologis, L.P. as one enterprise and, therefore, our discussion and analysis refers to Prologis, Inc. and its consolidated subsidiaries, including Prologis, L.P., collectively. We invest in real estate through wholly owned subsidiaries and other entities through which we co-invest with partners and investors. We have a significant ownership in the co-investment ventures, which may be consolidated or unconsolidated based on our level of control of the entity.
MANAGEMENT’S OVERVIEW
Prologis is the global leader in logistics real estate with a focus on key markets in 19 countries on four continents. We own, manage and develop well-located, high-quality logistics facilities. Our local teams actively manage our portfolio, which encompasses leasing and property management, capital deployment and opportunistic dispositions allowing us to recycle capital to self-fund our development and acquisition activities. The majority of our properties in the U.S. are wholly owned, while our properties outside the U.S. are generally held in co-investment ventures to mitigate our exposure to foreign currency movements.
Our irreplaceable portfolio is focused on the world’s most vibrant markets where consumption and supply chain reconfiguration drive logistics demand. In the developed markets of the U.S., Europe and Japan, key demand drivers include the reconfiguration of supply chains (strongly influenced by e-commerce trends), the demand for sustainable design features and the operational efficiencies that can be realized from high-quality logistics facilities. In emerging markets, such as Brazil, China and Mexico, growing affluence and the rise of a new consumer class have increased the need for modern distribution networks. Our strategy is to own the highest-quality logistics property portfolio in each of our target markets. These markets are characterized by what is most important for the consumption side of a logistics supply chain — large population centers with proximity to labor pools, surrounded by highways, rail service or ports. Customers turn to us because they know an efficient supply chain will make their businesses succeed, and that a strategic relationship with Prologis will create a competitive advantage.
We operate and manage our business on an owned and managed (“O&M”) basis and therefore evaluate the operating performance of the properties for our O&M portfolio, which includes our consolidated properties and properties owned by our unconsolidated co-investment ventures. We make decisions based on our total O&M portfolio at 100%, as we manage these properties regardless of ownership. We also evaluate our operating results based on our proportionate economic ownership of each property included in the O&M portfolio (“our share”) as it represents the financial results of our O&M portfolio.
At June 30, 2019, our total O&M portfolio at 100%, including properties and development projects (based on gross book value and total expected investment (“TEI”), totaled $71.0 billion across 786 million square feet (73 million square meters) and four continents. Our share of the total O&M portfolio was $42.6 billion. We lease modern logistics facilities to a diverse base of approximately 5,100 customers.
30
Our business comprises two operating segments: Real Estate Operations and Strategic Capital.
Below is information summarizing consolidated activity within our segments (in millions):
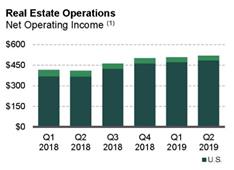
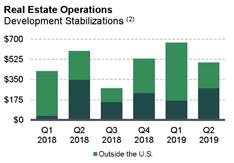
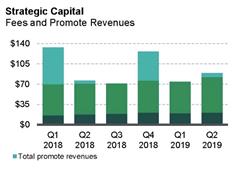
|
(1) |
Net operating income (“NOI”) is a non-U.S. generally accepted accounting principle (“GAAP”) financial measure. NOI from Real Estate Operations is calculated directly from our Consolidated Financial Statements as Rental Revenues and Development Management and Other Revenues less Rental Expenses and Other Expenses. See the Results of Operations section for a reconciliation of NOI to Operating Income, the most directly comparable GAAP measure. |
|
(2) |
A developed property moves into the operating portfolio when it meets our definition of stabilization, which is the earlier of one year after completion or reaching 90% occupancy. Amounts represent our TEI, which is comprised of the estimated cost of development or expansion, including land, construction and leasing costs. |
Real Estate Operations
Rental. Rental operations comprise the largest component of our operating segments and generally contribute 85% to 90% of our consolidated revenues, earnings and funds from operations (“FFO”). FFO is a non-GAAP financial measure. See below for a reconciliation of Net Earnings Attributable to Common Stockholders in the Consolidated Statements of Income to our FFO measure. We collect rent from our customers through long-term operating leases, including reimbursements for the majority of our property operating costs. We expect to generate long-term internal growth by increasing rents, maintaining high occupancy rates and controlling expenses. The primary driver of our revenue growth will be rolling in-place leases to current market rents coupled with increasing market rents. We believe our active portfolio management, combined with the skills of our property, leasing, maintenance, capital, energy, sustainability and risk management teams, will allow us to maximize rental revenue across our portfolio. A significant amount of our rental revenue, NOI and cash flows are generated in the U.S.
Development. We develop properties to meet our customers’ needs, deepen our market presence and refresh our portfolio quality. We believe we have a competitive advantage due to (i) the strategic locations of our land bank; (ii) the development expertise of our local teams; and (iii) the depth of our customer relationships. Successful development and redevelopment efforts provide significant earnings growth as projects lease up and generate income and increase the net asset value of our Real Estate Operations segment. Based on our current estimates, our consolidated land bank, excluding land we have under option contracts, has the potential to support the development of $7.4 billion of TEI of new logistics space. Generally, we develop properties in the U.S. for long-term hold and outside the U.S. for contribution to our unconsolidated co-investment ventures.
Strategic Capital
Real estate is a capital-intensive business that requires new capital to grow. Our strategic capital business gives us access to third-party capital, both private and public, allowing us to diversify our sources of capital and providing us with a broad range of options to fund our growth, while reducing our exposure to foreign currency movements for investments outside of the U.S. We partner with some of the world’s largest institutional investors to grow our business and provide incremental revenues. We also access alternative sources of equity through two publicly traded vehicles: Nippon Prologis REIT, Inc. in Japan and FIBRA Prologis in Mexico. We align our interests with those of our partners by holding significant ownership interests in all of our unconsolidated co-investment ventures (ranging from 15% to 50%).
This segment produces stable, long-term cash flows and generally contributes 10% to 15% of our consolidated revenues, earnings and FFO. We generate strategic capital revenues from our unconsolidated co-investment ventures, principally through asset and property management services. Generally, all of these revenues are earned from long-term and open-ended ventures. We earn additional revenues by providing leasing, acquisition, construction, development, financing, legal and disposition services. In certain ventures, we also have the ability to earn revenues through incentive fees (“promotes” or “promote revenue”) periodically during the life of a venture or upon liquidation. We plan to profitably grow this business by increasing our assets under management in existing or new ventures. Most of the strategic capital revenues are generated outside the U.S. NOI in this segment is calculated directly from our Consolidated Financial Statements as Strategic Capital Revenues less Strategic Capital Expenses and excludes property-related NOI.
31
FUTURE GROWTH
We believe the quality and scale of our global portfolio, the expertise of our team, the depth of our customer relationships and the strength of our balance sheet give us unique competitive advantages to grow revenues, NOI, earnings, FFO and cash flows.
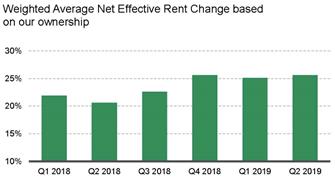
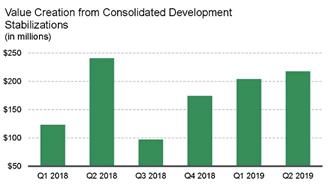
|
• |
Rent Growth. We expect market rents to continue to grow over the next few years, driven by demand for the location and quality of our properties. Due to strong market rent growth over the last several years, our in-place leases have considerable upside potential. We estimate that our leases are more than 15% below current market rent on the basis of our weighted average ownership at June 30, 2019. Therefore, even if market rents remain flat, a lease renewal will translate into increased future rental income, on a consolidated basis or through the earnings we recognize from our unconsolidated co-investment ventures based on our ownership. We have experienced positive rent change on rollover (comparing the net effective rent of the new lease to the prior lease for the same space) every quarter since 2013. We expect this trend to continue for several more years due to our current in-place rents being below market coupled with increasing market rents. |
|
• |
Value Creation from Development. A successful development and redevelopment program involves maintaining control of well-located and entitled land. We believe the carrying value of our land bank is below its current fair value. Due to the strategic nature of our land bank and development expertise of our teams, we expect to realize future value creation as we build out the land bank. We measure the estimated development value as the margin above our anticipated cost to develop. We calculate the margin using estimated yield and capitalization rates from our underwriting models. As properties under development stabilize, we expect to realize the value creation principally through contributions to the unconsolidated co-investment ventures and increases in the NOI of our operating portfolio. |
SUMMARY OF 2019
During the six months ended June 30, 2019, operating fundamentals remained strong for our O&M portfolio and we ended the period with occupancy of 96.8%.
In 2019, we completed the following significant activities as described in the Notes to the Consolidated Financial Statements:
|
• |
In January, we formed Prologis Brazil Logistics Venture (“PBLV”), a Brazilian unconsolidated co-investment venture, with one partner. We contributed an initial portfolio of real estate properties to PBLV consisting of 14 operating properties totaling 7 million square feet and 371 acres of land. We received total proceeds of $620 million, including cash and units, and retained a 20% equity interest. |
|
• |
Excluding the contribution to PBLV, we generated net proceeds of $921 million and realized net gains of $270 million, primarily from the contribution of properties to our unconsolidated co-investment ventures in Japan and Europe in the second quarter. |
|
• |
In February, we redeemed a portion of our investment in Prologis European Logistics Fund (“PELF”) for proceeds of €278 million ($313 million). |
|
• |
We completed the following financing activities: |
|
|
• |
We upsized our global senior credit facility by $500 million to $3.5 billion with maturity in January 2023. At June 30, 2019, we had $3.8 billion of available borrowing capacity under our credit facilities. |
|
|
• |
We entered into two unsecured Japanese yen term loans for a total of ¥15.0 billion ($137 million) that bear interest of Yen LIBOR plus 0.5% to 0.6% and are scheduled to mature in January 2028 and 2030. |
|
|
• |
We entered into an unsecured Japanese yen term loan agreement (the “March 2019 Yen Term Loan”) under which we can draw Japanese yen in an aggregate amount not to exceed ¥85.0 billion ($789 million at June 30, 2019). The March |
32
|
|
2019 Yen Term Loan bears interest at Yen LIBOR plus 0.4% and is scheduled to mature in March 2026. We have the ability to increase the March 2019 Yen Term Loan to ¥120.0 billion ($1.1 billion at June 30, 2019), subject to obtaining additional lender commitments. We used the proceeds from the March 2019 Yen Term Loan primarily to repay the outstanding balance of ¥100.0 billion ($897 million) on our 2016 Japanese yen term loan. |
|
|
• |
We completed a private placement for ¥10.0 billion ($91 million) of senior notes with a stated interest rate of 1.2%, maturing in March 2039. |
On July 15, 2019, we entered into a merger agreement to acquire the wholly-owned real estate assets of Industrial Property Trust Inc. (“IPT”) for approximately $4.0 billion in a cash transaction, including the assumption and repayment of debt. The transaction, currently expected to close in the fourth quarter of 2019 or first quarter of 2020, is subject to the approval of IPT stockholders and other customary closing conditions. Following the closing, we intend to hold the portfolio through either one or both of our U.S. co-investment ventures.
Throughout this discussion, we reflect amounts in U.S. dollars, our reporting currency. Included in these amounts are consolidated and unconsolidated investments denominated in foreign currencies, principally the British pound sterling, euro and Japanese yen that are impacted by fluctuations in exchange rates when translated to U.S. dollars. We mitigate our exposure to foreign currency fluctuations by investing outside the U.S. through co-investment ventures, borrowing in the functional currency of our consolidated subsidiaries and utilizing derivative financial instruments.
RESULTS OF OPERATIONS – SIX MONTHS ENDED JUNE 30, 2019 AND 2018
We evaluate our business operations based on the NOI of our two operating segments: Real Estate Operations and Strategic Capital. NOI by segment is a non-GAAP performance measure that is calculated using revenues and expenses directly from our financial statements. We consider NOI by segment to be an appropriate supplemental measure of our operating performance because it helps management and investors understand our operating results.
Below is a reconciliation of our NOI by segment to Operating Income per the Consolidated Financial Statements for the six months ended June 30 (in millions). Each segment’s NOI is reconciled to the respective line items in the Consolidated Financial Statements in the respective segment discussion below.
|
|
|
2019 |
|
|
2018 |
|
||
|
Real Estate Operations – NOI |
|
$ |
1,023 |
|
|
$ |
822 |
|
|
Strategic Capital – NOI |
|
|
88 |
|
|
|
130 |
|
|
General and administrative expenses |
|
|
(136 |
) |
|
|
(120 |
) |
|
Depreciation and amortization expenses |
|
|
(568 |
) |
|
|
(408 |
) |
|
Operating income before gains on real estate transactions, net |
|
|
407 |
|
|
|
424 |
|
|
Gains on real estate transactions, net |
|
|
412 |
|
|
|
290 |
|
|
Operating income |
|
$ |
819 |
|
|
$ |
714 |
|
See Note 11 to the Consolidated Financial Statements for more information on our segments and a reconciliation of each business segment’s NOI to Operating Income and Earnings Before Income Taxes.
Real Estate Operations
This operating segment principally includes rental revenue and rental expenses recognized from our consolidated properties. We allocate the costs of our property management and leasing functions to the Real Estate Operations segment through Rental Expenses and the Strategic Capital segment through Strategic Capital Expenses based on the square footage of the relative portfolios. The operating fundamentals in the markets in which we operate continue to be strong, which has increased rents, kept occupancies high and fueled development activity. In addition, this segment is impacted by our development, acquisition and disposition activities.
Below are the components of Real Estate Operations revenues, expenses and NOI for the six months ended June 30, derived directly from line items in the Consolidated Financial Statements (in millions):
|
|
|
2019 |
|
|
2018 |
|
||
|
Rental revenues (1) |
|
$ |
1,397 |
|
|
$ |
1,100 |
|
|
Development management and other revenues |
|
|
2 |
|
|
|
6 |
|
|
Rental expenses |
|
|
(369 |
) |
|
|
(276 |
) |
|
Other expenses |
|
|
(7 |
) |
|
|
(8 |
) |
|
Real Estate Operations – NOI |
|
$ |
1,023 |
|
|
$ |
822 |
|
|
|
|
|
|
|
|
|
|
|
|
(1) |
As disclosed in Note 1 to the Consolidated Financial Statements, under the new lease standard, we adopted the practical expedient to present rental revenue and rental recoveries as a single component under Rental Revenues in our Consolidated Statements of Income. |
33
The change in Real Estate Operations NOI for the six months ended June 30, 2019 from the same period in 2018, was impacted by the following items (in millions):
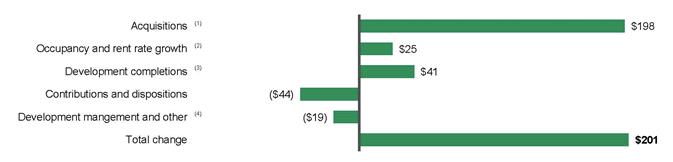
|
(1) |
Acquisition activity increased NOI in 2019, compared to 2018, primarily due to the acquisition of DCT Industrial Trust Inc. and DCT Industrial Operating Partnership LP (collectively “DCT”), which was completed for $8.5 billion on August 22, 2018 (“DCT Transaction”). |
|
(2) |
During both periods, we experienced positive rent rate growth. Rent rate growth (or rent change) is a combination of the rollover of existing leases and increases in certain rental rates from contractual rent increases on existing leases. If a lease has a contractual rent increase that is not known at the time the lease commences, such as the consumer price index or a similar metric, the rent increase is not included in rent leveling and therefore, impacts the rental revenue we recognize. See below for key metrics on occupancy and rent change on rollover for the consolidated operating portfolio. |
|
(3) |
We calculate changes in NOI from development completions period over period by comparing the change in NOI generated on the pool of developments that were completed on or after January 1, 2018 through June 30, 2019. |
|
(4) |
Other items include internal costs related to leasing activities, expense recoveries, non-recoverable expenses and changes in foreign currency exchange rates. |
Below are key operating metrics of our consolidated operating portfolio.
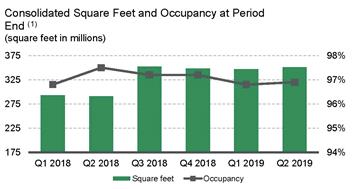
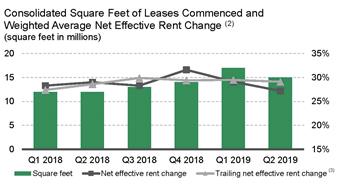
|
(1) |
In August 2018, we completed the DCT Transaction and acquired a portfolio of logistics real estate assets. |
|
(2) |
Consolidated square feet of leases commenced and weighted average net effective rent change were calculated for leases with initial terms of one year or greater. |
|
(3) |
Calculated using the trailing twelve months immediately prior to the period ended. |
34
Development Activity
The following table summarizes consolidated development activity for the six months ended June 30 (dollars and square feet in millions):
|
|
|
2019 |
|
|
2018 |
|
||
|
Starts: |
|
|
|
|
|
|
|
|
|
Number of new development projects during the period |
|
|
23 |
|
|
|
32 |
|
|
Square feet |
|
|
5 |
|
|
|
11 |
|
|
TEI |
|
$ |
516 |
|
|
$ |
1,150 |
|
|
Percentage of build-to-suits based on TEI |
|
|
35.5 |
% |
|
|
38.0 |
% |
|
|
|
|
|
|
|
|
|
|
|
Stabilizations: |
|
|
|
|
|
|
|
|
|
Number of development projects stabilized during the period |
|
|
31 |
|
|
|
31 |
|
|
Square feet |
|
|
12 |
|
|
|
13 |
|
|
TEI |
|
$ |
1,166 |
|
|
$ |
1,022 |
|
|
Weighted average stabilized yield (1) |
|
|
6.5 |
% |
|
|
6.6 |
% |
|
Estimated value at completion |
|
$ |
1,588 |
|
|
$ |
1,386 |
|
|
Estimated weighted average margin |
|
|
36.2 |
% |
|
|
35.6 |
% |
|
(1) |
We calculate the weighted average stabilized yield as estimated NOI assuming stabilized occupancy divided by TEI. |
At June 30, 2019, our development portfolio, including properties under development and prestabilized properties, was 46.7% leased and expected to be completed before December 2020.
Capital Expenditures
We capitalize costs incurred in renovating and improving our operating properties as part of the investment basis. With the adoption of the new lease standard on January 1, 2019, we no longer capitalize internal costs related to our leasing activities. The prior period amounts were not adjusted and continue to be recognized in accordance with previously applicable guidance, as detailed in Note 1 to the Consolidated Financial Statements. The following graph summarizes our total capital expenditures, excluding development costs, and property improvements per square foot of our consolidated operating properties during each quarter:
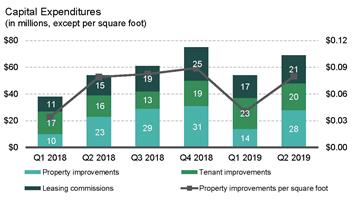
Strategic Capital
This operating segment includes revenues from asset and property management and other fees for services performed, as well as promote revenue earned from the unconsolidated entities. Revenues associated with the Strategic Capital segment fluctuate because of changes in the fair value of the properties owned by the ventures, transactional activity including acquisitions and dispositions, foreign currency exchange rates and the timing of promotes. These revenues are reduced by the costs associated with the asset and property-level management expenses we incur in managing the properties owned by these ventures. We allocate the costs of our property management and leasing functions to the Strategic Capital segment through Strategic Capital Expenses and to the Real Estate Operations segment through Rental Expenses based on the square footage of the relative portfolios.
35
Below are the components of Strategic Capital revenues, expenses and NOI for the six months ended June 30, derived directly from the line items in the Consolidated Financial Statements (in millions):
|
|
|
2019 |
|
|
2018 |
|
||
|
Strategic capital revenues |
|
$ |
163 |
|
|
$ |
209 |
|
|
Strategic capital expenses |
|
|
(75 |
) |
|
|
(79 |
) |
|
Strategic Capital – NOI |
|
$ |
88 |
|
|
$ |
130 |
|
Below is additional detail of our Strategic Capital revenues, expenses and NOI for the six months ended June 30 (in millions):
|
|
|
U.S. (1) |
|
|
Other Americas |
|
|
Europe |
|
|
Asia |
|
|
Total |
|
|||||||||||||||||||||||||
|
|
|
2019 |
|
|
2018 |
|
|
2019 |
|
|
2018 |
|
|
2019 |
|
|
2018 |
|
|
2019 |
|
|
2018 |
|
|
2019 |
|
|
2018 |
|
||||||||||
|
Strategic capital revenues ($) |
|
|
|
|
|
|
|
|
|
|
|
|
|
|
|
|
|
|
|
|
|
|
|
|
|
|
|
|
|
|
|
|
|
|
|
|
|
|
|
|
|
Recurring fees (2) |
|
|
35 |
|
|
|
31 |
|
|
|
15 |
|
|
|
12 |
|
|
|
51 |
|
|
|
48 |
|
|
|
27 |
|
|
|
23 |
|
|
|
128 |
|
|
|
114 |
|
|
Transactional fees (3) |
|
|
6 |
|
|
|
3 |
|
|
|
2 |
|
|
|
1 |
|
|
|
8 |
|
|
|
11 |
|
|
|
12 |
|
|
|
12 |
|
|
|
28 |
|
|
|
27 |
|
|
Promote revenue (4) |
|
|
- |
|
|
|
- |
|
|
|
5 |
|
|
|
5 |
|
|
|
2 |
|
|
|
9 |
|
|
|
- |
|
|
|
54 |
|
|
|
7 |
|
|
|
68 |
|
|
Total strategic capital revenues ($) |
|
|
41 |
|
|
|
34 |
|
|
|
22 |
|
|
|
18 |
|
|
|
61 |
|
|
|
68 |
|
|
|
39 |
|
|
|
89 |
|
|
|
163 |
|
|
|
209 |
|
|
Strategic capital expenses ($) |
|
|
(30 |
) |
|
|
(32 |
) |
|
|
(7 |
) |
|
|
(6 |
) |
|
|
(18 |
) |
|
|
(21 |
) |
|
|
(20 |
) |
|
|
(20 |
) |
|
|
(75 |
) |
|
|
(79 |
) |
|
Strategic Capital – NOI ($) |
|
|
11 |
|
|
|
2 |
|
|
|
15 |
|
|
|
12 |
|
|
|
43 |
|
|
|
47 |
|
|
|
19 |
|
|
|
69 |
|
|
|
88 |
|
|
|
130 |
|
|
|
|
|
|
|
|
|
|
|
|
|
|
|
|
|
|
|
|
|
|
|
|
|
|
|
|
|
|
|
|
|
|
|
|
|
|
|
|
|
|
|
|
(1) |
The U.S. expenses include compensation and personnel costs for employees who were based in the U.S. but also support other regions. |
|
(2) |
Recurring fees include asset and property management fees. |
|
(3) |
Transactional fees include leasing commission, acquisition, development and other fees. |
|
(4) |
Promote revenue is earned based on a ventures’ cumulative returns over a certain time period, generally three years. We include promote revenue in proportion to the third-party investor’s equity interest in Strategic Capital Revenues. Approximately 40% of the promote revenue included in Strategic Capital Revenues is paid to our employees as a combination of cash and stock awards pursuant to the terms of the Prologis Promote Plan and expensed through Strategic Capital Expenses, as vested. |
The following real estate investments were held by our unconsolidated co-investment ventures based on historical cost (dollars and square feet in millions):
|
|
U.S. |
|
|
Other Americas |
|
|
Europe |
|
|
Asia |
|
|
Total |
|
|||||||||||||||||||||||||
|
|
Jun 30, 2019 |
|
|
Dec 31, 2018 |
|
|
Jun 30, 2019 (1) |
|
|
Dec 31, 2018 |
|
|
Jun 30, 2019 |
|
|
Dec 31, 2018 |
|
|
Jun 30, 2019 |
|
|
Dec 31, 2018 |
|
|
Jun 30, 2019 |
|
|
Dec 31, 2018 |
|
||||||||||
|
Ventures |
|
1 |
|
|
|
1 |
|
|
|
2 |
|
|
|
2 |
|
|
|
3 |
|
|
|
3 |
|
|
|
2 |
|
|
|
2 |
|
|
|
8 |
|
|
|
8 |
|
|
Operating properties |
|
585 |
|
|
|
566 |
|
|
|
213 |
|
|
|
209 |
|
|
|
698 |
|
|
|
669 |
|
|
|
138 |
|
|
|
125 |
|
|
|
1,634 |
|
|
|
1,569 |
|
|
Square feet |
|
93 |
|
|
|
91 |
|
|
|
44 |
|
|
|
39 |
|
|
|
168 |
|
|
|
159 |
|
|
|
58 |
|
|
|
51 |
|
|
|
363 |
|
|
|
340 |
|
|
Total assets ($) |
|
7,464 |
|
|
|
7,303 |
|
|
|
2,751 |
|
|
|
2,137 |
|
|
|
13,948 |
|
|
|
13,028 |
|
|
|
7,941 |
|
|
|
7,089 |
|
|
|
32,104 |
|
|
|
29,557 |
|
|
(1) |
PBLV and our other Brazilian joint ventures are combined as one venture for the purpose of this table. |
See Note 4 to the Consolidated Financial Statements for additional information on our unconsolidated co-investment ventures.
General and Administrative (“G&A”) Expenses
G&A expenses were $136 million and $120 million for the six months ended June 30, 2019 and 2018, respectively. G&A expenses increased over the last year due to higher compensation expenses based largely on the increase of our share price.
We capitalize certain internal costs, including salaries and related expenses, directly related to our development activities. We previously capitalized G&A related to our internal leasing activities, however, with the adoption of the new lease standard on January 1, 2019 these costs are expensed and recorded to Rental Expenses in the Consolidated Statements of Income. See Note 1 to the Consolidated Financial Statements for additional information.
36
The following table summarizes capitalized G&A for the six months ended June 30 (in millions):
|
|
|
2019 |
|
|
2018 |
|
||
|
Building and land development activities |
|
$ |
35 |
|
|
$ |
31 |
|
|
Leasing activities |
|
|
- |
|
|
|
11 |
|
|
Operating building improvements and other |
|
|
10 |
|
|
|
8 |
|
|
Total capitalized G&A expenses |
|
$ |
45 |
|
|
$ |
50 |
|
|
Capitalized salaries and related costs as a percent of total salaries and related costs |
|
|
19.5 |
% |
|
|
23.7 |
% |
Depreciation and Amortization Expenses
Depreciation and amortization expenses were $568 million and $408 million for the six months ended June 30, 2019 and 2018, respectively.
The following table highlights the key changes in depreciation and amortization expenses during the six months ended June 30, 2019 from the same period in 2018 (in millions):
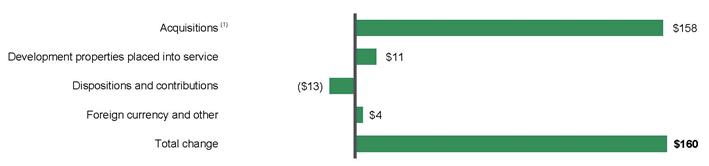
|
(1) |
The acquisition of properties primarily includes the DCT Transaction through which we acquired operating properties and the related intangible assets in the third quarter of 2018. See Note 2 for more information on the DCT Transaction. |
Gains on Real Estate Transactions, Net
The following table summarizes our gains on real estate transactions, net for the six months ended June 30 (in millions):
|
|
|
2019 |
|
|
2018 |
|
||
|
Contributions to unconsolidated entities (1) |
|
$ |
258 |
|
|
$ |
202 |
|
|
Dispositions to third parties (1) |
|
|
19 |
|
|
|
88 |
|
|
Total gains on contributions and dispositions, net |
|
$ |
277 |
|
|
$ |
290 |
|
|
Gain on partial redemption of investment in an unconsolidated co-investment venture |
|
|
135 |
|
|
|
- |
|
|
Total gains on real estate transactions, net |
|
$ |
412 |
|
|
$ |
290 |
|
(1) Includes $239 million and $221 million of gains recognized upon the sale of land and properties, that were developed with the intent to contribute or sell upon completion, for the six months ended June 30, 2019 and 2018, respectively.
We utilized the proceeds from these transactions primarily to fund our capital investments during both periods. See Notes 3 and 4 to the Consolidated Financial Statements for further information on the gains we recognized.
Our O&M Operating Portfolio
We manage our business and review our operating fundamentals on an O&M basis, which includes consolidated properties and properties owned our unconsolidated co-investment ventures. We believe reviewing these fundamentals this way allows management to understand the entire impact to the financial statements, as it will affect both the Real Estate Operations and Strategic Capital segments, as well as the net earnings we recognize from our unconsolidated co-investment ventures based on our ownership. We do not control the unconsolidated co-investment ventures for purposes of GAAP and the presentation of the ventures’ operating information does not represent a legal claim.
37
Our O&M operating portfolio does not include our development portfolio, value-added properties, non-industrial properties or properties held for sale to third parties. Value-added properties are properties that are expected to be repurposed or redeveloped to a higher and better use and recently acquired properties that present opportunities to create greater value.
See below for information on our O&M operating portfolio (square feet in millions):
|
|
June 30, 2019 |
|
|
December 31, 2018 |
|
||||||||||||||||||
|
|
Number of Properties |
|
|
Square Feet |
|
|
Percentage Occupied |
|
|
Number of Properties |
|
|
Square Feet |
|
|
Percentage Occupied |
|
||||||
|
Consolidated |
|
1,856 |
|
|
|
351 |
|
|
|
96.9 |
% |
|
|
1,835 |
|
|
|
348 |
|
|
|
97.2 |
% |
|
Unconsolidated |
|
1,617 |
|
|
|
361 |
|
|
|
96.6 |
% |
|
|
1,561 |
|
|
|
339 |
|
|
|
97.8 |
% |
|
Total |
|
3,473 |
|
|
|
712 |
|
|
|
96.8 |
% |
|
|
3,396 |
|
|
|
687 |
|
|
|
97.5 |
% |
Below are the key operating metrics summarizing the leasing activity of our O&M operating portfolio.
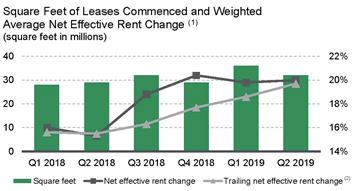
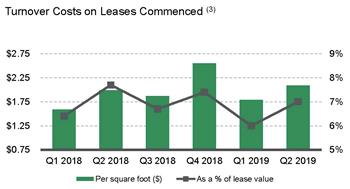
|
(1) |
Square feet of leases commenced and weighted average net effective rent change were calculated for leases with initial terms of one year or greater. We retained more than 70% of our customers, based on the total square feet of leases commenced during these periods. |
|
(2) |
Calculated using the trailing twelve months immediately prior to the period ended. |
|
(3) |
Turnover costs are defined as leasing commissions and tenant improvements and represent the obligations incurred in connection with the lease commencement for leases greater than one year. |
Same Store Analysis
Our same store metrics are non-GAAP financial measures, which are commonly used in the real estate industry and expected from the financial community, on both a net effective and cash basis. We evaluate the performance of the operating properties we own and manage using a “same store” analysis because the population of properties in this analysis is consistent from period to period, which allows us and investors to analyze our ongoing business operations. We determine our same store metrics on property NOI, which is calculated as rental revenue less rental expense for the applicable properties in the same store population for both consolidated and unconsolidated properties based on our ownership interest, as further defined below.
We define our same store population for the three months ended June 30, 2019 as the properties in our O&M operating portfolio, including the property NOI for both consolidated properties and properties owned by the unconsolidated co-investment ventures at January 1, 2018 and owned throughout the same three-month period in both 2018 and 2019. We believe the drivers of property NOI for the consolidated portfolio are generally the same for the properties owned by the ventures in which we invest and therefore we evaluate the same store metrics of the O&M portfolio based on Prologis’ ownership in the properties (“Prologis Share”). The same store population excludes properties held for sale to third parties, along with development properties that were not stabilized at the beginning of the period (January 1, 2018) and properties acquired or disposed of to third parties during the period. To derive an appropriate measure of period-to-period operating performance, we remove the effects of foreign currency exchange rate movements by using the reported period-end exchange rate to translate from local currency into the U.S. dollar, for both periods.
38
As non-GAAP financial measures, the same store metrics have certain limitations as an analytical tool and may vary among real estate companies. As a result, we provide a reconciliation of Rental Revenues less Rental Expenses (“Property NOI”) (from our Consolidated Financial Statements prepared in accordance with U.S. GAAP) to our Same Store Property NOI measures, as follows for the three months ended June 30 (dollars in millions):
|
|
|
|
|
|
|
|
|
|
Percentage |
|
|
|
|
2019 |
|
|
2018 |
|
|
Change |
|
|||
|
Reconciliation of Consolidated Property NOI to Same Store Property NOI measures: |
|
||||||||||
|
|
|
|
|
|
|
|
|
|
|
|
|
|
Rental revenues |
$ |
701 |
|
|
$ |
544 |
|
|
|
|
|
|
Rental expenses |
|
(181 |
) |
|
|
(133 |
) |
|
|
|
|
|
Consolidated Property NOI |
|
520 |
|
|
|
411 |
|
|
|
|
|
|
|
|
|
|
|
|
|
|
|
|
|
|
|
Adjustments to derive same store results: |
|
|
|
|
|
|
|
|
|
|
|
|
Property NOI from consolidated properties not included in same store portfolio and other adjustments (1)(2) |
|
(142 |
) |
|
|
(40 |
) |
|
|
|
|
|
Property NOI from unconsolidated co-investment ventures included in same store portfolio (1)(2) |
|
454 |
|
|
|
434 |
|
|
|
|
|
|
Third parties' share of Property NOI from properties included in same store portfolio (1)(2) |
|
(366 |
) |
|
|
(357 |
) |
|
|
|
|
|
Prologis Share of Same Store Property NOI – Net Effective (2) |
$ |
466 |
|
|
$ |
448 |
|
|
|
4.2 |
% |
|
Consolidated properties straight-line rent and fair value lease adjustments included in same store portfolio (3) |
|
(4 |
) |
|
|
(4 |
) |
|
|
|
|
|
Unconsolidated co-investment ventures straight-line rent and fair value lease adjustments included in same store portfolio (3) |
|
(3 |
) |
|
|
(9 |
) |
|
|
|
|
|
Third parties' share of straight-line rent and fair value lease adjustments included in same store portfolio (2)(3) |
|
3 |
|
|
|
7 |
|
|
|
|
|
|
Prologis Share of Same Store Property NOI – Cash (2)(3) |
$ |
462 |
|
|
$ |
442 |
|
|
|
4.6 |
% |
|
|
(1) |
We exclude properties held for sale to third parties, along with development properties that were not stabilized at the beginning of the period and properties acquired or disposed of to third parties during the period. We also exclude net termination and renegotiation fees to allow us to evaluate the growth or decline in each property’s rental revenues without regard to one-time items that are not indicative of the property’s recurring operating performance. Net termination and renegotiation fees represent the gross fee negotiated to allow a customer to terminate or renegotiate their lease, offset by the write-off of the asset recorded due to the adjustment to straight-line rents over the lease term. Same Store Property NOI is adjusted to include an allocation of property management expenses for our consolidated properties based on the property management services provided to each property (generally, based on a percentage of revenues). On consolidation, these amounts are eliminated and the actual costs of providing property management services are recognized as part of our consolidated rental expense. |
|
|
(2) |
We include the Property NOI for the same store portfolio for both consolidated properties and properties owned by the co-investment ventures based on our investment in the underlying properties. In order to calculate our share of Same Store Property NOI from the co-investment ventures in which we own less than 100%, we use the co-investment ventures’ underlying Property NOI for the same store portfolio and apply our ownership percentage at June 30, 2019 to the Property NOI for both periods, including the properties contributed during the period. We adjust the total Property NOI from the same store portfolio of the co-investment ventures by subtracting the third parties’ share of both consolidated and unconsolidated co-investment ventures. |
During the periods presented, certain wholly owned properties were contributed to a co-investment venture and are included in the same store portfolio. Neither our consolidated results nor those of the co-investment ventures, when viewed individually, would be comparable on a same store basis because of the changes in composition of the respective portfolios from period to period (e.g. the results of a contributed property are included in our consolidated results through the contribution date and in the results of the venture subsequent to the contribution date based on our ownership interest at the end of the period). As a result, only line items labeled “Prologis Share of Same Store Property NOI” are comparable period over period.
|
|
(3) |
We further remove certain noncash items (straight-line rent and amortization of fair value lease adjustments) included in the financial statements prepared in accordance with U.S. GAAP to reflect a Same Store Property NOI – Cash measure. |
We manage our business and compensate our executives based on the same store results of our O&M portfolio at 100% as we manage our portfolio on an ownership blind basis. We calculate those results by including 100% of the properties included in our same store portfolio.
Other Components of Income (Expense)
Earnings from Unconsolidated Entities, Net
We recognized net earnings from unconsolidated entities, which are accounted for using the equity method, of $105 million and $125 million for the six months ended June 30, 2019 and 2018, respectively. The earnings we recognize can be impacted by: (i) variances in
39
revenues and expenses of each venture; (ii) the size and occupancy rate of the portfolio of properties owned by each venture; (iii) gains or losses from the dispositions of properties and extinguishment of debt; (iv) our ownership interest in each venture; and (v) fluctuations in foreign currency exchange rates used to translate our share of net earnings to U.S. dollars.
See the discussion of our unconsolidated entities above in the Strategic Capital segment discussion and in Note 4 to the Consolidated Financial Statements for further breakdown of our share of net earnings recognized.
Interest Expense
The following table details our net interest expense for the six months ended June 30 (dollars in millions):
|
|
|
2019 |
|
|
2018 |
|
||
|
Gross interest expense |
|
$ |
137 |
|
|
$ |
120 |
|
|
Amortization of debt discount and debt issuance costs, net |
|
|
9 |
|
|
|
6 |
|
|
Capitalized amounts |
|
|
(26 |
) |
|
|
(23 |
) |
|
Net interest expense |
|
$ |
120 |
|
|
$ |
103 |
|
|
Weighted average effective interest rate during the period |
|
|
2.5 |
% |
|
|
2.9 |
% |
|
|
|
|
|
|
|
|
|
|
Interest expense increased due to the DCT Transaction and the gain recognized upon settlement of the interest rate swaps on the Canadian term loan in 2018, offset partially by refinancing of debt with lower interest rates.
See Note 6 to the Consolidated Financial Statements and the Liquidity and Capital Resources section below, for further discussion of our debt and borrowing costs.
Foreign Currency and Derivative Gains, Net
The following table details our foreign currency and derivative gains (losses), net for the six months ended June 30 (in millions):
|
|
|
2019 |
|
|
2018 |
|
||
|
Realized foreign currency and derivative gains (losses), net: |
|
|
|
|
|
|
|
|
|
Gains (losses) on the settlement of undesignated derivative transactions |
|
$ |
7 |
|
|
$ |
(8 |
) |
|
Losses on the settlement of transactions with third parties |
|
|
- |
|
|
|
(1 |
) |
|
Total realized foreign currency and derivative gains (losses), net |
|
|
7 |
|
|
|
(9 |
) |
|
|
|
|
|
|
|
|
|
|
|
Unrealized foreign currency and derivative gains (losses), net: |
|
|
|
|
|
|
|
|
|
Gains on the change in fair value of undesignated derivatives and unhedged nonderivative net investment hedges (1) |
|
|
5 |
|
|
|
58 |
|
|
Losses on remeasurement of certain assets and liabilities (2) |
|
|
(1 |
) |
|
|
(5 |
) |
|
Total unrealized foreign currency and derivative gains, net |
|
|
4 |
|
|
|
53 |
|
|
Total foreign currency and derivative gains, net |
|
$ |
11 |
|
|
$ |
44 |
|
|
|
|
|
|
|
|
|
|
|
|
(1) |
We borrow in the functional currencies of the countries where we invest and may designate these borrowings as nonderivative net investment hedges. We recognize gains or losses on the remeasurement of the unhedged portion of this debt and the related accrued interest. |
|
(2) |
Unrealized gains or losses were primarily related to the remeasurement of assets and liabilities that are denominated in currencies other than the functional currency of the entity, such as short-term intercompany loans between the U.S. parent and certain foreign consolidated subsidiaries and tax receivables and payables. Realized gains or losses are recognized upon settlement. |
See Note 10 to the Consolidated Financial Statements for more information about our derivative and nonderivative transactions.
Income Tax Expense
We recognize income tax expense related to our taxable REIT subsidiaries and in the local, state and foreign jurisdictions in which we operate. Our current income tax expense fluctuates from period to period based primarily on the timing of our taxable income. Deferred income tax expense (benefit) is generally a function of the period’s temporary differences and the utilization of net operating losses generated in prior years that had been previously recognized as deferred income tax assets in taxable subsidiaries.
40
The following table summarizes our income tax expense for the six months ended June 30 (in millions):
|
|
|
2019 |
|
|
2018 |
|
||
|
Current income tax expense: |
|
|
|
|
|
|
|
|
|
Income tax expense |
|
$ |
21 |
|
|
$ |
21 |
|
|
Income tax expense on dispositions |
|
|
10 |
|
|
|
10 |
|
|
Income tax expense on dispositions related to acquired tax liabilities |
|
|
- |
|
|
|
1 |
|
|
Total current income tax expense |
|
|
31 |
|
|
|
32 |
|
|
|
|
|
|
|
|
|
|
|
|
Deferred income tax expense (benefit): |
|
|
|
|
|
|
|
|
|
Income tax expense |
|
|
9 |
|
|
|
- |
|
|
Income tax benefit on dispositions related to acquired tax liabilities |
|
|
- |
|
|
|
(1 |
) |
|
Total deferred income tax expense (benefit) |
|
|
9 |
|
|
|
(1 |
) |
|
Total income tax expense |
|
$ |
40 |
|
|
$ |
31 |
|
|
|
|
|
|
|
|
|
|
|
Net Earnings Attributable to Noncontrolling Interests
This amount represents the third-party investors’ share of the earnings generated in consolidated entities in which we do not own 100% of the equity, reduced by the third-party share of fees or promotes payable to us and earned during the period. We had net earnings attributable to noncontrolling interests of $51 million and $53 million for the six months ended June 30, 2019 and 2018, respectively. Included in these amounts were $22 million and $21 million for the six months ended June 30, 2019 and 2018, of net earnings attributable to the common limited partnership unitholders of Prologis, L.P.
See Note 7 to the Consolidated Financial Statements for further information on our noncontrolling interests.
Other Comprehensive Income (Loss)
See Note 10 to the Consolidated Financial Statements for more information about our derivative and nonderivative transactions and other comprehensive income (loss).
RESULTS OF OPERATIONS – THREE MONTHS ENDED JUNE 30, 2019 AND 2018
Except as separately discussed above, the changes in comprehensive income attributable to common stockholders and unitholders and its components for the three months ended June 30, 2019, as compared to the three months ended June 30, 2018, are similar to the changes for the six-month periods ended on the same dates.
LIQUIDITY AND CAPITAL RESOURCES
Overview
We consider our ability to generate cash from operating activities, distributions from our co-investment ventures, contributions and dispositions of properties and available financing sources to be adequate to meet our anticipated future development, acquisition, operating, debt service, dividend and distribution requirements.
Near-Term Principal Cash Sources and Uses
In addition to dividends and distributions, we expect our primary cash needs will consist of the following:
|
• |
completion of the development and leasing of the properties in our consolidated development portfolio (at June 30, 2019, 93 properties in our development portfolio were 46.7% leased with a current investment of $2.0 billion and a TEI of $3.0 billion when completed and leased, leaving $1.0 billion of estimated additional required investment); |
|
• |
development of new properties for long-term investment or contributions to unconsolidated co-investment ventures, including the acquisition of land in certain markets; |
|
• |
capital expenditures and leasing costs for properties in our operating portfolio; |
|
• |
repayment of debt and scheduled principal payments of $16 million in 2019; |
|
• |
additional investments in current unconsolidated entities or new investments in future unconsolidated entities; |
|
• |
acquisition of operating properties or portfolios of operating properties, including the acquisition of IPT described above, (depending on market and other conditions) for direct, long-term investment in our consolidated portfolio (this might include |
41
|
acquisitions from our co-investment ventures); and |
|
• |
repurchase of our outstanding debt or equity securities (depending on prevailing market conditions, our liquidity, contractual restrictions and other factors) through cash purchases, open-market purchases, privately negotiated transactions, tender offers or otherwise. |
We expect to fund our cash needs principally from the following sources (subject to market conditions):
|
• |
available unrestricted cash balances ($401 million at June 30, 2019); |
|
• |
net cash flow from property operations; |
|
• |
fees earned for services performed on behalf of the co-investment ventures, including promotes; |
|
• |
distributions received from the co-investment ventures; |
|
• |
proceeds from the disposition of properties, land parcels or other investments to third parties; |
|
• |
proceeds from the contribution of properties to current or future co-investment ventures; |
|
• |
proceeds from the sale of a portion of our investments in co-investment ventures to align with long-term ownership targets; |
|
• |
borrowing capacity under our current credit facility arrangements ($3.8 billion available at June 30, 2019); and |
|
• |
proceeds from the issuance of debt. |
We may also generate proceeds from the issuance of equity securities, subject to market conditions.
Debt
The following table summarizes information about our consolidated debt by currency (dollars in millions):
|
|
|
June 30, 2019 |
|
|
|
|
|
|
December 31, 2018 |
|
|
|
|
|
||||||||||
|
|
|
Weighted Average Interest Rate |
|
|
Amount Outstanding |
|
|
% of Total |
|
|
Weighted Average Interest Rate |
|
|
Amount Outstanding |
|
|
% of Total |
|
||||||
|
British pound sterling |
|
|
2.3 |
% |
|
$ |
656 |
|
|
|
6.0 |
% |
|
|
2.3 |
% |
|
$ |
636 |
|
|
|
5.8 |
% |
|
Canadian dollar |
|
|
3.4 |
% |
|
|
278 |
|
|
|
2.5 |
% |
|
|
3.6 |
% |
|
|
266 |
|
|
|
2.4 |
% |
|
Euro |
|
|
2.2 |
% |
|
|
5,003 |
|
|
|
45.6 |
% |
|
|
2.2 |
% |
|
|
4,894 |
|
|
|
44.1 |
% |
|
Japanese yen |
|
|
0.7 |
% |
|
|
2,113 |
|
|
|
19.3 |
% |
|
|
0.9 |
% |
|
|
1,952 |
|
|
|
17.6 |
% |
|
U.S. dollar |
|
|
4.2 |
% |
|
|
2,918 |
|
|
|
26.6 |
% |
|
|
4.5 |
% |
|
|
3,342 |
|
|
|
30.1 |
% |
|
Total debt (1) |
|
|
2.5 |
% |
|
$ |
10,968 |
|
|
|
|
|
|
|
2.7 |
% |
|
$ |
11,090 |
|
|
|
|
|
|
(1) |
The weighted average maturity for total debt outstanding at June 30, 2019 and December 31, 2018 was 77 months and 76 months, respectively. |
Our credit ratings at June 30, 2019, were A3 from Moody’s and A- from S&P, both with stable outlook. These ratings allow us to borrow at an advantageous rate. Adverse changes in our credit ratings could negatively impact our business and, in particular, our refinancing and other capital market activities, our ability to manage debt maturities, our future growth and our development and acquisition activity. A securities rating is not a recommendation to buy, sell or hold securities and is subject to revision or withdrawal at any time by the rating organization.
At June 30, 2019, we were in compliance with all of our financial debt covenants. These covenants include customary financial covenants for total debt, encumbered debt and fixed charge coverage ratios.
See Note 6 to the Consolidated Financial Statements for further discussion on our debt.
Equity Commitments Related to Certain Co-Investment Ventures
Certain co-investment ventures have equity commitments from us and our venture partners. Our venture partners fulfill their equity commitment with cash. We may fulfill our equity commitment through contributions of properties or cash.
42
The following table summarizes the remaining equity commitments at June 30, 2019 (dollars in millions):
|
|
Equity Commitments |
|
|
|
|
|
|||||||||
|
|
Prologis |
|
|
Venture Partners |
|
|
Total |
|
|
Exchange Rate |
|
Expiration Date |
|||
|
Prologis Targeted U.S. Logistics Fund |
$ |
- |
|
|
$ |
732 |
|
|
$ |
732 |
|
|
N/A |
|
2021 – 2022 |
|
Prologis European Logistics Fund |
|
- |
|
|
|
703 |
|
|
|
703 |
|
|
1.14 U.S. dollar/ 1 euro |
|
2020 – 2022 |
|
Prologis UK Logistics Venture |
|
18 |
|
|
|
98 |
|
|
|
116 |
|
|
1.27 U.S. dollar/ 1 British pound sterling |
|
2021 |
|
Prologis China Logistics Venture |
|
207 |
|
|
|
1,173 |
|
|
|
1,380 |
|
|
N/A |
|
2020 – 2024 |
|
Prologis Brazil Logistics Venture |
|
52 |
|
|
|
209 |
|
|
|
261 |
|
|
3.83 Brazilian real/ 1 U.S. dollar |
|
2026 |
|
Total |
$ |
277 |
|
|
$ |
2,915 |
|
|
$ |
3,192 |
|
|
|
|
|
See the Cash Flow Summary below for more information about our investment activity in our co-investment ventures.
Cash Flow Summary
The following table summarizes our cash flow activity for the six months ended June 30 (in millions):
|
|
|
2019 |
|
|
2018 |
|
||
|
Net cash provided by operating activities |
|
$ |
1,004 |
|
|
$ |
773 |
|
|
Net cash provided by (used in) investing activities |
|
$ |
82 |
|
|
$ |
(187 |
) |
|
Net cash used in financing activities |
|
$ |
(1,034 |
) |
|
$ |
(500 |
) |
|
Net increase in cash and cash equivalents, including the effect of foreign currency exchange rates on cash |
|
$ |
57 |
|
|
$ |
81 |
|
Operating Activities
Cash provided by operating activities, exclusive of changes in receivables and payables, is impacted by the following significant activity during the six months ended June 30, 2019 and 2018:
|
• |
Real estate operations. We receive the majority of our operating cash through the net revenues of our Real Estate Operations segment. See the Results of Operations section above for further explanation of our Real Estate Operations segment. The revenues from this segment include noncash adjustments for straight-lined rents and amortization of above and below market leases of $52 million and $26 million for 2019 and 2018, respectively. |
|
• |
Strategic capital. We also generate operating cash through our Strategic Capital segment by providing management services to our unconsolidated co-investment ventures. See the Results of Operations section above for the key drivers of net revenues from our Strategic Capital segment. Included in Strategic Capital Revenues is promote revenue in proportion to the third-party investor’s equity interest of the total promote revenue, which is recognized in operating activities in the period it is received. |
|
• |
G&A expenses and equity-based compensation awards. We incurred $136 million and $120 million of G&A expenses in 2019 and 2018, respectively. Included in these amounts are equity-based, noncash compensation expenses of $52 million and $39 million in 2019 and 2018, respectively, which were recorded to Rental Expenses in the Real Estate Operations segment, Strategic Capital Expenses in the Strategic Capital segment and G&A Expenses. |
|
• |
Operating distributions from unconsolidated entities. We received $180 million and $176 million of distributions from our unconsolidated entities in 2019 and 2018, respectively. Certain unconsolidated co-investment ventures distribute the total promote, including our share, which is recorded to Investment In and Advances to Unconsolidated Entities and is included in operating activities in the period it is received. |
|
• |
Cash paid for interest and income taxes. As disclosed in Note 12 to the Consolidated Financial Statements, we paid combined amounts for interest and income taxes, net of amounts received, of $193 million and $187 million in 2019 and 2018, respectively. |
43
Investing Activities
Cash provided by investing activities is driven by proceeds from contributions and dispositions of real estate properties, including the contribution of the initial portfolio of properties to PBLV. Cash used in investing activities is principally driven by our investments in real estate development, acquisitions and capital expenditures. See Note 3 to the Consolidated Financial Statements for further information on these real estate activities. The following significant transactions also impacted our cash provided by investing activities during the six months ended June 30, 2019 and 2018:
|
• |
Investments in and advances to. We invested cash in our unconsolidated entities, which generally represents our proportionate share, of $186 million and $83 million in 2019 and 2018, respectively. The ventures use the funds for the acquisition of operating properties, development activity and repayment of debt. See Note 4 to the Consolidated Financial Statements for more detail on our unconsolidated co-investment ventures. |
|
• |
Return of investment. We received distributions from unconsolidated entities as a return of investment of $359 million and $135 million in 2019 and 2018, respectively. Included in these amounts were proceeds generated from property sales, debt refinancing and sales or redemption of our investment in unconsolidated entities. |
|
• |
Proceeds from repayment of notes receivable backed by real estate. We received $34 million in 2018 for the repayment of notes received in connection with the disposition of real estate to a third party in 2017. |
|
• |
Settlement of net investment hedges. We paid a net $16 million on the settlement of net investment hedges during 2019. See Note 10 to the Consolidated Financial Statements for further information on our derivative transactions. |
Financing Activities
Cash provided by and used in financing activities is primarily driven by proceeds from and payments on credit facilities and other debt, along with dividends paid on common and preferred stock and noncontrolling interest contributions and distributions.
Our repurchase of and payments on debt and proceeds from the issuance of debt consisted of the following activity for the six months ended June 30 (in millions):
|
|
|
2019 |
|
|
2018 |
|
||
|
Repurchase of and payments on debt (including extinguishment costs) |
|
|
|
|
|
|
|
|
|
Regularly scheduled debt principal payments and payments at maturity |
|
$ |
24 |
|
|
$ |
4 |
|
|
Secured mortgage debt |
|
|
413 |
|
|
|
89 |
|
|
Term loans |
|
|
1,672 |
|
|
|
1,159 |
|
|
Total |
|
$ |
2,109 |
|
|
$ |
1,252 |
|
|
|
|
|
|
|
|
|
|
|
|
Proceeds from the issuance of debt |
|
|
|
|
|
|
|
|
|
Senior notes |
|
$ |
91 |
|
|
$ |
1,190 |
|
|
Secured mortgage debt |
|
|
195 |
|
|
|
32 |
|
|
Term loans |
|
|
1,612 |
|
|
|
500 |
|
|
Total |
|
$ |
1,898 |
|
|
$ |
1,722 |
|
Off-Balance Sheet Arrangements
Unconsolidated Co-Investment Venture Debt
We had investments in and advances to unconsolidated co-investment ventures, at June 30, 2019, of $5.5 billion. These ventures had total third-party debt of $8.8 billion at June 30, 2019. The weighted average loan-to-value ratio for all unconsolidated co-investment ventures was 26.8% at June 30, 2019. Loan-to-value, a non-GAAP measure, was calculated as the percentage of total third-party debt to the gross book value of real estate for each venture and weighted based on the cumulative gross book value of all unconsolidated co-investment ventures.
At June 30, 2019, we did not guarantee any third-party debt of the unconsolidated co-investment ventures.
Contractual Obligations
Dividend and Distribution Requirements
Our dividend policy on our common stock is to distribute a percentage of our cash flow to ensure that we will meet the dividend requirements of the Internal Revenue Code (“IRC”), relative to maintaining our REIT status, while still allowing us to retain cash to fund capital improvements and other investment activities.
44
Under the IRC, REITs may be subject to certain federal income and excise taxes on our undistributed taxable income.
We paid a cash dividend of $0.53 per common share in the first two quarters of 2019. Our future common stock dividends, if and as declared, may vary and will be determined by the board of directors (“Board”) upon the circumstances prevailing at the time, including our financial condition, operating results and REIT distribution requirements, and may be adjusted at the discretion of the Board during the year.
We make distributions on the common limited partnership units outstanding at the same per unit amount as our common stock dividend. The Class A Units in Prologis, L.P. are entitled to a quarterly distribution equal to $0.64665 per unit so long as the common units receive a quarterly distribution of at least $0.40 per unit. We paid a quarterly distribution of $0.64665 per Class A Unit in the first two quarters of 2019.
At June 30, 2019, we had one series of preferred stock outstanding, the series Q. The annual dividend rate is 8.54% per share and dividends are payable quarterly in arrears.
Pursuant to the terms of our preferred stock, we are restricted from declaring or paying any dividend with respect to our common stock unless and until all cumulative dividends with respect to the preferred stock have been paid and sufficient funds have been set aside for dividends that have been declared for the relevant dividend period with respect to the preferred stock.
Other Commitments
On a continuing basis, we are engaged in various stages of negotiations for the acquisition or disposition of individual properties or portfolios of properties, including the recently announced acquisition of IPT.
NEW ACCOUNTING PRONOUNCEMENTS
See Note 1 to the Consolidated Financial Statements.
FUNDS FROM OPERATIONS ATTRIBUTABLE TO COMMON STOCKHOLDERS/UNITHOLDERS (“FFO”)
FFO is a non-GAAP financial measure that is commonly used in the real estate industry. The most directly comparable GAAP measure to FFO is net earnings.
The National Association of Real Estate Investment Trusts (“NAREIT”) defines FFO as earnings computed under GAAP to exclude historical cost depreciation and gains and losses from the sales, along with impairment charges, of previously depreciated properties. We also exclude the gains on revaluation of equity investments upon acquisition of a controlling interest and the gain recognized from a partial sale of our investment, as these are similar to gains from the sales of previously depreciated properties. We exclude similar adjustments from our unconsolidated entities and the third parties’ share of our consolidated co-investment ventures.
Our FFO Measures
Our FFO measures begin with NAREIT’s definition and we make certain adjustments to reflect our business and the way that management plans and executes our business strategy. While not infrequent or unusual, the additional items we adjust for in calculating FFO, as modified by Prologis and Core FFO, both as defined below, are subject to significant fluctuations from period to period. Although these items may have a material impact on our operations and are reflected in our financial statements, the removal of the effects of these items allows us to better understand the core operating performance of our properties over the long term. These items have both positive and negative short-term effects on our results of operations in inconsistent and unpredictable directions that are not relevant to our long-term outlook.
We calculate our FFO measures, as defined below, based on our proportionate ownership share of both our unconsolidated and consolidated ventures. We reflect our share of our FFO measures for unconsolidated ventures by applying our average ownership percentage for the period to the applicable reconciling items on an entity by entity basis. We reflect our share for consolidated ventures in which we do not own 100% of the equity by adjusting our FFO measures to remove the noncontrolling interests share of the applicable reconciling items based on our average ownership percentage for the applicable periods.
These FFO measures are used by management as supplemental financial measures of operating performance and we believe that it is important that stockholders, potential investors and financial analysts understand the measures management uses. We do not use our FFO measures as, nor should they be considered to be, alternatives to net earnings computed under GAAP, as indicators of our operating performance, as alternatives to cash from operating activities computed under GAAP or as indicators of our ability to fund our cash needs.
We analyze our operating performance principally by the rental revenue of our real estate and the revenues from our strategic capital business, net of operating, administrative and financing expenses. This income stream is not directly impacted by fluctuations in the market value of our investments in real estate or debt securities.
45
FFO, as modified by Prologis attributable to common stockholders/unitholders (“FFO, as modified by Prologis”)
To arrive at FFO, as modified by Prologis, we adjust the NAREIT defined FFO measure to exclude the impact of foreign currency related items and deferred tax, specifically:
|
• |
deferred income tax benefits and deferred income tax expenses recognized by our subsidiaries; |
|
• |
current income tax expense related to acquired tax liabilities that were recorded as deferred tax liabilities in an acquisition, to the extent the expense is offset with a deferred income tax benefit in earnings that is excluded from our defined FFO measure; |
|
• |
unhedged foreign currency exchange gains and losses resulting from debt transactions between us and our foreign consolidated subsidiaries and our foreign unconsolidated entities; |
|
• |
foreign currency exchange gains and losses from the remeasurement (based on current foreign currency exchange rates) of certain third-party debt of our foreign consolidated and unconsolidated entities; and |
|
• |
mark-to-market adjustments associated with derivative financial instruments. |
We use FFO, as modified by Prologis, so that management, analysts and investors are able to evaluate our performance against other REITs that do not have similar operations or operations in jurisdictions outside the U.S.
Core FFO attributable to common stockholders/unitholders (“Core FFO”)
In addition to FFO, as modified by Prologis, we also use Core FFO. To arrive at Core FFO, we adjust FFO, as modified by Prologis, to exclude the following recurring and nonrecurring items that we recognized directly in FFO, as modified by Prologis:
|
• |
gains or losses from the disposition of land and development properties that were developed with the intent to contribute or sell; |
|
• |
income tax expense related to the sale of investments in real estate; |
|
• |
impairment charges recognized related to our investments in real estate generally as a result of our change in intent to contribute or sell these properties; |
|
• |
gains or losses from the early extinguishment of debt and redemption and repurchase of preferred stock; and |
|
• |
expenses related to natural disasters. |
We use Core FFO, including by segment and region, to: (i) assess our operating performance as compared to other real estate companies; (ii) evaluate our performance and the performance of our properties in comparison with expected results and results of previous periods; (iii) evaluate the performance of our management; (iv) budget and forecast future results to assist in the allocation of resources; (v) provide guidance to the financial markets to understand our expected operating performance; and (vi) evaluate how a specific potential investment will impact our future results.
Limitations on the use of our FFO measures
While we believe our modified FFO measures are important supplemental measures, neither NAREIT’s nor our measures of FFO should be used alone because they exclude significant economic components of net earnings computed under GAAP and are, therefore, limited as an analytical tool. Accordingly, these are only a few of the many measures we use when analyzing our business. Some of the limitations are:
|
• |
The current income tax expenses that are excluded from our modified FFO measures represent the taxes and transaction costs that are payable. |
|
• |
Depreciation and amortization of real estate assets are economic costs that are excluded from FFO. FFO is limited, as it does not reflect the cash requirements that may be necessary for future replacements of the real estate assets. Furthermore, the amortization of capital expenditures and leasing costs necessary to maintain the operating performance of logistics facilities are not reflected in FFO. |
|
• |
Gains or losses from non-development property dispositions and impairment charges related to expected dispositions represent changes in value of the properties. By excluding these gains and losses, FFO does not capture realized changes in the value of disposed properties arising from changes in market conditions. |
|
• |
The deferred income tax benefits and expenses that are excluded from our modified FFO measures result from the creation of a deferred income tax asset or liability that may have to be settled at some future point. Our modified FFO measures do not currently reflect any income or expense that may result from such settlement. |
46
|
• |
The foreign currency exchange gains and losses that are excluded from our modified FFO measures are generally recognized based on movements in foreign currency exchange rates through a specific point in time. The ultimate settlement of our foreign currency-denominated net assets is indefinite as to timing and amount. Our FFO measures are limited in that they do not reflect the current period changes in these net assets that result from periodic foreign currency exchange rate movements. |
|
• |
The gains and losses on extinguishment of debt or preferred stock that we exclude from our Core FFO, may provide a benefit or cost to us as we may be settling our obligation at less or more than our future obligation. |
|
• |
The natural disaster expenses that we exclude from Core FFO are costs that we have incurred. |
We compensate for these limitations by using our FFO measures only in conjunction with net earnings computed under GAAP when making our decisions. This information should be read with our complete Consolidated Financial Statements prepared under GAAP. To assist investors in compensating for these limitations, we reconcile our modified FFO measures to our net earnings computed under GAAP for six months ended June 30 as follows (in millions):
|
|
|
2019 |
|
|
2018 |
|
||
|
Reconciliation of net earnings attributable to common stockholders to FFO measures: |
|
|
|
|
|
|
|
|
|
Net earnings attributable to common stockholders |
|
$ |
731 |
|
|
$ |
701 |
|
|
|
|
|
|
|
|
|
|
|
|
Add (deduct) NAREIT defined adjustments: |
|
|
|
|
|
|
|
|
|
Real estate related depreciation and amortization |
|
|
551 |
|
|
|
390 |
|
|
Gains on real estate transactions, net (excluding development properties and land) |
|
|
(173 |
) |
|
|
(68 |
) |
|
Reconciling items related to noncontrolling interests |
|
|
(25 |
) |
|
|
(23 |
) |
|
Our share of reconciling items included in earnings related to unconsolidated entities |
|
|
117 |
|
|
|
104 |
|
|
NAREIT defined FFO |
|
|
1,201 |
|
|
|
1,104 |
|
|
|
|
|
|
|
|
|
|
|
|
Add (deduct) our modified adjustments: |
|
|
|
|
|
|
|
|
|
Unrealized foreign currency and derivative gains, net |
|
|
(4 |
) |
|
|
(53 |
) |
|
Deferred income tax expense (benefit) |
|
|
9 |
|
|
|
(1 |
) |
|
Current income tax expense on dispositions related to acquired tax liabilities |
|
|
- |
|
|
|
1 |
|
|
Our share of reconciling items included in earnings related to unconsolidated entities |
|
|
(3 |
) |
|
|
2 |
|
|
FFO, as modified by Prologis |
|
|
1,203 |
|
|
|
1,053 |
|
|
|
|
|
|
|
|
|
|
|
|
Adjustments to arrive at Core FFO: |
|
|
|
|
|
|
|
|
|
Gains on dispositions of development properties and land, net |
|
|
(239 |
) |
|
|
(221 |
) |
|
Current income tax expense on dispositions |
|
|
10 |
|
|
|
10 |
|
|
Losses on early extinguishment of debt, net |
|
|
2 |
|
|
|
1 |
|
|
Reconciling items related to noncontrolling interests |
|
|
- |
|
|
|
5 |
|
|
Our share of reconciling items included in earnings related to unconsolidated entities |
|
|
4 |
|
|
|
(14 |
) |
|
Core FFO |
|
$ |
980 |
|
|
$ |
834 |
|
ITEM 3. Quantitative and Qualitative Disclosures About Market Risk
We are exposed to the impact of foreign exchange-related variability and earnings volatility on our foreign investments and interest rate changes. See our risk factors in Part 1, Item 1A. Risk Factors in our Annual Report on Form 10-K for the year ended December 31, 2018. See also Note 10 in the Consolidated Financial Statements in Item 1 for more information about our foreign operations and derivative financial instruments.
We monitor our market risk exposures using a sensitivity analysis. Our sensitivity analysis estimates the exposure to market risk sensitive instruments assuming a hypothetical 10% adverse change in foreign currency exchange rates or interest rates at June 30, 2019. The results of the sensitivity analysis are summarized in the following sections. The sensitivity analysis is of limited predictive value. As a result, revenues and expenses, as well as our ultimate realized gains or losses with respect to foreign currency exchange rate and interest rate fluctuations will depend on the exposures that arise during a future period, hedging strategies at the time and the prevailing foreign currency exchange rates and interest rates.
Foreign Currency Risk
We are exposed to foreign currency exchange variability related to investments in and earnings from our foreign investments. Foreign currency market risk is the possibility that our results of operations or financial position could be better or worse than planned because of changes in foreign currency exchange rates. We primarily hedge our foreign currency risk by borrowing in the currencies in which we invest thereby providing a natural hedge. We may designate the debt as a nonderivative net investment hedge. We may also hedge our foreign currency risk by entering into derivative financial instruments that we designate as net investment hedges, as these amounts
47
offset the translation adjustments on the underlying net assets of our foreign investments. At June 30, 2019, after consideration of our derivative and nonderivative financial instruments as discussed in Note 10 to the Consolidated Financial Statements, we had minimal net equity denominated in a currency other than the U.S. dollar.
During the six months ended June 30, 2019, $192 million or 12.3% of our total consolidated revenues was denominated in foreign currencies. We enter into other foreign currency contracts, such as forwards, to reduce fluctuations in foreign currency associated with the translation of the future earnings of our international subsidiaries. We have British pound sterling, Canadian dollar, euro and Japanese yen forward contracts, which were not designated as hedges, and have an aggregate notional amount of $831 million at June 30, 2019 to mitigate risk associated with the translation of the future earnings of our subsidiaries denominated in these currencies. Although the impact to net earnings is mitigated through higher translated U.S. dollar earnings from these currencies, a weakening of the U.S. dollar against these currencies by 10% would result in a $83 million cash payment on settlement of these contracts.
Interest Rate Risk
We are also exposed to the impact of interest rate changes on future earnings and cash flows. To mitigate that risk, we generally borrow with fixed rate debt and we may use derivative instruments to fix the interest rate on our variable rate debt. At June 30, 2019, $9.1 billion of our debt bore interest at fixed rates and therefore the fair value of these instruments is affected by changes in market interest rates. At June 30, 2019, $1.9 billion of our debt bore interest at variable rates. The following table summarizes the principal payments, including net discounts and debt issuance costs, by maturity date at June 30, 2019 (dollars in millions):
|
|
|
2019 |
|
|
2020 |
|
|
2021 |
|
|
2022 |
|
|
Thereafter |
|
|
Total |
|
|
Fair Value |
|
|||||||
|
Fixed rate debt (1) |
|
$ |
11 |
|
|
$ |
1,143 |
|
|
$ |
814 |
|
|
$ |
798 |
|
|
$ |
6,292 |
|
|
$ |
9,058 |
|
|
$ |
9,760 |
|
|
Weighted average interest rate (2) |
|
|
5.8 |
% |
|
|
0.9 |
% |
|
|
1.7 |
% |
|
|
3.1 |
% |
|
|
3.2 |
% |
|
|
2.8 |
% |
|
|
|
|
|
|
|
|
|
|
|
|
|
|
|
|
|
|
|
|
|
|
|
|
|
|
|
|
|
|
|
|
|
|
|
Variable rate debt |
|
|
|
|
|
|
|
|
|
|
|
|
|
|
|
|
|
|
|
|
|
|
|
|
|
|
|
|
|
Credit facilities |
|
$ |
- |
|
|
$ |
- |
|
|
$ |
- |
|
|
$ |
- |
|
|
$ |
113 |
|
|
$ |
113 |
|
|
$ |
113 |
|
|
Term loans |
|
|
- |
|
|
|
440 |
|
|
|
- |
|
|
|
- |
|
|
|
1,142 |
|
|
|
1,582 |
|
|
|
1,591 |
|
|
Secured mortgage debt |
|
|
- |
|
|
|
20 |
|
|
|
65 |
|
|
|
- |
|
|
|
130 |
|
|
|
215 |
|
|
|
214 |
|
|
Total variable rate debt |
|
$ |
- |
|
|
$ |
460 |
|
|
$ |
65 |
|
|
$ |
- |
|
|
$ |
1,385 |
|
|
$ |
1,910 |
|
|
$ |
1,918 |
|
|
(1) |
At June 30, 2019, we had interest rate swap agreements to fix €400 million ($500 million) of our floating rate euro senior notes, which are included in fixed rate debt. |
|
(2) |
The interest rates represent the effective interest rates (including amortization of the debt issuance costs and the noncash premiums and discounts) at June 30, 2019 for the debt outstanding and include the impact of interest rate swaps, which effectively fix the interest rate on our variable rate debt. |
At June 30, 2019, the weighted average effective interest rate on our variable rate debt was 1.4%. Changes in interest rates can cause interest expense to fluctuate on our variable rate debt. On the basis of our sensitivity analysis, a 10% increase in interest rates based on our average outstanding variable rate debt balances, not subject to interest rate swap agreements, would result in additional annual interest expense of $2 million which equates to a change in interest rates of 13 basis points.
ITEM 4. Controls and Procedures
Controls and Procedures (The Parent)
The Parent carried out an evaluation under the supervision and with the participation of management, including the Chief Executive Officer and Chief Financial Officer, of the effectiveness of the disclosure controls and procedures (as defined in Rule 13a-14(c)) under the Securities and Exchange Act of 1934 (the “Exchange Act”) at June 30, 2019. On the basis of this evaluation, the Chief Executive Officer and the Chief Financial Officer have concluded that the disclosure controls and procedures are effective to ensure that the information required to be disclosed in reports that are filed or submitted under the Exchange Act are recorded, processed, summarized and reported within the time periods specified in the Securities and Exchange Commission (“SEC”) rules and forms.
Controls and Procedures (The OP)
The OP carried out an evaluation under the supervision and with the participation of management, including the Chief Executive Officer and Chief Financial Officer, of the effectiveness of the disclosure controls and procedures (as defined in Rule 13a-14(c)) under the Exchange Act at June 30, 2019. On the basis of this evaluation, the Chief Executive Officer and the Chief Financial Officer have concluded that the disclosure controls and procedures are effective to ensure that the information required to be disclosed in reports that are filed or submitted under the Exchange Act are recorded, processed, summarized and reported within the time periods specified in the SEC rules and forms.
48
PART II. OTHER INFORMATION
ITEM 1. Legal Proceedings
Prologis and our unconsolidated entities are party to a variety of legal proceedings arising in the ordinary course of business. With respect to any such matters to which we are currently a party, the ultimate disposition of any such matters will not result in a material adverse effect on our business, financial position or results of operations.
ITEM 1A. Risk Factors
At June 30, 2019, no material changes had occurred in our risk factors as discussed in Item 1A in our Annual Report on Form 10-K for the year ended December 31, 2018.
ITEM 2. Unregistered Sales of Equity Securities and Use of Proceeds
During the six months ended June 30, 2019, we issued 0.5 million shares of common stock of the Parent in connection with the redemption of common units of the OP in reliance on the exemption from registration requirements of the Securities Act of 1933, as amended, afforded by Section 4(a)(2) thereof.
ITEM 3. Defaults Upon Senior Securities
None.
ITEM 4. Mine Safety Disclosures
Not Applicable.
ITEM 5. Other Information
None.
ITEM 6. Exhibits
The exhibits required by this item are set forth on the Exhibit Index attached hereto.
49
INDEX TO EXHIBITS
Certain of the following documents are filed herewith. Certain other of the following documents that have been previously filed with the Securities and Exchange Commission and, pursuant to Rule 12-b-32, are incorporated herein by reference.
|
|
|
|
|
2.1 |
|
|
|
10.1 |
|
|
|
15.1† |
KPMG LLP Awareness Letter of Prologis, Inc.
|
|
|
15.2† |
KPMG LLP Awareness Letter of Prologis, L.P.
|
|
|
31.1† |
Certification of Chief Executive Officer of Prologis, Inc.
|
|
|
31.2† |
Certification of Chief Financial Officer of Prologis, Inc.
|
|
|
31.3† |
Certification of Chief Executive Officer for Prologis, L.P.
|
|
|
31.4† |
Certification of Chief Financial Officer for Prologis, L.P.
|
|
|
32.1† |
|
|
|
32.2† |
|
|
|
101.INS† |
XBRL Instance Document – the instance document does not appear in the Interactive Data File because its XBRL tags are embedded within the Inline XBRL Document.
|
|
|
101.SCH† |
XBRL Taxonomy Extension Schema
|
|
|
101.CAL† |
XBRL Taxonomy Extension Calculation Linkbase
|
|
|
101.DEF† |
XBRL Taxonomy Extension Definition Linkbase
|
|
|
101.LAB† |
XBRL Taxonomy Extension Label Linkbase
|
|
|
101.PRE† |
XBRL Taxonomy Extension Presentation Linkbase
|
|
|
† |
Filed herewith |
|
|
|
|
|
|
|
|
|
|
|
|
|
|
|
|
|
|
|
||
50
SIGNATURES
Pursuant to the requirements of Section 13 or 15(d) of the Exchange Act, the registrants have duly caused this report to be signed on their behalf by the undersigned, thereunto duly authorized.
|
|
PROLOGIS, INC. |
|
|
|
|
|
|
|
By: |
/s/ Thomas S. Olinger |
|
|
|
Thomas S. Olinger |
|
|
|
Chief Financial Officer |
|
|
|
|
|
|
By: |
/s/ Lori A. Palazzolo |
|
|
|
Lori A. Palazzolo |
|
|
|
Managing Director and Chief Accounting Officer |
|
|
|
|
|
|
PROLOGIS, L.P. |
|
|
|
By: |
Prologis, Inc., its general partner |
|
|
|
|
|
|
By: |
/s/ Thomas S. Olinger |
|
|
|
Thomas S. Olinger |
|
|
|
Chief Financial Officer |
|
|
|
|
|
|
By: |
/s/ Lori A. Palazzolo |
|
|
|
Lori A. Palazzolo |
|
|
|
Managing Director and Chief Accounting Officer |
|
|
|
|
Date: July 19, 2019
51