UNITED STATES
SECURITIES AND EXCHANGE COMMISSION
Washington, D.C. 20549
FORM 10-Q
|
☒ |
QUARTERLY REPORT PURSUANT TO SECTION 13 OR 15(d) OF THE SECURITIES EXCHANGE ACT OF 1934 |
For the quarterly period ended September 30, 2016
|
☐ |
TRANSITION REPORT PURSUANT TO SECTION 13 OR 15(d) OF THE SECURITIES EXCHANGE ACT OF 1934 |
For the transition period from ______________ to ______________
Commission File Number: 001-13545 (Prologis, Inc.) 001-14245 (Prologis, L.P.)
Prologis, Inc.
Prologis, L.P.
(Exact name of registrant as specified in its charter)
|
Maryland (Prologis, Inc.) Delaware (Prologis, L.P.) |
|
94-3281941 (Prologis, Inc.) 94-3285362 (Prologis, L.P.) |
|
(State or other jurisdiction of incorporation or organization) |
|
(I.R.S. Employer Identification No.) |
|
|
|
|
|
Pier 1, Bay 1, San Francisco, California |
|
94111 |
|
(Address or principal executive offices) |
|
(Zip Code) |
(415) 394-9000
(Registrants’ telephone number, including area code)
(Former name, former address and former fiscal year, if changed since last report)
Indicate by check mark whether the registrant (1) has filed all reports required to be filed by Section 13 or 15(d) of the Securities Exchange Act of 1934 during the preceding 12 months (or for such shorter period that the registrant was required to file such reports), and (2) has been subject to such filing for the past 90 days.
|
Prologis, Inc. |
Yes |
☒ |
No |
☐ |
|
Prologis, L.P. |
Yes |
☒ |
No |
☐ |
Indicate by check mark whether the registrant has submitted electronically and posted on its corporate website; if any, every Interactive Data File required to be submitted and posted pursuant to Rule 405 of Regulation S-T (§232.405 of this chapter) during the preceding 12 months (or for such shorter periods that the registrant was required to submit and post such files).
|
Prologis, Inc. |
Yes |
☒ |
No |
☐ |
|
Prologis, L.P. |
Yes |
☒ |
No |
☐ |
Indicate by check mark whether the registrant is a large accelerated filer, an accelerated filer, a non-accelerated filer or a smaller reporting company. See definitions of “large accelerated filer”, “accelerated filer” and “smaller reporting company” in Rule 12b-2 of the Exchange Act (check one):
|
Prologis, Inc.: |
|
|
|
|
|
Large accelerated filer ☒ |
|
Accelerated filer ☐ |
Non-accelerated filer ☐ |
Smaller reporting company ☐ |
|
|
|
(Do not check if a smaller reporting company) |
|
|
|
Prologis, L.P.: |
|
|
|
|
|
Large accelerated filer ☐ |
|
Accelerated filer ☐ |
Non-accelerated filer ☒ |
Smaller reporting company ☐ |
|
|
|
(Do not check if a smaller reporting company) |
|
|
Indicate by check mark whether the registrant is a shell company (as defined in Rule 12b-2 of the Securities Exchange Act of 1934).
|
Prologis, Inc. |
Yes |
☐ |
No |
☒ |
|
Prologis, L.P. |
Yes |
☐ |
No |
☒ |
The number of shares of Prologis, Inc.’s common stock outstanding at October 28, 2016, was approximately 528,614,000.
This report combines the quarterly reports on Form 10-Q for the period ended September 30, 2016, of Prologis, Inc. and Prologis, L.P. Unless stated otherwise or the context otherwise requires, references to “Prologis, Inc.” or the “Parent” mean Prologis, Inc. and its consolidated subsidiaries; and references to “Prologis, L.P.” or the “Operating Partnership” mean Prologis, L.P., and its consolidated subsidiaries. The terms “the Company,” “Prologis,” “we,” “our” or “us” means Prologis, Inc. and the Operating Partnership collectively.
Prologis, Inc. is a real estate investment trust (“REIT”) and the general partner of the Operating Partnership. At September 30, 2016, Prologis, Inc. owned an approximate 97.41% common general partnership interest in the Operating Partnership and 100% of the preferred units in the Operating Partnership. The remaining approximate 2.59% common limited partnership interests are owned by nonaffiliated investors and certain current and former directors and officers of Prologis, Inc. As the sole general partner of the Operating Partnership, Prologis, Inc. has complete responsibility and discretion in the day-to-day management and control of the Operating Partnership.
We operate Prologis, Inc. and the Operating Partnership as one enterprise. The management of Prologis, Inc. consists of the same members as the management of the Operating Partnership. These members are officers of Prologis, Inc. and employees of the Operating Partnership or one of its subsidiaries. As general partner with control of the Operating Partnership, Prologis, Inc. consolidates the Operating Partnership for financial reporting purposes. Because the only significant asset of Prologis, Inc. is its investment in the Operating Partnership, the assets and liabilities of Prologis, Inc. and the Operating Partnership are the same on their respective financial statements.
We believe combining the quarterly reports on Form 10-Q of Prologis, Inc. and the Operating Partnership into this single report results in the following benefits:
|
• |
enhances investors’ understanding of Prologis, Inc. and the Operating Partnership by enabling investors to view the business as a whole in the same manner as management views and operates the business; |
|
• |
eliminates duplicative disclosure and provides a more streamlined and readable presentation since a substantial portion of the Company’s disclosure applies to both Prologis, Inc. and the Operating Partnership; and |
|
• |
creates time and cost efficiencies through the preparation of one combined report instead of two separate reports. |
It is important to understand the few differences between Prologis, Inc. and the Operating Partnership in the context of how we operate the Company. Prologis, Inc. does not conduct business itself, other than acting as the sole general partner of the Operating Partnership and issuing public equity from time to time. Prologis, Inc. itself does not incur any indebtedness, but it guarantees the unsecured debt of the Operating Partnership. The Operating Partnership holds substantially all the assets of the business, directly or indirectly, and holds the ownership interests in the Company’s investment in certain entities. The Operating Partnership conducts the operations of the business and is structured as a partnership with no publicly traded equity. Except for net proceeds from equity issuances by Prologis, Inc., which are contributed to the Operating Partnership in exchange for partnership units, the Operating Partnership generates capital required by the business through the Operating Partnership’s operations, incurrence of indebtedness and issuance of partnership units to third parties.
Noncontrolling interests, stockholders’ equity and partners’ capital are the main areas of difference between the consolidated financial statements of Prologis, Inc. and those of the Operating Partnership. The noncontrolling interests in the Operating Partnership’s consolidated financial statements include the interests in consolidated entities not owned by the Operating Partnership. The noncontrolling interests in Prologis, Inc.’s consolidated financial statements include the same noncontrolling interests at the Operating Partnership level, as well as the common limited partnership interests in the Operating Partnership, not owned by Prologis, Inc., which are accounted for as partners’ capital by the Operating Partnership.
To highlight the differences between Prologis, Inc. and the Operating Partnership, separate sections in this report, as applicable, individually discuss Prologis, Inc. and the Operating Partnership, including separate financial statements and separate Exhibit 31 and 32 certifications. In the sections that combine disclosure of Prologis, Inc. and the Operating Partnership, this report refers to actions or holdings as being actions or holdings of Prologis.
INDEX
PROLOGIS, INC.
(In thousands, except per share data)
|
|
September 30, |
|
|
|
|
|
|
|
|
2016 |
|
|
December 31, |
|
||
|
|
(Unaudited) |
|
|
2015 |
|
||
|
ASSETS |
|
|
|
|
|
|
|
|
Investments in real estate properties |
$ |
27,570,704 |
|
|
$ |
27,521,368 |
|
|
Less accumulated depreciation |
|
3,638,688 |
|
|
|
3,274,284 |
|
|
Net investments in real estate properties |
|
23,932,016 |
|
|
|
24,247,084 |
|
|
Investments in and advances to unconsolidated entities |
|
4,580,584 |
|
|
|
4,755,620 |
|
|
Assets held for sale or contribution |
|
450,349 |
|
|
|
378,423 |
|
|
Notes receivable backed by real estate |
|
33,800 |
|
|
|
235,050 |
|
|
Net investments in real estate |
|
28,996,749 |
|
|
|
29,616,177 |
|
|
|
|
|
|
|
|
|
|
|
Cash and cash equivalents |
|
375,120 |
|
|
|
264,080 |
|
|
Other assets |
|
1,516,340 |
|
|
|
1,514,510 |
|
|
Total assets |
$ |
30,888,209 |
|
|
$ |
31,394,767 |
|
|
|
|
|
|
|
|
|
|
|
LIABILITIES AND EQUITY |
|
|
|
|
|
|
|
|
Liabilities: |
|
|
|
|
|
|
|
|
Debt |
$ |
11,256,997 |
|
|
$ |
11,626,831 |
|
|
Accounts payable and accrued expenses |
|
672,111 |
|
|
|
712,725 |
|
|
Other liabilities |
|
675,831 |
|
|
|
634,375 |
|
|
Total liabilities |
|
12,604,939 |
|
|
|
12,973,931 |
|
|
|
|
|
|
|
|
|
|
|
Equity: |
|
|
|
|
|
|
|
|
Prologis, Inc. stockholders’ equity: |
|
|
|
|
|
|
|
|
Series Q preferred stock at stated liquidation preference of $50 per share: $0.01 par value; 1,565 shares issued and outstanding and 100,000 preferred shares authorized at September 30, 2016, and December 31, 2015 |
|
78,235 |
|
|
|
78,235 |
|
|
Common stock: $0.01 par value; 528,599 shares and 524,512 shares issued and outstanding at September 30, 2016, and December 31, 2015, respectively |
|
5,286 |
|
|
|
5,245 |
|
|
Additional paid-in capital |
|
19,433,001 |
|
|
|
19,302,367 |
|
|
Accumulated other comprehensive loss |
|
(889,223 |
) |
|
|
(791,429 |
) |
|
Distributions in excess of net earnings |
|
(3,828,132 |
) |
|
|
(3,926,483 |
) |
|
Total Prologis, Inc. stockholders’ equity |
|
14,799,167 |
|
|
|
14,667,935 |
|
|
Noncontrolling interests |
|
3,484,103 |
|
|
|
3,752,901 |
|
|
Total equity |
|
18,283,270 |
|
|
|
18,420,836 |
|
|
Total liabilities and equity |
$ |
30,888,209 |
|
|
$ |
31,394,767 |
|
The accompanying notes are an integral part of these Consolidated Financial Statements.
1
CONSOLIDATED STATEMENTS OF INCOME
(Unaudited)
(In thousands, except per share amounts)
|
|
|
Three Months Ended |
|
|
Nine Months Ended |
|
||||||||||
|
|
|
September 30, |
|
|
September 30, |
|
||||||||||
|
|
|
2016 |
|
|
2015 |
|
|
2016 |
|
|
2015 |
|
||||
|
Revenues: |
|
|
|
|
|
|
|
|
|
|
|
|
|
|
|
|
|
Rental |
|
$ |
435,868 |
|
|
$ |
418,116 |
|
|
$ |
1,299,122 |
|
|
$ |
1,100,491 |
|
|
Rental recoveries |
|
|
124,409 |
|
|
|
114,639 |
|
|
|
361,402 |
|
|
|
312,510 |
|
|
Strategic capital |
|
|
140,577 |
|
|
|
44,176 |
|
|
|
241,565 |
|
|
|
133,247 |
|
|
Development management and other |
|
|
3,711 |
|
|
|
3,691 |
|
|
|
10,931 |
|
|
|
7,625 |
|
|
Total revenues |
|
|
704,565 |
|
|
|
580,622 |
|
|
|
1,913,020 |
|
|
|
1,553,873 |
|
|
Expenses: |
|
|
|
|
|
|
|
|
|
|
|
|
|
|
|
|
|
Rental |
|
|
140,514 |
|
|
|
140,284 |
|
|
|
427,820 |
|
|
|
393,199 |
|
|
Strategic capital |
|
|
44,624 |
|
|
|
26,532 |
|
|
|
97,783 |
|
|
|
76,661 |
|
|
General and administrative |
|
|
58,157 |
|
|
|
54,178 |
|
|
|
165,634 |
|
|
|
157,458 |
|
|
Depreciation and amortization |
|
|
224,867 |
|
|
|
247,471 |
|
|
|
705,249 |
|
|
|
607,467 |
|
|
Other |
|
|
3,779 |
|
|
|
8,765 |
|
|
|
12,364 |
|
|
|
44,467 |
|
|
Total expenses |
|
|
471,941 |
|
|
|
477,230 |
|
|
|
1,408,850 |
|
|
|
1,279,252 |
|
|
|
|
|
|
|
|
|
|
|
|
|
|
|
|
|
|
|
|
Operating income |
|
|
232,624 |
|
|
|
103,392 |
|
|
|
504,170 |
|
|
|
274,621 |
|
|
|
|
|
|
|
|
|
|
|
|
|
|
|
|
|
|
|
|
Other income (expense): |
|
|
|
|
|
|
|
|
|
|
|
|
|
|
|
|
|
Earnings from unconsolidated entities, net |
|
|
45,857 |
|
|
|
33,557 |
|
|
|
145,622 |
|
|
|
106,383 |
|
|
Interest expense |
|
|
(75,310 |
) |
|
|
(81,035 |
) |
|
|
(232,577 |
) |
|
|
(218,698 |
) |
|
Interest and other income, net |
|
|
2,932 |
|
|
|
6,237 |
|
|
|
7,051 |
|
|
|
19,133 |
|
|
Gains on dispositions of investments in real estate, net |
|
|
117,296 |
|
|
|
268,791 |
|
|
|
461,963 |
|
|
|
655,288 |
|
|
Foreign currency and derivative losses, net |
|
|
(1,730 |
) |
|
|
(9,428 |
) |
|
|
(26,277 |
) |
|
|
(374 |
) |
|
Gains (losses) on early extinguishment of debt, net |
|
|
1,492 |
|
|
|
- |
|
|
|
2,484 |
|
|
|
(16,525 |
) |
|
Total other income |
|
|
90,537 |
|
|
|
218,122 |
|
|
|
358,266 |
|
|
|
545,207 |
|
|
Earnings before income taxes |
|
|
323,161 |
|
|
|
321,514 |
|
|
|
862,436 |
|
|
|
819,828 |
|
|
Total income tax expense |
|
|
15,919 |
|
|
|
14,328 |
|
|
|
36,598 |
|
|
|
21,070 |
|
|
Consolidated net earnings |
|
|
307,242 |
|
|
|
307,186 |
|
|
|
825,838 |
|
|
|
798,758 |
|
|
Less net earnings attributable to noncontrolling interests |
|
|
26,316 |
|
|
|
46,536 |
|
|
|
58,103 |
|
|
|
49,314 |
|
|
Net earnings attributable to controlling interests |
|
|
280,926 |
|
|
|
260,650 |
|
|
|
767,735 |
|
|
|
749,444 |
|
|
Less preferred stock dividends |
|
|
1,671 |
|
|
|
1,671 |
|
|
|
5,056 |
|
|
|
5,019 |
|
|
Net earnings attributable to common stockholders |
|
$ |
279,255 |
|
|
$ |
258,979 |
|
|
$ |
762,679 |
|
|
$ |
744,425 |
|
|
|
|
|
|
|
|
|
|
|
|
|
|
|
|
|
|
|
|
Weighted average common shares outstanding – Basic |
|
|
527,288 |
|
|
|
523,528 |
|
|
|
525,462 |
|
|
|
520,388 |
|
|
Weighted average common shares outstanding – Diluted |
|
|
547,200 |
|
|
|
532,073 |
|
|
|
545,228 |
|
|
|
531,121 |
|
|
|
|
|
|
|
|
|
|
|
|
|
|
|
|
|
|
|
|
Net earnings per share attributable to common stockholders – Basic |
|
$ |
0.53 |
|
|
$ |
0.49 |
|
|
$ |
1.45 |
|
|
$ |
1.43 |
|
|
|
|
|
|
|
|
|
|
|
|
|
|
|
|
|
|
|
|
Net earnings per share attributable to common stockholders – Diluted |
|
$ |
0.52 |
|
|
$ |
0.49 |
|
|
$ |
1.44 |
|
|
$ |
1.41 |
|
|
|
|
|
|
|
|
|
|
|
|
|
|
|
|
|
|
|
|
Dividends per common share |
|
$ |
0.42 |
|
|
$ |
0.40 |
|
|
$ |
1.26 |
|
|
$ |
1.12 |
|
The accompanying notes are an integral part of these Consolidated Financial Statements.
2
CONSOLIDATED STATEMENTS OF COMPREHENSIVE INCOME
(Unaudited)
(In thousands)
|
|
|
Three Months Ended |
|
|
Nine Months Ended |
|
||||||||||
|
|
|
September 30, |
|
|
September 30, |
|
||||||||||
|
|
|
2016 |
|
|
2015 |
|
|
2016 |
|
|
2015 |
|
||||
|
Consolidated net earnings |
|
$ |
307,242 |
|
|
$ |
307,186 |
|
|
$ |
825,838 |
|
|
$ |
798,758 |
|
|
Other comprehensive income (loss): |
|
|
|
|
|
|
|
|
|
|
|
|
|
|
|
|
|
Foreign currency translation losses, net |
|
|
(48,232 |
) |
|
|
(148,570 |
) |
|
|
(69,832 |
) |
|
|
(197,912 |
) |
|
Unrealized gains (losses) on derivative contracts, net |
|
|
4,696 |
|
|
|
(15,660 |
) |
|
|
(17,122 |
) |
|
|
(12,313 |
) |
|
Comprehensive income |
|
|
263,706 |
|
|
|
142,956 |
|
|
|
738,884 |
|
|
|
588,533 |
|
|
Net earnings attributable to noncontrolling interests |
|
|
(26,316 |
) |
|
|
(46,536 |
) |
|
|
(58,103 |
) |
|
|
(49,314 |
) |
|
Other comprehensive loss (income) attributable to noncontrolling interest |
|
|
2,392 |
|
|
|
18,925 |
|
|
|
(10,840 |
) |
|
|
33,992 |
|
|
Comprehensive income attributable to common stockholders |
|
$ |
239,782 |
|
|
$ |
115,345 |
|
|
$ |
669,941 |
|
|
$ |
573,211 |
|
The accompanying notes are an integral part of these Consolidated Financial Statements.
CONSOLIDATED STATEMENT OF EQUITY
Nine Months Ended September 30, 2016
(Unaudited)
(In thousands)
|
|
|
|
|
|
|
Common Stock |
|
|
|
|
|
|
Accumulated |
|
|
Distributions |
|
|
|
|
|
|
|
|
|
|||||||
|
|
|
|
|
|
|
Number |
|
|
|
|
|
|
Additional |
|
|
Other |
|
|
in Excess of |
|
|
Non- |
|
|
|
|
|
|||||
|
|
|
Preferred |
|
|
of |
|
|
Par |
|
|
Paid-in |
|
|
Comprehensive |
|
|
Net |
|
|
controlling |
|
|
Total |
|
||||||||
|
|
|
Stock |
|
|
Shares |
|
|
Value |
|
|
Capital |
|
|
Loss |
|
|
Earnings |
|
|
Interests |
|
|
Equity |
|
||||||||
|
Balance at January 1, 2016 |
|
$ |
78,235 |
|
|
|
524,512 |
|
|
$ |
5,245 |
|
|
$ |
19,302,367 |
|
|
$ |
(791,429 |
) |
|
$ |
(3,926,483 |
) |
|
$ |
3,752,901 |
|
|
$ |
18,420,836 |
|
|
Consolidated net earnings |
|
|
- |
|
|
|
- |
|
|
|
- |
|
|
|
- |
|
|
|
- |
|
|
|
767,735 |
|
|
|
58,103 |
|
|
|
825,838 |
|
|
Effect of equity compensation plans |
|
|
- |
|
|
|
2,220 |
|
|
|
22 |
|
|
|
75,258 |
|
|
|
- |
|
|
|
- |
|
|
|
18,771 |
|
|
|
94,051 |
|
|
Issuance of units related to acquisitions |
|
|
- |
|
|
|
- |
|
|
|
- |
|
|
|
- |
|
|
|
- |
|
|
|
- |
|
|
|
3,162 |
|
|
|
3,162 |
|
|
Settlement of noncontrolling interests |
|
|
- |
|
|
|
- |
|
|
|
- |
|
|
|
851 |
|
|
|
- |
|
|
|
- |
|
|
|
(2,979 |
) |
|
|
(2,128 |
) |
|
Conversion of noncontrolling interests |
|
|
- |
|
|
|
1,867 |
|
|
|
19 |
|
|
|
51,931 |
|
|
|
- |
|
|
|
- |
|
|
|
(51,950 |
) |
|
|
- |
|
|
Capital contributions |
|
|
- |
|
|
|
- |
|
|
|
- |
|
|
|
- |
|
|
|
- |
|
|
|
- |
|
|
|
1,026 |
|
|
|
1,026 |
|
|
Foreign currency translation gains (losses), net |
|
|
- |
|
|
|
- |
|
|
|
- |
|
|
|
- |
|
|
|
(81,115 |
) |
|
|
- |
|
|
|
11,283 |
|
|
|
(69,832 |
) |
|
Unrealized losses on derivative contracts, net |
|
|
- |
|
|
|
- |
|
|
|
- |
|
|
|
- |
|
|
|
(16,679 |
) |
|
|
- |
|
|
|
(443 |
) |
|
|
(17,122 |
) |
|
Reallocation of equity |
|
|
- |
|
|
|
- |
|
|
|
- |
|
|
|
2,770 |
|
|
|
- |
|
|
|
- |
|
|
|
(2,770 |
) |
|
|
- |
|
|
Distributions and other |
|
|
- |
|
|
|
- |
|
|
|
- |
|
|
|
(176 |
) |
|
|
- |
|
|
|
(669,384 |
) |
|
|
(303,001 |
) |
|
|
(972,561 |
) |
|
Balance at September 30, 2016 |
|
$ |
78,235 |
|
|
|
528,599 |
|
|
$ |
5,286 |
|
|
$ |
19,433,001 |
|
|
$ |
(889,223 |
) |
|
$ |
(3,828,132 |
) |
|
$ |
3,484,103 |
|
|
$ |
18,283,270 |
|
The accompanying notes are an integral part of these Consolidated Financial Statements.
3
CONSOLIDATED STATEMENTS OF CASH FLOWS
(Unaudited)
(In thousands)
|
|
|
Nine Months Ended |
|
|||||
|
|
|
September 30, |
|
|||||
|
|
|
2016 |
|
|
2015 |
|
||
|
Operating activities: |
|
|
|
|
|
|
|
|
|
Consolidated net earnings |
|
$ |
825,838 |
|
|
$ |
798,758 |
|
|
Adjustments to reconcile net earnings to net cash provided by operating activities: |
|
|
|
|
|
|
|
|
|
Straight-lined rents and amortization of above and below market leases |
|
|
(74,664 |
) |
|
|
(37,537 |
) |
|
Equity-based compensation awards |
|
|
43,658 |
|
|
|
40,124 |
|
|
Depreciation and amortization |
|
|
705,249 |
|
|
|
607,467 |
|
|
Earnings from unconsolidated entities, net |
|
|
(145,622 |
) |
|
|
(106,383 |
) |
|
Distributions from unconsolidated entities |
|
|
210,439 |
|
|
|
205,931 |
|
|
Net changes in operating receivables from unconsolidated entities |
|
|
(56,992 |
) |
|
|
(20,153 |
) |
|
Amortization of debt premiums, net of deferred financing costs |
|
|
(13,047 |
) |
|
|
(22,271 |
) |
|
Gains on dispositions of investments in real estate, net |
|
|
(461,963 |
) |
|
|
(655,288 |
) |
|
Unrealized foreign currency and derivative losses, net |
|
|
21,266 |
|
|
|
6,931 |
|
|
Losses (gains) on early extinguishment of debt, net |
|
|
(2,484 |
) |
|
|
16,525 |
|
|
Deferred income tax benefit |
|
|
(1,737 |
) |
|
|
(1,758 |
) |
|
Increase in accounts receivable and other assets |
|
|
(48,231 |
) |
|
|
(68,243 |
) |
|
Decrease in accounts payable and accrued expenses and other liabilities |
|
|
(4,699 |
) |
|
|
(7,546 |
) |
|
Net cash provided by operating activities |
|
|
997,011 |
|
|
|
756,557 |
|
|
Investing activities: |
|
|
|
|
|
|
|
|
|
Real estate development |
|
|
(1,225,613 |
) |
|
|
(950,199 |
) |
|
Real estate acquisitions |
|
|
(280,797 |
) |
|
|
(571,368 |
) |
|
KTR acquisition, net of cash received |
|
|
- |
|
|
|
(4,809,499 |
) |
|
Tenant improvements and lease commissions on previously leased space |
|
|
(125,041 |
) |
|
|
(108,662 |
) |
|
Nondevelopment capital expenditures |
|
|
(66,298 |
) |
|
|
(51,374 |
) |
|
Proceeds from dispositions and contributions of real estate properties |
|
|
1,859,317 |
|
|
|
1,814,532 |
|
|
Investments in and advances to unconsolidated entities |
|
|
(228,588 |
) |
|
|
(438,964 |
) |
|
Return of investment from unconsolidated entities |
|
|
579,134 |
|
|
|
14,909 |
|
|
Proceeds from repayment of notes receivable backed by real estate |
|
|
201,250 |
|
|
|
9,866 |
|
|
Proceeds from the settlement of net investment hedges |
|
|
16,768 |
|
|
|
122,505 |
|
|
Payments on the settlement of net investment hedges |
|
|
- |
|
|
|
(981 |
) |
|
Net cash provided by (used in) investing activities |
|
|
730,132 |
|
|
|
(4,969,235 |
) |
|
Financing activities: |
|
|
|
|
|
|
|
|
|
Proceeds from issuance of common stock |
|
|
38,101 |
|
|
|
84,112 |
|
|
Dividends paid on common and preferred stock |
|
|
(669,384 |
) |
|
|
(592,795 |
) |
|
Noncontrolling interests contributions |
|
|
1,026 |
|
|
|
2,354,468 |
|
|
Noncontrolling interests distributions |
|
|
(301,268 |
) |
|
|
(157,517 |
) |
|
Purchase of noncontrolling interests |
|
|
(2,979 |
) |
|
|
(2,560 |
) |
|
Tax paid for shares withheld |
|
|
(7,862 |
) |
|
|
(12,292 |
) |
|
Debt and equity issuance costs paid |
|
|
(19,265 |
) |
|
|
(18,476 |
) |
|
Net proceeds from (payments on) credit facilities |
|
|
(3,545 |
) |
|
|
199,958 |
|
|
Repurchase and payments of debt |
|
|
(1,675,818 |
) |
|
|
(913,178 |
) |
|
Proceeds from issuance of debt |
|
|
1,012,331 |
|
|
|
3,239,261 |
|
|
Net cash provided by (used in) financing activities |
|
|
(1,628,663 |
) |
|
|
4,180,981 |
|
|
|
|
|
|
|
|
|
|
|
|
Effect of foreign currency exchange rate changes on cash |
|
|
12,560 |
|
|
|
(8,562 |
) |
|
Net increase in cash and cash equivalents |
|
|
111,040 |
|
|
|
(40,259 |
) |
|
Cash and cash equivalents, beginning of period |
|
|
264,080 |
|
|
|
350,692 |
|
|
Cash and cash equivalents, end of period |
|
$ |
375,120 |
|
|
$ |
310,433 |
|
See Note 13 for information on noncash investing and financing activities and other information.
The accompanying notes are an integral part of these Consolidated Financial Statements.
4
(In thousands)
|
|
September 30, |
|
|
|
|
|
|
|
|
2016 |
|
|
December 31, |
|
||
|
|
(Unaudited) |
|
|
2015 |
|
||
|
ASSETS |
|
|
|
|
|
|
|
|
Investments in real estate properties |
$ |
27,570,704 |
|
|
$ |
27,521,368 |
|
|
Less accumulated depreciation |
|
3,638,688 |
|
|
|
3,274,284 |
|
|
Net investments in real estate properties |
|
23,932,016 |
|
|
|
24,247,084 |
|
|
Investments in and advances to unconsolidated entities |
|
4,580,584 |
|
|
|
4,755,620 |
|
|
Assets held for sale or contribution |
|
450,349 |
|
|
|
378,423 |
|
|
Notes receivable backed by real estate |
|
33,800 |
|
|
|
235,050 |
|
|
Net investments in real estate |
|
28,996,749 |
|
|
|
29,616,177 |
|
|
|
|
|
|
|
|
|
|
|
Cash and cash equivalents |
|
375,120 |
|
|
|
264,080 |
|
|
Other assets |
|
1,516,340 |
|
|
|
1,514,510 |
|
|
Total assets |
$ |
30,888,209 |
|
|
$ |
31,394,767 |
|
|
|
|
|
|
|
|
|
|
|
LIABILITIES AND CAPITAL |
|
|
|
|
|
|
|
|
Liabilities: |
|
|
|
|
|
|
|
|
Debt |
$ |
11,256,997 |
|
|
$ |
11,626,831 |
|
|
Accounts payable and accrued expenses |
|
672,111 |
|
|
|
712,725 |
|
|
Other liabilities |
|
675,831 |
|
|
|
634,375 |
|
|
Total liabilities |
|
12,604,939 |
|
|
|
12,973,931 |
|
|
|
|
|
|
|
|
|
|
|
Capital: |
|
|
|
|
|
|
|
|
Partners’ capital: |
|
|
|
|
|
|
|
|
General partner – preferred |
|
78,235 |
|
|
|
78,235 |
|
|
General partner – common |
|
14,720,932 |
|
|
|
14,589,700 |
|
|
Limited partners – common |
|
148,599 |
|
|
|
186,683 |
|
|
Limited partners – Class A common |
|
242,516 |
|
|
|
245,991 |
|
|
Total partners’ capital |
|
15,190,282 |
|
|
|
15,100,609 |
|
|
Noncontrolling interests |
|
3,092,988 |
|
|
|
3,320,227 |
|
|
Total capital |
|
18,283,270 |
|
|
|
18,420,836 |
|
|
Total liabilities and capital |
$ |
30,888,209 |
|
|
$ |
31,394,767 |
|
The accompanying notes are an integral part of these Consolidated Financial Statements.
5
CONSOLIDATED STATEMENTS OF INCOME
(Unaudited)
(In thousands, except per unit amounts)
|
|
|
Three Months Ended |
|
|
Nine Months Ended |
|
||||||||||
|
|
|
September 30, |
|
|
September 30, |
|
||||||||||
|
|
|
2016 |
|
|
2015 |
|
|
2016 |
|
|
2015 |
|
||||
|
Revenues: |
|
|
|
|
|
|
|
|
|
|
|
|
|
|
|
|
|
Rental |
|
$ |
435,868 |
|
|
$ |
418,116 |
|
|
$ |
1,299,122 |
|
|
$ |
1,100,491 |
|
|
Rental recoveries |
|
|
124,409 |
|
|
|
114,639 |
|
|
|
361,402 |
|
|
|
312,510 |
|
|
Strategic capital |
|
|
140,577 |
|
|
|
44,176 |
|
|
|
241,565 |
|
|
|
133,247 |
|
|
Development management and other |
|
|
3,711 |
|
|
|
3,691 |
|
|
|
10,931 |
|
|
|
7,625 |
|
|
Total revenues |
|
|
704,565 |
|
|
|
580,622 |
|
|
|
1,913,020 |
|
|
|
1,553,873 |
|
|
Expenses: |
|
|
|
|
|
|
|
|
|
|
|
|
|
|
|
|
|
Rental |
|
|
140,514 |
|
|
|
140,284 |
|
|
|
427,820 |
|
|
|
393,199 |
|
|
Strategic capital |
|
|
44,624 |
|
|
|
26,532 |
|
|
|
97,783 |
|
|
|
76,661 |
|
|
General and administrative |
|
|
58,157 |
|
|
|
54,178 |
|
|
|
165,634 |
|
|
|
157,458 |
|
|
Depreciation and amortization |
|
|
224,867 |
|
|
|
247,471 |
|
|
|
705,249 |
|
|
|
607,467 |
|
|
Other |
|
|
3,779 |
|
|
|
8,765 |
|
|
|
12,364 |
|
|
|
44,467 |
|
|
Total expenses |
|
|
471,941 |
|
|
|
477,230 |
|
|
|
1,408,850 |
|
|
|
1,279,252 |
|
|
|
|
|
|
|
|
|
|
|
|
|
|
|
|
|
|
|
|
Operating income |
|
|
232,624 |
|
|
|
103,392 |
|
|
|
504,170 |
|
|
|
274,621 |
|
|
|
|
|
|
|
|
|
|
|
|
|
|
|
|
|
|
|
|
Other income (expense): |
|
|
|
|
|
|
|
|
|
|
|
|
|
|
|
|
|
Earnings from unconsolidated entities, net |
|
|
45,857 |
|
|
|
33,557 |
|
|
|
145,622 |
|
|
|
106,383 |
|
|
Interest expense |
|
|
(75,310 |
) |
|
|
(81,035 |
) |
|
|
(232,577 |
) |
|
|
(218,698 |
) |
|
Interest and other income, net |
|
|
2,932 |
|
|
|
6,237 |
|
|
|
7,051 |
|
|
|
19,133 |
|
|
Gains on dispositions of investments in real estate, net |
|
|
117,296 |
|
|
|
268,791 |
|
|
|
461,963 |
|
|
|
655,288 |
|
|
Foreign currency and derivative losses, net |
|
|
(1,730 |
) |
|
|
(9,428 |
) |
|
|
(26,277 |
) |
|
|
(374 |
) |
|
Gains (losses) on early extinguishment of debt, net |
|
|
1,492 |
|
|
|
- |
|
|
|
2,484 |
|
|
|
(16,525 |
) |
|
Total other income |
|
|
90,537 |
|
|
|
218,122 |
|
|
|
358,266 |
|
|
|
545,207 |
|
|
Earnings before income taxes |
|
|
323,161 |
|
|
|
321,514 |
|
|
|
862,436 |
|
|
|
819,828 |
|
|
Total income tax expense |
|
|
15,919 |
|
|
|
14,328 |
|
|
|
36,598 |
|
|
|
21,070 |
|
|
Consolidated net earnings |
|
|
307,242 |
|
|
|
307,186 |
|
|
|
825,838 |
|
|
|
798,758 |
|
|
Less net earnings attributable to noncontrolling interests |
|
|
18,628 |
|
|
|
43,360 |
|
|
|
35,865 |
|
|
|
43,558 |
|
|
Net earnings attributable to controlling interests |
|
|
288,614 |
|
|
|
263,826 |
|
|
|
789,973 |
|
|
|
755,200 |
|
|
Less preferred unit distributions |
|
|
1,671 |
|
|
|
1,671 |
|
|
|
5,056 |
|
|
|
5,019 |
|
|
Net earnings attributable to common unitholders |
|
$ |
286,943 |
|
|
$ |
262,155 |
|
|
$ |
784,917 |
|
|
$ |
750,181 |
|
|
|
|
|
|
|
|
|
|
|
|
|
|
|
|
|
|
|
|
Weighted average common units outstanding – Basic |
|
|
532,934 |
|
|
|
530,044 |
|
|
|
531,985 |
|
|
|
524,411 |
|
|
Weighted average common units outstanding – Diluted |
|
|
547,200 |
|
|
|
532,073 |
|
|
|
545,228 |
|
|
|
531,121 |
|
|
|
|
|
|
|
|
|
|
|
|
|
|
|
|
|
|
|
|
Net earnings per unit attributable to common unitholders – Basic |
|
$ |
0.53 |
|
|
$ |
0.49 |
|
|
$ |
1.45 |
|
|
$ |
1.43 |
|
|
|
|
|
|
|
|
|
|
|
|
|
|
|
|
|
|
|
|
Net earnings per unit attributable to common unitholders – Diluted |
|
$ |
0.52 |
|
|
$ |
0.49 |
|
|
$ |
1.44 |
|
|
$ |
1.41 |
|
|
|
|
|
|
|
|
|
|
|
|
|
|
|
|
|
|
|
|
Distributions per common unit |
|
$ |
0.42 |
|
|
$ |
0.40 |
|
|
$ |
1.26 |
|
|
$ |
1.12 |
|
The accompanying notes are an integral part of these Consolidated Financial Statements.
6
CONSOLIDATED STATEMENTS OF COMPREHENSIVE INCOME
(Unaudited)
(In thousands)
|
|
|
Three Months Ended |
|
|
Nine Months Ended |
|
||||||||||
|
|
|
September 30, |
|
|
September 30, |
|
||||||||||
|
|
|
2016 |
|
|
2015 |
|
|
2016 |
|
|
2015 |
|
||||
|
Consolidated net earnings |
|
$ |
307,242 |
|
|
$ |
307,186 |
|
|
$ |
825,838 |
|
|
$ |
798,758 |
|
|
Other comprehensive income (loss): |
|
|
|
|
|
|
|
|
|
|
|
|
|
|
|
|
|
Foreign currency translation losses, net |
|
|
(48,232 |
) |
|
|
(148,570 |
) |
|
|
(69,832 |
) |
|
|
(197,912 |
) |
|
Unrealized gains (losses) on derivative contracts, net |
|
|
4,696 |
|
|
|
(15,660 |
) |
|
|
(17,122 |
) |
|
|
(12,313 |
) |
|
Comprehensive income |
|
|
263,706 |
|
|
|
142,956 |
|
|
|
738,884 |
|
|
|
588,533 |
|
|
Net earnings attributable to noncontrolling interests |
|
|
(18,628 |
) |
|
|
(43,360 |
) |
|
|
(35,865 |
) |
|
|
(43,558 |
) |
|
Other comprehensive loss (income) attributable to noncontrolling interest |
|
|
1,406 |
|
|
|
17,104 |
|
|
|
(13,438 |
) |
|
|
31,788 |
|
|
Comprehensive income attributable to common unitholders |
|
$ |
246,484 |
|
|
$ |
116,700 |
|
|
$ |
689,581 |
|
|
$ |
576,763 |
|
The accompanying notes are an integral part of these Consolidated Financial Statements.
CONSOLIDATED STATEMENT OF CAPITAL
Nine Months Ended September 30, 2016
(Unaudited)
(In thousands)
|
|
General Partner |
|
|
Limited Partners |
|
|
Non- |
|
|
|
|
|
|||||||||||||||||||||||||||
|
|
Preferred |
|
|
Common |
|
|
Common |
|
|
Class A Common |
|
|
controlling |
|
|
|
|
|
|||||||||||||||||||||
|
|
Units |
|
|
Amount |
|
|
Units |
|
|
Amount |
|
|
Units |
|
|
Amount |
|
|
Units |
|
|
Amount |
|
|
Interests |
|
|
Total |
|
||||||||||
|
Balance at January 1, 2016 |
|
1,565 |
|
|
$ |
78,235 |
|
|
|
524,512 |
|
|
$ |
14,589,700 |
|
|
|
6,711 |
|
|
$ |
186,683 |
|
|
|
8,894 |
|
|
$ |
245,991 |
|
|
$ |
3,320,227 |
|
|
$ |
18,420,836 |
|
|
Consolidated net earnings |
|
- |
|
|
|
- |
|
|
|
- |
|
|
|
767,735 |
|
|
|
- |
|
|
|
9,469 |
|
|
|
- |
|
|
|
12,769 |
|
|
|
35,865 |
|
|
|
825,838 |
|
|
Effect of equity compensation plans |
|
- |
|
|
|
- |
|
|
|
2,220 |
|
|
|
75,280 |
|
|
|
440 |
|
|
|
18,771 |
|
|
|
- |
|
|
|
- |
|
|
|
- |
|
|
|
94,051 |
|
|
Issuance of units related to acquisitions |
|
- |
|
|
|
- |
|
|
|
- |
|
|
|
- |
|
|
|
72 |
|
|
|
3,162 |
|
|
|
- |
|
|
|
- |
|
|
|
- |
|
|
|
3,162 |
|
|
Settlement of noncontrolling interests |
|
- |
|
|
|
- |
|
|
|
- |
|
|
|
851 |
|
|
|
- |
|
|
|
- |
|
|
|
- |
|
|
|
- |
|
|
|
(2,979 |
) |
|
|
(2,128 |
) |
|
Conversion of limited partners units |
|
- |
|
|
|
- |
|
|
|
1,867 |
|
|
|
51,950 |
|
|
|
(1,867 |
) |
|
|
(51,950 |
) |
|
|
- |
|
|
|
- |
|
|
|
- |
|
|
|
- |
|
|
Capital contributions |
|
- |
|
|
|
- |
|
|
|
- |
|
|
|
- |
|
|
|
- |
|
|
|
- |
|
|
|
- |
|
|
|
- |
|
|
|
1,026 |
|
|
|
1,026 |
|
|
Foreign currency translation gains (losses), net |
|
- |
|
|
|
- |
|
|
|
- |
|
|
|
(81,115 |
) |
|
|
- |
|
|
|
(819 |
) |
|
|
- |
|
|
|
(1,336 |
) |
|
|
13,438 |
|
|
|
(69,832 |
) |
|
Unrealized losses on derivative contracts, net |
|
- |
|
|
|
- |
|
|
|
- |
|
|
|
(16,679 |
) |
|
|
- |
|
|
|
(168 |
) |
|
|
- |
|
|
|
(275 |
) |
|
|
- |
|
|
|
(17,122 |
) |
|
Reallocation of capital |
|
- |
|
|
|
- |
|
|
|
- |
|
|
|
2,770 |
|
|
|
- |
|
|
|
(5,391 |
) |
|
|
- |
|
|
|
2,621 |
|
|
|
- |
|
|
|
- |
|
|
Distributions and other |
|
- |
|
|
|
- |
|
|
|
- |
|
|
|
(669,560 |
) |
|
|
(20 |
) |
|
|
(11,158 |
) |
|
|
- |
|
|
|
(17,254 |
) |
|
|
(274,589 |
) |
|
|
(972,561 |
) |
|
Balance at September 30, 2016 |
|
1,565 |
|
|
$ |
78,235 |
|
|
|
528,599 |
|
|
$ |
14,720,932 |
|
|
|
5,336 |
|
|
$ |
148,599 |
|
|
|
8,894 |
|
|
$ |
242,516 |
|
|
$ |
3,092,988 |
|
|
$ |
18,283,270 |
|
The accompanying notes are an integral part of these Consolidated Financial Statements.
7
CONSOLIDATED STATEMENTS OF CASH FLOWS
(Unaudited)
(In thousands)
|
|
|
Nine Months Ended |
|
|||||
|
|
|
September 30, |
|
|||||
|
|
|
2016 |
|
|
2015 |
|
||
|
Operating activities: |
|
|
|
|
|
|
|
|
|
Consolidated net earnings |
|
$ |
825,838 |
|
|
$ |
798,758 |
|
|
Adjustments to reconcile net earnings to net cash provided by operating activities: |
|
|
|
|
|
|
|
|
|
Straight-lined rents and amortization of above and below market leases |
|
|
(74,664 |
) |
|
|
(37,537 |
) |
|
Equity-based compensation awards |
|
|
43,658 |
|
|
|
40,124 |
|
|
Depreciation and amortization |
|
|
705,249 |
|
|
|
607,467 |
|
|
Earnings from unconsolidated entities, net |
|
|
(145,622 |
) |
|
|
(106,383 |
) |
|
Distributions from unconsolidated entities |
|
|
210,439 |
|
|
|
205,931 |
|
|
Net changes in operating receivables from unconsolidated entities |
|
|
(56,992 |
) |
|
|
(20,153 |
) |
|
Amortization of debt premiums, net of deferred financing costs |
|
|
(13,047 |
) |
|
|
(22,271 |
) |
|
Gains on dispositions of investments in real estate, net |
|
|
(461,963 |
) |
|
|
(655,288 |
) |
|
Unrealized foreign currency and derivative losses, net |
|
|
21,266 |
|
|
|
6,931 |
|
|
Losses (gains) on early extinguishment of debt, net |
|
|
(2,484 |
) |
|
|
16,525 |
|
|
Deferred income tax benefit |
|
|
(1,737 |
) |
|
|
(1,758 |
) |
|
Increase in accounts receivable and other assets |
|
|
(48,231 |
) |
|
|
(68,243 |
) |
|
Decrease in accounts payable and accrued expenses and other liabilities |
|
|
(4,699 |
) |
|
|
(7,546 |
) |
|
Net cash provided by operating activities |
|
|
997,011 |
|
|
|
756,557 |
|
|
Investing activities: |
|
|
|
|
|
|
|
|
|
Real estate development |
|
|
(1,225,613 |
) |
|
|
(950,199 |
) |
|
Real estate acquisitions |
|
|
(280,797 |
) |
|
|
(571,368 |
) |
|
KTR acquisition, net of cash received |
|
|
- |
|
|
|
(4,809,499 |
) |
|
Tenant improvements and lease commissions on previously leased space |
|
|
(125,041 |
) |
|
|
(108,662 |
) |
|
Nondevelopment capital expenditures |
|
|
(66,298 |
) |
|
|
(51,374 |
) |
|
Proceeds from dispositions and contributions of real estate properties |
|
|
1,859,317 |
|
|
|
1,814,532 |
|
|
Investments in and advances to unconsolidated entities |
|
|
(228,588 |
) |
|
|
(438,964 |
) |
|
Return of investment from unconsolidated entities |
|
|
579,134 |
|
|
|
14,909 |
|
|
Proceeds from repayment of notes receivable backed by real estate |
|
|
201,250 |
|
|
|
9,866 |
|
|
Proceeds from the settlement of net investment hedges |
|
|
16,768 |
|
|
|
122,505 |
|
|
Payments on the settlement of net investment hedges |
|
|
- |
|
|
|
(981 |
) |
|
Net cash provided by (used in) investing activities |
|
|
730,132 |
|
|
|
(4,969,235 |
) |
|
Financing activities: |
|
|
|
|
|
|
|
|
|
Proceeds from issuance of common partnership units in exchange for contributions from Prologis, Inc. |
|
|
38,101 |
|
|
|
84,112 |
|
|
Distributions paid on common and preferred units |
|
|
(698,647 |
) |
|
|
(600,186 |
) |
|
Noncontrolling interests contributions |
|
|
1,026 |
|
|
|
2,354,468 |
|
|
Noncontrolling interests distributions |
|
|
(272,856 |
) |
|
|
(150,523 |
) |
|
Purchase of noncontrolling interests |
|
|
(2,128 |
) |
|
|
(2,163 |
) |
|
Tax paid for shares withheld |
|
|
(7,862 |
) |
|
|
(12,292 |
) |
|
Debt and capital issuance costs paid |
|
|
(19,265 |
) |
|
|
(18,476 |
) |
|
Net proceeds from credit facilities |
|
|
(3,545 |
) |
|
|
199,958 |
|
|
Repurchase and payments of debt |
|
|
(1,675,818 |
) |
|
|
(913,178 |
) |
|
Proceeds from issuance of debt |
|
|
1,012,331 |
|
|
|
3,239,261 |
|
|
Net cash provided by (used in) financing activities |
|
|
(1,628,663 |
) |
|
|
4,180,981 |
|
|
|
|
|
|
|
|
|
|
|
|
Effect of foreign currency exchange rate changes on cash |
|
|
12,560 |
|
|
|
(8,562 |
) |
|
Net increase in cash and cash equivalents |
|
|
111,040 |
|
|
|
(40,259 |
) |
|
Cash and cash equivalents, beginning of period |
|
|
264,080 |
|
|
|
350,692 |
|
|
Cash and cash equivalents, end of period |
|
$ |
375,120 |
|
|
$ |
310,433 |
|
See Note 13 for information on noncash investing and financing activities and other information.
The accompanying notes are an integral part of these Consolidated Financial Statements.
8
PROLOGIS, INC. AND PROLOGIS, L.P.
NOTES TO THE CONSOLIDATED FINANCIAL STATEMENTS
(Unaudited)
Business. Prologis, Inc. (or the “Parent”) commenced operations as a fully integrated real estate company in 1997, elected to be taxed as a real estate investment trust (“REIT”) under the Internal Revenue Code of 1986, as amended (the “Internal Revenue Code”), and believes the current organization and method of operation will enable it to maintain its status as a REIT. The Parent is the general partner of Prologis, L.P. (or the “Operating Partnership”). Through the Operating Partnership, we are engaged in the ownership, acquisition, development and management of logistics properties in the world’s primary population centers and in those supported by extensive transportation infrastructure. Our current business strategy consists of two operating business segments: Real Estate Operations and Strategic Capital. Our Real Estate Operations segment represents the ownership and development of industrial properties. Our Strategic Capital segment represents the management of co-investment ventures and other unconsolidated entities. See Note 12 for further discussion of our business segments. Unless otherwise indicated, the Notes to the Consolidated Financial Statements apply to both the Parent and the Operating Partnership. The terms “the Company,” “Prologis,” “we,” “our” or “us” means the Parent and Operating Partnership collectively.
For each share of common stock or preferred stock the Parent issues, the Operating Partnership issues a corresponding common or preferred partnership unit, as applicable, to the Parent in exchange for the contribution of the proceeds from the stock issuance. At September 30, 2016, the Parent owned an approximate 97.41% common general partnership interest in the Operating Partnership and 100% of the preferred units in the Operating Partnership. The remaining approximate 2.59% common limited partnership interests, which include 8.9 million Class A common limited partnership units (“Class A Units”) in the Operating Partnership, are owned by unaffiliated investors and certain current and former directors and officers of the Parent. Each partner’s percentage interest in the Operating Partnership is determined based on the number of Operating Partnership units owned as compared to total Operating Partnership units outstanding at each period end and is used as the basis for the allocation of net income or loss to each partner. At the end of each reporting period, a capital adjustment is made in the Operating Partnership to reflect the appropriate ownership interest for each of the common unitholders. These adjustments are reflected in the line items Reallocation of Equity in the Consolidated Statement of Equity and Reallocation of Capital in the Consolidated Statement of Capital.
As the sole general partner of the Operating Partnership, the Parent has complete responsibility and discretion in the day-to-day management and control of the Operating Partnership and we operate the Parent and the Operating Partnership as one enterprise. The management of the Parent consists of the same members as the management of the Operating Partnership. These members are officers of the Parent and employees of the Operating Partnership or one of its subsidiaries. As general partner with control of the Operating Partnership, the Parent consolidates the Operating Partnership. Because the Parent’s only significant asset is its investment in the Operating Partnership, the assets and liabilities of the Parent and the Operating Partnership are the same on their respective financial statements.
Basis of Presentation. The accompanying Consolidated Financial Statements are prepared in accordance with United States (“U.S.”) generally accepted accounting principles (“GAAP”) and are presented in our reporting currency, the U.S. dollar. All material intercompany transactions with consolidated entities have been eliminated.
The accompanying unaudited interim financial information has been prepared according to the rules and regulations of the U.S. Securities and Exchange Commission (“SEC”). Certain information and footnote disclosures normally included in our annual financial statements prepared in accordance with GAAP have been condensed or omitted in accordance with such rules and regulations. Our management believes that the disclosures presented in these financial statements are adequate to make the information presented not misleading. In our opinion, all adjustments and eliminations, consisting only of normal recurring adjustments, necessary to present fairly the financial position and results of operations for both the Parent and the Operating Partnership for the reported periods have been included. The results of operations for such interim periods are not necessarily indicative of the results for the full year. The accompanying unaudited interim financial information should be read in conjunction with our Annual Report on Form 10-K for the fiscal year ended December 31, 2015, as filed with the SEC, and other public information.
Certain amounts included in the accompanying Consolidated Financial Statements for 2015 have been reclassified to conform to the 2016 financial statement presentation. See below in our New Accounting Pronouncements for further discussion on these reclassifications.
New Accounting Pronouncements. In August 2016, the Financial Accounting Standards Board (“FASB”) issued an accounting standard update that provides guidance for areas in which there are diversity in how certain cash receipts and payments are presented and classified in the statements of cash flows. The update clarifies the classification methodology within the statements of cash flows for eight specific topics including classification for debt prepayment or extinguishment costs, proceeds from the settlement of insurance claims and distributions received from equity method investments. We early adopted the standard in its entirety on a retrospective basis for all periods presented at September 30, 2016, and we determined that the only clarification to impact us was the classification of distributions received from equity method investments. The update allows for the election to classify distributions received from equity method investments based on either a cumulative earnings approach or a nature of distribution approach. We have elected the nature of distribution approach, in which cash flows generated from the operations of an unconsolidated entity are classified as a return on investment (cash inflow from operating activities) and cash flows that are generated from property sales or debt refinancing are
9
classified as a return of investment (cash inflow from investing activities). We adopted this approach based on the availability of the information to us to determine the nature of the underlying activity that generated the distributions from unconsolidated entities. As a result of our adoption of this standard, we included $40.6 million of distributions from our unconsolidated entities in cash flows provided by operating activities for the nine months ended September 30, 2016, that had previously been reported as cash flows used in investing activities in the Consolidated Statements of Cash Flows. In addition, we reclassified $94.5 million of distributions from our unconsolidated entities into cash flows provided by operating activities that was previously reported as cash flows used in investing activities for the nine months ended September 30, 2015.
In March 2016, the FASB issued an accounting standard update that amends the stock compensation requirements in existing GAAP. The update simplifies certain aspects of accounting for share-based payment transactions, including income tax consequences, statutory tax withholding requirements, forfeitures and classification of taxes paid to a tax authority by us when we withhold shares to cover employee withholding tax payments for certain stock compensation plans in the statements of cash flows. We early adopted the standard in its entirety on a retrospective basis for periods presented at September 30, 2016. As a result of our adoption of this standard, we included payments of $7.9 million related to shares withheld to pay employee withholding taxes for certain stock compensation plans in cash flows used in financing activities for the nine months ended September 30, 2016, that had previously been reported as cash flows provided by operating activities in the Consolidated Statements of Cash Flows. In addition, we reclassified payments of $12.3 million from cash flows provided by operating activities to cash flows used in financing activities for the nine months ended September 30, 2015.
In February 2016, the FASB issued an accounting standard that provides the principles for the recognition, measurement, presentation and disclosure of leases. Under the standard, lessees apply a dual approach, classifying leases as either finance or operating leases. A lessee is required to record a right-of-use asset and a lease liability for all leases with a term of greater than 12 months, regardless of their lease classification. We are a lessee on ground leases in certain markets and office space leases. Although the accounting for lessors will remain largely unchanged from current GAAP, the new standard requires a lessor to classify leases as either sales-type, finance or operating. The standard also requires that lessors expense certain initial direct costs, which are capitalizable under existing standards, as incurred. The standard is effective for us for annual and interim reporting periods beginning after December 15, 2018, with early adoption permitted. We are currently assessing the timing, method of adoption and the overall impact the adoption will have on the consolidated financial statements.
In February 2015, the FASB issued an accounting standard update that amends the consolidation requirements in existing GAAP. Under the update, all entities, including limited partnerships and similar legal entities, are now within the scope of consolidation guidance, unless a scope exception applies. We adopted this standard on a modified retrospective basis on January 1, 2016, and the adoption did not have a material effect on the Consolidated Financial Statements, however the Operating Partnership and certain of our consolidated co-investment ventures now qualify as variable interest entities (“VIEs”) under the new guidance, which required additional disclosures. See Note 8 for additional information about our VIEs.
In May 2014, the FASB issued an accounting standard update that requires companies to use a five step model to determine when to recognize revenue from customer contracts in an effort to increase consistency and comparability throughout global capital markets and across industries. Under the model, a company will identify the contract, identify any separate performance obligations in the contract, determine the transaction price, allocate the transaction price and recognize revenue when the performance obligation is satisfied. It is effective for annual and interim reporting periods beginning after December 15, 2017, with earlier adoption permitted, but not before the original effective date of December 15, 2016. We are currently evaluating the impact the adoption of this standard will have on the Consolidated Financial Statements.
On May 29, 2015, we acquired the real estate assets and operating platform from KTR Capital Partners and its affiliates (“KTR”). The portfolio consisted of 315 operating properties, aggregating 59.0 million square feet, 3.6 million square feet of properties under development and land parcels that will support an estimated build out of 6.8 million square feet. The properties were acquired by our consolidated co-investment venture Prologis U.S. Logistics Venture, of which we own 55%. The acquisition was funded through cash (which included the contribution of $2.3 billion from our venture partner and the proceeds from the issuance of debt), the assumption of secured mortgage debt and the issuance of 4.5 million common limited partnership units in the Operating Partnership. We incurred $24.7 million of acquisition costs that are included in Other Expenses during the second quarter of 2015.
The allocation of the purchase price required a significant amount of judgment and was based on our valuations, estimates and assumptions of the acquisition date fair value of the tangible and intangible assets acquired and liabilities assumed. The adjustments finalizing the purchase price allocation during the measurement period were not considered to be material to our financial position or results of operations.
10
The allocation of the purchase price was as follows (in thousands):
|
|
|
|
|
|
|
Investments in real estate properties |
|
$ |
5,441,384 |
|
|
Intangible assets, net of intangible liabilities |
|
|
332,708 |
|
|
Accounts receivable and other assets |
|
|
8,062 |
|
|
Debt, including premium |
|
|
(735,172 |
) |
|
Accounts payable, accrued expenses and other liabilities |
|
|
(56,313 |
) |
|
Total estimated purchase price |
|
|
4,990,669 |
|
|
Our venture partner’s share of purchase price |
|
|
(2,253,234 |
) |
|
Common limited partnership units issued in the Operating Partnership |
|
|
(181,170 |
) |
|
Prologis share of cash purchase price |
|
$ |
2,556,265 |
|
The following pro forma financial information presents our results as though the KTR acquisition had been completed on January 1, 2015. The pro forma information does not reflect the actual results of operations had the transaction actually been completed on January 1, 2015, and it is not indicative of future operating results. The results for the nine months ended September 30, 2015, include approximately four months of actual results for the acquisition, which includes the acquisition expenses, and five months of pro forma adjustments. Actual results in 2015 include rental income and rental expenses of the properties acquired of $132.7 million and $30.0 million, respectively, representing the period from acquisition through September 30, 2015.
The following amounts are in thousands, except per share amounts:
|
|
|
Nine Months Ended |
|
|
|
|
|
September 30, 2015 |
|
|
|
Total revenues |
|
$ |
1,715,540 |
|
|
Net earnings attributable to common stockholders |
|
$ |
756,302 |
|
|
Net earnings per share attributable to common stockholders – Basic |
|
$ |
1.45 |
|
|
Net earnings per share attributable to common stockholders – Diluted |
|
$ |
1.43 |
|
These results include certain adjustments, primarily: (i) decreased revenues from the amortization of the net assets from the acquired leases with net favorable rents relative to estimated market rents; (ii) increased depreciation and amortization expense resulting from the adjustment of real estate assets to estimated fair value and recognition of intangible assets related to in-place leases; and (iii) additional interest expense attributable to the debt issued to finance our cash portion of the acquisition offset by lower interest expense due to the accretion of the fair value adjustment of debt.
Investments in real estate properties consisted of the following (dollars and square feet in thousands):
|
|
Square Feet |
|
|
Number of Buildings |
|
|
|
|
|||||||||||||||
|
|
September 30, |
|
|
December 31, |
|
|
September 30, |
|
|
December 31, |
|
|
September 30, |
|
|
December 31, |
|
||||||
|
|
2016 |
|
|
2015 |
|
|
2016 |
|
|
2015 |
|
|
2016 |
|
|
2015 |
|
||||||
|
Industrial operating properties: |
|
|
|
|
|
|
|
|
|
|
|
|
|
|
|
|
|
|
|
|
|
|
|
|
Improved land |
|
|
|
|
|
|
|
|
|
|
|
|
|
|
|
|
$ |
5,939,404 |
|
|
$ |
5,874,052 |
|
|
Buildings and improvements |
|
333,957 |
|
|
|
333,830 |
|
|
|
1,801 |
|
|
|
1,872 |
|
|
|
17,936,886 |
|
|
|
17,861,693 |
|
|
Development portfolio, including land costs: |
|
|
|
|
|
|
|
|
|
|
|
|
|
|
|
|
|
|
|
|
|
|
|
|
Prestabilized |
|
10,561 |
|
|
|
12,598 |
|
|
|
29 |
|
|
|
28 |
|
|
|
1,063,689 |
|
|
|
918,099 |
|
|
Properties under development |
|
16,116 |
|
|
|
19,630 |
|
|
|
51 |
|
|
|
63 |
|
|
|
745,313 |
|
|
|
954,804 |
|
|
Land (1) |
|
|
|
|
|
|
|
|
|
|
|
|
|
|
|
|
|
1,352,600 |
|
|
|
1,359,794 |
|
|
Other real estate investments (2) |
|
|
|
|
|
|
|
|
|
|
|
|
|
|
|
|
|
532,812 |
|
|
|
552,926 |
|
|
Total investments in real estate properties |
|
|
|
|
|
|
|
|
|
|
|
|
|
|
|
|
|
27,570,704 |
|
|
|
27,521,368 |
|
|
Less accumulated depreciation |
|
|
|
|
|
|
|
|
|
|
|
|
|
|
|
|
|
3,638,688 |
|
|
|
3,274,284 |
|
|
Net investments in real estate properties |
|
|
|
|
|
|
|
|
|
|
|
|
|
|
|
|
$ |
23,932,016 |
|
|
$ |
24,247,084 |
|
|
(1) |
Included in our investments in real estate at September 30, 2016, and December 31, 2015, were 6,650 and 7,404 acres of land, respectively. |
11
|
(2) |
Included in other real estate investments are: (i) non-industrial real estate; (ii) land parcels that are ground leased to third parties; (iii) our corporate office buildings; (iv) infrastructure costs related to projects we are developing on behalf of others; (v) costs related to future development projects, including purchase options on land; and (vi) earnest money deposits associated with potential acquisitions. |
Acquisitions
The following table summarizes our real estate acquisition activity for the nine months ended September 30 (dollars and square feet in thousands):
|
|
|
2016 |
|
|
2015 |
|
||
|
Acquisitions of operating properties from third parties |
|
|
|
|
|
|
|
|
|
Number of industrial operating properties |
|
|
7 |
|
|
|
27 |
|
|
Square feet |
|
|
931 |
|
|
|
3,651 |
|
|
Real estate acquisition value |
|
$ |
86,840 |
|
|
$ |
305,519 |
|
The table above does not include the properties acquired in the KTR acquisition, as this transaction is explained in Note 2.
Dispositions
The following table summarizes our real estate disposition activity for the nine months ended September 30 (dollars and square feet in thousands):
|
|
|
2016 |
|
|
2015 |
|
||
|
Contributions to unconsolidated co-investment ventures |
|
|
|
|
|
|
|
|
|
Number of properties |
|
|
21 |
|
|
|
23 |
|
|
Square feet |
|
|
6,676 |
|
|
|
6,659 |
|
|
Net proceeds |
|
$ |
649,511 |
|
|
$ |
662,645 |
|
|
Net gains on contributions |
|
$ |
132,787 |
|
|
$ |
111,307 |
|
|
Dispositions to third parties |
|
|
|
|
|
|
|
|
|
Number of properties |
|
|
147 |
|
|
|
75 |
|
|
Square feet |
|
|
15,606 |
|
|
|
12,723 |
|
|
Net proceeds (1) |
|
$ |
1,300,209 |
|
|
$ |
1,347,755 |
|
|
Net gains on dispositions (1) |
|
$ |
242,561 |
|
|
$ |
543,981 |
|
|
|
|
|
|
|
|
|
|
|
|
Total net gains on contributions and dispositions |
|
$ |
375,348 |
|
|
$ |
655,288 |
|
|
Gains on redemption of investment in co-investment ventures (2) |
|
|
86,615 |
|
|
|
- |
|
|
Total gains on dispositions of investments in real estate, net |
|
$ |
461,963 |
|
|
$ |
655,288 |
|
|
(1) |
Includes the disposition of land parcels and our investment in an unconsolidated joint venture. |
|
(2) |
See Note 4 for more information about these transactions. |
NOTE 4. UNCONSOLIDATED ENTITIES
Summary of Investments
We have investments in entities through a variety of ventures. We co-invest in entities that own multiple properties with partners and investors and provide asset and property management services to these entities, which we refer to as co-investment ventures. These entities may be consolidated or unconsolidated, depending on the structure, our partner’s participation and other rights and our level of control of the entity. This note details our investments in unconsolidated co-investment ventures, which are accounted for using the equity method of accounting. See Note 8 for more detail regarding our consolidated investments.
We also have other ventures, generally with one partner and that we do not manage, which we account for using the equity method. We refer to our investments in all entities accounted for using the equity method, both unconsolidated co-investment ventures and other ventures, collectively, as unconsolidated entities.
12
The following table summarizes our investments in and advances to our unconsolidated entities (in thousands):
|
|
|
September 30, |
|
|
December 31, |
|
||
|
|
|
2016 |
|
|
2015 |
|
||
|
Unconsolidated co-investment ventures |
|
$ |
4,422,840 |
|
|
$ |
4,585,427 |
|
|
Other ventures |
|
|
157,744 |
|
|
|
170,193 |
|
|
Totals |
|
$ |
4,580,584 |
|
|
$ |
4,755,620 |
|
Unconsolidated Co-Investment Ventures
The amounts recognized in Strategic Capital Revenues and Earnings from Unconsolidated Entities, Net depend on the size and operations of the co-investment ventures, the timing of revenues earned through incentive fees during the life of a venture or upon liquidation (“promotes”), as well as fluctuations in foreign currency exchange rates. We recognized Strategic Capital Expenses for direct costs associated with the asset management of these ventures and allocated property-level management costs for the properties owned by the ventures. Our ownership interest in these ventures also impacts the earnings we recognize.
The following table summarizes the amounts we recognized in the Consolidated Statements of Income related to the unconsolidated co-investment ventures (in thousands):
|
|
|
Three Months Ended September 30, |
|
|
Nine Months Ended September 30, |
|
||||||||||
|
|
|
2016 |
|
|
2015 |
|
|
2016 |
|
|
2015 |
|
||||
|
Strategic capital revenues and other revenues: |
|
|
|
|
|
|
|
|
|
|
|
|
|
|
|
|
|
U.S. |
|
$ |
9,565 |
|
|
$ |
9,866 |
|
|
$ |
27,739 |
|
|
$ |
28,027 |
|
|
Other Americas |
|
|
5,806 |
|
|
|
4,232 |
|
|
|
16,864 |
|
|
|
17,046 |
|
|
Europe (1) |
|
|
113,457 |
|
|
|
20,652 |
|
|
|
160,904 |
|
|
|
60,046 |
|
|
Asia |
|
|
11,202 |
|
|
|
8,760 |
|
|
|
34,249 |
|
|
|
26,165 |
|
|
Total strategic capital revenues |
|
|
140,030 |
|
|
|
43,510 |
|
|
|
239,756 |
|
|
|
131,284 |
|
|
Development management and other revenues |
|
|
2,366 |
|
|
|
1,847 |
|
|
|
6,715 |
|
|
|
5,033 |
|
|
Total strategic capital revenues and other revenues |
|
$ |
142,396 |
|
|
$ |
45,357 |
|
|
$ |
246,471 |
|
|
$ |
136,317 |
|
|
|
|
|
|
|
|
|
|
|
|
|
|
|
|
|
|
|
|
Earnings from unconsolidated co-investment ventures, net: |
|
|
|
|
|
|
|
|
|
|
|
|
|
|
|
|
|
U.S. |
|
$ |
1,763 |
|
|
$ |
2,969 |
|
|
$ |
9,140 |
|
|
$ |
3,930 |
|
|
Other Americas |
|
|
8,077 |
|
|
|
7,589 |
|
|
|
20,885 |
|
|
|
21,186 |
|
|
Europe |
|
|
29,802 |
|
|
|
20,871 |
|
|
|
90,395 |
|
|
|
69,685 |
|
|
Asia |
|
|
4,905 |
|
|
|
1,188 |
|
|
|
12,253 |
|
|
|
8,903 |
|
|
Total earnings from unconsolidated co-investment ventures, net |
|
$ |
44,547 |
|
|
$ |
32,617 |
|
|
$ |
132,673 |
|
|
$ |
103,704 |
|
|
|
|
|
|
|
|
|
|
|
|
|
|
|
|
|
|
|
|
(1) |
In September 2016, we earned promotes from Prologis Targeted Logistics Fund (“PTELF”) and Prologis European Properties Fund II (“PEP II”), each based on the venture’s cumulative returns to the investors over the last three years. The third parties’ share of the promotes that were recognized in Strategic Capital Revenues were €79.2 million ($88.4 million). |
13
The following tables summarize the operating information and financial position of our unconsolidated co-investment ventures (not our proportionate share), as presented at our adjusted basis derived from the ventures’ U.S. GAAP information:
|
|
|
September 30, |
|
|
December 31, |
|
|
September 30, |
|
|||
|
(dollars and square feet in millions) |
|
2016 |
|
|
2015 |
|
|
2015 |
|
|||
|
U.S.: |
|
|
|
|
|
|
|
|
|
|
|
|
|
Number of ventures |
|
|
1 |
|
|
|
1 |
|
|
|
1 |
|
|
Number of properties owned |
|
|
366 |
|
|
|
391 |
|
|
|
401 |
|
|
Square feet |
|
|
49 |
|
|
|
50 |
|
|
|
51 |
|
|
Total assets |
|
$ |
4,167 |
|
|
$ |
4,408 |
|
|
$ |
4,433 |
|
|
Third-party debt |
|
$ |
1,421 |
|
|
$ |
1,433 |
|
|
$ |
1,459 |
|
|
Total liabilities |
|
$ |
1,509 |
|
|
$ |
1,550 |
|
|
$ |
1,557 |
|
|
Our investment balance (1) (3) |
|
$ |
514 |
|
|
$ |
690 |
|
|
$ |
703 |
|
|
Our weighted average ownership (2) (3) |
|
|
17.8 |
% |
|
|
22.5 |
% |
|
|
22.6 |
% |
|
Other Americas: |
|
|
|
|
|
|
|
|
|
|
|
|
|
Number of ventures |
|
|
2 |
|
|
|
2 |
|
|
|
2 |
|
|
Number of properties owned |
|
|
209 |
|
|
|
205 |
|
|
|
201 |
|
|
Square feet |
|
|
41 |
|
|
|
39 |
|
|
|
38 |
|
|
Total assets |
|
$ |
2,679 |
|
|
$ |
2,482 |
|
|
$ |
2,433 |
|
|
Third-party debt |
|
$ |
671 |
|
|
$ |
657 |
|
|
$ |
562 |
|
|
Total liabilities |
|
$ |
754 |
|
|
$ |
708 |
|
|
$ |
605 |
|
|
Our investment balance (1) |
|
$ |
851 |
|
|
$ |
786 |
|
|
$ |
777 |
|
|
Our weighted average ownership (2) |
|
|
43.7 |
% |
|
|
43.8 |
% |
|
|
43.9 |
% |
|
Europe: |
|
|
|
|
|
|
|
|
|
|
|
|
|
Number of ventures |
|
|
4 |
|
|
|
4 |
|
|
|
4 |
|
|
Number of properties owned |
|
|
694 |
|
|
|
688 |
|
|
|
683 |
|
|
Square feet |
|
|
160 |
|
|
|
159 |
|
|
|
159 |
|
|
Total assets |
|
$ |
11,291 |
|
|
$ |
11,343 |
|
|
$ |
11,711 |
|
|
Third-party debt |
|
$ |
2,628 |
|
|
$ |
2,640 |
|
|
$ |
2,763 |
|
|
Total liabilities |
|
$ |
3,620 |
|
|
$ |
3,584 |
|
|
$ |
3,743 |
|
|
Our investment balance (1) (3) (4) |
|
$ |
2,565 |
|
|
$ |
2,707 |
|
|
$ |
2,796 |
|
|
Our weighted average ownership (2) (3) |
|
|
36.3 |
% |
|
|
38.9 |
% |
|
|
39.5 |
% |
|
Asia: |
|
|
|
|
|
|
|
|
|
|
|
|
|
Number of ventures |
|
|
2 |
|
|
|
2 |
|
|
|
2 |
|
|
Number of properties owned |
|
|
79 |
|
|
|
66 |
|
|
|
57 |
|
|
Square feet |
|
|
34 |
|
|
|
29 |
|
|
|
27 |
|
|
Total assets |
|
$ |
5,439 |
|
|
$ |
4,320 |
|
|
$ |
4,234 |
|
|
Third-party debt |
|
$ |
2,004 |
|
|
$ |
1,520 |
|
|
$ |
1,733 |
|
|
Total liabilities |
|
$ |
2,313 |
|
|
$ |
1,751 |
|
|
$ |
1,955 |
|
|
Our investment balance (1) |
|
$ |
493 |
|
|
$ |
402 |
|
|
$ |
355 |
|
|
Our weighted average ownership (2) |
|
|
15.0 |
% |
|
|
15.0 |
% |
|
|
15.0 |
% |
|
Total: |
|
|
|
|
|
|
|
|
|
|
|
|
|
Number of ventures |
|
|
9 |
|
|
|
9 |
|
|
|
9 |
|
|
Number of properties owned |
|
|
1,348 |
|
|
|
1,350 |
|
|
|
1,342 |
|
|
Square feet |
|
|
284 |
|
|
|
277 |
|
|
|
275 |
|
|
Total assets |
|
$ |
23,576 |
|
|
$ |
22,553 |
|
|
$ |
22,811 |
|
|
Third-party debt |
|
$ |
6,724 |
|
|
$ |
6,250 |
|
|
$ |
6,517 |
|
|
Total liabilities |
|
$ |
8,196 |
|
|
$ |
7,593 |
|
|
$ |
7,860 |
|
|
Our investment balance (1) |
|
$ |
4,423 |
|
|
$ |
4,585 |
|
|
$ |
4,631 |
|
|
Our weighted average ownership (2) |
|
|
28.9 |
% |
|
|
31.6 |
% |
|
|
32.1 |
% |
14
|
|
|
Three Months Ended September 30, |
|
|
Nine Months Ended September 30, |
|
||||||||||
|
(in thousands) |
|
2016 |
|
|
2015 |
|
|
2016 |
|
|
2015 |
|
||||
|
U.S.: |
|
|
|
|
|
|
|
|
|
|
|
|
|
|
|
|
|
Revenues |
|
$ |
99,598 |
|
|
$ |
97,144 |
|
|
$ |
295,568 |
|
|
$ |
284,514 |
|
|
Net earnings |
|
$ |
11,128 |
|
|
$ |
14,056 |
|
|
$ |
46,988 |
|
|
$ |
19,859 |
|
|
Other Americas: |
|
|
|
|
|
|
|
|
|
|
|
|
|
|
|
|
|
Revenues |
|
$ |
62,557 |
|
|
$ |
55,052 |
|
|
$ |
178,640 |
|
|
$ |
172,534 |
|
|
Net earnings |
|
$ |
20,157 |
|
|
$ |
19,505 |
|
|
$ |
53,506 |
|
|
$ |
57,747 |
|
|
Europe: |
|
|
|
|
|
|
|
|
|
|
|
|
|
|
|
|
|
Revenues |
|
$ |
232,853 |
|
|
$ |
237,914 |
|
|
$ |
724,436 |
|
|
$ |
702,772 |
|
|
Net earnings |
|
$ |
76,382 |
|
|
$ |
50,504 |
|
|
$ |
217,781 |
|
|
$ |
168,947 |
|
|
Asia: |
|
|
|
|
|
|
|
|
|
|
|
|
|
|
|
|
|
Revenues |
|
$ |
91,047 |
|
|
$ |
68,451 |
|
|
$ |
253,309 |
|
|
$ |
204,629 |
|
|
Net earnings |
|
$ |
29,930 |
|
|
$ |
10,097 |
|
|
$ |
73,779 |
|
|
$ |
55,717 |
|
|
Total: |
|
|
|
|
|
|
|
|
|
|
|
|
|
|
|
|
|
Revenues |
|
$ |
486,055 |
|
|
$ |
458,561 |
|
|
$ |
1,451,953 |
|
|
$ |
1,364,449 |
|
|
Net earnings |
|
$ |
137,597 |
|
|
$ |
94,162 |
|
|
$ |
392,054 |
|
|
$ |
302,270 |
|
|
(1) |
The difference between our ownership interest of a venture’s equity and our investment balance, at September 30, 2016, and December 31, 2015, results principally from three types of transactions: (i) deferring a portion of the gains we recognize from a contribution of a property to a venture ($444.4 million and $430.7 million, respectively); (ii) recording additional costs associated with our investment in a venture ($123.9 million and $122.1 million, respectively); and (iii) advances to a venture ($256.9 million and $189.7 million, respectively). Included in the advances to our ventures at September 30, 2016, and December 31, 2015, were receivables from Nippon Prologis REIT, Inc. (“NPR”) of $110.6 million and $85.2 million, respectively, related to customer security deposits that originated through a leasing company owned by us that pertain to properties owned by NPR. We have a corresponding payable to NPR’s customers in Other Liabilities. |
|
(2) |
Represents our weighted average ownership interest in all co-investment ventures based on each entity’s contribution of total assets, before depreciation, net of other liabilities. |
|
(3) |
In April 2016, we redeemed a portion of our investment in PTELF and Prologis Targeted U.S. Logistics Fund (“USLF”) for €185.0 million ($210.6 million) and $200.0 million, respectively, and recorded a gain of $86.6 million, which is included in Gains on the Dispositions of Investments in Real Estate, Net. The amounts received for the redemptions were included in Return of Investment from Unconsolidated Entities in the Consolidated Financial Statements of Cash Flows. In October 2016, we redeemed an additional portion of our investment in PTELF and USLF for €90.0 million ($100.3 million) and $100 million, respectively. Following these transactions, our ownership percentage decreased to 22.2% and 14.9% in PTELF and USLF, respectively. |
|
(4) |
At September 30, 2016, we had $95.8 million of receivables associated with the promotes discussed above, including $57.0 million from the third party investors in PEP II. |
Equity Commitments Related to Certain Unconsolidated Co-Investment Ventures
The following table summarizes the remaining equity commitments at September 30, 2016 (in millions):
|
|
|
Equity Commitments |
|
|
Expiration Date for Remaining Commitments |
|||||||||
|
|
|
Prologis |
|
|
Venture Partners |
|
|
Total |
|
|
|
|||
|
Prologis Targeted U.S. Logistics Fund |
|
$ |
- |
|
|
$ |
219 |
|
|
$ |
219 |
|
|
2016 - 2017 |
|
Prologis Targeted Europe Logistics Fund (1) |
|
|
- |
|
|
|
478 |
|
|
|
478 |
|
|
2016 - 2017 |
|
Prologis China Logistics Venture (2) |
|
|
299 |
|
|
|
1,697 |
|
|
|
1,996 |
|
|
2016 - 2017 |
|
Totals |
|
$ |
299 |
|
|
$ |
2,394 |
|
|
$ |
2,693 |
|
|
|
|
(1) |
Equity commitments are denominated in euro and reported in U.S. dollars based on an exchange rate of $1.12 U.S. dollars to the euro. |
|
(2) |
In January 2016, we reached an agreement with our partner in this venture to increase the equity commitments by $882.4 million, of which our share is $132.4 million, to fund future developments in China. |
During the first quarter of 2016, we satisfied our remaining commitment to Prologis European Logistics Partners with the contribution of $46.9 million for the repayment of third-party debt by the venture.
15
NOTE 5. ASSETS HELD FOR SALE OR CONTRIBUTION
We classified our investments in certain real estate properties that met the criteria to be classified as assets held for sale or contribution at September 30, 2016, and December 31, 2015. These properties are expected to be sold to third parties or contributed to unconsolidated co-investment ventures within twelve months of classification as such. The amounts included in Assets Held for Sale or Contribution represented real estate investment balances and the related assets and liabilities for each property.
Assets held for sale or contribution consisted of the following (dollars and square feet in thousands):
|
|
|
September 30, |
|
|
December 31, |
|
||
|
|
|
2016 |
|
|
2015 |
|
||
|
Number of operating properties |
|
|
18 |
|
|
|
17 |
|
|
Square feet |
|
|
6,191 |
|
|
|
5,065 |
|
|
Total assets held for sale or contribution |
|
$ |
450,349 |
|
|
$ |
378,423 |
|
|
Total liabilities associated with assets held for sale or contribution – included in Other Liabilities |
|
$ |
4,693 |
|
|
$ |
6,874 |
|
NOTE 6. NOTES RECEIVABLE BACKED BY REAL ESTATE
During 2016, $201.3 million of notes backed by real estate and all of the associated accrued interest were paid in full. At September 30, 2016, we had $33.8 million of notes backed by real estate received in connection with the disposition of real estate to a third party. We earn interest on the notes at annual rates ranging from 5.5% to 10.0%. The notes have maturity dates ranging from December 2016 to April 2017.
All debt is incurred by the Operating Partnership. The Parent does not have any indebtedness, but guarantees the unsecured debt of the Operating Partnership.
The following table summarizes our debt (dollars in thousands):
|
|
|
September 30, 2016 |
|
|
December 31, 2015 |
|
||||||||||
|
|
|
Weighted Average Interest Rate (1) |
|
|
Amount Outstanding (2) |
|
|
Weighted Average Interest Rate (1) |
|
|
Amount Outstanding |
|
||||
|
Credit facilities |
|
|
- |
|
|
$ |
- |
|
|
|
- |
|
|
$ |
- |
|
|
Senior notes |
|
|
3.3 |
% |
|
|
6,625,291 |
|
|
|
3.3 |
% |
|
|
6,516,392 |
|
|
Term loans |
|
|
1.5 |
% |
|
|
1,876,600 |
|
|
|
2.1 |
% |
|
|
2,100,009 |
|
|
Unsecured other |
|
|
6.2 |
% |
|
|
14,911 |
|
|
|
6.2 |
% |
|
|
15,448 |
|
|
Secured mortgages |
|
|
4.6 |
% |
|
|
1,053,742 |
|
|
|
5.1 |
% |
|
|
1,172,473 |
|
|
Secured mortgages of consolidated entities |
|
|
3.0 |
% |
|
|
1,686,453 |
|
|
|
2.9 |
% |
|
|
1,822,509 |
|
|
Totals |
|
|
3.1 |
% |
|
$ |
11,256,997 |
|
|
|
3.2 |
% |
|
$ |
11,626,831 |
|
|
(1) |
The interest rates presented represent the effective interest rates (including amortization of debt issuance costs and the noncash premiums or discounts) at the end of the period for debt outstanding. |
|
(2) |
Included in the outstanding balances are borrowings denominated in non-U.S. dollars, principally: euro ($3.5 billion), Japanese yen ($1.5 billion) and Canadian dollars ($429.2 million). |
Credit Facilities
We have a global senior credit facility (the “Global Facility”), under which we may draw in U.S. dollars, euro, Japanese yen, British pounds sterling and Canadian dollars on a revolving basis. In April 2016, we renewed and amended the Global Facility to increase our availability from $2.3 billion to $3.0 billion (subject to currency fluctuations). We have the ability to increase the Global Facility to $3.75 billion, subject to currency fluctuations and obtaining additional lender commitments. Pricing under the Global Facility, including the spread over LIBOR, facility fees and letter of credit fees, varies based on the public debt ratings of the Operating Partnership. The amended Global Facility is scheduled to mature in April 2020; however, we may extend the maturity date for six months on two occasions, subject to the satisfaction of certain conditions and payment of extension fees.
We also have a ¥45 billion ($444.1 million at September 30, 2016) Japanese yen revolver (the “Revolver”) with availability to increase to ¥56.5 billion ($557.6 million at September 30, 2016), subject to obtaining additional lender commitments. Pricing under the Revolver, including the spread over LIBOR, facility fees and letter of credit fees, varies based on the public debt ratings of the Operating Partnership.
16
We refer to the Global Facility and the Revolver, collectively, as our “Credit Facilities.”
The following table summarizes information about our Credit Facilities at September 30, 2016 (in thousands):
|
Aggregate lender commitments |
|
$ |
3,472,147 |
|
|
Less: |
|
|
|
|
|
Borrowings outstanding |
|
|
- |
|
|
Outstanding letters of credit |
|
|
38,849 |
|
|
Current availability |
|
$ |
3,433,298 |
|
Term Loans
In March 2016, we entered into an unsecured senior term loan agreement (the “2016 Yen Term Loan”) under which we could draw in Japanese yen in an aggregate amount not to exceed ¥11.2 billion and was scheduled to mature in March 2017. In the first quarter of 2016, we borrowed ¥11.2 billion ($99.6 million).
In August 2016, we entered into an unsecured senior term loan agreement (the “Yen Term Loan”) under which we can draw in Japanese yen in an aggregate amount not to exceed ¥120.0 billion ($1.2 billion at September 30, 2016). The Yen Term Loan has two tranches, a ¥50.0 billion tranche and ¥70.0 billion tranche, both bearing interest at yen LIBOR plus 0.65% and scheduled to mature in August 2022 and August 2023, respectively. We may increase the borrowings up to ¥200.0 billion ($2.0 billion at September 30, 2016), subject to obtaining additional lender commitments. In the third quarter of 2016, we borrowed on the Yen Term Loan and used the proceeds to repay and cancel the previous outstanding Japanese yen term loans entered into in 2014 and 2015 and the 2016 Yen Term Loan. The Yen Term Loan was fully drawn at September 30, 2016.
Long-Term Debt Maturities
Principal payments due on our debt, for the remainder of 2016 and for each of the years in the period ending December 31, 2025, and thereafter were as follows at September 30, 2016 (in thousands):
|
|
Unsecured |
|
|
|
|
|
|
|
|||||||||||
|
|
Credit |
|
|
Senior |
|
|
Term Loans and |
|
|
Secured Mortgage |
|
|
|
|
|
||||
|
Maturity |
Facilities |
|
|
Notes |
|
|
Other |
|
|
Debt |
|
|
Total |
|
|||||
|
2016 (1) |
$ |
- |
|
|
$ |
- |
|
|
$ |
406 |
|
|
$ |
15,002 |
|
|
$ |
15,408 |
|
|
2017 (1) (2) |
|
- |
|
|
|
- |
|
|
|
422,725 |
|
|
|
443,564 |
|
|
|
866,289 |
|
|
2018 |
|
- |
|
|
|
175,000 |
|
|
|
915 |
|
|
|
569,978 |
|
|
|
745,893 |
|
|
2019 |
|
- |
|
|
|
618,294 |
|
|
|
990 |
|
|
|
462,990 |
|
|
|
1,082,274 |
|
|
2020 |
|
- |
|
|
|
881,541 |
|
|
|
1,014 |
|
|
|
455,259 |
|
|
|
1,337,814 |
|
|
2021 |
|
- |
|
|
|
1,281,270 |
|
|
|
1,086 |
|
|
|
141,606 |
|
|
|
1,423,962 |
|
|
2022 |
|
- |
|
|
|
781,270 |
|
|
|
494,181 |
|
|
|
163,230 |
|
|
|
1,438,681 |
|
|
2023 |
|
- |
|
|
|
850,000 |
|
|
|
968,795 |
|
|
|
174,681 |
|
|
|
1,993,476 |
|
|
2024 |
|
- |
|
|
|
781,270 |
|
|
|
864 |
|
|
|
133,413 |
|
|
|
915,547 |
|
|
2025 |
|
- |
|
|
|
750,000 |
|
|
|
938 |
|
|
|
137,746 |
|
|
|
888,684 |
|
|
Thereafter |
|
- |
|
|
|
558,050 |
|
|
|
11,749 |
|
|
|
2,381 |
|
|
|
572,180 |
|
|
Subtotal |
|
- |
|
|
|
6,676,695 |
|
|
|
1,903,663 |
|
|
|
2,699,850 |
|
|
|
11,280,208 |
|
|
Unamortized premiums (discounts), net |
|
- |
|
|
|
(21,324 |
) |
|
|
- |
|
|
|
50,544 |
|
|
|
29,220 |
|
|
Unamortized debt issuance costs, net |
|
- |
|
|
|
(30,080 |
) |
|
|
(12,152 |
) |
|
|
(10,199 |
) |
|
|
(52,431 |
) |
|
Totals |
$ |
- |
|
|
$ |
6,625,291 |
|
|
$ |
1,891,511 |
|
|
$ |
2,740,195 |
|
|
$ |
11,256,997 |
|
|
(1) |
We expect to repay the amounts maturing in 2016 and 2017 with cash generated from operations, proceeds from the dispositions of wholly owned real estate properties or, as necessary, with borrowings on our Credit Facilities. |
|
(2) |
Included in the 2017 maturities is a term loan that can be extended until 2019. |
Exchangeable Senior Notes
During March 2015, the holders of exchangeable notes exchanged $459.8 million of their notes for 11.9 million shares of common stock of the Parent and $0.2 million of their notes for cash. When the debt was exchanged into common stock, the value of the derivative associated with the debt was reclassified to Additional Paid-In Capital. We recognized unrealized gains of $8.3 million during the first quarter of 2015 on the change in fair value of the derivative instrument associated with the exchangeable debt.
17
We have approximately $6.6 billion of senior notes and $1.9 billion of term loans outstanding at September 30, 2016, under three separate indentures, as supplemented, and are subject to certain financial covenants. We are also subject to financial covenants under our Credit Facilities and certain secured mortgage debt. At September 30, 2016, we were in compliance with all covenants.
NOTE 8. NONCONTROLLING INTERESTS
Prologis, L.P.
We report noncontrolling interests related to several entities we consolidate but of which we do not own 100% of the equity. These entities include two real estate partnerships that have issued limited partnership units to third parties. Depending on the specific partnership agreements, these limited partnership units are redeemable for cash or, at our option, shares of the Parent’s common stock, generally at a rate of one share of common stock to one unit. We also consolidate several entities in which we do not own 100% of the equity and the units of the entity are not exchangeable into our common stock.
As discussed in Note 1, the Parent has complete responsibility, power and discretion in the day-to-day management of the Operating Partnership. The Parent, through its majority interest, has the right to receive benefits from and incur losses of the Operating Partnership. In addition, the Operating Partnership does not have either substantive liquidation rights or substantive kick-out rights without cause or substantive participating rights that could be exercised by a simple majority of noncontrolling interests. The absence of such rights renders the Operating Partnership as a VIE. Accordingly, the Parent is the primary beneficiary of and consolidates the Operating Partnership.
Prologis, Inc.
The noncontrolling interests of the Parent include the noncontrolling interests presented in the Operating Partnership, as well as the common limited partnership units in the Operating Partnership that are not owned by the Parent.
The following table summarizes our ownership percentages and noncontrolling interests and the consolidated entities’ total assets and liabilities at September 30, 2016, and December 31, 2015 (dollars in thousands):
|
|
Our Ownership Percentage |
|
|
Noncontrolling Interests |
|
|
Total Assets |
|
|
Total Liabilities |
|
||||||||||||||||||||
|
|
2016 |
|
|
2015 |
|
|
2016 |
|
|
2015 |
|
|
2016 |
|
|
2015 |
|
|
2016 |
|
|
2015 |
|
||||||||
|
Prologis U.S. Logistics Venture |
|
55.0 |
% |
|
|
55.0 |
% |
|
$ |
2,445,631 |
|
|
$ |
2,677,642 |
|
|
$ |
6,256,419 |
|
|
$ |
6,788,968 |
|
|
$ |
821,488 |
|
|
$ |
847,084 |
|
|
Prologis North American Industrial Fund (1) |
|
66.1 |
% |
|
|
66.1 |
% |
|
|
486,353 |
|
|
|
490,444 |
|
|
|
2,493,666 |
|
|
|
2,619,241 |
|
|
|
1,048,648 |
|
|
|
1,165,617 |
|
|
Prologis Brazil Logistics Partners Fund I (1) (2) |
|
50.0 |
% |
|
|
50.0 |
% |
|
|
60,290 |
|
|
|
49,313 |
|
|
|
137,519 |
|
|
|
100,836 |
|
|
|
633 |
|
|
|
192 |
|
|
Other consolidated entities (3) |
various |
|
|
various |
|
|
|
100,714 |
|
|
|
102,828 |
|
|
|
876,317 |
|
|
|
985,188 |
|
|
|
35,879 |
|
|
|
42,811 |
|
||
|
Prologis, L.P. noncontrolling interests |
|
|
|
|
|
|
|
|
|
3,092,988 |
|
|
|
3,320,227 |
|
|
|
9,763,921 |
|
|
|
10,494,233 |
|
|
|
1,906,648 |
|
|
|
2,055,704 |
|
|
Limited partners in Prologis, L.P. (4) (5) |
|
|
|
|
|
|
|
|
|
391,115 |
|
|
|
432,674 |
|
|
|
- |
|
|
|
- |
|
|
|
- |
|
|
|
- |
|
|
Prologis, Inc. noncontrolling interests |
|
|
|
|
|
|
|
|
$ |
3,484,103 |
|
|
$ |
3,752,901 |
|
|
$ |
9,763,921 |
|
|
$ |
10,494,233 |
|
|
$ |
1,906,648 |
|
|
$ |
2,055,704 |
|
|
(1) |
These ventures are considered VIE’s under the new consolidation guidance discussed in Note 1. Based on our evaluation, the noncontrolling interests in these ventures do not hold substantive participating or kick-out rights and therefore as a group they lack the power to direct the significant activities of these ventures that most significantly impact the venture’s economic performance. We have both the power to direct the significant activities and the obligation to absorb losses and the rights to receive benefits from these ventures. As a result, we are the primary beneficiary of both ventures and consistent with prior reporting periods, we consolidate each venture within our financial statements. |
|
(2) |
The assets of Prologis Brazil Logistics Partners Fund I (“Brazil Fund”) are primarily investments in unconsolidated entities of $118.8 million and $103.1 million at September 30, 2016, and December 31, 2015, respectively. For additional information on our unconsolidated investments, see Note 4. |
|
(3) |
This line item includes our two partnerships that have issued limited partnership units to third parties, as discussed above, along with various other consolidated entities. At September 30, 2016, and December 31, 2015, limited partnership units were exchangeable into cash or, at our option, 1.8 million shares of the Parent’s common stock. |
|
(4) |
We had 8.9 million Class A Units that were convertible into 8.7 million and 8.8 million common limited partnership units of the Operating Partnership at September 30, 2016, and December 31, 2015, respectively. |
18
NOTE 9. LONG-TERM COMPENSATION
Prologis Outperformance Plan (“POP” formerly “OPP”)
Generally, under the POP, in the event that our annualized total stockholder return (“TSR”) during the performance period exceeds the annualized total shareholder return of the Morgan Stanley Capital Index US REIT Index (“RMS”) by more than 100 basis points during the performance period, then a performance pool will be formed under the POP equal to 3% of our excess return to stockholders. The performance pool shall not exceed an amount equal to the greater of (i) $75,000,000 or (ii) 0.5% of our common equity market capitalization as calculated under the POP (the “Capitalization Cap”).
Starting with the 2016 – 2018 performance period, if the relevant performance thresholds are met, participants can earn POP awards for their share of an aggregate performance pool up to $75,000,000. If earned, these POP awards will be paid after the end of the initial three-year performance period. If our levels of outperformance warrant an aggregate performance pool greater than $75,000,000, then participants can earn their share of the additional award amount in excess of $75,000,000 up to the Capitalization Cap (the “Excess Award Amount”) during the course of a three-year period after the end of the initial performance period. One-third of this Excess Award Amount can be earned at the end of each of the three years after the initial performance period, if our performance meets or exceeds the RMS in each of such three years.
POP also has certain positive TSR requirements, which must be met before participants can be paid awards under POP. In addition, participants will not be able to sell or transfer any equity they receive as initial or excess POP awards until three years after the end of the initial performance period. If the performance criteria are not met, the POP participation points and the POP LTIP Units will be forfeited.
Allocations of POP participation points for the 2016 – 2018 performance period were approved on June 3, 2016 and will be subject to certain modifications to the POP, as discussed above. We anticipate that the POP LTIP Units will be granted in the fourth quarter of 2016. The fair value of the award was $26.6 million at June 3, 2016, using a Monte Carlo valuation model that assumed a risk free interest rate of 0.99% and an expected volatility of 20.5%. Such points relate to a three-year performance period that began on January 1, 2016, and will end on December 31, 2018. At September 30, 2016, we also have POP points outstanding for the 2014 – 2016 and 2015 – 2017 performance periods under the POP that were not impacted by the modification.
Prologis Promote Plan (“PPP”)
A compensation pool was funded in 2015 associated with promotes earned from two of our co-investment ventures in the fourth quarter of 2015, at which time we accrued $4.7 million for the cash awards. In 2016, we granted 53,000 RSUs with a grant date fair value of $2.3 million and 114,000 LTIP Units with a grant date fair value of $4.9 million related to these promotes.
A compensation pool was funded associated with promotes earned from two of our co-investment ventures in the third quarter of 2016, at which time we accrued $15.2 million in cash awards.
Restricted Stock Units (“RSUs”)
The following table summarizes the activity for RSUs for the nine months ended September 30, 2016 (units in thousands):
|
|
|
Number of |
|
|
Weighted Average |
|
|
Number of |
|
|||
|
|
|
RSUs |
|
|
Grant-Date Fair Value |
|
|
RSUs Vested |
|
|||
|
Balance at January 1, 2016 |
|
|
1,626 |
|
|
$ |
42.21 |
|
|
|
109 |
|
|
Granted |
|
|
806 |
|
|
|
|
|
|
|
|
|
|
Vested and distributed |
|
|
(804 |
) |
|
|
|
|
|
|
|
|
|
Forfeited |
|
|
(36 |
) |
|
|
|
|
|
|
|
|
|
Balance at September 30, 2016 |
|
|
1,592 |
|
|
$ |
40.37 |
|
|
|
125 |
|
19
Operating Partnership Long-Term Incentive Plan Units (“LTIP Units”)
The following table summarizes the activity for LTIP Units for the nine months ended September 30, 2016 (units in thousands):
|
|
|
Number of |
|
|
Weighted Average |
|
|
Number of |
|
|||
|
|
|
LTIP Units |
|
|
Grant-Date Fair Value |
|
|
LTIP Units Vested |
|
|||
|
Balance at January 1, 2016 |
|
|
1,244 |
|
|
$ |
42.21 |
|
|
|
303 |
|
|
Granted |
|
|
893 |
|
|
|
|
|
|
|
|
|
|
Balance at September 30, 2016 |
|
|
2,137 |
|
|
$ |
40.45 |
|
|
|
743 |
|
|
|
|
|
|
|
|
|
|
|
|
|
|
|
Prologis Outperformance Plan Operating Partnership Long-Term Incentive Plan Units (“POP LTIP Units” formerly “OPP LTIP Units”)
At September 30, 2016, 2.5 million POP LTIP Units were outstanding with respect to the 2014 – 2016 and 2015 – 2017 performance periods. The following table summarizes the activity for the POP LTIP Units for the nine months ended September 30, 2016 (units in thousands):
|
|
|
Number of POP |
|
|
|
|
|
LTIP Units |
|
|
|
Balance at January 1, 2016 |
|
|
3,464 |
|
|
Forfeited |
|
|
(927 |
) |
|
Balance at September 30, 2016 |
|
|
2,537 |
|
Stock Options
We have 2.2 million stock options outstanding and exercisable at September 30, 2016, with a weighted average exercise price of $38.54. The aggregate intrinsic value of exercised options was $43.9 million and $6.0 million for the nine months ended September 30, 2016 and 2015, respectively. No stock options were granted in 2016 or 2015.
NOTE 10. EARNINGS PER COMMON SHARE OR UNIT
We determine basic earnings per share or unit based on the weighted average number of shares of common stock or units outstanding during the period. We compute diluted earnings per share or unit based on the weighted average number of shares or units outstanding combined with the incremental weighted average effect from all outstanding potentially dilutive instruments.
The computation of our basic and diluted earnings per share and unit (in thousands, except per share and unit amounts) is as follows:
|
|
|
Three Months Ended |
|
|
Nine Months Ended |
|
||||||||||
|
|
|
September 30, |
|
|
September 30, |
|
||||||||||
|
Prologis, Inc. |
|
2016 |
|
|
2015 |
|
|
2016 |
|
|
2015 |
|
||||
|
Net earnings attributable to common stockholders – Basic |
|
$ |
279,255 |
|
|
$ |
258,979 |
|
|
$ |
762,679 |
|
|
$ |
744,425 |
|
|
Net earnings attributable to exchangeable limited partnership units (1) |
|
|
7,713 |
|
|
|
3,203 |
|
|
|
24,479 |
|
|
|
7,331 |
|
|
Gains, net of expenses, associated with exchangeable debt assumed exchanged (2) |
|
|
- |
|
|
|
- |
|
|
|
- |
|
|
|
(1,614 |
) |
|
Adjusted net earnings attributable to common stockholders – Diluted |
|
$ |
286,968 |
|
|
$ |
262,182 |
|
|
$ |
787,158 |
|
|
$ |
750,142 |
|
|
|
|
|
|
|
|
|
|
|
|
|
|
|
|
|
|
|
|
Weighted average common shares outstanding – Basic |
|
|
527,288 |
|
|
|
523,528 |
|
|
|
525,462 |
|
|
|
520,388 |
|
|
Incremental weighted average effect on exchange of limited partnership units (1) |
|
|
14,568 |
|
|
|
6,685 |
|
|
|
17,156 |
|
|
|
5,875 |
|
|
Incremental weighted average effect of equity awards |
|
|
5,344 |
|
|
|
1,860 |
|
|
|
2,610 |
|
|
|
1,953 |
|
|
Incremental weighted average effect on exchangeable debt assumed exchanged (2) |
|
|
- |
|
|
|
- |
|
|
|
- |
|
|
|
2,905 |
|
|
Weighted average common shares outstanding – Diluted (3) |
|
|
547,200 |
|
|
|
532,073 |
|
|
|
545,228 |
|
|
|
531,121 |
|
|
|
|
|
|
|
|
|
|
|
|
|
|
|
|
|
|
|
|
Net earnings per share attributable to common stockholders: |
|
|
|
|
|
|
|
|
|
|
|
|
|
|
|
|
|
Basic |
|
$ |
0.53 |
|
|
$ |
0.49 |
|
|
$ |
1.45 |
|
|
$ |
1.43 |
|
|
Diluted |
|
$ |
0.52 |
|
|
$ |
0.49 |
|
|
$ |
1.44 |
|
|
$ |
1.41 |
|
20
|
|
Three Months Ended |
|
|
Nine Months Ended |
|
|||||||||||
|
|
|
September 30, |
|
|
September 30, |
|
||||||||||
|
Prologis, L.P. |
|
2016 |
|
|
2015 |
|
|
2016 |
|
|
2015 |
|
||||
|
Net earnings attributable to common unitholders |
|
$ |
286,943 |
|
|
$ |
262,155 |
|
|
$ |
784,917 |
|
|
$ |
750,181 |
|
|
Net earnings attributable to Class A convertible common unitholders |
|
|
(4,641 |
) |
|
|
- |
|
|
|
(12,769 |
) |
|
|
- |
|
|
Net earnings attributable to common unitholders – Basic |
|
$ |
282,302 |
|
|
$ |
262,155 |
|
|
$ |
772,148 |
|
|
$ |
750,181 |
|
|
Net earnings attributable to Class A convertible common unitholders |
|
|
4,641 |
|
|
|
- |
|
|
|
12,769 |
|
|
|
- |
|
|
Net earnings attributable to exchangeable limited partnership units |
|
|
25 |
|
|
|
27 |
|
|
|
2,241 |
|
|
|
1,575 |
|
|
Gains, net of expenses, associated with exchangeable debt assumed exchanged (2) |
|
|
- |
|
|
|
- |
|
|
|
- |
|
|
|
(1,614 |
) |
|
Adjusted net earnings attributable to common unitholders – Diluted |
|
$ |
286,968 |
|
|
$ |
262,182 |
|
|
$ |
787,158 |
|
|
$ |
750,142 |
|
|
|
|
|
|
|
|
|
|
|
|
|
|
|
|
|
|
|
|
Weighted average common partnership units outstanding – Basic |
|
|
532,934 |
|
|
|
530,044 |
|
|
|
531,985 |
|
|
|
524,411 |
|
|
Incremental weighted average effect on exchange of Class A convertible units |
|
|
8,753 |
|
|
|
- |
|
|
|
8,798 |
|
|
|
- |
|
|
Incremental weighted average effect on exchange of limited partnership units |
|
|
169 |
|
|
|
169 |
|
|
|
1,835 |
|
|
|
1,852 |
|
|
Incremental weighted average effect of equity awards of Prologis, Inc. |
|
|
5,344 |
|
|
|
1,860 |
|
|
|
2,610 |
|
|
|
1,953 |
|
|
Incremental weighted average effect on exchangeable debt assumed exchanged (2) |
|
|
- |
|
|
|
- |
|
|
|
- |
|
|
|
2,905 |
|
|
Weighted average common partnership units outstanding – Diluted (3) |
|
|
547,200 |
|
|
|
532,073 |
|
|
|
545,228 |
|
|
|
531,121 |
|
|
|
|
|
|
|
|
|
|
|
|
|
|
|
|
|
|
|
|
Net earnings per unit attributable to common unitholders: |
|
|
|
|
|
|
|
|
|
|
|
|
|
|
|
|
|
Basic |
|
$ |
0.53 |
|
|
$ |
0.49 |
|
|
$ |
1.45 |
|
|
$ |
1.43 |
|
|
Diluted |
|
$ |
0.52 |
|
|
$ |
0.49 |
|
|
$ |
1.44 |
|
|
$ |
1.41 |
|
|
(1) |
Earnings allocated to the exchangeable Operating Partnership units not held by the Parent has been included in the numerator and exchangeable Operating Partnership units have been included in the denominator for the purpose of computing diluted earnings per share for all periods as the per share and unit amount is the same. |
|
(2) |
In March 2015, we had exchangeable debt that was settled primarily through the issuance of common stock. The adjustment in 2015 assumes the exchange occurred on January 1, 2015. |
|
(3) |
Our total potentially dilutive shares and units outstanding consisted of the following: |
|
|
|
|
Three Months Ended |
|
|
Nine Months Ended |
|
||||||||||
|
|
|
|
September 30, |
|
|
September 30, |
|
||||||||||
|
|
|
|
2016 |
|
|
2015 |
|
|
2016 |
|
|
2015 |
|
||||
|
|
Total weighted average potentially dilutive limited partnership units |
|
|
10,587 |
|
|
|
1,835 |
|
|
|
10,633 |
|
|
|
1,852 |
|
|
|
Total potentially dilutive stock awards |
|
|
9,220 |
|
|
|
7,359 |
|
|
|
7,783 |
|
|
|
7,392 |
|
|
|
Total weighted average potentially dilutive shares and units from exchangeable debt |
|
|
- |
|
|
|
- |
|
|
|
- |
|
|
|
2,905 |
|
|
|
Total Prologis, L.P. |
|
|
19,807 |
|
|
|
9,194 |
|
|
|
18,416 |
|
|
|
12,149 |
|
|
|
Limited partners in Prologis, L.P. |
|
|
5,646 |
|
|
|
6,516 |
|
|
|
6,523 |
|
|
|
4,023 |
|
|
|
Total Prologis, Inc. |
|
|
25,453 |
|
|
|
15,710 |
|
|
|
24,939 |
|
|
|
16,172 |
|
NOTE 11. FINANCIAL INSTRUMENTS AND FAIR VALUE MEASUREMENTS
Derivative Financial Instruments
In the normal course of business, our operations are exposed to global market risks, including the effect of changes in foreign currency exchange rates and interest rates. To manage these risks, we may enter into various derivative contracts, such as foreign currency contracts to manage foreign currency exposure, and interest rate swaps to manage the effect of interest rate fluctuations. We do not use derivative financial instruments for trading or speculative purposes. All of our derivative financial instruments are customized derivative transactions and are not exchange-traded. Management reviews our hedging program, derivative positions and overall risk management strategy on a regular basis. We enter into only those transactions we believe will be highly effective at offsetting the underlying risk. There have been no significant changes in our policy or strategy from what was disclosed in our Annual Report on Form 10-K for the fiscal year ended December 31, 2015.
21
The following table presents the fair value and classification of our derivative instruments (in thousands):
|
|
|
September 30, 2016 |
|
|
December 31, 2015 |
|
||||||||||
|
|
|
Asset |
|
|
Liability |
|
|
Asset |
|
|
Liability |
|
||||
|
Net investment hedges – Canadian dollar denominated |
|
$ |
- |
|
|
$ |
1,148 |
|
|
$ |
- |
|
|
$ |
- |
|
|
Net investment hedges – pound sterling denominated |
|
|
57,490 |
|
|
|
- |
|
|
|
33,471 |
|
|
|
- |
|
|
Cash flow hedge foreign currency options – peso denominated |
|
|
- |
|
|
|
195 |
|
|
|
- |
|
|
|
88 |
|
|
Foreign currency options – Canadian dollar denominated (1) |
|
|
559 |
|
|
|
403 |
|
|
|
3,324 |
|
|
|
- |
|
|
Foreign currency options – euro denominated (1) |
|
|
1,086 |
|
|
|
2,007 |
|
|
|
11,711 |
|
|
|
84 |
|
|
Foreign currency options – pound sterling denominated (1) |
|
|
16,024 |
|
|
|
- |
|
|
|
4,241 |
|
|
|
745 |
|
|
Foreign currency options – yen denominated (1) |
|
|
345 |
|
|
|
15,775 |
|
|
|
832 |
|
|
|
717 |
|
|
Interest rate hedges |
|
|
- |
|
|
|
8,834 |
|
|
|
- |
|
|
|
12,095 |
|
|
Total fair value of derivatives |
|
$ |
75,504 |
|
|
$ |
28,362 |
|
|
$ |
53,579 |
|
|
$ |
13,729 |
|
|
(1) |
As discussed below, these foreign currency options are not designated as hedges. |
Foreign Currency
We primarily manage our foreign currency exposure by borrowing in the currencies in which we invest. We may issue debt in a currency that is not the same functional currency of the borrowing entity to offset the translation and economic exposures related to our net investment in international subsidiaries. To mitigate the impact of the translation from the fluctuations in exchange rates, we may designate this debt as a nonderivative financial instrument hedge. We also hedge our investments in certain international subsidiaries using foreign currency derivative contracts (net investment hedges) to offset the translation and economic exposures related to our investments in these subsidiaries by locking in a forward exchange rate at the inception of the hedge. To the extent we have an effective hedging relationship, we report all changes in fair value of the hedged portion of the nonderivative financial instruments and net investment hedges in equity in the foreign currency translation component of Accumulated Other Comprehensive Loss (“AOCI” in the Consolidated Balance Sheets). These amounts offset the translation adjustments on the underlying net assets of our foreign investments, which we also record in AOCI. The changes in fair value of the portion of the nonderivative financial instruments that are not designated as hedges are recorded directly in earnings within the line item Foreign Currency and Derivative Losses, Net in the Consolidated Statements of Income. We recognize ineffectiveness, if any, in earnings at the time the ineffectiveness occurred.
We may use foreign currency option contracts, including puts, calls and collars to mitigate foreign currency exchange rate risk associated with the translation of our projected net operating income of our international subsidiaries. These are not designated as hedges as they do not meet hedge accounting requirements. Changes in the fair value of non-hedge designated derivatives are recorded directly in earnings within the line item Foreign Currency and Derivative Losses, Net. We recognized unrealized gains of $3.1 million and losses of $10.4 million, respectively, from the change in value of our outstanding foreign currency options for the three and nine months ended September 30, 2016. We recognized unrealized gains of $2.7 million and $12.2 million for the three and nine months ended September 30, 2015, respectively. We may also use foreign currency forwards designed as cash flow hedges to mitigate foreign currency exchange rate risk associated with payments in a currency that is not the functional currency of our foreign subsidiaries. To the extent we have an effective hedging relationship; we report all changes in fair value of the hedged portion of the foreign currency forwards cash flow hedges in AOCI. We recognize ineffectiveness, if any, in earnings at the time the ineffectiveness occurred. We did not record any ineffectiveness on our foreign currency derivative contracts during the three and nine months ended September 30, 2016, and 2015.
22
The following tables summarize the activity in our foreign currency contracts for the nine months ended September 30 (in millions, except for weighted average forward rates and number of active contracts):
|
2016 |
|
|
|
|
|
|
|
|
|
|
|
|
|
|
|
|
|
|
|
|
|
|
|
|
|
|
|
|
|
|
|
Foreign Currency Contracts |
|
|||||||||||||||||||||||||
|
Local Currency |
|
Net Investment Forward Contracts |
|
|
Forward and Option Contracts |
|
||||||||||||||||||||||
|
|
|
GBP |
|
|
JPY |
|
|
CAD |
|
|
EUR |
|
|
GBP (1) |
|
|
JPY |
|
|
Other |
|
|||||||
|
Notional amounts at January 1 |
|
£ |
238 |
|
|
¥ |
- |
|
|
$ |
- |
|
|
€ |
275 |
|
|
£ |
97 |
|
|
¥ |
12,840 |
|
|
|
|
|
|
New contracts |
|
|
60 |
|
|
|
11,189 |
|
|
|
133 |
|
|
|
321 |
|
|
|
- |
|
|
|
15,460 |
|
|
|
|
|
|
Matured or expired contracts |
|
|
(60 |
) |
|
|
(11,189 |
) |
|
|
- |
|
|
|
(440 |
) |
|
|
(36 |
) |
|
|
(10,940 |
) |
|
|
|
|
|
Notional amounts at September 30 |
|
£ |
238 |
|
|
¥ |
- |
|
|
$ |
133 |
|
|
€ |
156 |
|
|
£ |
61 |
|
|
¥ |
17,360 |
|
|
|
|
|
|
|
|
|
|
|
|
|
|
|
|
|
|
|
|
|
|
|
|
|
|
|
|
|
|
|
|
|
|
|
|
|
|
Foreign Currency Contracts |
|
|||||||||||||||||||||||||
|
U.S. Dollar |
|
Net Investment Forward Contracts |
|
|
Forward and Option Contracts (2) |
|
||||||||||||||||||||||
|
Notional amounts at January 1 |
|
$ |
386 |
|
|
$ |
- |
|
|
$ |
- |
|
|
$ |
310 |
|
|
$ |
148 |
|
|
$ |
109 |
|
|
$ |
50 |
|
|
New contracts |
|
|
85 |
|
|
|
99 |
|
|
|
100 |
|
|
|
359 |
|
|
|
- |
|
|
|
147 |
|
|
|
15 |
|
|
Matured or expired contracts |
|
|
(100 |
) |
|
|
(99 |
) |
|
|
- |
|
|
|
(492 |
) |
|
|
(55 |
) |
|
|
(95 |
) |
|
|
(21 |
) |
|
Notional amounts at September 30 |
|
$ |
371 |
|
|
$ |
- |
|
|
$ |
100 |
|
|
$ |
177 |
|
|
$ |
93 |
|
|
$ |
161 |
|
|
$ |
44 |
|
|
|
|
|
|
|
|
|
|
|
|
|
|
|
|
|
|
|
|
|
|
|
|
|
|
|
|
|
|
|
|
Weighted average forward rate at September 30 |
|
|
1.56 |
|
|
|
- |
|
|
|
1.33 |
|
|
|
1.14 |
|
|
|
1.53 |
|
|
|
108.64 |
|
|
|
|
|
|
Active contracts at September 30 |
|
|
3 |
|
|
|
- |
|
|
|
2 |
|
|
|
18 |
|
|
|
10 |
|
|
|
32 |
|
|
|
18 |
|
|
2015 |
|
|
|
|
|
|
|
|
|
|
|
|
|
|
|
|
|
|
|
|
|
|
|
|
|
|
|
|
|
|
|
Foreign Currency Contracts |
|
|||||||||||||||||||||||||
|
Local Currency |
|
Net Investment Forward Contracts |
|
|
Forward and Option Contracts |
|
||||||||||||||||||||||
|
|
|
EUR |
|
|
GBP |
|
|
JPY |
|
|
EUR |
|
|
GBP |
|
|
JPY |
|
|
Other |
|
|||||||
|
Notional amounts at January 1 |
|
€ |
300 |
|
|
£ |
238 |
|
|
¥ |
24,136 |
|
|
€ |
284 |
|
|
£ |
- |
|
|
¥ |
- |
|
|
|
|
|
|
New contracts |
|
|
- |
|
|
|
118 |
|
|
|
43,373 |
|
|
|
268 |
|
|
|
179 |
|
|
|
18,740 |
|
|
|
|
|
|
Matured or expired contracts |
|
|
(300 |
) |
|
|
(118 |
) |
|
|
(67,509 |
) |
|
|
(292 |
) |
|
|
(70 |
) |
|
|
(4,400 |
) |
|
|
|
|
|
Notional amounts at September 30 |
|
€ |
- |
|
|
£ |
238 |
|
|
¥ |
- |
|
|
€ |
260 |
|
|
£ |
109 |
|
|
¥ |
14,340 |
|
|
|
|
|
|
|
|
|
|
|
|
|
|
|
|
|
|
|
|
|
|
|
|
|
|
|
|
|
|
|
|
|
|
|
|
|
|
Foreign Currency Contracts |
|
|||||||||||||||||||||||||
|
U.S. Dollar |
|
Net Investment Forward Contracts |
|
|
Forward and Option Contracts (2) |
|
||||||||||||||||||||||
|
Notional amounts at January 1 |
|
$ |
400 |
|
|
$ |
400 |
|
|
$ |
250 |
|
|
$ |
354 |
|
|
$ |
- |
|
|
$ |
- |
|
|
$ |
- |
|
|
New contracts |
|
|
- |
|
|
|
186 |
|
|
|
353 |
|
|
|
303 |
|
|
|
269 |
|
|
|
159 |
|
|
|
63 |
|
|
Matured or expired contracts |
|
|
(400 |
) |
|
|
(200 |
) |
|
|
(603 |
) |
|
|
(358 |
) |
|
|
(104 |
) |
|
|
(38 |
) |
|
|
(13 |
) |
|
Notional amounts at September 30 |
|
$ |
- |
|
|
$ |
386 |
|
|
$ |
- |
|
|
$ |
299 |
|
|
$ |
165 |
|
|
$ |
121 |
|
|
$ |
50 |
|
|
(1) |
Included in our British pounds sterling denominated option contracts is one forward contract to sell British pounds sterling and buy euros. This forward has a notional amount of £6.0 million (€8.0 million) and was reported in this table using an exchange rate of $1.45 U.S. dollars to the euro. |
|
(2) |
During the nine months ended September 30, 2016, and 2015, we exercised 41 and 23 option contracts, respectively. We realized losses of $3.1 million and $1.2 million for the three and nine months ended September 30, 2016, respectively, and gains of $3.4 million and $9.6 million for the three and nine months ended September 30, 2015, respectively, in Foreign Currency and Derivative Losses, Net. |
Interest Rate
We may enter into interest rate swap agreements, which allow us to borrow on a fixed rate basis for longer-term debt issuances, or interest rate cap agreements, which allow us to minimize the impact of increases in interest rates. We may also enter into interest rate swap agreements that allow us to receive variable-rate amounts from a counterparty in exchange for us making fixed-rate payments over the life of our agreements without the exchange of the underlying notional amount.
We report the effective portion of the gain or loss on the derivative as a component of AOCI and reclassify it to Interest Expense over the corresponding period of the hedged item. We recognize losses on a derivative representing hedge ineffectiveness in Interest Expense at the time the ineffectiveness occurred. During the three and nine months ended September 30, 2016, and 2015, we had no significant losses due to hedge ineffectiveness.
23
The following table summarizes activity in our interest rate swaps for the nine months ended September 30 (in millions, except for the number of active contracts):
|
|
|
2016 (1) |
|
|
2015 |
|
||
|
Notional amounts at January 1 |
|
$ |
1,434 |
|
|
$ |
398 |
|
|
New contracts |
|
|
- |
|
|
|
886 |
|
|
Matured or expired contracts |
|
|
(925 |
) |
|
|
- |
|
|
Notional amounts at September 30 |
|
$ |
509 |
|
|
$ |
1,284 |
|
|
(1) |
We had three interest rate swap hedges outstanding at September 30, 2016. |
During the nine months ended September 30, 2015, we entered into two contracts with an aggregated notional amount of $526.3 million to effectively fix the interest rate on our 2015 Japanese yen term loan and we entered into two contracts with an aggregated notional amount of $360.0 million to effectively fix the interest rate at the three month LIBOR rate of 2.3% on expected future debt issuances.
In January 2016, the Bank of Japan introduced negative interest rates. As a result, our two Japanese yen denominated interest rate hedges related to the 2015 Japan term loan no longer qualified for hedge accounting due to a zero percent floor mismatch in the hedging relationship. These interest rate hedges were designated as cash flow hedges at December 31, 2015, and the change in fair value was recorded in Other Comprehensive Income. We began recording the change in fair value of these interest rate hedges to the Consolidated Statements of Income when the hedges no longer qualified for hedge accounting.
In August 2016, we entered into the Yen Term Loan and repaid our 2014, 2015 and 2016 Japanese yen term loans. At that time, we settled the outstanding contracts related to the previously outstanding term loans for $26.3 million. The fair value of the contracts that qualified for hedge accounting at the date of repayment was recorded to AOCI and will be amortized to Interest Expense over the life of the original term loans. We had $14.5 million remaining in AOCI at September 30, 2016. The change in fair value on the unhedged portion of the contracts was recorded in the Consolidated Statements of Income. During the three and nine months ended September 30, 2016, we recorded a gain of $1.5 million and loss of $9.9 million, respectively, in Foreign Currency and Derivative Losses, Net. See Note 7 for further discussion of the Yen Term Loan.
Other Comprehensive Income
The change in Other Comprehensive Income in the Consolidated Statements of Comprehensive Income during the periods presented is due to the translation of the financial statements into U.S. dollars of our consolidated subsidiaries whose functional currency is not the U.S. dollar and the change in fair value for the effective portion of our derivative and nonderivative instruments that have been designated as hedges. We recorded losses of $40.8 million and $22.0 million for the three and nine months ended September 30, 2016, respectively, and losses of $158.1 million and $465.0 million for the three and nine months ended September 30, 2015, respectively.
The following table presents the gains and (losses) associated with the change in fair value for the effective portion of our derivative and nonderivative hedging instruments included in Other Comprehensive Income (in thousands):
|
|
|
Three Months Ended |
|
|
Nine Months Ended |
|
||||||||||
|
|
|
September 30, |
|
|
September 30, |
|
||||||||||
|
|
|
2016 |
|
|
2015 |
|
|
2016 |
|
|
2015 |
|
||||
|
Derivative net investment hedges (1) |
|
$ |
11,546 |
|
|
$ |
14,225 |
|
|
$ |
40,966 |
|
|
$ |
48,419 |
|
|
Interest rate and cash flow hedges (2) |
|
|
3,110 |
|
|
|
(14,754 |
) |
|
|
(10,714 |
) |
|
|
(15,513 |
) |
|
Our share of derivatives from unconsolidated co-investment ventures |
|
|
1,586 |
|
|
|
(906 |
) |
|
|
(6,408 |
) |
|
|
3,200 |
|
|
Total derivative instruments |
|
|
16,242 |
|
|
|
(1,435 |
) |
|
|
23,844 |
|
|
|
36,106 |
|
|
Nonderivative net investment hedges (3) |
|
|
(19,019 |
) |
|
|
(4,674 |
) |
|
|
(88,792 |
) |
|
|
218,729 |
|
|
Total derivative and nonderivative hedging instruments |
|
$ |
(2,777 |
) |
|
$ |
(6,109 |
) |
|
$ |
(64,948 |
) |
|
$ |
254,835 |
|
|
(1) |
We received $16.8 million for the nine months ended September 30, 2016, respectively, upon the settlement of net investment hedges. We received $121.5 million for the nine months ended September 30, 2015, upon the settlement of net investment hedges. We did not settle any net investment hedges during the three months ended September 30, 2016 and 2015. |
|
(2) |
The amounts reclassified to interest expense for the three and nine months ended September 30, 2016, were $2.0 million and $4.1 million, respectively. The amounts reclassified to interest expense for the three and nine months ended September 30, 2015, were not considered significant. For the next 12 months from September 30, 2016, we estimate an additional expense of $6.1 million will be reclassified to Interest Expense. |
24
|
months ended September 30, 2015. There were no unrealized gains or losses recognized for the three and nine months ended September 30, 2016. |
Fair Value Measurements
We have estimated the fair value of our financial instruments using available market information and valuation methodologies we believe to be appropriate for these purposes. Considerable judgment and a high degree of subjectivity are involved in developing these estimates and, accordingly, they are not necessarily indicative of amounts that we would realize on disposition. There have been no significant changes in our policy or strategy from what was disclosed in our Annual Report on Form 10-K for the fiscal year ended December 31, 2015.
Fair Value Measurements on a Recurring Basis
At September 30, 2016, and December 31, 2015, we did not have any significant financial assets or financial liabilities that were measured at fair value on a recurring basis in the Consolidated Financial Statements other than the derivatives discussed previously. All of our derivatives held at September 30, 2016, and December 31, 2015, were classified as Level 2 of the fair value hierarchy.
Fair Value Measurements on Nonrecurring Basis
No assets met the criteria to be measured at fair value on a nonrecurring basis at September 30, 2016, or December 31, 2015.
Fair Value of Financial Instruments
At September 30, 2016, and December 31, 2015, the carrying amounts of certain financial instruments, including cash and cash equivalents, restricted cash, accounts and notes receivable, accounts payable and accrued expenses were representative of their fair values because of the short-term nature of these instruments.
The differences in the fair value of our debt from the carrying value in the table below are the result of differences in interest rates or borrowing spreads that were available to us at September 30, 2016, and December 31, 2015, as compared with those in effect when the debt was issued or assumed, including reduced borrowing spreads due to our improved credit ratings. The senior notes and many of the issues of secured mortgage debt contain pre-payment penalties or yield maintenance provisions that could make the cost of refinancing the debt at lower rates exceed the benefit that would be derived from doing so.
The following table reflects the carrying amounts and estimated fair values of our debt (in thousands):
|
|
|
September 30, 2016 |
|
|
December 31, 2015 |
|
||||||||||
|
|
|
Carrying Value |
|
|
Fair Value |
|
|
Carrying Value |
|
|
Fair Value |
|
||||
|
Credit Facilities |
|
$ |
- |
|
|
$ |
- |
|
|
$ |
- |
|
|
$ |
- |
|
|
Senior notes |
|
|
6,625,291 |
|
|
|
7,321,721 |
|
|
|
6,516,392 |
|
|
|
6,801,118 |
|
|
Term loans and unsecured other |
|
|
1,891,511 |
|
|
|
1,905,511 |
|
|
|
2,115,457 |
|
|
|
2,128,270 |
|
|
Secured mortgages |
|
|
1,053,742 |
|
|
|
1,148,919 |
|
|
|
1,172,473 |
|
|
|
1,262,778 |
|
|
Secured mortgages of consolidated entities |
|
|
1,686,453 |
|
|
|
1,702,694 |
|
|
|
1,822,509 |
|
|
|
1,825,361 |
|
|
Total debt |
|
$ |
11,256,997 |
|
|
$ |
12,078,845 |
|
|
$ |
11,626,831 |
|
|
$ |
12,017,527 |
|
Our current business strategy consists of two operating segments: Real Estate Operations and Strategic Capital. We generate revenues, earnings, net operating income and cash flows through our segments, as follows:
|
• |
Real Estate Operations. This operating segment represents the ownership and development of industrial operating properties and is the largest component of our revenues and earnings. We collect rent from our customers through operating leases, including reimbursements for the majority of our property operating costs. Each operating property is considered to be an individual operating segment with similar economic characteristics; these properties are combined within the reportable segment based on geographic location. Our Real Estate Operations segment also includes development activities that lead to rental operations, including land held for development and properties currently under development. Within this line of business, we capitalize on the following: (i) the land that we currently own; (ii) the development expertise of our local teams; (iii) our global customer relationships; and (iv) our in-depth knowledge of global demand for high-quality logistics facilities. Land we own and lease to customers under ground leases is also included in this segment. |
25
|
be an individual operating segment with similar economic characteristics; these ventures are combined within the reportable segment based on geographic location. |
Reconciliations are presented below for: (i) each reportable business segment’s revenues from external customers to Total Revenues; (ii) each reportable business segment’s net operating income from external customers to Operating Income and Earnings Before Income Taxes; and (iii) each reportable business segment’s assets to Total Assets. Our chief operating decision makers rely primarily on net operating income and similar measures to make decisions about allocating resources and assessing segment performance. The applicable components of Total Revenues, Operating Income, Earnings Before Income Taxes and Total Assets are allocated to each reportable business segment’s revenues, net operating income and assets. Items that are not directly assignable to a segment, such as certain corporate income and expenses, are not allocated but reflected as reconciling items. The following reconciliations are presented in thousands:
|
|
|
Three Months Ended |
|
|
Nine Months Ended |
|
||||||||||
|
|
|
September 30, |
|
|
September 30, |
|
||||||||||
|
|
|
|
2016 |
|
|
|
2015 |
|
|
|
2016 |
|
|
|
2015 |
|
|
Revenues: |
|
|
|
|
|
|
|
|
|
|
|
|
|
|
|
|
|
Real estate operations: |
|
|
|
|
|
|
|
|
|
|
|
|
|
|
|
|
|
U.S. |
|
$ |
512,759 |
|
|
$ |
488,611 |
|
|
$ |
1,525,623 |
|
|
$ |
1,283,303 |
|
|
Other Americas |
|
|
15,598 |
|
|
|
14,876 |
|
|
|
44,637 |
|
|
|
43,143 |
|
|
Europe |
|
|
18,999 |
|
|
|
17,591 |
|
|
|
55,328 |
|
|
|
53,041 |
|
|
Asia |
|
|
16,632 |
|
|
|
15,368 |
|
|
|
45,867 |
|
|
|
41,139 |
|
|
Total Real Estate Operations segment |
|
|
563,988 |
|
|
|
536,446 |
|
|
|
1,671,455 |
|
|
|
1,420,626 |
|
|
Strategic capital: |
|
|
|
|
|
|
|
|
|
|
|
|
|
|
|
|
|
U.S. |
|
|
9,940 |
|
|
|
10,453 |
|
|
|
28,876 |
|
|
|
29,913 |
|
|
Other Americas |
|
|
5,805 |
|
|
|
4,239 |
|
|
|
16,863 |
|
|
|
16,821 |
|
|
Europe |
|
|
113,545 |
|
|
|
20,652 |
|
|
|
161,333 |
|
|
|
60,046 |
|
|
Asia |
|
|
11,287 |
|
|
|
8,832 |
|
|
|
34,493 |
|
|
|
26,467 |
|
|
Total Strategic Capital segment |
|
|
140,577 |
|
|
|
44,176 |
|
|
|
241,565 |
|
|
|
133,247 |
|
|
|
|
|
|
|
|
|
|
|
|
|
|
|
|
|
|
|
|
Total revenues |
|
$ |
704,565 |
|
|
$ |
580,622 |
|
|
$ |
1,913,020 |
|
|
$ |
1,553,873 |
|
|
|
|
|
|
|
|
|
|
|
|
|
|
|
|
|
|
|
|
Segment net operating income: |
|
|
|
|
|
|
|
|
|
|
|
|
|
|
|
|
|
Real estate operations: |
|
|
|
|
|
|
|
|
|
|
|
|
|
|
|
|
|
U.S. |
|
$ |
385,837 |
|
|
$ |
354,685 |
|
|
$ |
1,131,340 |
|
|
$ |
892,391 |
|
|
Other Americas |
|
|
10,417 |
|
|
|
10,456 |
|
|
|
29,148 |
|
|
|
29,229 |
|
|
Europe |
|
|
13,819 |
|
|
|
11,092 |
|
|
|
40,773 |
|
|
|
32,173 |
|
|
Asia |
|
|
9,622 |
|
|
|
11,164 |
|
|
|
30,010 |
|
|
|
29,167 |
|
|
Total Real Estate Operations segment |
|
|
419,695 |
|
|
|
387,397 |
|
|
|
1,231,271 |
|
|
|
982,960 |
|
|
Strategic capital: |
|
|
|
|
|
|
|
|
|
|
|
|
|
|
|
|
|
U.S. |
|
|
(577 |
) |
|
|
132 |
|
|
|
1,959 |
|
|
|
3,141 |
|
|
Other Americas |
|
|
2,975 |
|
|
|
2,073 |
|
|
|
9,142 |
|
|
|
9,831 |
|
|
Europe |
|
|
91,358 |
|
|
|
14,192 |
|
|
|
125,107 |
|
|
|
40,317 |
|
|
Asia |
|
|
2,197 |
|
|
|
1,247 |
|
|
|
7,574 |
|
|
|
3,297 |
|
|
Total Strategic Capital segment |
|
|
95,953 |
|
|
|
17,644 |
|
|
|
143,782 |
|
|
|
56,586 |
|
|
|
|
|
|
|
|
|
|
|
|
|
|
|
|
|
|
|
|
Total segment net operating income |
|
|
515,648 |
|
|
|
405,041 |
|
|
|
1,375,053 |
|
|
|
1,039,546 |
|
|
|
|
|
|
|
|
|
|
|
|
|
|
|
|
|
|
|
|
Reconciling items: |
|
|
|
|
|
|
|
|
|
|
|
|
|
|
|
|
|
General and administrative expenses |
|
|
58,157 |
|
|
|
54,178 |
|
|
|
165,634 |
|
|
|
157,458 |
|
|
Depreciation and amortization expenses |
|
|
224,867 |
|
|
|
247,471 |
|
|
|
705,249 |
|
|
|
607,467 |
|
|
Operating income |
|
|
232,624 |
|
|
|
103,392 |
|
|
|
504,170 |
|
|
|
274,621 |
|
|
Earnings from unconsolidated entities, net |
|
|
45,857 |
|
|
|
33,557 |
|
|
|
145,622 |
|
|
|
106,383 |
|
|
Interest expense |
|
|
(75,310 |
) |
|
|
(81,035 |
) |
|
|
(232,577 |
) |
|
|
(218,698 |
) |
|
Interest and other income, net |
|
|
2,932 |
|
|
|
6,237 |
|
|
|
7,051 |
|
|
|
19,133 |
|
|
Gains on dispositions of investments in real estate, net |
|
|
117,296 |
|
|
|
268,791 |
|
|
|
461,963 |
|
|
|
655,288 |
|
|
Foreign currency and derivative losses, net |
|
|
(1,730 |
) |
|
|
(9,428 |
) |
|
|
(26,277 |
) |
|
|
(374 |
) |
|
Gains (losses) on early extinguishment of debt, net |
|
|
1,492 |
|
|
|
- |
|
|
|
2,484 |
|
|
|
(16,525 |
) |
|
Earnings before income taxes |
|
$ |
323,161 |
|
|
$ |
321,514 |
|
|
$ |
862,436 |
|
|
$ |
819,828 |
|
26
|
|
September 30, |
|
|
December 31, |
|
|||
|
|
|
|
2016 |
|
|
|
2015 |
|
|
Assets: |
|
|
|
|
|
|
|
|
|
Real estate operations: |
|
|
|
|
|
|
|
|
|
U.S. |
|
$ |
21,208,119 |
|
|
$ |
22,030,457 |
|
|
Other Americas |
|
|
1,001,743 |
|
|
|
919,381 |
|
|
Europe |
|
|
1,430,702 |
|
|
|
1,291,991 |
|
|
Asia |
|
|
1,474,498 |
|
|
|
1,157,401 |
|
|
Total Real Estate Operations segment |
|
|
25,115,062 |
|
|
|
25,399,230 |
|
|
Strategic capital: |
|
|
|
|
|
|
|
|
|
U.S. |
|
|
18,408 |
|
|
|
19,363 |
|
|
Europe |
|
|
49,358 |
|
|
|
49,960 |
|
|
Asia |
|
|
1,732 |
|
|
|
2,005 |
|
|
Total Strategic Capital segment |
|
|
69,498 |
|
|
|
71,328 |
|
|
Total segment assets |
|
|
25,184,560 |
|
|
|
25,470,558 |
|
|
Reconciling items: |
|
|
|
|
|
|
|
|
|
Investments in and advances to unconsolidated entities |
|
|
4,580,584 |
|
|
|
4,755,620 |
|
|
Assets held for sale or contribution |
|
|
450,349 |
|
|
|
378,423 |
|
|
Notes receivable backed by real estate |
|
|
33,800 |
|
|
|
235,050 |
|
|
Cash and cash equivalents |
|
|
375,120 |
|
|
|
264,080 |
|
|
Other assets |
|
|
263,796 |
|
|
|
291,036 |
|
|
Total reconciling items |
|
|
5,703,649 |
|
|
|
5,924,209 |
|
|
Total assets |
|
$ |
30,888,209 |
|
|
$ |
31,394,767 |
|
NOTE 13. SUPPLEMENTAL CASH FLOW INFORMATION
Our significant noncash investing and financing activities for the nine months ended September 30, 2016, and 2015 included the following:
|
• |
We capitalized $19.7 million and $17.1 million in 2016 and 2015, respectively, of equity-based compensation expense resulting from our development and leasing activities. |
|
• |
In 2016, we issued 1.9 million shares of the Parent’s common stock upon redemption of an equal number of common limited partnership units in the Operating Partnership as disclosed in Note 8. |
|
• |
During the third quarter of 2016, we received $31.8 million of ownership interests in an unconsolidated co-investment venture from the contribution of properties to this entity. |
|
• |
During 2015, we received $65.3 million of ownership interests in certain unconsolidated entities as a portion of our proceeds from the contribution of properties to these entities. |
|
• |
See Note 2 for information related to the KTR acquisition in May 2015. |
|
• |
We received notes backed by real estate in 2015 that were repaid in 2016 as disclosed in Note 6. |
|
• |
Holders of our exchangeable senior notes exchanged the majority of their notes into common stock of the Parent in March 2015 as disclosed in Note 7. |
We paid $267.2 million and $273.3 million of interest in cash, net of amounts capitalized, for the nine months ended September 30, 2016, and 2015, respectively.
We paid $16.4 million and $17.0 million for income taxes, net of refunds, for the nine months ended September 30, 2016, and 2015, respectively.
27
Report of Independent Registered Public Accounting Firm
The Board of Directors and Stockholders
Prologis, Inc.:
We have reviewed the accompanying consolidated balance sheet of Prologis, Inc. and subsidiaries (the Company) as of September 30, 2016, the related consolidated statements of income, and consolidated statements of comprehensive income for the three-month and nine-month periods ended September 30, 2016 and 2015, the related consolidated statement of equity for the nine-month period ended September 30, 2016, and the related consolidated statements of cash flows for the nine-month periods ended September 30, 2016 and 2015. These consolidated financial statements are the responsibility of the Company’s management.
We conducted our reviews in accordance with the standards of the Public Company Accounting Oversight Board (United States). A review of interim financial information consists principally of applying analytical procedures and making inquiries of persons responsible for financial and accounting matters. It is substantially less in scope than an audit conducted in accordance with the standards of the Public Company Accounting Oversight Board (United States), the objective of which is the expression of an opinion regarding the financial statements taken as a whole. Accordingly, we do not express such an opinion.
Based on our reviews, we are not aware of any material modifications that should be made to the consolidated financial statements referred to above for them to be in conformity with U.S. generally accepted accounting principles.
As discussed in Note 1 of the consolidated financial statements, the Company has changed its method for classifying distributions received from equity method investees in the statements of cash flows for all periods presented at September 30, 2016, on a retrospective basis, due to the early adoption of Accounting Standards Update 2016-15.
We have previously audited, in accordance with standards of the Public Company Accounting Oversight Board (United States), the consolidated balance sheet of Prologis, Inc. and subsidiaries as of December 31, 2015, and the related consolidated statements of income, comprehensive income, equity and cash flows for the year then ended (not presented herein); and in our report dated February 19, 2016, we expressed an unqualified opinion on those consolidated financial statements. In our opinion, the information set forth in the accompanying consolidated balance sheet as of December 31, 2015, is fairly stated, in all material respects, in relation to the consolidated balance sheet from which it has been derived.
/s/ KPMG LLP
Denver, Colorado
November 2, 2016
28
Report of Independent Registered Public Accounting Firm
The Partners
Prologis, L.P.:
We have reviewed the accompanying consolidated balance sheet of Prologis, L.P. and subsidiaries (the Operating Partnership) as of September 30, 2016, the related consolidated statements of income, and consolidated statements of comprehensive income for the three-month and nine-month periods ended September 30, 2016 and 2015, the related consolidated statement of capital for the nine-month period ended September 30, 2016, and the related consolidated statements of cash flows for the nine-month periods ended September 30, 2016 and 2015. These consolidated financial statements are the responsibility of the Operating Partnership’s management.
We conducted our reviews in accordance with the standards of the Public Company Accounting Oversight Board (United States). A review of interim financial information consists principally of applying analytical procedures and making inquiries of persons responsible for financial and accounting matters. It is substantially less in scope than an audit conducted in accordance with the standards of the Public Company Accounting Oversight Board (United States), the objective of which is the expression of an opinion regarding the financial statements taken as a whole. Accordingly, we do not express such an opinion.
Based on our reviews, we are not aware of any material modifications that should be made to the consolidated financial statements referred to above for them to be in conformity with U.S. generally accepted accounting principles.
As discussed in Note 1 of the consolidated financial statements, the Operating Partnership has changed its method for classifying distributions received from equity method investees in the statements of cash flows for all periods presented at September 30, 2016, on a retrospective basis, due to the early adoption of Accounting Standards Update 2016-15.
We have previously audited, in accordance with standards of the Public Company Accounting Oversight Board (United States), the consolidated balance sheet of Prologis, L.P. and subsidiaries as of December 31, 2015, and the related consolidated statements of income, comprehensive income, capital and cash flows for the year then ended (not presented herein); and in our report dated February 19, 2016, we expressed an unqualified opinion on those consolidated financial statements. In our opinion, the information set forth in the accompanying consolidated balance sheet as of December 31, 2015, is fairly stated, in all material respects, in relation to the consolidated balance sheet from which it has been derived.
/s/ KPMG LLP
Denver, Colorado
November 2, 2016
29
ITEM 2. Management’s Discussion and Analysis of Financial Condition and Results of Operations
The following should be read in conjunction with the Consolidated Financial Statements and related Notes included in Item 1 of this report and our Annual Report on Form 10-K for the fiscal year ended December 31, 2015, as filed with the Securities and Exchange Commission (“SEC”).
Certain statements contained in this discussion or elsewhere in this report may be deemed “forward-looking statements” within the meaning of the Private Securities Litigation Reform Act of 1995 and Section 27A of the Securities Act of 1933 and Section 21E of the Securities Exchange Act of 1934. Words such as “expects,” “anticipates,” “intends,” “plans,” “believes,” “seeks,” and “estimates” including variations of such words and similar expressions are intended to identify such forward-looking statements, which generally are not historical in nature. All statements that address operating performance, events or developments that we expect or anticipate will occur in the future — including statements relating to rent and occupancy growth, development activity and changes in sales or contribution volume of properties, disposition activity, general conditions in the geographic areas where we operate, our debt, capital structure and financial position, our ability to form new co-investment ventures and the availability of capital in existing or new co-investment ventures — are forward-looking statements. These statements are not guarantees of future performance and involve certain risks, uncertainties and assumptions that are difficult to predict. Although we believe the expectations reflected in any forward-looking statements are based on reasonable assumptions, we can give no assurance that our expectations will be attained, and therefore actual outcomes and results may differ materially from what is expressed or forecasted in such forward-looking statements. Many of the factors that may affect outcomes and results are beyond our ability to control. For further discussion of these factors see Part I, Item 1A. Risk Factors in our 2015 Annual Report on Form 10-K. References to “we,” “us” and “our” refer to Prologis, Inc. (or the “Parent”) and its consolidated subsidiaries.
MANAGEMENT’S OVERVIEW
We are the global leader in logistics real estate with a focus on high-barrier, high-growth markets. At September 30, 2016, we owned or had investments in, on a wholly owned basis or through co-investment ventures, properties and development projects expected to total $53.0 billion in gross total investment across 665 million square feet (62 million square meters) in 20 countries. Our investment was $31.6 billion, which consisted of our wholly-owned properties and our pro rata (or ownership) share of the properties owned by our co-investment ventures. We lease modern distribution facilities to a diverse base of approximately 5,200 customers for the principle purposes of distribution, transportation and e-commerce fulfillment.
Our strategy is to invest in Class-A logistics facilities in the world’s primary population centers and in those supported by extensive transportation infrastructure (major airports, seaports and rail systems and highway systems). We believe our portfolio is the highest quality logistics property portfolio in the industry. In addition, this portfolio is concentrated in the key markets at the intersection of consumption and global trade. Our local teams actively manage the portfolio, which encompasses leasing and property management efforts, new capital deployment activities and an opportunistic disposition program. The majority of our consolidated properties are in the U.S., while outside the U.S., our properties are generally held in co-investment ventures reducing our exposure to movements in foreign currency. Therefore, we are principally an owner-operator in the U.S. and a manager-developer outside the U.S.
Real estate is a capital-intensive business that requires growth capital. Our strategic capital business gives us access to third-party capital, both private and public, which allows us to diversify our sources of capital and therefore have a broader range of options to fund our growth. We co-invest with some of the world’s largest institutional partners to grow our business and provide incremental revenues. We also access alternative sources of equity through two publicly traded vehicles: Nippon Prologis REIT, Inc. (“NPR”) in Japan and FIBRA Prologis in Mexico. We tailor logistics portfolios to meet our partners’ specific needs, with a focus on long-term ventures and open-ended funds. We hold significant ownership interests in these ventures, aligning our interests with those of our partners. These vehicles source their capital and borrow primarily in the local currency, which mitigates the foreign currency exposure for our international co-investment ventures. We also have other programs to mitigate foreign currency exposure that are discussed below.
Prologis, Inc. is a self-administered and self-managed real estate investment trust (“REIT”) and is the sole general partner of Prologis, L.P. (the “Operating Partnership”). We operate Prologis, Inc. and the Operating Partnership as one enterprise and, therefore, our discussion and analysis refers to Prologis, Inc. and its consolidated subsidiaries, including the Operating Partnership, collectively.
Our business comprises two operating segments: Real Estate Operations and Strategic Capital.
30
|
REAL ESTATE – OPERATIONS Generate revenues and net operating income (“NOI”) by maintaining high occupancy rates and increasing rents |
REAL ESTATE – DEVELOPMENT Generate value from development completions |
STRATEGIC CAPITAL Access third-party capital to grow our business and earn recurring fees and promotes |
|
We have a high-quality logistics portfolio that serves premier brands across the globe. For the nine months ended September 30, 2016, we:
•generated over 90% of the revenues and NOI from our consolidated buildings in the U.S. •increased revenues and NOI over 17% from the first three quarters of 2015 •ended the quarter with occupancy of 96.4% |
Development contributes to significant earnings growth as projects lease up and generate revenues and NOI. For the nine months ended September 30, 2016, we:
•stabilized a total estimated investment in our owned and managed portfolio of $1.8 billion of development projects with an estimated weighted average margin of 26.8%, creating $474 million of value |
Durable fee stream with more than 90% from perpetual or long-life co-investment ventures. For the nine months ended September 30, 2016, we:
•generated approximately 90% of our Strategic Capital revenues and NOI from outside the U.S. •increased Strategic Capital revenues and NOI over 81% from the first three quarters of 2015 •co-invested with some of the world's largest institutional partners |
Real Estate Operations
Rental Operations. Rental operations comprise the largest component of our operating segments and contributed approximately 90% of our revenues, earnings and funds from operations in the first nine months of 2016 (see below for our definition of funds from operations and a complete reconciliation to net earnings). We collect rent from our customers through operating leases, including reimbursements for the majority of our property operating costs. We expect to generate long-term internal growth by maintaining high occupancy rates, increasing rents and controlling expenses. We believe our active portfolio management, coupled with the skills of our property management, leasing, maintenance, capital expenditures, energy and risk management teams, will allow us to maximize rental revenues across our global portfolio. In the first nine months of 2016, over 90% of our revenues and NOI in this segment were generated in the U.S. NOI can be calculated from our financial statements as rental revenues and rental recoveries less rental expenses.
Development. We capitalize on (i) our land bank, (ii) the development expertise of our local teams, (iii) our customer relationships and (iv) our in-depth knowledge of global demand for high-quality logistics facilities. Successful development efforts increase both our rental revenues and our net asset value of the Real Estate Operations segment. We develop properties for long-term hold, for contribution to our co-investment ventures and, occasionally, for sale to third parties.
Strategic Capital
We generate strategic capital revenues from our unconsolidated ventures through asset management and property management services and we earn additional revenues by providing leasing, acquisition, construction, development, financing and disposition services. Depending on the structure of the venture and the returns provided to our partners, we also earn revenues through incentive fees (“promotes”) during the life of a venture or upon liquidation. In the third quarter of 2016, we earned net promote revenues of $73 million after cash bonus expenses. This segment contributed approximately 10% of our revenues, earnings and funds from operations in the first nine months of 2016. We plan to grow this business primarily through growing our assets under management in our existing ventures. In the first nine months of 2016, approximately 90% of the revenues and NOI in this segment were generated outside the U.S.
31
We believe the scale and quality of our global operating portfolio, the skills of our team and the strength of our balance sheet give us unique competitive advantages. Our plan to grow revenues, earnings, NOI, cash flows and funds from operations is based on the following:
|
• |
Rising Rents. Market rents continue to rise across many of our markets, and additional increases are expected as demand for logistics facilities remains strong. Because of the strong rent growth following the global financial crisis, in-place leases have considerable room to rise back to market levels, which translates into increased earnings, NOI and cash flow, both on a consolidated basis and through the amounts we recognize from our unconsolidated co-investment ventures based on our ownership. This is reflected in the positive rent change on rollovers (when comparing the net effective rent of the new lease to the prior lease for the same space) on our owned and managed operating portfolio that we have experienced every quarter beginning in 2013. |
|
• |
Value Creation from Development. We believe a successful development program involves maintaining control of well-positioned land. On the basis of our current estimates, our owned and managed land bank has the potential to support the development of $8.4 billion of total expected investment (“TEI”) of logistics space. TEI represents the total estimated cost of development or expansion, including land, development and leasing costs. We believe the carrying value of our land bank is below its current fair value, and we expect to realize this value going forward through the development of our land and also the disposition of land that no longer serves our business model. During the first nine months of 2016, in our owned and managed portfolio, we stabilized development projects with a TEI of $1.8 billion. Post stabilization (defined as occupancy greater than 90%), we estimate the value of these buildings to be 26.8% above their book value or the cost to develop (defined as estimated weighted average margin and calculated using estimated yield and capitalization rates from our underwriting models). In addition, as these properties lease up and become occupied, we will have increased NOI. |
|
• |
Economies of Scale from Growth in Assets Under Management. We believe we have the right infrastructure in place to allow us to increase our investments in real estate, with minimal increases to general and administrative (“G&A”) expenses. During 2015 and through the first nine months of 2016, our owned and managed real estate assets increased through the acquisition of 76 million square feet of operating properties and the development of 44 million square feet, which was partially offset by dispositions to third parties of 48 million square feet. The acquisitions are related primarily to the purchase of the real estate portfolio of KTR Capital Partners and its affiliates (“KTR”) in 2015. We completed this acquisition and integrated the portfolio with only minimal increases in overhead related to property management and leasing functions. |
SUMMARY OF 2016
During the nine months ended September 30, 2016, and through the date of this report, we completed the following activities as further described in the Consolidated Financial Statements:
|
• |
We generated net proceeds of $1.9 billion and net gains of $375 million from the contribution and disposition of real estate investments. The proceeds were driven by dispositions to third parties of $1.3 billion, primarily in the U.S., and property contributions of $650 million, primarily in Europe and Japan. |
|
• |
In April, we redeemed a portion of our investment in Prologis Targeted European Logistics Fund (“PTELF”) and Prologis Targeted U.S. Logistics Fund (“USLF”) for €185 million ($211 million) and $200 million, respectively, and recorded a gain of $87 million. In October, we redeemed an additional portion of our investment in PTELF and USLF for €90 million ($100 million) and $100 million, respectively. Following these transactions, our ownership percentage in these funds decreased to 22.2% and 14.9% in PTELF and USLF, respectively. |
|
• |
In April, we amended our global senior credit facility (the “Global Facility”) and increased the total borrowing capacity to $3.0 billion and extended the maturity until April 2020, which along with our Japanese yen revolver increased our total borrowing capacity to $3.4 billion. |
|
• |
In August, we entered into an unsecured yen senior term loan agreement (the “Yen Term Loan”) and repaid our existing yen term loans. See liquidity section below for details of this transaction. |
|
• |
In September, we earned promotes from PTELF and Prologis European Properties Fund II (“PEP II”), each based on the venture’s cumulative returns to the investors over the last three years. The third parties’ share of the promotes that were recognized in Strategic Capital Revenues were €79 million ($88 million). |
|
• |
In 2016, we issued 2 million shares of the Parent’s common stock upon redemption of an equal number of common limited partnership units in the Operating Partnership as disclosed in Note 8. |
We had significant development activity and strong operating metrics during the first nine months of 2016. See below for details of our development and operating activity.
32
On June 23, 2016, the United Kingdom (“UK”) passed a referendum to leave the European Union. Our key business drivers remain intact, and we do not anticipate a material operational or financial impact. Our customers in the UK principally serve domestic consumers and we do not expect the decision to leave the European Union will materially change the consumption habits of 65 million people. At September 30, 2016, our owned and managed UK operating portfolio was 99.6% leased had a weighted average lease term of nine years with only 6.4% of the leases expiring in the next 18 months. The UK portfolio contributes approximately 4% of our share of annual NOI through consolidated entities and co-investment ventures. Since the referendum, we have seen positive trends with leasing volume and rent levels, and our development projects have continued to lease up ahead of our underwriting.
RESULTS OF OPERATIONS – NINE MONTHS ENDED SEPTEMBER 30, 2016 AND 2015
We evaluate our business operations based on the NOI of our two business reporting segments, Real Estate Operations and Strategic Capital. NOI by segment is a non-GAAP financial measure that is calculated using revenues and expenses directly from our financial statements. We consider NOI by segment to be an appropriate supplemental measure of our performance because it helps both investors and management to understand the core operations of our business.
Below is a reconciliation of our NOI by segment to Operating Income per the Consolidated Financial Statements for the nine months ended September 30 (in millions). Each segment NOI is reconciled to a line item in the Consolidated Financial Statements in the respective segment discussion.
|
|
|
2016 |
|
|
2015 |
|
||
|
Real Estate Operations segment – NOI |
|
$ |
1,231 |
|
|
$ |
983 |
|
|
Strategic Capital segment – NOI |
|
|
144 |
|
|
|
57 |
|
|
General and administrative expenses |
|
|
(166 |
) |
|
|
(157 |
) |
|
Depreciation and amortization expenses |
|
|
(705 |
) |
|
|
(608 |
) |
|
Operating Income |
|
$ |
504 |
|
|
$ |
275 |
|
See Note 12 to the Consolidated Financial Statements for a reconciliation of each reportable business segment’s NOI to Operating Income and Earnings before Income Taxes.
Real Estate Operations
This operating segment includes rental revenues, rental recoveries and rental expenses recognized from our consolidated buildings, primarily our operating portfolio. The operating fundamentals in the markets in which we operate continue to improve, which has positively affected both the rental rates and occupancy we have experienced and also has fueled development activity. This operating segment also includes revenues from land we own and lease to customers and development management and other revenues, net of acquisition and land holding costs.
Below are the components of Real Estate Operations revenues, expenses and NOI for the nine months ended September 30 (dollars in millions), derived directly from line items in the Consolidated Financial Statements.
|
|
|
2016 |
|
|
2015 |
|
||
|
Rental revenues |
|
$ |
1,299 |
|
|
$ |
1,100 |
|
|
Rental recoveries |
|
|
361 |
|
|
|
313 |
|
|
Development management and other revenues |
|
|
11 |
|
|
|
8 |
|
|
Rental expenses |
|
|
(428 |
) |
|
|
(393 |
) |
|
Other expenses |
|
|
(12 |
) |
|
|
(45 |
) |
|
Real Estate Operations – NOI |
|
$ |
1,231 |
|
|
$ |
983 |
|
|
|
|
|
|
|
|
|
|
|
|
Operating margin (1) |
|
|
74.2 |
% |
|
|
69.6 |
% |
|
(1) |
Operating margin is calculated as rental revenues and rental recoveries less rental expenses divided by the sum of rental revenues and rental recoveries. |
33
Real Estate Operations revenues, expenses and NOI are impacted by capital deployment activities, occupancy and changes in rental rates. The following items highlight the key changes for the nine months ended September 30, 2016, from the same period in 2015 (in millions):
|
Acquisitions (1) |
|
$ |
175 |
|
|
Rent rate growth and occupancy (2) |
|
|
63 |
|
|
Development activity (3) |
|
|
28 |
|
|
Contributions and dispositions (4) |
|
|
(60 |
) |
|
Other (5) |
|
|
42 |
|
|
Total change in Real Estate Operations – NOI |
|
$ |
248 |
|
|
(1) |
The increase from acquisitions was primarily the KTR transaction in May 2015, which generated an additional $149 million of net revenues and includes $25 million in acquisition costs. Approximately 45% of all KTR activity is offset in Net Earnings Attributable to Noncontrolling Interests in the Consolidated Statements of Income attributable to our venture partner’s share. |
|
(2) |
Rent rate growth is a combination of the turnover of existing leases and increases in rental rates from contractual rent on existing leases. If a lease has a contractual rent increase that is not known at the time the lease is signed, such as the consumer price index or a similar metric, the rent increase is not included in rent leveling and therefore, would impact the rental revenues we recognize. We have experienced an increase in rental rates on the turnover of existing leases every quarter beginning in 2013 that has resulted in higher average rental rates in our portfolio and increased rental revenues and NOI as those leases commenced. |
|
(3) |
The increase in net revenues is from development properties that were completed in 2015 and 2016. |
|
(4) |
We had less net revenues due to properties that were contributed to co-investment ventures or sold to third parties in 2015 and 2016. |
|
(5) |
The increase in NOI attributable to other items is primarily due to additional property tax expense recoveries of $13 million and decreases in non-recoverable expenses of $12 million. |
Strategic Capital
This operating segment includes revenues from asset management and other fees as well as promotes earned for services performed for our unconsolidated co-investment ventures. These revenues are reduced generally by the direct costs associated with the asset management of these ventures and allocated property-level management costs for the properties owned by the ventures. Revenues associated with the Strategic Capital segment fluctuates because of the size of co-investment ventures under management, the transactional activity in the ventures and the timing of promotes.
The amounts presented for Europe and Asia are shown in U.S. dollars and were impacted by fluctuations in exchange rates, primarily the euro, British pound sterling and Japanese yen, to the U.S. dollar. We have hedged the majority of our foreign earnings through local currency borrowings and outstanding derivative instruments reflected in Foreign Currency and Derivative Losses, Net that offset the majority of these fluctuations.
34
Below are the components of Strategic Capital revenues, expenses and NOI for the nine months ended September 30 (in millions), derived directly from the line items in the Consolidated Financial Statements.
|
|
|
2016 |
|
|
2015 |
|
||
|
Strategic capital revenues |
|
$ |
242 |
|
|
$ |
133 |
|
|
Strategic capital expenses |
|
|
(98 |
) |
|
|
(76 |
) |
|
Strategic Capital – NOI |
|
$ |
144 |
|
|
$ |
57 |
|
Below is additional detail of our Strategic Capital revenues, expenses and NOI for the nine months ended September 30 (in millions):
|
|
|
2016 |
|
|
2015 |
|
||
|
U.S.: |
|
|
|
|
|
|
|
|
|
Asset management and other fees |
|
$ |
25 |
|
|
$ |
24 |
|
|
Leasing commissions, acquisition and other transaction fees |
|
|
4 |
|
|
|
6 |
|
|
Strategic Capital expenses (1) |
|
|
(27 |
) |
|
|
(27 |
) |
|
Subtotal U.S. |
|
|
2 |
|
|
|
3 |
|
|
Other Americas: |
|
|
|
|
|
|
|
|
|
Asset management and other fees |
|
|
16 |
|
|
|
15 |
|
|
Leasing commissions, acquisition and other transaction fees |
|
|
1 |
|
|
|
2 |
|
|
Strategic Capital expenses |
|
|
(8 |
) |
|
|
(7 |
) |
|
Subtotal Other Americas |
|
|
9 |
|
|
|
10 |
|
|
Europe: |
|
|
|
|
|
|
|
|
|
Asset management and other fees |
|
|
63 |
|
|
|
52 |
|
|
Leasing commissions, acquisition and other transaction fees |
|
|
10 |
|
|
|
8 |
|
|
Promotes (2) |
|
|
88 |
|
|
|
- |
|
|
Strategic Capital expenses (2) |
|
|
(36 |
) |
|
|
(20 |
) |
|
Subtotal Europe |
|
|
125 |
|
|
|
40 |
|
|
Asia: |
|
|
|
|
|
|
|
|
|
Asset management and other fees |
|
|
28 |
|
|
|
23 |
|
|
Leasing commissions, acquisition and other transaction fees |
|
|
6 |
|
|
|
3 |
|
|
Strategic Capital expenses |
|
|
(26 |
) |
|
|
(22 |
) |
|
Subtotal Asia |
|
|
8 |
|
|
|
4 |
|
|
Strategic Capital – NOI |
|
$ |
144 |
|
|
$ |
57 |
|
|
(1) |
This includes expenses for employees who are employed in the U.S. but also support other regions. |
|
(2) |
In September 2016, we earned promotes from PTELF and PEP II, each based on the venture’s cumulative returns to the investors over the last three years. The third parties’ share of the promotes was €79 million ($88 million). Included in expenses is the cash portion that was accrued, in regards to promotes earned, pursuant to the terms of the Prologis Promote Plan. |
The direct costs associated with the Strategic Capital segment relating to the asset management of the ventures were $43 million and $40 million for the nine months ended September 30, 2016, and 2015, respectively, and the direct costs relating to the property level management costs for the properties owned by the ventures were $40 million and $36 million for the nine months ended September 30, 2016, and 2015, respectively. Additionally, the costs related to promotes were $15 million for the three and nine months ended September 30, 2016. There were no costs related to promotes for the three and nine months ended September 30, 2015. These costs are included in Strategic Capital Expenses.
35
The following real estate investments were held through our unconsolidated co-investment ventures (dollars and square feet in millions):
|
|
|
September 30, |
|
|
December 31, |
|
|
September 30, |
|
|||
|
|
|
2016 |
|
|
2015 |
|
|
2015 |
|
|||
|
U.S.: |
|
|
|
|
|
|
|
|
|
|
|
|
|
Number of ventures |
|
|
1 |
|
|
|
1 |
|
|
|
1 |
|
|
Number of properties owned |
|
|
366 |
|
|
|
391 |
|
|
|
401 |
|
|
Square feet |
|
|
49 |
|
|
|
50 |
|
|
|
51 |
|
|
Total assets |
|
$ |
4,167 |
|
|
$ |
4,408 |
|
|
$ |
4,433 |
|
|
Other Americas: |
|
|
|
|
|
|
|
|
|
|
|
|
|
Number of ventures |
|
|
2 |
|
|
|
2 |
|
|
|
2 |
|
|
Number of properties owned |
|
|
209 |
|
|
|
205 |
|
|
|
201 |
|
|
Square feet |
|
|
41 |
|
|
|
39 |
|
|
|
38 |
|
|
Total assets |
|
$ |
2,679 |
|
|
$ |
2,482 |
|
|
$ |
2,433 |
|
|
Europe: |
|
|
|
|
|
|
|
|
|
|
|
|
|
Number of ventures |
|
|
4 |
|
|
|
4 |
|
|
|
4 |
|
|
Number of properties owned |
|
|
694 |
|
|
|
688 |
|
|
|
683 |
|
|
Square feet |
|
|
160 |
|
|
|
159 |
|
|
|
159 |
|
|
Total assets |
|
$ |
11,291 |
|
|
$ |
11,343 |
|
|
$ |
11,711 |
|
|
Asia: |
|
|
|
|
|
|
|
|
|
|
|
|
|
Number of ventures |
|
|
2 |
|
|
|
2 |
|
|
|
2 |
|
|
Number of properties owned |
|
|
79 |
|
|
|
66 |
|
|
|
57 |
|
|
Square feet |
|
|
34 |
|
|
|
29 |
|
|
|
27 |
|
|
Total assets |
|
$ |
5,439 |
|
|
$ |
4,320 |
|
|
$ |
4,234 |
|
|
Total: |
|
|
|
|
|
|
|
|
|
|
|
|
|
Number of ventures |
|
|
9 |
|
|
|
9 |
|
|
|
9 |
|
|
Number of properties owned |
|
|
1,348 |
|
|
|
1,350 |
|
|
|
1,342 |
|
|
Square feet |
|
|
284 |
|
|
|
277 |
|
|
|
275 |
|
|
Total assets |
|
$ |
23,576 |
|
|
$ |
22,553 |
|
|
$ |
22,811 |
|
See Note 4 to the Consolidated Financial Statements for additional information about our unconsolidated co-investment ventures.
G&A Expenses
Our property management functions are provided by Prologis personnel for our owned and managed portfolio. We allocate the costs of our property management function to the properties we consolidate (included in Rental Expenses in our Real Estate Operations segment) and the properties owned by the unconsolidated co-investment ventures (included in Strategic Capital Expenses in our Strategic Capital segment) using the square feet owned by the respective portfolios. We included $26 million for the first nine months of 2016 and 2015 of net employee costs related to property management activities in Rental Expenses. In addition to the allocated property management costs, Strategic Capital Expenses also include the direct expenses associated with the asset management of the unconsolidated co-investment ventures provided by our employees who are assigned to our Strategic Capital segment. We do not allocate indirect costs to Strategic Capital Expenses.
G&A expenses increased $8 million for the nine months ended September 30, 2016 compared to the same time period in 2015, primarily due to increased compensation, including equity based compensation awards.
We capitalize certain costs directly related to our development and leasing activities. Capitalized G&A expenses included salaries and related costs, as well as certain other G&A costs. The following table summarizes capitalized G&A amounts for the nine months ended September 30 (in millions):
|
|
|
2016 |
|
|
2015 |
|
||
|
Building development activities |
|
$ |
34 |
|
|
$ |
35 |
|
|
Leasing activities |
|
|
18 |
|
|
|
16 |
|
|
Operating building improvements, land improvements and other |
|
|
24 |
|
|
|
24 |
|
|
Total capitalized G&A expenses |
|
$ |
76 |
|
|
$ |
75 |
|
|
Capitalized salaries and related costs as a percent of total salaries and related costs |
|
|
22.1 |
% |
|
|
28.4 |
% |
Depreciation and Amortization Expenses
Depreciation and amortization expenses increased $98 million for the nine months ended September 30, 2016 compared to the same time period in 2015, primarily from acquired properties (including the properties purchased from KTR in May 2015) and development
36
properties that were completed during 2015 and 2016. This is offset slightly by the contribution and disposition of properties during 2015 and 2016.
Our Owned and Managed Portfolio
We manage our business on an owned and managed basis including properties wholly owned by us or owned by one of our co-investment ventures. We review our operating fundamentals on an owned and managed basis, and in most cases, our ownership share. We believe reviewing these fundamentals in both ways allow management to understand the entire impact to the financial statements, as it will affect both the Real Estate Operations and Strategic Capital segments, as well as the net earnings we recognize from our unconsolidated co-investment ventures based on our ownership share. We do not control the unconsolidated co-investment ventures for purposes of U.S. GAAP and the presentation of the assets and liabilities and revenues and expenses do not represent a legal claim to such items. The operating agreements of the unconsolidated co-investment ventures generally provide that investors, including Prologis, may receive cash distributions (i) to the extent there is available cash from operations, (ii) upon a capital event, such as a refinancing or sale or (iii) upon liquidation of the venture.
Our foreign investments are impacted by fluctuations in exchange rates, primarily the euro, British pound sterling and Japanese yen, to the U.S. dollar. We have hedged the majority of our foreign investments through outstanding debt and derivative instruments that offset the majority of these fluctuations.
Our owned and managed portfolio includes operating industrial properties and does not include properties under development or held for sale to third parties (square feet in millions):
|
|
September 30, 2016 |
|
|
December 31, 2015 |
|
|
September 30, 2015 |
|
|||||||||||||||||||||||||||
|
|
Number of Properties |
|
|
Square Feet |
|
|
Percentage Occupied |
|
|
Number of Properties |
|
|
Square Feet |
|
|
Percentage Occupied |
|
|
Number of Properties |
|
|
Square Feet |
|
|
Percentage Occupied |
|
|||||||||
|
Consolidated |
|
1,796 |
|
|
|
333 |
|
|
|
96.4 |
% |
|
|
1,872 |
|
|
|
334 |
|
|
|
97.1 |
% |
|
|
1,894 |
|
|
|
339 |
|
|
|
95.9 |
% |
|
Unconsolidated |
|
1,335 |
|
|
|
282 |
|
|
|
96.8 |
% |
|
|
1,331 |
|
|
|
273 |
|
|
|
96.7 |
% |
|
|
1,320 |
|
|
|
271 |
|
|
|
96.0 |
% |
|
Totals |
|
3,131 |
|
|
|
615 |
|
|
|
96.6 |
% |
|
|
3,203 |
|
|
|
607 |
|
|
|
96.9 |
% |
|
|
3,214 |
|
|
|
610 |
|
|
|
96.0 |
% |
Our operating portfolio excludes value-added properties, which are defined as properties that are expected to be repurposed or redeveloped to a higher and better use and recently acquired properties that present opportunities to create greater value. We had five consolidated value-added properties totaling one million square feet and 13 unconsolidated value-added properties totaling two million square feet at September 30, 2016.
Operating Activity
Below is information summarizing the activity of our operating portfolio:
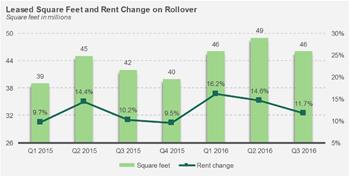
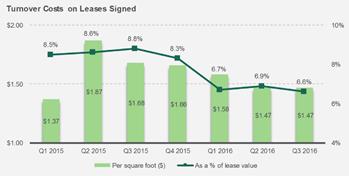
Development Start Activity
The following table summarizes our development starts for the nine months ended September 30 (dollars and square feet in millions):
|
|
|
2016 (1) |
|
|
2015 |
|
||
|
Number of new development projects during the period |
|
|
58 |
|
|
|
63 |
|
|
Square feet |
|
|
16 |
|
|
|
21 |
|
|
TEI |
|
$ |
1,219 |
|
|
$ |
1,575 |
|
|
Our proportionate share of TEI (2) |
|
$ |
1,092 |
|
|
$ |
1,246 |
|
|
Percentage of build-to-suits based on TEI |
|
|
42.8 |
% |
|
|
37.9 |
% |
|
(1) |
We expect all of our properties under development at September 30, 2016, to be completed before February 2018. |
37
Development Stabilization Activity
The following table summarizes our development stabilization activity for the nine months ended September 30 (dollars and square feet in millions):
|
|
|
2016 |
|
|
2015 |
|
||
|
Number of development projects stabilized during the period |
|
|
74 |
|
|
|
58 |
|
|
Square feet |
|
|
24 |
|
|
|
20 |
|
|
TEI |
|
$ |
1,767 |
|
|
$ |
1,444 |
|
|
Our proportionate share of TEI (1) |
|
$ |
1,481 |
|
|
$ |
1,350 |
|
|
Weighted average expected yield on TEI |
|
|
7.0 |
% |
|
|
7.5 |
% |
|
Estimated value at completion |
|
$ |
2,241 |
|
|
$ |
1,930 |
|
|
Estimated weighted average margin |
|
|
26.8 |
% |
|
|
33.8 |
% |
|
(1) |
We calculate our proportionate share of TEI by applying our ownership percentage to the TEI of each unconsolidated co-investment venture on an entity-by-entity basis. We use a similar calculation to derive the noncontrolling interests’ share of TEI, which reduces the consolidated number. |
Same Store Analysis
We evaluate the operating performance of the operating properties we own and manage using a “same store” analysis because the population of properties in this analysis is consistent from period to period, thereby eliminating the effects of changes in the composition of the portfolio on performance measures. We include properties from our owned and managed portfolio in our same store analysis. We have defined the same store portfolio, for the three months ended September 30, 2016, as those properties that were in operation at January 1, 2015, and have been in operation throughout the same three-month periods in both 2016 and 2015 (including development properties that have been completed and available for lease). We have removed all properties that were disposed of to a third party or were classified as held for sale to a third party from the population for both periods. We believe the factors that affect rental revenues, rental expenses and NOI in the same store portfolio are generally the same as for the total operating portfolio. To derive an appropriate measure of period-to-period operating performance, we remove the effects of foreign currency exchange rate movements by using the recent period end exchange rate to translate from local currency into the U.S. dollar, for both periods.
Our same store measures are a non-GAAP financial measure that are commonly used in the real estate industry and calculated beginning with rental revenues, rental recoveries and rental expenses from the financial statements prepared in accordance with GAAP. As our same store measures are non-GAAP financial measures they have certain limitations as analytical tools and may vary among real estate companies. As a result, we provide a reconciliation from our financial statements prepared in accordance with GAAP to Same Store NOI with explanations of how these metrics are calculated. The following is a reconciliation of our consolidated rental revenues, rental recoveries, rental expenses and NOI, as included in the Consolidated Statements of Operations, to the respective amounts in our Same Store portfolio analysis for the three months ended September 30 (dollars in millions):
38
|
|
|
|
|
|
|
|
|
|
|
Percentage |
|
|
|
|
|
2016 |
|
|
2015 |
|
|
Change |
|
|||
|
Rental Revenues (1) (2) |
|
|
|
|
|
|
|
|
|
|
|
|
|
Consolidated: |
|
|
|
|
|
|
|
|
|
|
|
|
|
Rental revenues per the Consolidated Statements of Income |
|
$ |
436 |
|
|
$ |
418 |
|
|
|
|
|
|
Rental recoveries per the Consolidated Statements of Income |
|
|
124 |
|
|
|
115 |
|
|
|
|
|
|
Consolidated adjustments to derive same store results: |
|
|
|
|
|
|
|
|
|
|
|
|
|
Rental revenues and recoveries of properties not in the same store portfolio – properties developed, acquired and sold to third parties during the period and land subject to ground leases |
|
|
(165 |
) |
|
|
(151 |
) |
|
|
|
|
|
Effect of changes in foreign currency exchange rates and other |
|
|
(1 |
) |
|
|
(1 |
) |
|
|
|
|
|
Unconsolidated co-investment ventures – rental revenues |
|
|
439 |
|
|
|
429 |
|
|
|
|
|
|
Same store portfolio – rental revenues (2) |
|
$ |
833 |
|
|
$ |
810 |
|
|
|
2.9 |
% |
|
Rental Expenses (1) (3) |
|
|
|
|
|
|
|
|
|
|
|
|
|
Consolidated: |
|
|
|
|
|
|
|
|
|
|
|
|
|
Rental expenses per the Consolidated Statements of Income |
|
$ |
141 |
|
|
$ |
140 |
|
|
|
|
|
|
Consolidated adjustments to derive same store results: |
|
|
|
|
|
|
|
|
|
|
|
|
|
Rental expenses of properties not in the same store portfolio – properties developed, acquired and sold to third parties during the period and land subject to ground leases |
|
|
(42 |
) |
|
|
(38 |
) |
|
|
|
|
|
Effect of changes in foreign currency exchange rates and other |
|
|
11 |
|
|
|
7 |
|
|
|
|
|
|
Unconsolidated co-investment ventures – rental expenses |
|
|
91 |
|
|
|
95 |
|
|
|
|
|
|
Same store portfolio – rental expenses (3) |
|
$ |
201 |
|
|
$ |
204 |
|
|
|
-1.5 |
% |
|
NOI (1) |
|
|
|
|
|
|
|
|
|
|
|
|
|
Consolidated: |
|
|
|
|
|
|
|
|
|
|
|
|
|
Property NOI (calculated as rental revenues and rental recoveries less rental expenses per the Consolidated Statements of Income) |
|
$ |
419 |
|
|
$ |
393 |
|
|
|
|
|
|
Consolidated adjustments to derive same store results: |
|
|
|
|
|
|
|
|
|
|
|
|
|
Property NOI of properties not in the same store portfolio – properties developed, acquired and sold to third parties during the period and land subject to ground leases |
|
|
(123 |
) |
|
|
(113 |
) |
|
|
|
|
|
Effect of changes in foreign currency exchange rates and other |
|
|
(12 |
) |
|
|
(8 |
) |
|
|
|
|
|
Unconsolidated co-investment ventures – property NOI |
|
|
348 |
|
|
|
334 |
|
|
|
|
|
|
Same store portfolio – NOI |
|
$ |
632 |
|
|
$ |
606 |
|
|
|
4.4 |
% |
|
(1) |
We include 100% of the Same Store NOI from the properties in our same store portfolio. During the periods presented, certain properties owned by us were contributed to a co-investment venture and are included in the same store portfolio. Neither our consolidated results nor those of the co-investment ventures, when viewed individually, would be comparable on a same store basis because of the changes in composition of the respective portfolios from period to period (e.g. the results of a contributed property are included in our consolidated results through the contribution date and in the results of the unconsolidated entities subsequent to the contribution date). |
|
(2) |
We exclude the net termination and renegotiation fees from our same store rental revenues to allow us to evaluate the growth or decline in each property’s rental revenues without regard to items that are not indicative of the property’s recurring operating performance. Net termination and renegotiation fees represent the gross fee negotiated to allow a customer to terminate or renegotiate their lease, offset by the write-off of the asset recorded due to the adjustment to straight-line rents over the lease term. The adjustments to remove these items are included in “effect of changes in foreign currency exchange rates and other” in this table. |
|
(3) |
Rental expenses include the direct operating expenses of the property such as property taxes, insurance and utilities. In addition, we include an allocation of the property management expenses for our direct-owned properties based on the property management services provided to each property (generally, based on a percentage of revenues). On consolidation, these amounts are eliminated and the actual costs of providing property management services are recognized as part of our consolidated rental expenses. These expenses fluctuate based on the level of properties included in the same store portfolio and any adjustment is included as “effect of changes in foreign currency exchange rates and other” in this table. |
Other Components of Income (Expense)
Earnings from Unconsolidated Entities, Net
We recognized net earnings from unconsolidated entities that are accounted for using the equity method of $146 million and $106 million for the nine months ended September 30, 2016, and 2015, respectively. The earnings we recognize are impacted by: (i)
39
variances in revenues and expenses of each venture; (ii) the size and occupancy rate of the portfolio of properties owned by each venture; (iii) gains or losses from the dispositions of properties; (iv) our ownership interest in each venture; and (v) fluctuations in foreign currency exchange rates used to translate our share of net earnings to U.S. dollars. See the discussion of our co-investment ventures above in the Strategic Capital segment discussion and in Note 4 to the Consolidated Financial Statements for further breakdown of our share of net earnings recognized.
Interest Expense
The following table summarizes the components of interest expense for the nine months ended September 30 (in millions):
|
|
|
2016 |
|
|
2015 |
|
||
|
Gross interest expense |
|
$ |
292 |
|
|
$ |
287 |
|
|
Amortization of premiums, net |
|
|
(24 |
) |
|
|
(32 |
) |
|
Amortization of deferred loan costs |
|
|
11 |
|
|
|
10 |
|
|
Interest expense before capitalization |
|
|
279 |
|
|
|
265 |
|
|
Capitalized amounts |
|
|
(46 |
) |
|
|
(46 |
) |
|
Net interest expense |
|
$ |
233 |
|
|
$ |
219 |
|
|
Weighted average effective interest rate |
|
|
3.3 |
% |
|
|
3.4 |
% |
Gross interest expense increased from the nine months ended September 30, 2015, to the same period in 2016, principally from higher outstanding debt balances during the periods, offset slightly by lower borrowing costs. However, our debt overall decreased by $677 million from September 30, 2015, to September 30, 2016, principally from the payment of the senior term loan related to the KTR acquisition with proceeds from contributions and dispositions. See Note 7 to the Consolidated Financial Statements and the Liquidity and Capital Resources section below, for further discussion of our debt and borrowing costs.
Gains on Dispositions of Investments in Real Estate, Net
We recognized gains on dispositions of investments in real estate, net of $462 million and $655 million for the nine months ended September 30, 2016, and 2015, respectively. In 2016, the gains were driven by (i) the contribution of 21 properties, primarily to NPR and ventures in Europe, (ii) the sale of 147 properties to third parties, primarily in the U.S. and (iii) gains on the redemption of investments in co-investment ventures. We used the proceeds to pay down the remaining balance of the senior term loan in the first quarter of 2016 ($400 million) that was used to finance a portion of the KTR acquisition. In 2015, the gains were driven from the contribution of 23 properties primarily in Europe, and the disposition of 75 properties to third parties, primarily in the U.S. We expect to continue to have contributions to co-investment ventures in the future, principally in Europe, Japan and Mexico, as well as make dispositions of properties to third parties, primarily in the U.S., all depending on market conditions and other factors. We expect to use the proceeds from such contributions and dispositions to fund our capital deployment activities and to pay down debt. See Note 3 to the Consolidated Financial Statements for further information on the gains we recognized.
Foreign Currency and Derivative Losses, Net
The following table details our foreign currency and derivative losses, net for the nine months ended September 30 (in millions):
|
|
|
2016 |
|
|
2015 |
|
||
|
Realized foreign currency and derivative gains (losses): |
|
|
|
|
|
|
|
|
|
Gains (losses) on the settlement of unhedged derivative transactions (1) |
|
$ |
(1 |
) |
|
$ |
10 |
|
|
Losses on the settlement of transactions with third parties |
|
|
(4 |
) |
|
|
(3 |
) |
|
Total realized foreign currency and derivative gains (losses) |
|
|
(5 |
) |
|
|
7 |
|
|
|
|
|
|
|
|
|
|
|
|
Unrealized foreign currency and derivative gains (losses), net: |
|
|
|
|
|
|
|
|
|
Gains (losses) on the change in fair value of unhedged derivative transactions (1) |
|
|
(25 |
) |
|
|
10 |
|
|
Gains (losses) on remeasurement of certain assets and liabilities (2) |
|
|
4 |
|
|
|
(22 |
) |
|
Gains on embedded derivative, including amortization (settled March 2015) |
|
|
- |
|
|
|
5 |
|
|
Total unrealized foreign currency and derivative losses, net |
|
|
(21 |
) |
|
|
(7 |
) |
|
Total foreign currency and derivative losses, net |
|
$ |
(26 |
) |
|
$ |
- |
|
|
(1) |
See Note 11 to the Consolidated Financial Statements for more information about our derivative transactions. |
|
(2) |
These gains or losses are from the remeasurement of assets and liabilities that are denominated in currencies other than the functional currency of the entity, such as short-term intercompany loans between the U.S. parent and certain consolidated subsidiaries, debt and tax receivables and payables. |
Income Tax Expense
40
We recognize current income tax expense for income taxes incurred by our taxable REIT subsidiaries, state and local income taxes and taxes incurred in certain foreign jurisdictions. Our current income tax expense fluctuates from period to period based primarily on the timing of our taxable income. Deferred income tax expense (benefit) is generally a function of the period’s temporary differences and the utilization of net operating losses generated in prior years that had been previously recognized as deferred income tax assets in taxable subsidiaries operating in the U.S. or in foreign jurisdictions.
The following table summarizes our income tax expense for the nine months ended September 30 (in millions):
|
|
|
2016 |
|
|
2015 |
|
||
|
Current income tax expense (benefit): |
|
|
|
|
|
|
|
|
|
Income tax expense |
|
$ |
24 |
|
|
$ |
14 |
|
|
Income tax expense on dispositions |
|
|
15 |
|
|
|
5 |
|
|
Income tax expense related to acquired tax liabilities |
|
|
- |
|
|
|
4 |
|
|
Total current income tax expense |
|
|
39 |
|
|
|
23 |
|
|
|
|
|
|
|
|
|
|
|
|
Deferred income tax expense: |
|
|
|
|
|
|
|
|
|
Income tax expense (benefit) |
|
|
(2 |
) |
|
|
2 |
|
|
Income tax benefit on dispositions related to acquired tax liabilities |
|
|
- |
|
|
|
(4 |
) |
|
Total income tax expense |
|
$ |
37 |
|
|
$ |
21 |
|
Net Earnings Attributable to Noncontrolling Interests
This amount represents the third-party investors’ share of the earnings generated in consolidated entities in which we do not own 100% of the equity, reduced by the third party share of fees or promotes payable to us and earned during the period. During the nine months ended September 30, 2016, and 2015, the net earnings attributable to noncontrolling interests for Prologis, Inc. was $58 million and $49 million, respectively, of which $36 million and $44 million was related to noncontrolling interests in the Operating Partnership. In 2016 and 2015, we recognized net earnings attributable to noncontrolling interests primarily related to operating activity in our consolidated co-investment ventures, the Prologis U.S. Logistics Venture (“USLV”) and the North American Industrial Fund. The increase was principally due to the additional units in the Operating Partnerships issued in connection with acquisitions during 2015 and increased operating activity in our consolidated co-investment ventures. See Note 8 to the Consolidated Financial Statements for further information on our consolidated ventures.
Other Comprehensive Income (Loss)
We recognize unrealized gains or losses related to the translation of our foreign subsidiaries’ assets and liabilities into U.S. dollars. We primarily manage our foreign currency exposure by borrowing in the currencies in which we invest. In certain circumstances, we may issue debt in a currency that is not the same functional currency of the borrowing entity to offset the translation and economic exposures related to our net investment in international subsidiaries. To mitigate the impact of the translation from the fluctuations in exchange rates, we may designate the debt as a nonderivative financial instrument hedge. We also hedge our investments in certain international subsidiaries using foreign currency derivative contracts (net investment hedges) to offset the translation and economic exposures related to our investments in these subsidiaries by locking in a forward exchange rate at the inception of the hedge. The realized and unrealized gains or losses associated with the changes in the fair value of derivative and nonderivative financial instruments that are designated and qualify as cash flow hedges and hedges of net investments in foreign operations.
During the nine months ended September 30, 2016, and 2015, we recorded losses of $70 million and $198 million, respectively, related to foreign currency translations of our foreign subsidiaries into U.S. dollars upon consolidation. The losses in 2016 were principally due to the weakening of the euro and British pound sterling, offset slightly by the strengthening of the Brazilian real and Japanese yen, all to the U.S. dollar. The losses in 2015 were principally due to the weakening of the euro, British pound sterling, Japanese yen and Brazilian real to the U.S. dollar.
During the nine months ended September 30, 2016, and 2015, we also recorded losses of $17 million and of $12 million, respectively, related to the change in fair value of our cash flow hedges and our share of derivatives in our unconsolidated co-investment ventures.
See Note 11 to the Consolidated Financial Statements for more information about our derivative transactions.
RESULTS OF OPERATIONS – THREE MONTHS ENDED SEPTEMBER 30, 2016 AND 2015
Except as separately discussed above, the changes in comprehensive income attributable to common stockholders and its components for the three months ended September 30, 2016, as compared to the three months ended September 30, 2015, are similar to the changes for the nine month periods ended on the same dates.
41
LIQUIDITY AND CAPITAL RESOURCES
Overview
We consider our ability to generate cash from operating activities, distributions from our co-investment ventures, dispositions of properties and from available financing sources to be adequate to meet our anticipated future development, acquisition, operating, debt service, dividend and distribution requirements.
Near-Term Principal Cash Sources and Uses
In addition to dividends to the common and preferred stockholders of Prologis and distributions to the holders of limited partnership units of the Operating Partnership and our partners in the consolidated co-investment ventures, we expect our primary cash needs will consist of the following:
|
• |
completion of the development and leasing of the properties in our consolidated development portfolio (at September 30, 2016, 80 properties in our development portfolio were 56.5% leased with a current investment of $1.8 billion and a TEI of $2.6 billion when completed and leased, leaving $0.8 billion remaining to be spent); |
|
• |
development of new properties for long-term investment, including the acquisition of land in certain markets; |
|
• |
capital expenditures and leasing costs on properties in our operating portfolio; |
|
• |
repayment of debt and scheduled principal payments of $15 million for the remainder of 2016 and $866 million in 2017; |
|
• |
additional investments in current unconsolidated entities or new investments in future unconsolidated co-investment ventures; |
|
• |
acquisition of operating properties or portfolios of operating properties (depending on market and other conditions) for direct, long-term investment in our consolidated portfolio (this might include acquisitions from our co-investment ventures); and |
|
• |
repurchase of our outstanding debt or equity securities (depending on prevailing market conditions, our liquidity requirements, contractual restrictions and other factors) through cash purchases, open-market purchases, privately negotiated transactions, tender offers or otherwise. |
We expect to fund our cash needs principally from the following sources (subject to market conditions):
|
• |
available unrestricted cash balances ($375 million at September 30, 2016); |
|
• |
property operations; |
|
• |
fees earned for services performed on behalf of the co-investment ventures, including promotes; |
|
• |
distributions received from the co-investment ventures; |
|
• |
proceeds from the disposition of properties, land parcels or other investments to third parties; |
|
• |
proceeds from the contributions of properties to current or future co-investment ventures; |
|
• |
proceeds from the sale of a portion of our investments in co-investment ventures. In the second quarter of 2016, we received $411 million from the sale of a portion of our investment in two ventures. In October 2016, we redeemed an additional portion of our investment in the same two ventures for $200 million. See Note 4 to the Consolidated Financial Statements for further information; |
|
• |
borrowing capacity under our current credit facility arrangements (discussed in the following section), other facilities or borrowing arrangements ($3.4 billion at September 30, 2016); and |
|
• |
proceeds from the issuance of debt securities, including secured mortgage debt. |
We may also generate proceeds from the issuance of equity securities, subject to market conditions.
42
The following table summarizes information about our debt (in millions):
|
|
|
September 30, 2016 |
|
|
December 31, 2015 |
|
||
|
Debt outstanding |
|
$ |
11,257 |
|
|
$ |
11,627 |
|
|
Weighted average interest rate |
|
|
3.1 |
% |
|
|
3.2 |
% |
|
Weighted average maturity in months |
|
64 |
|
|
67 |
|
||
In the first quarter of 2016, we repaid the $400 million remaining balance on the senior term loan that was used to fund the KTR acquisition with proceeds generated from the contributions of development properties to our co-investment ventures and proceeds generated from the disposition of certain nonstrategic properties to third parties.
In March 2016, we entered into an unsecured term loan agreement under which we could draw in Japanese yen in an aggregate amount not to exceed ¥11.2 billion and was scheduled to mature in March 2017. In the first quarter of 2016, we borrowed ¥11.2 ($99.6 million) on this term loan.
In April 2016, we amended the Global Facility and increased our aggregate borrowing capacity to $3.0 billion.
In August 2016, we entered into the Yen Term Loan under which we can draw in Japanese yen in an aggregate amount not to exceed ¥120.0 billion ($1.2 billion at September 30, 2016). The Yen Term Loan has two tranches, a ¥50.0 billion tranche and ¥70.0 billion tranche, both bearing interest at yen LIBOR plus 0.65% and scheduled to mature in August 2022 and August 2023, respectively. We may increase the borrowings up to ¥200.0 billion ($2.0 billion at September 30, 2016), subject to obtaining additional lender commitments. In the third quarter of 2016, we borrowed on the Yen Term Loan and used the proceeds to repay the previously outstanding Japanese yen term loans entered into in 2014, 2015 and 2016. The Yen Term Loan was fully drawn at September 30, 2016.
At September 30, 2016, we had credit facilities with an aggregate borrowing capacity of $3.5 billion, of which $3.4 billion was available for borrowing.
At September 30, 2016, we were in compliance with all of our debt covenants. These covenants include customary financial covenants for total debt, encumbered debt and fixed charge coverage ratios.
See Note 7 to the Consolidated Financial Statements for further discussion on our debt.
Equity Commitments Related to Certain Co-Investment Ventures
Certain co-investment ventures have equity commitments from us and our venture partners. Our venture partners fulfill their equity commitment with cash. We may fulfill our equity commitment through contributions of properties or cash. For more information on equity commitments for our unconsolidated co-investment ventures, see Note 4 to the Consolidated Financial Statements.
We also have one consolidated co-investment venture with equity commitments, the Brazil Fund. There has been no material change to its equity commitments since December 31, 2015.
Cash Flow Summary
The following table summarizes our cash flow activity for the nine months ended September 30 (in millions):
|
|
|
2016 |
|
|
2015 |
|
||
|
Net cash provided by operating activities |
|
$ |
997 |
|
|
$ |
757 |
|
|
Net cash provided by (used in) investing activities |
|
$ |
730 |
|
|
$ |
(4,969 |
) |
|
Net cash provided by (used in) financing activities |
|
$ |
(1,629 |
) |
|
$ |
4,181 |
|
Cash Provided by Operating Activities
Our cash provided by operating activities, exclusive of changes in receivables and payables, is impacted by the following significant activity:
|
• |
Real estate operations. We receive the majority of our operating cash through net revenues of our Real Estate Operations segment. See our Results of Operations section above for further explanation of our Real Estate Operations segment. The revenues from this segment include noncash adjustments for straight-lined rent and amortization of above and below market leases of $75 million and $38 million for 2016 and 2015, respectively. |
43
|
• |
G&A expenses. We incurred $122 million and $117 million of G&A costs in 2016 and 2015, respectively. These costs represent our General and Administrative Expenses as presented in the Consolidated Statements of Income, net of equity-based compensation awards of $44 million and $40 million in 2016 and 2015, respectively. |
|
• |
Distributions from unconsolidated entities. Effective September 30, 2016, we early adopted an accounting standard update that clarifies the classification methodology within the statement of cash flows for distributions received from equity method investments. We have elected the nature of distributions approach, in which cash flows generated from the operations of an unconsolidated entity are classified as a return on investment (cash inflow from operating activities) and cash flows that are generated from property sales or debt refinancing are classified as a return of investment (cash inflow from investing activities). |
Following our adoption of this standard, we recognized $210 million and $206 million of distributions from our unconsolidated entities in cash flows provided by operating activities in 2016 and 2015, respectively. Included in 2016 are $41 million of distributions that had previously been reported as cash flows provided by investing activities in the Consolidated Statements of Cash Flows. Also included in 2016 are distributions of $27 million that represented our share of promotes earned in 2015. For the nine months ended September 30, 2015, we reclassified $94 million of distributions from our unconsolidated entities into cash flows provided by operating activities that were previously reported as cash flows provided by investing activities. See Note 1 to the Consolidated Financial Statements for more detail on this adoption.
|
• |
Interest and income taxes. As disclosed in Note 13 to the Consolidated Financial Statements, we paid $284 million and $290 million for interest and income taxes in 2016 and 2015, respectively. |
Cash Provided by (Used in) Investing Activities
|
• |
Real estate development. We invested $1.2 billion and $950 million in 2016 and 2015, respectively, in real estate development and leasing costs for first generation leases. We had 51 properties under development and 29 properties that were completed but not stabilized at September 30, 2016, and we expect to continue to develop new properties as the opportunities arise. |
|
• |
Real estate acquisitions. In 2016, we acquired total real estate of $281 million, which included 687 acres of land and 7 operating properties. In 2015, excluding the KTR acquisition, we acquired total real estate of $571 million, which included 973 acres of land and 27 operating properties. |
|
• |
KTR acquisition, net of cash received. In 2015, we acquired the real estate assets of KTR for a net purchase price of $4.8 billion through our consolidated co-investment venture USLV. See Note 2 to the Consolidated Financial Statements for more detail on the transaction. |
|
• |
Capital expenditures. We invested $191 million and $160 million in our operating properties during 2016 and 2015, respectively; which included recurring capital expenditures, tenant improvements and leasing commissions on existing operating properties that were previously leased. |
|
• |
Proceeds from contributions and dispositions. We generated cash from contributions and dispositions of real estate properties of $1.9 billion and $1.8 billion during 2016 and 2015, respectively. The following table summarizes the number of properties we disposed of and contributed for the nine months ended September 30: |
|
|
|
|
2016 |
|
|
2015 |
|
||
|
|
Contributions to unconsolidated co-investment ventures |
|
|
21 |
|
|
|
23 |
|
|
|
Third party dispositions |
|
|
147 |
|
|
|
75 |
|
44
|
|
|
|
2016 |
|
|
2015 |
|
||
|
|
Prologis European Logistics Partners |
|
$ |
124 |
|
|
$ |
222 |
|
|
|
Nippon Prologis REIT |
|
|
34 |
|
|
|
- |
|
|
|
Prologis Brazil Logistics Partners Fund I and related joint ventures |
|
|
32 |
|
|
|
39 |
|
|
|
Prologis Targeted Europe Logistics Fund |
|
|
- |
|
|
|
91 |
|
|
|
Remaining unconsolidated co-investment ventures |
|
|
12 |
|
|
|
27 |
|
|
|
Other unconsolidated joint ventures |
|
|
27 |
|
|
|
60 |
|
|
|
Total |
|
$ |
229 |
|
|
$ |
439 |
|
See Note 4 to the Consolidated Financial Statements for more detail on our unconsolidated co-investment ventures.
|
• |
Return of investment. As discussed above, we early adopted an accounting standard update in the third quarter of 2016 that clarifies the classification methodology within the statement of cash flows for distributions received from equity method investments. Previously, any distribution that we received in excess of our share of net earnings generated from the operations of an unconsolidated entity was reflected as a return of investment in Investing Activities. As a result of our adoption of this standard, distributions generated from activities outside the operations of our unconsolidated entities, such as property sales or debt refinancing, are reflected as Investing Activities. We received distributions from unconsolidated co-investment ventures and other ventures as a return of investment of $579 million and $15 million during 2016 and 2015, respectively. Included in this amount for 2016 is $411 million from the redemption of a portion of our investments in PTELF and USLF, $68 million from dispositions within PELP and $79 million from the disposition of our investment in a joint venture. |
|
• |
Proceeds from repayment of notes receivable backed by real estate. In 2016, we received $201 million for the payment in full of notes receivable backed by real estate received in connection with dispositions of real estate to third parties in 2015. See Note 6 to the Consolidated Financial Statements for further information about notes receivable backed by real estate. |
Cash Provided by (Used In) Financing Activities
|
• |
Proceeds from issuance of common stock. We generated net proceeds of $72 million in 2015 from the issuance of shares of common stock under our at-the-market program. |
|
• |
Dividends paid on common and preferred stock. We paid dividends of $670 million and $593 million to our common and preferred stockholders during 2016 and 2015, respectively. |
|
• |
Noncontrolling interests contributions. In 2015, our partner in USLV made contributions of $2.4 billion, primarily for the KTR acquisition as discussed in Note 2 to the Consolidated Financial Statements. |
|
• |
Noncontrolling interests distributions. In 2016 and 2015, we distributed $301 million and $158 million to various noncontrolling interests, respectively. Distributions in 2016 included $199 million related to proceeds from dispositions of real estate, primarily to our partner in USLV. Distributions in 2015 included $104 million related to proceeds from various dispositions, principally to our partner in USLV and Mexico Fondo Logistico. |
|
• |
Tax paid for shares withheld. In the third quarter of 2016, we early adopted an accounting standard update that clarifies the classification methodology within the statement of cash flows for taxes paid to a tax authority by us when we withhold shares to cover employee withholding tax payments for certain stock compensation plans. As a result of our adoption of this standard, we included payments of $8 million in cash flows used by financing activities related to shares withheld to pay employee withholding taxes for the nine months ended September 30, 2016, that had previously been reported as cash used in operating activities. In addition, we reclassified payments of $12 million from cash flows used in operating activities to cash flows used in financing activities for the nine months ended September 30, 2015. |
|
• |
Net proceeds from (payments on) credit facilities. We made net payments on credit facilities of $4 million in 2016, and we received net proceeds of $200 million on our credit facilities in 2015. |
|
• |
Repurchase and payments of debt. During 2016, we made payments of $1.0 billion on our outstanding term loans, $169 million on regularly scheduled debt principal payments and payments at maturity and repurchased and extinguished secured mortgage debt of $461 million. During 2015, we made payments of $483 million on our outstanding term loans, $120 million on regularly scheduled debt principal payments and payments at maturity and repurchased and extinguished secured mortgage debt of $311 million. |
45
Off-Balance Sheet Arrangements
Unconsolidated Co-Investment Venture Debt
We had investments in and advances to unconsolidated co-investment ventures at September 30, 2016, of $4.4 billion. These ventures had total third-party debt of $6.7 billion (of which $1.7 billion was our proportionate share) at September 30, 2016.
At September 30, 2016, we did not guarantee any third-party debt of the co-investment ventures. In our role as the manager, we work with the co-investment ventures to refinance their maturing debt. There can be no assurance that the co-investment ventures will be able to refinance any maturing indebtedness on terms as favorable as the maturing debt, or at all. If the ventures are unable to refinance the maturing indebtedness with newly issued debt, they may be able to obtain funds by voluntary capital contributions from us and our partners or by selling assets. Certain of our ventures also have credit facilities, or unencumbered properties, both of which may be used to obtain funds.
Contractual Obligations
Distribution and Dividend Requirements
Our dividend policy on our common stock is to distribute a percentage of our cash flow to ensure that we will meet the dividend requirements of the Internal Revenue Code, relative to maintaining our REIT status, while still allowing us to retain cash to meet other needs such as capital improvements and other investment activities.
We paid a cash dividend of $0.42 per common share for all three quarters of 2016. Our future common stock dividends may vary and will be determined by our board of directors upon the circumstances prevailing at the time, including our financial condition, operating results and REIT distribution requirements, and may be adjusted at the discretion of the board of directors during the year.
At September 30, 2016, we had one series of preferred stock outstanding, the series Q. The annual dividend rate is 8.54% per share and dividends are payable quarterly in arrears.
Pursuant to the terms of our preferred stock, we are restricted from declaring or paying any dividend with respect to our common stock unless and until all cumulative dividends with respect to the preferred stock have been paid and sufficient funds have been set aside for dividends that have been declared for the relevant dividend period with respect to the preferred stock.
Other Commitments
On a continuing basis, we are engaged in various stages of negotiations for the acquisition or disposition of individual properties or portfolios of properties.
NEW ACCOUNTING PRONOUNCEMENTS
See Note 1 to the Consolidated Financial Statements.
FUNDS FROM OPERATIONS ATTRIBUTABLE TO COMMON STOCKHOLDERS/UNITHOLDERS (“FFO”)
FFO is a non-GAAP financial measure that is commonly used in the real estate industry. The most directly comparable GAAP measure to FFO is net earnings. Although the National Association of Real Estate Investment Trusts (“NAREIT”) has published a definition of FFO, modifications to the NAREIT calculation of FFO are common among REITs, as companies seek to provide financial measures that meaningfully reflect their business.
FFO is not meant to represent a comprehensive system of financial reporting and does not present, nor do we intend it to present, a complete picture of our financial condition and operating performance. We believe that FFO is only meaningful when it is used in conjunction with net earnings computed under GAAP. Furthermore, we believe the consolidated financial statements, prepared in accordance with GAAP, provide the most meaningful picture of our financial condition.
46
NAREIT’s FFO measure adjusts net earnings computed under GAAP to exclude historical cost depreciation and gains and losses from the sales, along with impairment charges, of previously depreciated properties. We agree that these NAREIT adjustments are useful to investors for the following reasons:
|
• |
historical cost accounting for real estate assets in accordance with GAAP assumes, through depreciation charges, that the value of real estate assets diminishes predictably over time. NAREIT stated in its White Paper on FFO “since real estate asset values have historically risen or fallen with market conditions, many industry investors have considered presentations of operating results for real estate companies that use historical cost accounting to be insufficient by themselves.” Consequently, NAREIT’s definition of FFO reflects the fact that real estate, as an asset class, generally appreciates over time and depreciation charges required by GAAP do not reflect the underlying economic realities. We exclude depreciation from our unconsolidated entities and the third parties’ share of our consolidated ventures. |
|
• |
REITs were created in order to encourage public ownership of real estate as an asset class through investment in firms that were in the business of long-term ownership and management of real estate. The exclusion, in NAREIT’s definition of FFO, of gains and losses from the sales, along with impairment charges, of previously depreciated operating real estate assets allows investors and analysts to readily identify the operating results of the long-term assets that form the core of a REIT’s activity and assists in comparing those operating results between periods. We include the gains and losses (including impairment charges) from dispositions of land and development properties, as well as our proportionate share of the gains and losses (including impairment charges) from dispositions of development properties recognized by our unconsolidated and consolidated entities, in our definition of FFO. We exclude the gain on revaluation of equity investments upon acquisition of a controlling interest from our definition of FFO. |
Our FFO Measures
At the same time that NAREIT created and defined its FFO measure for the REIT industry, it also recognized that “management of each of its member companies has the responsibility and authority to publish financial information that it regards as useful to the financial community.” We believe stockholders, potential investors and financial analysts who review our operating results are best served by a modified FFO measure that includes other adjustments to net earnings computed under GAAP in addition to those included in the NAREIT defined measure of FFO. Our FFO measures are used by management in analyzing our business and the performance of our properties and we believe that it is important that stockholders, potential investors and financial analysts understand the measures management uses.
We calculate our FFO measures, as defined below, based on our proportionate ownership share of both our unconsolidated and consolidated ventures. We reflect our share of our FFO measures for unconsolidated ventures by applying our average ownership percentage for the period to the applicable reconciling items on an entity by entity basis. We reflect our share for consolidated ventures in which we do not own 100% of the equity by adjusting our FFO measures to remove the third party ownership share of the applicable reconciling items based on average ownership percentage for the applicable periods.
We use these FFO measures, including by segment and region, to: (i) evaluate our performance and the performance of our properties in comparison with expected results and results of previous periods, relative to resource allocation decisions; (ii) evaluate the performance of our management; (iii) budget and forecast future results to assist in the allocation of resources; (iv) assess our performance as compared with similar real estate companies and the industry in general; and (v) evaluate how a specific potential investment will impact our future results. Because we make decisions with regard to our performance with a long-term outlook, we believe it is appropriate to remove the effects of short-term items that we do not expect to affect the underlying long-term performance of the properties. The long-term performance of our properties is principally driven by rental revenues. While not infrequent or unusual, these additional items we exclude in calculating FFO, as modified by Prologis, defined below, are subject to significant fluctuations from period to period that cause both positive and negative short-term effects on our results of operations in inconsistent and unpredictable directions that are not relevant to our long-term outlook.
We use our FFO measures as supplemental financial measures of operating performance. We do not use our FFO measures as, nor should they be considered to be, alternatives to net earnings computed under GAAP, as indicators of our operating performance, as alternatives to cash from operating activities computed under GAAP or as indicators of our ability to fund our cash needs.
FFO, as modified by Prologis attributable to common stockholders and unitholders (“FFO, as modified by Prologis”)
To arrive at FFO, as modified by Prologis, we adjust the NAREIT defined FFO measure to exclude:
|
• |
deferred income tax benefits and deferred income tax expenses recognized by our subsidiaries; |
|
• |
current income tax expense related to acquired tax liabilities that were recorded as deferred tax liabilities in an acquisition, to the extent the expense is offset with a deferred income tax benefit in GAAP earnings that is excluded from our defined FFO measure; |
|
• |
unhedged foreign currency exchange gains and losses resulting from debt transactions between us and our foreign consolidated subsidiaries and our foreign unconsolidated entities; |
47
|
• |
mark-to-market adjustments and related amortization of debt discounts associated with derivative financial instruments. |
We believe investors are best served if the information that is made available to them allows them to align their analysis and evaluation of our operating results along the same lines that our management uses in planning and executing our business strategy.
Core FFO attributable to common stockholders and unitholders (“Core FFO”)
In addition to FFO, as modified by Prologis, we also use Core FFO. To arrive at Core FFO, we adjust FFO, as modified by Prologis, to exclude the following recurring and nonrecurring items that we recognized directly in FFO, as modified by Prologis:
|
• |
gains or losses from contribution or sale of land or development properties; |
|
• |
income tax expense related to the sale of investments in real estate and third-party acquisition costs related to the acquisition of real estate; |
|
• |
impairment charges recognized related to our investments in real estate generally as a result of our change in intent to contribute or sell these properties; |
|
• |
gains or losses from the early extinguishment of debt and redemption and repurchase of preferred stock; and |
|
• |
expenses related to natural disasters. |
We believe it is appropriate to further adjust our FFO, as modified by Prologis for certain recurring items as they were driven by transactional activity and factors relating to the financial and real estate markets, rather than factors specific to the on-going operating performance of our properties or investments. The impairment charges we have recognized were primarily based on valuations of real estate, which had declined due to market conditions, that we no longer expected to hold for long-term investment. Over the last few years, we made it a priority to strengthen our financial position by reducing our debt, our investment in certain low yielding assets and our exposure to foreign currency exchange fluctuations. As a result, we changed our intent to sell or contribute certain of our real estate properties and recorded impairment charges when we did not expect to recover the costs of our investment. Also, we purchased portions of our debt securities when we believed it was advantageous to do so, which was based on market conditions, and in an effort to lower our borrowing costs and extend our debt maturities. As a result, we have recognized net gains or losses on the early extinguishment of certain debt due to the financial market conditions at that time.
We analyze our operating performance primarily by the rental revenues of our real estate and the revenues driven by our strategic capital business, net of operating, administrative and financing expenses. This income stream is not directly impacted by fluctuations in the market value of our investments in real estate or debt securities. Although these items discussed above have had a material impact on our operations and are reflected in our financial statements, the removal of the effects of these items allows us to better understand the core operating performance of our properties over the long term.
We use Core FFO, including by segment and region, to: (i) evaluate our performance and the performance of our properties in comparison to expected results and results of previous periods, relative to resource allocation decisions; (ii) evaluate the performance of our management; (iii) budget and forecast future results to assist in the allocation of resources; (iv) provide guidance to the financial markets to understand our expected operating performance; (v) assess our operating performance as compared to similar real estate companies and the industry in general; and (vi) evaluate how a specific potential investment will impact our future results. Because we make decisions with regard to our performance with a long-term outlook, we believe it is appropriate to remove the effects of items that we do not expect to affect the underlying long-term performance of the properties we own. As noted above, we believe the long-term performance of our properties is principally driven by rental revenues. We believe investors are best served if the information that is made available to them allows them to align their analysis and evaluation of our operating results along the same lines that our management uses in planning and executing our business strategy.
Limitations on the use of our FFO measures
While we believe our modified FFO measures are important supplemental measures, neither NAREIT’s nor our measures of FFO should be used alone because they exclude significant economic components of net earnings computed under GAAP and are, therefore, limited as an analytical tool. Accordingly, these are only a few of the many measures we use when analyzing our business. Some of these limitations are:
|
• |
The current income tax expenses and acquisition costs that are excluded from our modified FFO measures represent the taxes and transaction costs that are payable. |
48
|
amortization of capital expenditures and leasing costs necessary to maintain the operating performance of industrial properties are not reflected in FFO. |
|
• |
Gains or losses from non-development property acquisitions and dispositions or impairment charges related to expected dispositions represent changes in value of the properties. By excluding these gains and losses, FFO does not capture realized changes in the value of acquired or disposed properties arising from changes in market conditions. |
|
• |
The deferred income tax benefits and expenses that are excluded from our modified FFO measures result from the creation of a deferred income tax asset or liability that may have to be settled at some future point. Our modified FFO measures do not currently reflect any income or expense that may result from such settlement. |
|
• |
The foreign currency exchange gains and losses that are excluded from our modified FFO measures are generally recognized based on movements in foreign currency exchange rates through a specific point in time. The ultimate settlement of our foreign currency-denominated net assets is indefinite as to timing and amount. Our FFO measures are limited in that they do not reflect the current period changes in these net assets that result from periodic foreign currency exchange rate movements. |
|
• |
The gains and losses on extinguishment of debt that we exclude from our Core FFO, may provide a benefit or cost to us as we may be settling our debt at less or more than our future obligation. |
|
• |
The natural disaster expenses that we exclude from Core FFO are costs that we have incurred. |
We compensate for these limitations by using our FFO measures only in conjunction with net earnings computed under GAAP when making our decisions. This information should be read with our complete consolidated financial statements prepared under GAAP. To assist investors in compensating for these limitations, we reconcile our modified FFO measures to our net earnings computed under GAAP for nine months ended September 30 as follows (in millions).
|
|
|
2016 |
|
|
2015 |
|
||
|
FFO |
|
|
|
|
|
|
|
|
|
Reconciliation of net earnings to FFO measures: |
|
|
|
|
|
|
|
|
|
Net earnings attributable to common stockholders |
|
$ |
763 |
|
|
$ |
744 |
|
|
|
|
|
|
|
|
|
|
|
|
Add (deduct) NAREIT defined adjustments: |
|
|
|
|
|
|
|
|
|
Real estate related depreciation and amortization |
|
|
682 |
|
|
|
588 |
|
|
Gains on dispositions of investments in real estate properties, net |
|
|
(302 |
) |
|
|
(445 |
) |
|
Reconciling items related to noncontrolling interests |
|
|
(87 |
) |
|
|
(33 |
) |
|
Our share of reconciling items included in earnings from unconsolidated entities |
|
|
117 |
|
|
|
149 |
|
|
NAREIT defined FFO |
|
|
1,173 |
|
|
|
1,003 |
|
|
|
|
|
|
|
|
|
|
|
|
Add (deduct) our modified adjustments: |
|
|
|
|
|
|
|
|
|
Unrealized foreign currency and derivative losses, net |
|
|
22 |
|
|
|
9 |
|
|
Deferred income tax benefit, net |
|
|
(2 |
) |
|
|
(2 |
) |
|
Current income tax expense related to acquired tax liabilities |
|
|
- |
|
|
|
4 |
|
|
Reconciling items related to noncontrolling interests |
|
|
- |
|
|
|
(2 |
) |
|
Our share of reconciling items included in earnings from unconsolidated entities |
|
|
1 |
|
|
|
(12 |
) |
|
FFO, as modified by Prologis |
|
|
1,194 |
|
|
|
1,000 |
|
|
|
|
|
|
|
|
|
|
|
|
Adjustments to arrive at Core FFO: |
|
|
|
|
|
|
|
|
|
Gains on dispositions of development properties and land, net |
|
|
(160 |
) |
|
|
(210 |
) |
|
Current income tax expense on dispositions |
|
|
15 |
|
|
|
5 |
|
|
Acquisition expenses |
|
|
3 |
|
|
|
30 |
|
|
Losses (gains) on early extinguishment of debt, net |
|
|
(3 |
) |
|
|
17 |
|
|
Reconciling items related to noncontrolling interests |
|
|
4 |
|
|
|
(13 |
) |
|
Our share of reconciling items included in earnings from unconsolidated entities |
|
|
3 |
|
|
|
7 |
|
|
Core FFO |
|
$ |
1,056 |
|
|
$ |
836 |
|
ITEM 3. Quantitative and Qualitative Disclosures About Market Risk
We are exposed to the impact of foreign-exchange related variability and earnings volatility on our foreign investments and interest rate changes. See our risk factors in Item 1A. Risk Factors, in our Annual Report on Form 10-K for the fiscal year ended December 31, 2015. See also Note 11 to the Consolidated Financial Statements in Item 1 for more information about our derivative financial instruments.
49
We monitor our market risk exposures using a sensitivity analysis. Our sensitivity analysis estimates the exposure to market risk sensitive instruments assuming a hypothetical 10% adverse change in exchange or interest rates at September 30, 2016. The results of the sensitivity analysis are summarized in the following sections. The sensitivity analysis is of limited predictive value. As a result, revenues and expenses, as well as our ultimate realized gains or losses with respect to interest rate and foreign currency exchange rate fluctuations will depend on the exposures that arise during a future period, hedging strategies at the time and the prevailing interest and foreign currency exchange rates.
Foreign Currency Risk
We are exposed to foreign exchange-related variability and earnings volatility on our foreign investments. Foreign currency market risk is the possibility that our financial results or financial position could be better or worse than planned because of changes in foreign currency exchange rates. At September 30, 2016, we had net equity of approximately $1.8 billion, or 9.1% of total net equity, denominated in a currency other than the U.S. dollar, after consideration of our derivative and nonderivative financial instruments. Based on our sensitivity analysis, a 10% reduction in exchange rates would cause a reduction of $181 million to our net equity.
At September 30, 2016, we had foreign currency forward contracts, which were designated and qualify as net investment hedges, with an aggregate notional amount of $471 million to hedge a portion of our investments in the United Kingdom and Canada. On the basis of our sensitivity analysis, a weakening of the U.S. dollar against the British pound sterling and Canadian dollar by 10% would result in a $47 million negative change in our cash flows on settlement. In addition, we also have British pound sterling, Canadian dollar, euro and Japanese yen forward and option contracts, which were not designated as hedges, and have an aggregate notional amount of $496 million to mitigate risk associated with the translation of the projected financial results of our subsidiaries in Europe, Canada and Japan. A weakening of the U.S. dollar against these currencies by 10% would result in a $50 million negative change in our net income and cash flows on settlement.
Interest Rate Risk
We also are exposed to the impact of interest rate changes on future earnings and cash flows. At September 30, 2016, we had $2.0 billion of variable rate debt outstanding, of which $1.9 billion was outstanding on our term loans and $108 million was outstanding on secured mortgage debt. There was no outstanding balance on our credit facilities. At September 30, 2016, we had interest rate swap agreements to fix $283 million (CAD $372 million) of our Canadian term loan. During the nine months ended September 30, 2016, we had weighted average daily outstanding borrowings of $96 million on our variable rate credit facilities. On the basis of our sensitivity analysis, a 10% adverse change in interest rates based on our average outstanding variable rate debt balances not subject to interest rate swap agreements during the period would result in additional annual interest expense of $2 million, which equates to a change in interest rates of 13 basis points.
ITEM 4. Controls and Procedures
Controls and Procedures (The Parent)
The Parent carried out an evaluation under the supervision and with the participation of management, including the chief executive officer and chief financial officer, of the effectiveness of the disclosure controls and procedures (as defined in Rule 13a-14(c)) under the Securities and Exchange Act of 1934 (the “Exchange Act”) at September 30, 2016. On the basis of this evaluation, the chief executive officer and the chief financial officer have concluded that the disclosure controls and procedures are effective to ensure that the information required to be disclosed in reports that are filed or submitted under the Exchange Act are recorded, processed, summarized and reported within the time periods specified in the Securities and Exchange Commission (“SEC”) rules and forms.
No changes in the internal controls over financial reporting during the most recent fiscal quarter have materially affected, or are reasonably likely to materially affect, internal control over financial reporting.
Controls and Procedures (The Operating Partnership)
The Operating Partnership carried out an evaluation under the supervision and with the participation of management, including the chief executive officer and chief financial officer, of the effectiveness of the disclosure controls and procedures (as defined in Rule 13a-14(c)) under the Exchange Act at September 30, 2016. On the basis of this evaluation, the chief executive officer and the chief financial officer have concluded that the disclosure controls and procedures are effective to ensure that the information required to be disclosed in reports that are filed or submitted under the Exchange Act are recorded, processed, summarized and reported within the time periods specified in the SEC rules and forms.
No changes in the internal controls over financial reporting during the most recent fiscal quarter have materially affected, or are reasonably likely to materially affect, internal control over financial reporting.
50
Prologis and our unconsolidated investees are party to a variety of legal proceedings arising in the ordinary course of business. With respect to any such matters to which we are currently a party, the ultimate disposition of any such matters will not result in a material adverse effect on our business, financial position or results of operations.
At September 30, 2016, no material changes had occurred in our risk factors as discussed in Item 1A in our Annual Report on Form 10-K for the fiscal year ended December 31, 2015.
ITEM 2. Unregistered Sales of Equity Securities and Use of Proceeds
During the quarter ended September 30, 2016, we issued an aggregate of 952,000 shares of common stock of the Parent upon redemption of common units of the Operating Partnership. The shares of common stock were issued in reliance on the exemption from registration requirements of the Securities Act of 1933, as amended, afforded by Section 4(a)(2) thereof.
ITEM 3. Defaults Upon Senior Securities
None.
ITEM 4. Mine Safety Disclosures
Not Applicable.
None.
The exhibits required by this item are set forth on the Exhibit Index attached hereto.
51
SIGNATURES
Pursuant to the requirements of Section 13 or 15(d) of the Exchange Act, the registrants have duly caused this report to be signed on their behalf by the undersigned, thereunto duly authorized.
|
PROLOGIS, INC. |
|
|
|
|
|
By: |
/s/ Thomas S. Olinger |
|
|
Thomas S. Olinger |
|
|
Chief Financial Officer |
|
|
|
|
By: |
/s/ Lori A. Palazzolo |
|
|
Lori A. Palazzolo |
|
|
Managing Director and Chief Accounting Officer |
|
|
|
|
PROLOGIS, L.P. |
|
|
By: |
Prologis, Inc., its general partner |
|
|
|
|
By: |
/s/ Thomas S. Olinger |
|
|
Thomas S. Olinger |
|
|
Chief Financial Officer |
|
|
|
|
By: |
/s/ Lori A. Palazzolo |
|
|
Lori A. Palazzolo |
|
|
Managing Director and Chief Accounting Officer |
|
|
|
Date: November 2, 2016
52
Certain of the following documents are filed herewith. Certain other of the following documents that have been previously filed with the Securities and Exchange Commission and, pursuant to Rule 12-b-32, are incorporated herein by reference.
|
|
|
|
3.1 |
Eighth Amended and Restated Bylaws of Prologis, Inc. (incorporated by reference to Exhibit 3.1 to Prologis’ Current Report on Form 8-K filed on September 23, 2016). |
|
|
|
|
10.1 |
Prologis, Inc. 2016 Outperformance Plan (incorporated by reference to Exhibit 10.1 to Prologis’ Current Report Form 8-K filed on August 17, 2016). |
|
|
|
|
10.2 |
Form of Prologis, Inc. 2016 Outperformance Plan LTIP Unit Award Agreement (incorporated by reference to Exhibit 10.2 to Prologis’ Current Report Form 8-K filed on August 17, 2016). |
|
|
|
|
10.3 |
Term Loan Agreement dated as of August 18, 2016 among Prologis GK Holdings Y.K., as borrower, Prologis, Inc. and Prologis, L.P., as guarantors, the banks listed on the signature pages thereof, and Sumitomo Mitsui Banking Corporation, as Administrative Agent (incorporated by reference to Exhibit 10.1 to Prologis’ Current Report Form 8-K filed on August 22, 2016). |
|
|
|
|
10.4 |
Guaranty of Payment dated as of August 18, 2016 among Prologis, Inc. and Prologis, L.P., as guarantors, and Sumitomo Mitsui Banking Corporation, as Administrative Agent, for the banks that are from time to time parties to the Term Loan Agreement dated as of August 18, 2016 (incorporated by reference to Exhibit 10.2 to Prologis’ Current Report Form 8-K filed on August 22, 2016). |
|
|
|
|
12.1† |
Computation of Ratio of Earnings to Fixed Charges of Prologis, Inc. and Prologis, L.P. |
|
|
|
|
12.2† |
Computation of Ratio of Earnings to Combined Fixed Charges and Preferred Stock/Unit Dividends, of Prologis, Inc. and Prologis, L.P. |
|
|
|
|
15.1† |
KPMG LLP Awareness Letter of Prologis, Inc. |
|
|
|
|
15.2† |
KPMG LLP Awareness Letter of Prologis, L.P. |
|
|
|
|
31.1† |
Certification of Chief Executive Officer of Prologis, Inc. |
|
|
|
|
31.2† |
Certification of Chief Financial Officer of Prologis, Inc. |
|
|
|
|
31.3† |
Certification of Chief Executive Officer for Prologis, L.P. |
|
|
|
|
31.4† |
Certification of Chief Financial Officer for Prologis, L.P. |
|
|
|
|
32.1† |
Certification of Chief Executive Officer and Chief Financial Officer of Prologis, Inc., pursuant to Section 906 of the Sarbanes-Oxley Act of 2002. |
|
|
|
|
32.2† |
Certification of Chief Executive Officer and Chief Financial Officer for Prologis, L.P., pursuant to Section 906 of the Sarbanes-Oxley Act of 2002. |
|
|
|
|
101.INS† |
XBRL Instance Document |
|
|
|
|
101.SCH† |
XBRL Taxonomy Extension Schema |
|
|
|
|
101.CAL† |
XBRL Taxonomy Extension Calculation Linkbase |
|
|
|
|
101.DEF† |
XBRL Taxonomy Extension Definition Linkbase |
|
|
|
|
101.LAB† |
XBRL Taxonomy Extension Label Linkbase |
|
|
|
|
101.PRE† |
XBRL Taxonomy Extension Presentation Linkbase |
|
|
|
|
† |
Filed herewith |
53