falseFY0001045609FYfalse0001045610http://fasb.org/us-gaap/2025#AccountingStandardsUpdate202309Memberhttp://fasb.org/us-gaap/2025#OtherLiabilitieshttp://fasb.org/us-gaap/2025#OtherLiabilitieshttp://fasb.org/us-gaap/2025#OtherLiabilitieshttp://fasb.org/us-gaap/2025#OtherAssetshttp://fasb.org/us-gaap/2025#OtherAssetshttp://fasb.org/us-gaap/2025#OtherLiabilitieshttp://fasb.org/us-gaap/2025#OtherLiabilitiesSeptember 20372017-03-31March 20282017-10-312018-12-312019-01-31January 20302019-03-312022-06-30June 20342022-08-312022-12-312023-04-302023-09-302024-04-302024-11-30three years3http://fasb.org/us-gaap/2025#ExecutiveCommitteeMember0001045609us-gaap:OperatingSegmentsMember2023-01-012023-12-310001045609us-gaap:PreferredStockMember2022-12-310001045609pld:DevelopmentPortfolioMemberpld:OtherAmericasMarketsMember2025-12-310001045609pld:UnconsolidatedCoInvestmentVenturesMembercountry:US2023-01-012023-12-310001045609pld:UnitedStatesMarketsMemberpld:DevelopmentPortfolioMemberpld:NashvilleMembercountry:US2025-01-012025-12-310001045609pld:DecemberTwentyEighteenYenSeniorTermLoanTrancheTwoMembercurrency:JPY2025-01-012025-12-310001045609pld:IndianapolisMemberpld:UnitedStatesMarketsMemberpld:OperatingPropertiesMembercountry:US2025-01-012025-12-310001045609us-gaap:NondesignatedMemberus-gaap:ForeignExchangeContractMember2023-12-310001045609currency:JPY2025-12-310001045609pld:OperatingPropertiesMemberpld:OtherAmericasMarketsMembercountry:CA2025-01-012025-12-310001045609us-gaap:DesignatedAsHedgingInstrumentMembercurrency:CADus-gaap:NetInvestmentHedgingMemberus-gaap:ForeignExchangeContractMember2024-12-310001045609us-gaap:AccumulatedTranslationAdjustmentMember2025-12-310001045609pld:UnitedStatesMarketsMemberpld:OperatingPropertiesMemberpld:CharlotteMembercountry:US2025-12-310001045609pld:RealEstateOperationsSegmentMemberus-gaap:OperatingSegmentsMemberpld:OtherAmericasMember2023-01-012023-12-310001045609pld:DecemberTwentyEighteenYenSeniorTermLoanMembercurrency:JPY2025-12-310001045609pld:OctoberTwentySeventeenYenSeniorTermLoanMembercurrency:JPY2024-12-310001045609pld:OctoberTwentySeventeenYenSeniorTermLoanMembercurrency:JPY2025-01-012025-12-310001045609us-gaap:CommercialPaperMember2024-12-310001045609us-gaap:NondesignatedMemberus-gaap:ForeignExchangeContractMembersrt:OtherCurrencyMember2025-01-012025-12-310001045609pld:DevelopmentPortfolioMemberpld:UnitedStatesMarketsMemberpld:SouthFloridaMembercountry:US2025-12-310001045609us-gaap:RestrictedStockUnitsRSUMembersrt:MinimumMember2025-01-012025-12-310001045609us-gaap:LimitedPartnerMember2025-04-012025-06-300001045609pld:RealEstateOperationsSegmentMemberus-gaap:OperatingSegmentsMemberpld:OtherAmericasMember2025-12-310001045609us-gaap:LimitedPartnerMember2025-10-012025-12-310001045609us-gaap:GeneralPartnerMemberpld:PreferredCapitalMembersrt:PartnershipInterestMember2024-12-310001045609pld:MorganStanleyCapitalInternationalMSCIUSREITMemberpld:OutperformancePlanMember2024-01-012024-12-310001045609pld:IndianapolisMemberpld:UnitedStatesMarketsMemberpld:OperatingPropertiesMembercountry:US2025-12-310001045609pld:UnitedStatesMarketsMemberpld:OperatingPropertiesMemberpld:CentralValleyMembercountry:US2025-12-310001045609pld:UnconsolidatedCoInvestmentVenturesMember2024-12-3100010456092024-04-012024-06-300001045609pld:ClassACapitalMember2025-01-012025-12-310001045609pld:PrologisEuropeanLogisticsPartnersHoldingMemberpld:UnconsolidatedCoInvestmentVenturesMember2025-12-310001045609us-gaap:CommonStockMember2024-12-310001045609srt:MinimumMemberpld:CapitalImprovementsMember2025-12-310001045609us-gaap:DesignatedAsHedgingInstrumentMembercurrency:EURus-gaap:CashFlowHedgingMemberus-gaap:InterestRateContractMember2024-01-012024-12-310001045609pld:UnitedStatesMarketsMemberpld:OperatingPropertiesMembercountry:US2025-12-310001045609country:DEpld:OperatingPropertiesMemberpld:EuropeMarketsMember2025-12-310001045609pld:DevelopmentPortfolioMemberpld:UnitedStatesMarketsMemberpld:PortlandMembercountry:US2025-12-310001045609pld:PropertiesUnderDevelopmentMember2024-12-310001045609us-gaap:OtherCapitalizedPropertyPlantAndEquipmentMember2024-12-310001045609country:US2025-12-310001045609pld:ClassACapitalMembersrt:PartnershipInterestMemberus-gaap:LimitedPartnerMember2023-01-012023-12-310001045609srt:WeightedAverageMembersrt:AsiaMemberus-gaap:OtherInvesteesMemberpld:UnconsolidatedCoInvestmentVenturesMember2025-12-310001045609pld:RealEstateOperationsSegmentMemberus-gaap:OperatingSegmentsMembersrt:AsiaMember2023-01-012023-12-310001045609pld:OtherVenturesMember2024-12-310001045609country:JP2025-12-310001045609us-gaap:OperatingSegmentsMember2024-01-012024-12-310001045609currency:CADpld:TwoThousandTwentyTwoCanadianSeniorTermLoanMember2025-01-012025-12-310001045609us-gaap:DesignatedAsHedgingInstrumentMembercurrency:CNYus-gaap:NetInvestmentHedgingMemberus-gaap:ForeignExchangeContractMember2023-12-310001045609srt:MinimumMember2025-12-310001045609pld:UnconsolidatedCoInvestmentVenturesMemberpld:OtherAmericasMember2025-12-310001045609us-gaap:NoncontrollingInterestMember2025-01-012025-12-310001045609pld:RealEstateOperationsSegmentMemberus-gaap:OperatingSegmentsMember2024-12-310001045609pld:ThirtyFifthPercentileIndexMemberpld:TwoThousandTwentyFourToTwoThousandTwentySixPerformancePeriodsMemberpld:PerformanceStockUnitPlanMember2025-01-012025-12-310001045609srt:WeightedAverageMemberus-gaap:OtherInvesteesMemberpld:UnconsolidatedCoInvestmentVenturesMembercountry:US2024-12-310001045609pld:AccumulatedGainLossOnNetInvestmentHedgesMember2025-01-012025-12-310001045609us-gaap:LineOfCreditMember2024-12-310001045609us-gaap:CommercialPaperMember2023-12-3100010456092025-07-012025-09-300001045609srt:PartnershipInterestMember2025-12-310001045609us-gaap:OperatingSegmentsMemberpld:StrategicCapitalSegmentMemberpld:OtherAmericasMember2024-01-012024-12-310001045609us-gaap:OtherCapitalizedPropertyPlantAndEquipmentMember2025-12-310001045609us-gaap:AccumulatedGainLossNetCashFlowHedgeParentMember2025-12-310001045609currency:BRLus-gaap:NondesignatedMemberus-gaap:ForeignExchangeContractMember2025-12-310001045609us-gaap:DesignatedAsHedgingInstrumentMemberpld:BritishPoundSterlingSeniorNotesMember2025-12-310001045609us-gaap:DesignatedAsHedgingInstrumentMemberus-gaap:NetInvestmentHedgingMembercurrency:GBPus-gaap:ForeignExchangeContractMember2023-12-310001045609pld:LouisvilleMemberpld:UnitedStatesMarketsMemberpld:OperatingPropertiesMembercountry:US2025-01-012025-12-310001045609pld:OutperformancePlanMembersrt:MinimumMember2025-01-012025-12-310001045609pld:LehighValleyMemberpld:UnitedStatesMarketsMemberpld:OperatingPropertiesMembercountry:US2025-01-012025-12-310001045609pld:OtherAmericasMemberpld:UnconsolidatedCoInvestmentVenturesMember2023-01-012023-12-310001045609pld:UnitedStatesMarketsMemberpld:OperatingPropertiesMemberpld:SeattleMembercountry:US2025-12-310001045609pld:JanuaryTwentyNineteenYenSeniorTermLoanMembercurrency:JPY2024-12-310001045609pld:LehighValleyMemberpld:UnitedStatesMarketsMemberpld:OperatingPropertiesMembercountry:US2025-12-310001045609pld:SanFranciscoBayAreaMemberpld:UnitedStatesMarketsMemberpld:DevelopmentPortfolioMembercountry:US2025-01-012025-12-310001045609us-gaap:OperatingSegmentsMemberpld:StrategicCapitalSegmentMember2024-12-310001045609us-gaap:SecuredDebtMember2025-01-012025-12-310001045609pld:OperatingPropertiesMembercountry:MXpld:OtherAmericasMarketsMember2025-01-012025-12-310001045609pld:FebruaryTwoThousandAndThirtyThreeSeniorNotesMembercurrency:CADpld:IssuanceOfSeniorNotesMember2025-01-012025-12-310001045609pld:OperatingPropertiesMemberpld:EuropeMarketsMembercountry:GB2025-01-012025-12-310001045609pld:AccumulatedShareOfDerivativesFromUnconsolidatedEntitiesMember2025-01-012025-12-310001045609pld:DevelopmentPortfolioMemberpld:AsiaMarketsMembercountry:IN2025-12-310001045609pld:UnitedStatesMarketsMemberpld:DevelopmentPortfolioMemberpld:CentralValleyMembercountry:US2025-12-310001045609pld:JanuaryTwoThousandAndThirtyOneToMayTwoThousandAndThirtyFiveSeniorNotesMembersrt:WeightedAverageMembercurrency:USDpld:IssuanceOfSeniorNotesMember2025-01-012025-12-310001045609us-gaap:AccumulatedTranslationAdjustmentMember2024-12-310001045609currency:EURpld:IssuanceOfSeniorNotesMembersrt:MinimumMemberpld:SeptemberTwoThousandAndThirtyTwoToSeptemberTwoThousandAndThirtySevenSeniorNotesMember2025-01-012025-12-310001045609us-gaap:SegmentContinuingOperationsMember2023-01-012023-12-310001045609srt:PartnershipInterestMember2022-12-310001045609currency:EURsrt:WeightedAverageMemberpld:IssuanceOfSeniorNotesMemberpld:SeptemberTwoThousandAndThirtyTwoToSeptemberTwoThousandAndThirtySevenSeniorNotesMember2025-01-012025-12-310001045609pld:UnconsolidatedEntitiesMember2024-01-012024-12-310001045609currency:EURus-gaap:NondesignatedMemberus-gaap:ForeignExchangeContractMember2025-12-310001045609us-gaap:AccumulatedOtherComprehensiveIncomeMember2022-12-310001045609pld:RealEstateOperationsSegmentMemberus-gaap:OperatingSegmentsMembersrt:EuropeMember2023-01-012023-12-310001045609us-gaap:NondesignatedMembercurrency:BRLus-gaap:ForeignExchangeContractMember2024-12-310001045609pld:UnitedStatesMarketsMemberpld:DevelopmentPortfolioMembercountry:USpld:NewJerseyNewYorkCityMember2025-12-310001045609us-gaap:OperatingSegmentsMemberpld:StrategicCapitalSegmentMemberpld:OtherAmericasMember2023-01-012023-12-310001045609pld:AccumulatedShareOfDerivativesFromUnconsolidatedEntitiesMember2022-12-310001045609pld:UnaffiliatedInvestorsAndCertainCurrentAndFormerDirectorsAndOfficersMember2025-01-012025-12-310001045609pld:OperatingPropertiesMemberpld:EuropeMarketsMembercountry:IT2025-01-012025-12-310001045609currency:GBPus-gaap:NondesignatedMemberus-gaap:ForeignExchangeContractMember2024-01-012024-12-310001045609us-gaap:RelatedPartyMember2024-12-310001045609us-gaap:NoncontrollingInterestMember2023-12-310001045609us-gaap:SegmentDiscontinuedOperationsMember2025-01-012025-12-310001045609us-gaap:OperatingSegmentsMemberpld:StrategicCapitalSegmentMembersrt:EuropeMember2023-01-012023-12-310001045609us-gaap:DesignatedAsHedgingInstrumentMembercurrency:GBPus-gaap:CashFlowHedgingMemberus-gaap:InterestRateContractMember2024-12-310001045609us-gaap:DesignatedAsHedgingInstrumentMembercurrency:EURus-gaap:CashFlowHedgingMemberus-gaap:InterestRateContractMember2024-12-310001045609pld:DevelopmentPortfolioMemberpld:EuropeMarketsMembercountry:IT2025-01-012025-12-310001045609srt:AsiaMemberpld:UnconsolidatedCoInvestmentVenturesMember2023-01-012023-12-310001045609pld:FebruaryTwoThousandAndThirtyThreeSeniorNotesMembercurrency:CADpld:IssuanceOfSeniorNotesMember2025-12-310001045609us-gaap:NoncontrollingInterestMember2023-01-012023-12-310001045609pld:MorganStanleyCapitalInternationalMSCIUSREITMemberpld:PerformanceStockUnitsMember2024-01-012024-12-310001045609country:JPpld:OperatingPropertiesMemberpld:AsiaMarketsMember2025-01-012025-12-310001045609pld:AtTheMarketOfferingMember2020-01-012020-12-310001045609pld:OtherConsolidatedEntitiesMember2024-12-310001045609us-gaap:DesignatedAsHedgingInstrumentMembercurrency:USDus-gaap:CashFlowHedgingMemberus-gaap:InterestRateContractMember2022-12-310001045609pld:OperatingPropertiesMemberpld:EuropeMarketsMembercountry:FR2025-12-310001045609us-gaap:CommonStockMember2025-01-012025-12-310001045609us-gaap:AdditionalPaidInCapitalMember2023-01-012023-12-310001045609us-gaap:LineOfCreditMember2023-12-310001045609currency:EURus-gaap:NondesignatedMemberus-gaap:ForeignExchangeContractMember2024-01-012024-12-310001045609pld:PrologisYenFinanceLLCMember2018-08-012018-08-310001045609pld:PrologisEuropeanLogisticsFundMemberpld:UnconsolidatedCoInvestmentVenturesMember2025-12-310001045609us-gaap:AccumulatedDistributionsInExcessOfNetIncomeMember2024-12-310001045609pld:TimothyDArndtMember2025-10-012025-12-310001045609pld:AccumulatedDebtDesignatedAsNonDerivativeNetInvestmentHedgesMember2025-01-012025-12-310001045609us-gaap:AccumulatedOtherComprehensiveIncomeMember2024-01-012024-12-310001045609us-gaap:DesignatedAsHedgingInstrumentMemberpld:CanadianDollarSeniorNotesMember2024-12-310001045609pld:PrologisJapanCoreLogisticsFundMemberpld:UnconsolidatedCoInvestmentVenturesMember2025-12-310001045609us-gaap:SeniorNotesMembersrt:MinimumMember2025-12-310001045609us-gaap:ConsolidatedPropertiesMember2024-01-012024-12-310001045609pld:UnitedStatesMarketsMemberpld:OperatingPropertiesMemberpld:CincinnatiMembercountry:US2025-01-012025-12-310001045609pld:OperatingPropertiesMemberpld:EuropeMarketsMembercountry:SE2025-12-310001045609srt:PartnershipInterestMember2025-01-012025-12-310001045609srt:AsiaMemberus-gaap:OperatingSegmentsMemberpld:StrategicCapitalSegmentMember2025-01-012025-12-310001045609us-gaap:OperatingSegmentsMemberpld:StrategicCapitalSegmentMembersrt:EuropeMember2024-12-310001045609pld:OtherConsolidatedEntitiesMember2024-01-012024-12-310001045609us-gaap:DisposalGroupHeldforsaleNotDiscontinuedOperationsMember2024-12-310001045609us-gaap:SecuredDebtMember2025-12-310001045609pld:UnitedStatesMarketsMemberpld:OperatingPropertiesMemberpld:RenoMembercountry:US2025-12-310001045609srt:EuropeMember2025-12-310001045609pld:TwoThousandTwentyFourToTwoThousandTwentySixPerformancePeriodsMembersrt:MaximumMemberpld:PerformanceStockUnitPlanMember2025-01-012025-12-310001045609us-gaap:OperatingSegmentsMemberpld:StrategicCapitalSegmentMember2025-01-012025-12-310001045609currency:USD2025-12-310001045609us-gaap:ParentMember2025-12-310001045609pld:DevelopmentPortfolioMemberpld:EuropeMarketsMembercountry:FR2025-12-310001045609pld:OtherCountriesMember2025-12-310001045609srt:AsiaMemberpld:UnconsolidatedCoInvestmentVenturesMember2024-12-310001045609pld:CommonCapitalMembersrt:PartnershipInterestMember2024-12-310001045609us-gaap:NondesignatedMemberus-gaap:ForeignExchangeContractMember2023-01-012023-12-310001045609us-gaap:DesignatedAsHedgingInstrumentMembercurrency:GBPus-gaap:CashFlowHedgingMemberus-gaap:InterestRateContractMember2023-12-310001045609pld:OperatingPropertiesMember2025-12-310001045609us-gaap:OperatingSegmentsMemberpld:StrategicCapitalSegmentMembersrt:EuropeMember2025-12-310001045609pld:TermLoansAndOtherDebtMember2024-01-012024-12-310001045609pld:MorganStanleyCapitalInternationalMSCIUSREITMemberpld:OutperformancePlanMember2023-01-012023-12-310001045609pld:AccumulatedDebtDesignatedAsNonDerivativeNetInvestmentHedgesMember2024-12-310001045609us-gaap:OperatingSegmentsMemberpld:StrategicCapitalSegmentMember2024-01-012024-12-310001045609pld:UnitedStatesMarketsMemberpld:OperatingPropertiesMemberpld:AtlantaMembercountry:US2025-12-310001045609currency:CADpld:IssuanceOfSeniorNotesMemberpld:FebruaryTwoThousandAndThirtyTwoSeniorNotesMember2025-01-012025-12-310001045609pld:PrologisUSLogisticsVentureMember2024-12-310001045609srt:PartnershipInterestMemberus-gaap:NoncontrollingInterestMember2023-12-310001045609pld:GlobalCreditFacility2023Member2025-01-012025-12-310001045609us-gaap:GeneralPartnerMemberpld:CommonCapitalMembersrt:PartnershipInterestMember2024-01-012024-12-310001045609us-gaap:OperatingSegmentsMembersrt:AsiaMemberpld:StrategicCapitalSegmentMember2023-01-012023-12-310001045609pld:OperatingPropertiesMemberpld:AsiaMarketsMembercountry:IN2025-12-310001045609us-gaap:NondesignatedMembercurrency:GBPus-gaap:ForeignExchangeContractMember2022-12-310001045609us-gaap:DesignatedAsHedgingInstrumentMembercurrency:CADus-gaap:CashFlowHedgingMemberus-gaap:InterestRateContractMember2025-12-310001045609us-gaap:LimitedPartnerMember2024-07-012024-09-300001045609pld:DevelopmentPortfolioMemberpld:EuropeMarketsMembercountry:FR2025-01-012025-12-310001045609pld:RealEstateOperationsSegmentMembersrt:AsiaMemberus-gaap:OperatingSegmentsMember2024-12-310001045609pld:CanadianTermLoanMember2025-12-310001045609us-gaap:OperatingSegmentsMemberpld:StrategicCapitalSegmentMembercountry:US2025-12-310001045609pld:DecemberTwentyEighteenYenSeniorTermLoanMembercurrency:JPY2025-01-012025-12-310001045609us-gaap:BuildingAndBuildingImprovementsMember2024-12-310001045609pld:OperatingPropertiesMemberpld:OtherAmericasMarketsMember2025-12-310001045609pld:DevelopmentPortfolioMemberpld:EuropeMarketsMembercountry:PL2025-01-012025-12-310001045609pld:TwoThousandTwentyThreeYenSeniorTermLoanMembercurrency:JPY2024-12-310001045609pld:ClassACapitalMember2023-01-012023-12-310001045609pld:OperatingPropertiesMembercountry:CZpld:EuropeMarketsMember2025-12-310001045609pld:MarchTwentySeventeenYenSeniorTermLoanTrancheOneMembercurrency:JPY2025-12-310001045609us-gaap:OperatingSegmentsMember2025-12-310001045609us-gaap:NondesignatedMemberus-gaap:ForeignExchangeContractMembercurrency:JPY2022-12-310001045609pld:SecuredMortgageDebtMember2025-12-310001045609pld:JuneTwentyTwentyTwoYenSeniorTermLoanTrancheOneMembercurrency:JPY2025-12-310001045609srt:AsiaMemberus-gaap:OperatingSegmentsMemberpld:StrategicCapitalSegmentMember2024-01-012024-12-310001045609us-gaap:SegmentContinuingOperationsMember2024-01-012024-12-310001045609pld:PrologisTargetedUSLogisticsFundMemberpld:UnconsolidatedCoInvestmentVenturesMember2024-12-310001045609currency:CADus-gaap:NondesignatedMemberus-gaap:ForeignExchangeContractMember2025-01-012025-12-310001045609pld:OperatingPropertiesMemberpld:EuropeMarketsMembercountry:IT2025-12-3100010456092023-06-292023-06-290001045609pld:OutperformancePlanMember2023-01-012023-12-310001045609srt:MinimumMemberpld:AcquiredIndustrialPropertiesMember2025-12-310001045609us-gaap:AdditionalPaidInCapitalMember2023-12-310001045609pld:DevelopmentPortfolioMemberpld:AsiaMarketsMember2025-12-310001045609pld:UnitedStatesMarketsMemberpld:OperatingPropertiesMembercountry:USpld:NewJerseyNewYorkCityMember2025-12-310001045609pld:FIBRAMemberpld:UnconsolidatedCoInvestmentVenturesMember2025-12-3100010456092025-12-310001045609pld:YenCreditFacilityMember2025-01-012025-12-310001045609us-gaap:SecuredDebtMember2024-12-310001045609pld:UnconsolidatedCoInvestmentVenturesMembercountry:US2025-12-310001045609us-gaap:RelatedPartyMember2025-12-310001045609us-gaap:AccumulatedDistributionsInExcessOfNetIncomeMember2023-12-310001045609us-gaap:DesignatedAsHedgingInstrumentMemberus-gaap:CashFlowHedgingMemberus-gaap:InterestRateContractMember2022-12-310001045609us-gaap:GeneralPartnerMemberpld:CommonCapitalMembersrt:PartnershipInterestMember2022-12-310001045609us-gaap:DesignatedAsHedgingInstrumentMemberus-gaap:NetInvestmentHedgingMemberus-gaap:ForeignExchangeContractMember2025-01-012025-12-310001045609pld:ClassACapitalMembersrt:PartnershipInterestMemberus-gaap:LimitedPartnerMember2023-12-310001045609us-gaap:DesignatedAsHedgingInstrumentMembercurrency:EURus-gaap:CashFlowHedgingMemberus-gaap:InterestRateContractMember2025-01-012025-12-310001045609pld:RealEstateOperationsSegmentMemberus-gaap:OperatingSegmentsMembercountry:US2024-12-310001045609pld:UnitedStatesMarketsMemberpld:OperatingPropertiesMemberpld:HoustonMembercountry:US2025-12-310001045609pld:AccumulatedShareOfDerivativesFromUnconsolidatedEntitiesMember2023-01-012023-12-310001045609us-gaap:OperatingSegmentsMemberpld:StrategicCapitalSegmentMembersrt:EuropeMember2025-01-012025-12-310001045609currency:EUR2025-12-310001045609pld:UnitedStatesMarketsMemberpld:DevelopmentPortfolioMemberpld:NashvilleMembercountry:US2025-12-310001045609currency:CADus-gaap:NondesignatedMemberus-gaap:ForeignExchangeContractMember2023-01-012023-12-310001045609pld:DevelopmentPortfolioMemberpld:OtherAmericasMarketsMembercountry:CA2025-01-012025-12-310001045609us-gaap:NondesignatedMemberus-gaap:ForeignExchangeContractMembersrt:OtherCurrencyMember2024-01-012024-12-3100010456092025-06-300001045609pld:DanielSLetterMember2025-10-012025-12-3100010456092024-07-012024-09-300001045609pld:OperatingPropertiesMembersrt:MinimumMember2025-12-310001045609currency:EURus-gaap:NondesignatedMemberus-gaap:ForeignExchangeContractMember2022-12-310001045609us-gaap:DesignatedAsHedgingInstrumentMemberus-gaap:CashFlowHedgingMemberus-gaap:InterestRateContractMember2024-01-012024-12-310001045609pld:PerformanceStockUnitPlanMember2025-12-310001045609us-gaap:ShareBasedCompensationAwardTrancheTwoMemberpld:OutperformancePlanMember2025-01-012025-12-310001045609us-gaap:NondesignatedMemberus-gaap:ForeignExchangeContractMember2024-12-310001045609pld:OperatingPropertiesMembercountry:HUpld:EuropeMarketsMember2025-01-012025-12-310001045609us-gaap:OperatingSegmentsMemberpld:StrategicCapitalSegmentMembercountry:US2024-12-310001045609us-gaap:DesignatedAsHedgingInstrumentMembercurrency:USDus-gaap:CashFlowHedgingMemberus-gaap:InterestRateContractMember2025-12-310001045609pld:CommonUnitsMember2024-01-012024-12-310001045609pld:PerformanceStockUnitsMember2025-12-310001045609currency:EUR2024-12-310001045609pld:CommonUnitsMember2015-12-310001045609us-gaap:RestrictedStockUnitsRSUMember2025-01-012025-12-310001045609pld:OperatingPropertiesMemberpld:EuropeMarketsMembercountry:SK2025-12-310001045609pld:OperatingPropertiesMemberpld:EuropeMarketsMembercountry:PL2025-01-012025-12-310001045609us-gaap:NondesignatedMemberus-gaap:ForeignExchangeContractMembercurrency:JPY2024-01-012024-12-310001045609pld:ClassACapitalMembersrt:PartnershipInterestMember2024-01-012024-12-310001045609pld:PerformanceStockUnitPlanMember2025-01-012025-12-310001045609srt:AsiaMemberpld:UnconsolidatedCoInvestmentVenturesMember2025-12-310001045609pld:DevelopmentPortfolioMemberpld:UnitedStatesMarketsMembercountry:US2025-12-310001045609pld:DevelopmentPortfolioIncludingCostOfLandPrestabilizedMember2025-12-310001045609pld:DevelopmentPortfolioMemberpld:UnitedStatesMarketsMemberpld:SouthernCaliforniaMembercountry:US2025-12-310001045609us-gaap:AccumulatedDistributionsInExcessOfNetIncomeMember2024-01-012024-12-310001045609pld:CommonCapitalMembersrt:PartnershipInterestMemberus-gaap:LimitedPartnerMember2023-01-012023-12-310001045609us-gaap:AccumulatedTranslationAdjustmentMember2023-01-012023-12-310001045609pld:OtherAmericasMemberpld:UnconsolidatedCoInvestmentVenturesMember2024-12-310001045609pld:DecemberTwentyTwentyTwoYenSeniorTermLoanMembercurrency:JPY2025-12-310001045609pld:JanuaryTwoThousandAndThirtyOneToMayTwoThousandAndThirtyFiveSeniorNotesMemberpld:IssuanceOfSeniorNotesMembercurrency:USDsrt:MinimumMember2025-01-012025-12-310001045609currency:CADpld:TwoThousandTwentyTwoCanadianSeniorTermLoanMember2024-12-310001045609us-gaap:AccumulatedDistributionsInExcessOfNetIncomeMember2025-12-310001045609pld:SeriesQPreferredStockMember2025-01-012025-12-310001045609pld:RealEstateOperationsSegmentMemberus-gaap:OperatingSegmentsMembercountry:US2025-12-310001045609pld:TermLoanMember2025-12-310001045609us-gaap:DesignatedAsHedgingInstrumentMembercurrency:USDus-gaap:CashFlowHedgingMemberus-gaap:InterestRateContractMember2023-12-310001045609us-gaap:GeneralPartnerMemberpld:CommonCapitalMembersrt:PartnershipInterestMember2023-01-012023-12-310001045609pld:DevelopmentPortfolioMemberpld:UnitedStatesMarketsMemberpld:LasVegasMembercountry:US2025-01-012025-12-310001045609pld:AccumulatedDebtDesignatedAsNonDerivativeNetInvestmentHedgesMember2024-01-012024-12-310001045609pld:PrologisBrazilLogisticsVentureAndOtherJointVenturesMemberpld:UnconsolidatedCoInvestmentVenturesMember2025-12-310001045609pld:RealEstateOperationsSegmentMemberus-gaap:OperatingSegmentsMembercountry:US2023-01-012023-12-310001045609pld:AccumulatedGainLossOnNetInvestmentHedgesMember2024-12-310001045609srt:PartnershipInterestMemberpld:PreferredCapitalMember2024-12-310001045609us-gaap:NondesignatedMemberus-gaap:ForeignExchangeContractMembersrt:OtherCurrencyMember2024-12-310001045609currency:JPYpld:MarchTwentyNineteenYenSeniorTermLoanMember2024-12-310001045609pld:DepreciableLandImprovementsOnDevelopedBuildingsMembersrt:MinimumMember2025-12-310001045609pld:OutperformancePlanMembersrt:MaximumMember2025-01-012025-12-310001045609pld:RealEstateOperationsSegmentMemberus-gaap:OperatingSegmentsMembersrt:AsiaMember2025-01-012025-12-310001045609pld:JuneTwentyTwentyTwoYenSeniorTermLoanMembercurrency:JPY2025-01-012025-12-310001045609pld:OutperformancePlanMember2025-12-310001045609currency:CADpld:TwoThousandTwentyTwoCanadianSeniorTermLoanMember2025-12-310001045609pld:OtherAmericasMemberpld:UnconsolidatedCoInvestmentVenturesMember2024-01-012024-12-310001045609pld:OperatingPropertiesMemberpld:AsiaMarketsMembercountry:IN2025-01-012025-12-310001045609us-gaap:CommonStockMemberpld:OtherConsolidatedEntitiesMember2024-12-310001045609pld:DevelopmentPortfolioMembercountry:NLpld:EuropeMarketsMember2025-12-310001045609us-gaap:CommonStockMember2024-01-012024-12-310001045609us-gaap:DesignatedAsHedgingInstrumentMemberus-gaap:CashFlowHedgingMemberus-gaap:InterestRateContractMember2023-01-012023-12-310001045609pld:DevelopmentPortfolioMemberpld:EuropeMarketsMembercountry:IT2025-12-310001045609us-gaap:DesignatedAsHedgingInstrumentMembercurrency:CADus-gaap:NetInvestmentHedgingMemberus-gaap:ForeignExchangeContractMember2022-12-310001045609pld:PrologisChinaLogisticsVentureMemberpld:UnconsolidatedCoInvestmentVenturesMember2025-12-310001045609pld:UnitedStatesMarketsMemberpld:OperatingPropertiesMembercountry:USpld:AustinMember2025-12-310001045609currency:SEKus-gaap:NondesignatedMemberus-gaap:ForeignExchangeContractMember2024-12-310001045609pld:UnconsolidatedCoInvestmentVenturesMember2025-12-310001045609us-gaap:GeneralPartnerMemberpld:PreferredCapitalMembersrt:PartnershipInterestMember2025-12-310001045609pld:UnitedStatesMarketsMemberpld:OperatingPropertiesMembercountry:USpld:HoustonMember2025-01-012025-12-310001045609pld:RealEstateOperationsSegmentMemberus-gaap:OperatingSegmentsMemberpld:OtherAmericasMember2025-01-012025-12-310001045609pld:UnitedStatesMarketsMemberpld:OperatingPropertiesMemberpld:SanAntonioMembercountry:US2025-01-012025-12-310001045609pld:JanuaryTwentyNineteenYenSeniorTermLoanTrancheTwoMembercurrency:JPY2025-01-012025-12-310001045609us-gaap:GeneralPartnerMemberpld:CommonCapitalMembersrt:PartnershipInterestMember2023-12-310001045609us-gaap:RestrictedStockUnitsRSUMember2025-12-310001045609pld:UnitedStatesMarketsMemberpld:OperatingPropertiesMemberpld:CincinnatiMembercountry:US2025-12-310001045609us-gaap:PreferredStockMember2025-12-310001045609pld:UnitedStatesMarketsMemberpld:OperatingPropertiesMemberpld:NashvilleMembercountry:US2025-01-012025-12-310001045609us-gaap:AccumulatedOtherComprehensiveIncomeMember2024-12-310001045609pld:OperatingPropertiesMemberpld:EuropeMarketsMembercountry:SE2025-01-012025-12-310001045609pld:DenverMemberpld:UnitedStatesMarketsMemberpld:OperatingPropertiesMembercountry:US2025-01-012025-12-310001045609pld:SeriesQPreferredStockMember2023-01-012023-12-310001045609srt:PartnershipInterestMemberus-gaap:NoncontrollingInterestMember2022-12-310001045609pld:DepreciableLandImprovementsOnDevelopedBuildingsMembersrt:MaximumMember2025-12-310001045609us-gaap:LimitedPartnerMember2024-01-012024-03-310001045609pld:TimothyDArndtMember2025-12-3100010456092023-01-012023-12-310001045609pld:SecuredMortgageDebtMember2024-12-310001045609pld:StandardTenantImprovementsMember2025-12-310001045609pld:TermLoanMember2024-12-310001045609pld:UnconsolidatedCoInvestmentVenturesMembercountry:US2024-12-310001045609pld:PrologisJapanCoreLogisticsFundMemberpld:UnconsolidatedCoInvestmentVenturesMember2024-12-310001045609pld:AtTheMarketOfferingMember2020-12-310001045609pld:UnitedStatesMarketsMemberpld:OperatingPropertiesMemberpld:AustinMembercountry:US2025-01-012025-12-310001045609pld:UnconsolidatedCoInvestmentVenturesMembercountry:US2024-01-012024-12-310001045609us-gaap:DesignatedAsHedgingInstrumentMemberus-gaap:NetInvestmentHedgingMemberus-gaap:ForeignExchangeContractMember2024-12-310001045609us-gaap:AdditionalPaidInCapitalMember2025-01-012025-12-310001045609us-gaap:LimitedPartnerMember2025-01-012025-03-310001045609pld:UnitedStatesMarketsMemberpld:DevelopmentPortfolioMemberpld:BaltimoreMembercountry:US2025-12-310001045609us-gaap:SecuredDebtMembersrt:MinimumMember2025-12-310001045609pld:SeriesQPreferredStockMember2024-01-012024-12-310001045609us-gaap:AccumulatedGainLossNetCashFlowHedgeParentMember2025-01-012025-12-310001045609us-gaap:DesignatedAsHedgingInstrumentMembercurrency:EURus-gaap:CashFlowHedgingMemberus-gaap:InterestRateContractMember2023-12-310001045609srt:OtherCurrencyMember2024-12-310001045609pld:CapitalImprovementsMembersrt:MinimumMember2025-12-310001045609pld:LouisvilleMemberpld:UnitedStatesMarketsMemberpld:OperatingPropertiesMembercountry:US2025-12-310001045609us-gaap:OptionMemberus-gaap:NondesignatedMembercurrency:MXN2024-12-310001045609srt:AsiaMemberus-gaap:OperatingSegmentsMemberpld:StrategicCapitalSegmentMember2024-12-310001045609pld:DevelopmentPortfolioMemberpld:OtherAmericasMarketsMembercountry:CA2025-12-310001045609pld:OtherVenturesMember2025-12-310001045609pld:PrologisEuropeanLogisticsPartnersHoldingMemberpld:UnconsolidatedCoInvestmentVenturesMember2024-12-310001045609us-gaap:DesignatedAsHedgingInstrumentMembercurrency:CADus-gaap:NetInvestmentHedgingMemberus-gaap:ForeignExchangeContractMember2024-01-012024-12-310001045609pld:RealEstateOperationsSegmentMemberus-gaap:OperatingSegmentsMembersrt:EuropeMember2025-12-310001045609pld:DevelopmentPortfolioMemberpld:EuropeMarketsMembercountry:GB2025-01-012025-12-3100010456092024-01-012024-12-310001045609pld:CapitalImprovementsMembersrt:MaximumMember2025-12-310001045609us-gaap:GeneralPartnerMemberpld:PrologisLimitedPartnershipMember2025-01-012025-12-310001045609us-gaap:SeniorNotesMember2025-12-310001045609currency:CADus-gaap:NondesignatedMemberus-gaap:ForeignExchangeContractMember2024-01-012024-12-310001045609srt:PartnershipInterestMemberus-gaap:NoncontrollingInterestMember2023-01-012023-12-310001045609pld:ChinaAMCPrologisLogisticsREITMemberpld:UnconsolidatedCoInvestmentVenturesMember2025-12-310001045609us-gaap:SegmentDiscontinuedOperationsMember2024-01-012024-12-310001045609us-gaap:AccumulatedGainLossNetCashFlowHedgeParentMember2024-12-310001045609pld:ChinaAMCPrologisLogisticsREITMemberpld:UnconsolidatedCoInvestmentVenturesMember2024-12-310001045609pld:LongTermIncentivePlanUnitsMember2023-01-012023-12-310001045609us-gaap:OperatingSegmentsMemberpld:StrategicCapitalSegmentMembercountry:US2023-01-012023-12-310001045609us-gaap:NoncontrollingInterestMember2025-12-310001045609pld:UnitedStatesMarketsMemberpld:DenverMemberpld:OperatingPropertiesMembercountry:US2025-12-310001045609pld:EightyFifthPercentileIndexMemberpld:TwoThousandTwentyFourToTwoThousandTwentySixPerformancePeriodsMemberpld:PerformanceStockUnitPlanMember2025-01-012025-12-310001045609pld:AccumulatedShareOfDerivativesFromUnconsolidatedEntitiesMember2024-01-012024-12-310001045609currency:GBP2024-12-310001045609pld:FivePointSixTwoFivePercentNotesDueTwoThousandFortyMemberpld:PrologisLimitedPartnershipMember2025-01-012025-12-310001045609pld:ClassACapitalMember2024-12-312024-12-310001045609pld:UnitedStatesMarketsMemberpld:DevelopmentPortfolioMemberpld:SouthFloridaMembercountry:US2025-01-012025-12-310001045609pld:ClassACapitalMembersrt:PartnershipInterestMemberus-gaap:LimitedPartnerMember2025-01-012025-12-310001045609us-gaap:DesignatedAsHedgingInstrumentMemberus-gaap:NetInvestmentHedgingMembercurrency:GBPus-gaap:ForeignExchangeContractMember2025-12-310001045609currency:CAD2024-12-310001045609pld:ClassACapitalMembersrt:PartnershipInterestMemberus-gaap:LimitedPartnerMember2024-01-012024-12-310001045609srt:WeightedAverageMembersrt:AsiaMemberus-gaap:OtherInvesteesMemberpld:UnconsolidatedCoInvestmentVenturesMember2024-12-310001045609currency:GBP2025-12-310001045609pld:PrologisChinaLogisticsVentureMemberpld:UnconsolidatedCoInvestmentVenturesMember2024-12-310001045609us-gaap:DesignatedAsHedgingInstrumentMembercurrency:CADus-gaap:NetInvestmentHedgingMemberus-gaap:ForeignExchangeContractMember2025-12-310001045609pld:ClassACapitalMembersrt:PartnershipInterestMemberus-gaap:LimitedPartnerMember2022-12-310001045609pld:CommonCapitalMembersrt:PartnershipInterestMemberus-gaap:LimitedPartnerMember2025-01-012025-12-310001045609pld:SanFranciscoBayAreaMemberpld:UnitedStatesMarketsMemberpld:OperatingPropertiesMembercountry:US2025-01-012025-12-310001045609pld:OtherCountriesMember2025-01-012025-12-310001045609us-gaap:OperatingSegmentsMemberpld:StrategicCapitalSegmentMember2025-12-310001045609pld:GlobalCreditFacility2023Member2025-12-310001045609us-gaap:BuildingAndBuildingImprovementsMember2025-12-310001045609pld:OtherConsolidatedEntitiesMember2025-12-310001045609pld:MorganStanleyCapitalInternationalMSCIUSREITMemberpld:PerformanceStockUnitsMember2025-01-012025-12-310001045609srt:PartnershipInterestMemberpld:CommonUnitsMember2023-01-012023-12-310001045609us-gaap:DesignatedAsHedgingInstrumentMembercurrency:USDus-gaap:CashFlowHedgingMemberus-gaap:InterestRateContractMember2025-01-012025-12-310001045609pld:UnconsolidatedCoInvestmentVenturesMembersrt:EuropeMember2023-01-012023-12-310001045609pld:RealEstateOperationsSegmentMemberus-gaap:OperatingSegmentsMemberpld:OtherAmericasMember2024-01-012024-12-310001045609us-gaap:NondesignatedMemberus-gaap:ForeignExchangeContractMembersrt:OtherCurrencyMember2022-12-310001045609pld:MarchTwentySeventeenYenSeniorTermLoanMembercurrency:JPY2024-12-310001045609pld:PrologisPromotePlanMembersrt:MaximumMember2025-01-012025-12-310001045609pld:LongTermIncentivePlanUnitsMember2024-12-310001045609pld:ClassACapitalMember2025-12-310001045609pld:OperatingPropertiesMembercountry:MXpld:OtherAmericasMarketsMember2025-12-310001045609pld:ClassACapitalMembersrt:PartnershipInterestMemberus-gaap:LimitedPartnerMember2024-12-310001045609pld:UnitedStatesMarketsMemberpld:OperatingPropertiesMemberpld:AtlantaMembercountry:US2025-01-012025-12-310001045609pld:AccumulatedGainLossOnNetInvestmentHedgesMember2025-12-310001045609currency:CNYpld:TwoThousandTwentyThreeChineseSeniorTermLoanMember2024-12-310001045609us-gaap:OperatingSegmentsMemberpld:StrategicCapitalSegmentMemberpld:OtherAmericasMember2025-01-012025-12-310001045609pld:DevelopmentPortfolioMemberpld:EuropeMarketsMembercountry:PL2025-12-310001045609pld:UnitedStatesMarketsMemberpld:OperatingPropertiesMemberpld:SanAntonioMembercountry:US2025-12-310001045609pld:PrologisEuroFinanceLLCMember2018-07-012018-07-310001045609us-gaap:DesignatedAsHedgingInstrumentMembercurrency:CADus-gaap:CashFlowHedgingMemberus-gaap:InterestRateContractMember2024-12-310001045609us-gaap:NondesignatedMemberus-gaap:ForeignExchangeContractMember2025-01-012025-12-310001045609pld:JuneTwentyTwentyTwoYenSeniorTermLoanTrancheTwoMembercurrency:JPY2025-12-310001045609us-gaap:DesignatedAsHedgingInstrumentMemberus-gaap:CashFlowHedgingMemberus-gaap:InterestRateContractMember2025-12-310001045609pld:UnitedStatesMarketsMemberpld:OperatingPropertiesMemberpld:OrlandoMembercountry:US2025-01-012025-12-310001045609pld:CreditFacilitiesAndCommercialPaperMember2024-01-012024-12-310001045609currency:EURpld:TwoThousandTwentyFourEuroSeniorTermLoanMember2025-01-012025-12-310001045609pld:UnitedStatesMarketsMemberpld:OperatingPropertiesMemberpld:RaleighDurhamMembercountry:US2025-01-012025-12-310001045609pld:TermLoansAndOtherDebtMember2024-12-310001045609us-gaap:OperatingSegmentsMemberpld:StrategicCapitalSegmentMember2023-01-012023-12-310001045609us-gaap:LimitedPartnerMember2024-04-012024-06-300001045609us-gaap:NondesignatedMemberus-gaap:ForeignExchangeContractMembercurrency:JPY2025-01-012025-12-310001045609us-gaap:NoncontrollingInterestMember2024-01-012024-12-310001045609us-gaap:DesignatedAsHedgingInstrumentMembercurrency:EURus-gaap:CashFlowHedgingMemberus-gaap:InterestRateContractMember2023-01-012023-12-310001045609pld:UnitedStatesMarketsMemberpld:OperatingPropertiesMemberpld:SouthernCaliforniaMembercountry:US2025-12-3100010456092024-10-012024-12-310001045609currency:EURpld:TwoThousandTwentyFourEuroSeniorTermLoanMember2025-12-310001045609srt:PartnershipInterestMemberus-gaap:NoncontrollingInterestMember2025-12-310001045609pld:UnitedStatesMarketsMemberpld:OperatingPropertiesMemberpld:OrlandoMembercountry:US2025-12-310001045609us-gaap:NondesignatedMemberus-gaap:ForeignExchangeContractMember2025-12-310001045609us-gaap:LineOfCreditMember2025-12-310001045609pld:OperatingPropertiesMembersrt:MaximumMember2025-12-310001045609pld:StrategicCapitalSegmentMember2025-12-310001045609currency:EURus-gaap:NondesignatedMemberus-gaap:ForeignExchangeContractMember2023-01-012023-12-310001045609pld:ClassACapitalMember2024-01-012024-12-310001045609srt:AsiaMemberpld:UnconsolidatedCoInvestmentVenturesMember2025-01-012025-12-310001045609us-gaap:AdditionalPaidInCapitalMember2025-12-310001045609currency:CADsrt:WeightedAverageMemberpld:IssuanceOfSeniorNotesMemberpld:FebruaryTwoThousandAndThirtyTwoSeniorNotesMember2025-01-012025-12-310001045609srt:MinimumMemberpld:TwoThousandTwentyFourToTwoThousandTwentySixPerformancePeriodsMemberpld:PerformanceStockUnitPlanMember2025-01-012025-12-310001045609us-gaap:DesignatedAsHedgingInstrumentMemberpld:CanadianDollarSeniorNotesMember2023-12-310001045609currency:CADus-gaap:NondesignatedMemberus-gaap:ForeignExchangeContractMember2025-12-310001045609us-gaap:LandMember2024-12-310001045609currency:GBPus-gaap:NondesignatedMemberus-gaap:ForeignExchangeContractMember2023-12-3100010456092025-01-012025-03-310001045609country:JPpld:OperatingPropertiesMemberpld:AsiaMarketsMember2025-12-310001045609pld:CommonCapitalMembersrt:PartnershipInterestMemberus-gaap:LimitedPartnerMember2022-12-310001045609us-gaap:AdditionalPaidInCapitalMember2022-12-310001045609us-gaap:DesignatedAsHedgingInstrumentMemberus-gaap:NetInvestmentHedgingMemberus-gaap:ForeignExchangeContractMember2025-12-310001045609pld:PropertiesUnderDevelopmentMember2025-12-310001045609us-gaap:SeniorNotesMember2024-12-310001045609us-gaap:AccumulatedGainLossNetCashFlowHedgeParentMember2023-12-310001045609pld:TermLoansAndOtherDebtMember2025-12-310001045609us-gaap:DesignatedAsHedgingInstrumentMember2025-01-012025-12-310001045609pld:OperatingPropertiesMemberpld:EuropeMarketsMembercountry:PL2025-12-310001045609pld:UnitedStatesMarketsMemberpld:OperatingPropertiesMemberpld:ChicagoMembercountry:US2025-01-012025-12-310001045609pld:OperatingPropertiesMembercountry:ESpld:EuropeMarketsMember2025-12-310001045609pld:DevelopmentPortfolioMemberpld:UnitedStatesMarketsMemberpld:SouthernCaliforniaMembercountry:US2025-01-012025-12-310001045609srt:WeightedAverageMemberus-gaap:OtherInvesteesMemberpld:UnconsolidatedCoInvestmentVenturesMember2024-12-310001045609currency:CNYpld:TwoThousandTwentyThreeChineseSeniorTermLoanMember2025-12-310001045609us-gaap:NondesignatedMemberus-gaap:ForeignExchangeContractMembersrt:OtherCurrencyMember2023-12-310001045609us-gaap:CommonStockMember2022-12-310001045609pld:UnitedStatesMarketsMemberpld:OperatingPropertiesMembercountry:USpld:NewJerseyNewYorkCityMember2025-01-012025-12-310001045609pld:AccumulatedDebtDesignatedAsNonDerivativeNetInvestmentHedgesMember2025-12-310001045609pld:DepreciableAndLandImprovementsMembersrt:MaximumMember2025-12-310001045609currency:EURpld:TwoThousandTwentyFourEuroSeniorTermLoanMember2024-12-310001045609currency:EURus-gaap:NondesignatedMemberus-gaap:ForeignExchangeContractMember2025-01-012025-12-310001045609pld:MarchTwentyNineteenYenSeniorTermLoanMembercurrency:JPY2025-01-012025-12-310001045609us-gaap:NondesignatedMemberus-gaap:ForeignExchangeContractMembercurrency:JPY2023-01-012023-12-310001045609pld:RealEstateOperationsSegmentMembersrt:AsiaMemberus-gaap:OperatingSegmentsMember2024-01-012024-12-310001045609us-gaap:DesignatedAsHedgingInstrumentMemberus-gaap:NetInvestmentHedgingMembercurrency:GBPus-gaap:ForeignExchangeContractMember2024-01-012024-12-310001045609pld:DevelopmentPortfolioMembercountry:MXpld:OtherAmericasMarketsMember2025-12-310001045609pld:OtherAmericasMemberpld:UnconsolidatedCoInvestmentVenturesMember2025-01-012025-12-310001045609pld:UnitedStatesMarketsMemberpld:OperatingPropertiesMembercountry:USpld:PhoenixMember2025-12-310001045609us-gaap:OperatingSegmentsMembersrt:AsiaMemberpld:StrategicCapitalSegmentMember2025-12-310001045609us-gaap:SegmentDiscontinuedOperationsMember2023-01-012023-12-310001045609pld:UnitedStatesMarketsMemberpld:DevelopmentPortfolioMemberpld:HoustonMembercountry:US2025-12-310001045609pld:GlobalFacilityAnd2025GlobalFacilityMember2025-12-310001045609us-gaap:CorporateNonSegmentMember2024-12-310001045609pld:TwoPointTwoFiveZeroPercentNotesDueTwoThousandTwentyNineMemberpld:PrologisLimitedPartnershipMember2025-01-012025-12-310001045609pld:CommonUnitsMember2025-01-012025-12-310001045609pld:PrologisIncMember2025-12-310001045609srt:PartnershipInterestMemberpld:CommonUnitsMember2024-01-012024-12-310001045609us-gaap:AccumulatedDistributionsInExcessOfNetIncomeMember2022-12-310001045609pld:OperatingPropertiesMembercountry:ESpld:EuropeMarketsMember2025-01-012025-12-310001045609us-gaap:NondesignatedMemberus-gaap:ForeignExchangeContractMember2024-01-012024-12-310001045609us-gaap:NondesignatedMemberus-gaap:ForeignExchangeContractMembercurrency:JPY2024-12-310001045609pld:JanuaryTwentyNineteenYenSeniorTermLoanMembercurrency:JPY2025-12-310001045609us-gaap:AccumulatedTranslationAdjustmentMember2022-12-310001045609srt:MaximumMember2025-12-310001045609srt:MaximumMemberpld:CapitalImprovementsMember2025-12-310001045609pld:JanuaryTwentyNineteenYenSeniorTermLoanMembercurrency:JPY2025-01-012025-12-310001045609pld:ChinaAMCPrologisLogisticsREITMember2025-12-310001045609currency:EURpld:IssuanceOfSeniorNotesMembersrt:MaximumMemberpld:SeptemberTwoThousandAndThirtyTwoToSeptemberTwoThousandAndThirtySevenSeniorNotesMember2025-01-012025-12-310001045609pld:OtherConsolidatedEntitiesMember2025-01-012025-12-310001045609pld:CommonCapitalMembersrt:PartnershipInterestMemberus-gaap:LimitedPartnerMember2024-01-012024-12-310001045609pld:JuneTwentyTwentyTwoYenSeniorTermLoanTrancheTwoMembercurrency:JPY2025-01-012025-12-310001045609pld:UnitedStatesMarketsMemberpld:TampaMemberpld:OperatingPropertiesMembercountry:US2025-12-310001045609country:US2025-01-012025-12-310001045609pld:TwoThousandTwentyFourYenSeniorTermLoanMembercurrency:JPY2024-12-310001045609pld:PrologisJapanCoreLogisticsFundMember2024-12-310001045609pld:UnitedStatesMarketsMemberpld:OperatingPropertiesMemberpld:CentralPAMembercountry:US2025-01-012025-12-310001045609us-gaap:OperatingSegmentsMemberpld:StrategicCapitalSegmentMembersrt:EuropeMember2024-01-012024-12-310001045609pld:TermLoansAndOtherDebtMember2025-01-012025-12-310001045609pld:AccumulatedGainLossOnNetInvestmentHedgesMember2023-12-310001045609pld:RealEstateOperationsSegmentMemberus-gaap:OperatingSegmentsMembersrt:EuropeMember2025-01-012025-12-310001045609currency:EURpld:IssuanceOfSeniorNotesMemberpld:SeptemberTwoThousandAndThirtyTwoToSeptemberTwoThousandAndThirtySevenSeniorNotesMember2025-12-310001045609us-gaap:LimitedPartnerMember2024-10-012024-12-310001045609us-gaap:DesignatedAsHedgingInstrumentMemberus-gaap:NetInvestmentHedgingMembercurrency:GBPus-gaap:ForeignExchangeContractMember2025-01-012025-12-310001045609pld:OperatingPropertiesMembercountry:CZpld:EuropeMarketsMember2025-01-012025-12-310001045609us-gaap:SegmentContinuingOperationsMember2025-01-012025-12-310001045609pld:AccumulatedDebtDesignatedAsNonDerivativeNetInvestmentHedgesMember2023-01-012023-12-310001045609pld:UnitedStatesMarketsMemberpld:OperatingPropertiesMemberpld:SouthFloridaMembercountry:US2025-12-3100010456092024-01-012024-03-310001045609srt:PartnershipInterestMember2024-01-012024-12-310001045609us-gaap:GeneralPartnerMemberpld:CommonCapitalMembersrt:PartnershipInterestMember2024-12-310001045609pld:ClassACapitalMembersrt:PartnershipInterestMember2025-01-012025-12-310001045609pld:JuneTwentyTwentyTwoYenSeniorTermLoanTrancheOneMembercurrency:JPY2025-01-012025-12-310001045609pld:JanuaryTwentyNineteenYenSeniorTermLoanTrancheOneMembercurrency:JPY2025-01-012025-12-310001045609us-gaap:SecuredDebtMember2024-01-012024-12-310001045609pld:TwoThousandTwentyFourYenSeniorTermLoanMembercurrency:JPY2025-01-012025-12-310001045609country:JPpld:DevelopmentPortfolioMemberpld:AsiaMarketsMember2025-01-012025-12-310001045609pld:UnitedStatesMarketsMemberpld:OperatingPropertiesMemberpld:CentralPAMembercountry:US2025-12-310001045609pld:TwoThousandTwentyThreeYenSeniorTermLoanMembercurrency:JPY2025-01-012025-12-310001045609country:DEpld:OperatingPropertiesMemberpld:EuropeMarketsMember2025-01-012025-12-310001045609pld:UnitedStatesMarketsMemberpld:OperatingPropertiesMemberpld:PhoenixMembercountry:US2025-01-012025-12-310001045609pld:ClassACapitalMembersrt:PartnershipInterestMember2023-01-012023-12-310001045609us-gaap:DesignatedAsHedgingInstrumentMemberus-gaap:NetInvestmentHedgingMemberus-gaap:ForeignExchangeContractMember2023-01-012023-12-310001045609pld:CommonCapitalMembersrt:PartnershipInterestMember2025-12-310001045609pld:OperatingPropertiesMemberpld:AsiaMarketsMember2025-12-310001045609pld:DevelopmentPortfolioMemberpld:EuropeMarketsMembercountry:GB2025-12-310001045609pld:RealEstateOperationsSegmentMemberus-gaap:OperatingSegmentsMembersrt:AsiaMember2025-12-310001045609us-gaap:GeneralPartnerMemberpld:PreferredCapitalMembersrt:PartnershipInterestMember2023-12-310001045609pld:OperatingPropertiesMembercountry:NLpld:EuropeMarketsMember2025-01-012025-12-310001045609pld:OperatingPropertiesMemberpld:EuropeMarketsMembercountry:FR2025-01-012025-12-310001045609us-gaap:DesignatedAsHedgingInstrumentMembercurrency:CADus-gaap:NetInvestmentHedgingMemberus-gaap:ForeignExchangeContractMember2023-01-012023-12-3100010456092025-10-012025-12-310001045609us-gaap:NondesignatedMemberus-gaap:OptionMembercurrency:MXN2025-12-310001045609srt:OtherCurrencyMember2025-12-310001045609pld:LimitedPartnersInPrologisLPMember2024-12-310001045609us-gaap:AccumulatedTranslationAdjustmentMember2023-12-310001045609currency:CAD2025-12-310001045609us-gaap:RestrictedStockUnitsRSUMember2023-01-012023-12-310001045609pld:PrologisSterlingFinanceLLCMember2018-10-012018-10-310001045609pld:OperatingPropertiesMemberpld:AsiaMarketsMembercountry:SG2025-01-012025-12-310001045609pld:NipponPrologisREITIncMemberpld:UnconsolidatedCoInvestmentVenturesMember2025-12-310001045609pld:AccumulatedGainLossOnNetInvestmentHedgesMember2023-01-012023-12-310001045609pld:OperatingPropertiesMembercountry:NLpld:EuropeMarketsMember2025-12-310001045609pld:AccumulatedShareOfDerivativesFromUnconsolidatedEntitiesMember2023-12-3100010456092022-12-310001045609pld:UnitedStatesMarketsMemberpld:OperatingPropertiesMemberpld:RenoMembercountry:US2025-01-012025-12-310001045609pld:OperatingPropertiesMemberpld:EuropeMarketsMembercountry:SK2025-01-012025-12-310001045609pld:DecemberTwentyTwentyTwoYenSeniorTermLoanMembercurrency:JPY2024-12-310001045609us-gaap:SeniorNotesMember2024-01-012024-12-310001045609pld:YenCreditFacilityMember2025-12-310001045609srt:AsiaMemberpld:UnconsolidatedCoInvestmentVenturesMember2024-01-012024-12-310001045609pld:PrologisChinaCoreLogisticsFundLPMemberpld:UnconsolidatedCoInvestmentVenturesMember2024-12-310001045609currency:EURus-gaap:NondesignatedMemberus-gaap:ForeignExchangeContractMember2024-12-310001045609pld:UnconsolidatedCoInvestmentVenturesMembercountry:US2025-01-012025-12-310001045609us-gaap:NondesignatedMemberus-gaap:ForeignExchangeContractMembercurrency:JPY2023-12-310001045609us-gaap:DesignatedAsHedgingInstrumentMembercurrency:CADus-gaap:CashFlowHedgingMemberus-gaap:InterestRateContractMember2025-01-012025-12-310001045609us-gaap:NondesignatedMemberus-gaap:ForeignExchangeContractMembercurrency:JPY2025-12-310001045609pld:RealEstateOperationsSegmentMemberus-gaap:OperatingSegmentsMember2025-01-012025-12-310001045609pld:UnconsolidatedEntitiesMember2025-01-012025-12-310001045609pld:UnconsolidatedEntitiesMember2023-01-012023-12-310001045609us-gaap:RestrictedStockUnitsRSUMember2024-01-012024-12-310001045609us-gaap:LimitedPartnerMember2025-07-012025-09-300001045609us-gaap:NoncontrollingInterestMember2022-12-310001045609us-gaap:NondesignatedMemberus-gaap:ForeignExchangeContractMembersrt:OtherCurrencyMember2025-12-310001045609pld:UnconsolidatedCoInvestmentVenturesMembersrt:EuropeMember2025-12-310001045609us-gaap:OperatingSegmentsMemberpld:StrategicCapitalSegmentMembercountry:US2025-01-012025-12-310001045609pld:OperatingPropertiesMemberpld:AsiaMarketsMembercountry:SG2025-12-310001045609pld:UnitedStatesMarketsMemberpld:OperatingPropertiesMemberpld:ColumbusMembercountry:US2025-01-012025-12-310001045609pld:PrologisUSLogisticsVentureMember2025-12-310001045609pld:TwoThousandTwelveLongTermIncentivePlanMember2025-12-310001045609us-gaap:SecuredDebtMembersrt:MaximumMember2025-12-310001045609pld:PerformanceStockUnitPlanMemberpld:TwoThousandTwentyFiveToTwoThousandTwentySevenPerformancePeriodsMember2025-01-012025-12-310001045609us-gaap:GeneralPartnerMemberpld:CommonCapitalMembersrt:PartnershipInterestMember2025-12-310001045609pld:UnitedStatesMarketsMemberpld:OperatingPropertiesMemberpld:SavannahMembercountry:US2025-12-310001045609pld:DevelopmentPortfolioMemberpld:UnitedStatesMarketsMemberpld:AustinMembercountry:US2025-12-310001045609pld:OperatingPropertiesMemberpld:EuropeMarketsMembercountry:BE2025-12-310001045609pld:PrologisEuropeanLogisticsFundMemberpld:UnconsolidatedCoInvestmentVenturesMember2024-12-310001045609us-gaap:DesignatedAsHedgingInstrumentMembercurrency:CADus-gaap:NetInvestmentHedgingMemberus-gaap:ForeignExchangeContractMember2023-12-310001045609pld:UnconsolidatedCoInvestmentVenturesMember2023-01-012023-12-310001045609us-gaap:CorporateNonSegmentMember2025-01-012025-12-310001045609pld:JanuaryTwoThousandAndThirtyOneToMayTwoThousandAndThirtyFiveSeniorNotesMemberpld:IssuanceOfSeniorNotesMembercurrency:USD2025-12-310001045609pld:RealEstateOperationsSegmentMemberus-gaap:OperatingSegmentsMember2023-01-012023-12-310001045609us-gaap:SeniorNotesMembersrt:MaximumMember2025-12-310001045609pld:RealEstateOperationsSegmentMemberus-gaap:OperatingSegmentsMembercountry:US2024-01-012024-12-310001045609currency:CADus-gaap:NondesignatedMemberus-gaap:ForeignExchangeContractMember2024-12-310001045609pld:UnconsolidatedCoInvestmentVenturesMember2025-01-012025-12-310001045609srt:WeightedAverageMemberus-gaap:OtherInvesteesMemberpld:UnconsolidatedCoInvestmentVenturesMembercountry:US2025-12-310001045609us-gaap:LandImprovementsMember2025-12-310001045609pld:CommonCapitalMembersrt:PartnershipInterestMemberus-gaap:LimitedPartnerMember2025-12-310001045609pld:IssuanceOfSeniorNotesMember2025-12-310001045609us-gaap:DesignatedAsHedgingInstrumentMembercurrency:CNYus-gaap:NetInvestmentHedgingMemberus-gaap:ForeignExchangeContractMember2022-12-310001045609us-gaap:CommonStockMember2023-12-310001045609pld:StandardTenantImprovementsMember2025-12-310001045609us-gaap:AccumulatedGainLossNetCashFlowHedgeParentMember2023-01-012023-12-310001045609country:JP2025-01-012025-12-310001045609pld:CreditFacilitiesAndCommercialPaperMember2025-01-012025-12-310001045609srt:WeightedAverageMemberus-gaap:OtherInvesteesMemberpld:UnconsolidatedCoInvestmentVenturesMembersrt:EuropeMember2024-12-310001045609srt:WeightedAverageMemberus-gaap:OtherInvesteesMemberpld:UnconsolidatedCoInvestmentVenturesMembersrt:EuropeMember2025-12-310001045609pld:UnitedStatesMarketsMemberpld:OperatingPropertiesMemberpld:DallasFtWorthMembercountry:US2025-12-310001045609pld:ClassACapitalMembersrt:PartnershipInterestMember2025-12-310001045609pld:JuneTwentyTwentyTwoYenSeniorTermLoanMembercurrency:JPY2024-12-310001045609us-gaap:AccumulatedDistributionsInExcessOfNetIncomeMember2025-01-012025-12-310001045609pld:StrategicCapitalSegmentMember2024-12-310001045609pld:FebruaryTwoThousandAndThirtyThreeSeniorNotesMembercurrency:CADsrt:WeightedAverageMemberpld:IssuanceOfSeniorNotesMember2025-01-012025-12-310001045609us-gaap:DesignatedAsHedgingInstrumentMemberpld:BritishPoundSterlingSeniorNotesMember2024-12-310001045609pld:TwoThousandTwentyFourToTwoThousandTwentySixPerformancePeriodsMemberpld:PerformanceStockUnitPlanMemberpld:FiftyFifthPercentileIndexMember2025-01-012025-12-310001045609pld:DecemberTwentyEighteenYenSeniorTermLoanTrancheOneMembercurrency:JPY2025-01-012025-12-310001045609us-gaap:DesignatedAsHedgingInstrumentMemberus-gaap:NetInvestmentHedgingMemberus-gaap:ForeignExchangeContractMember2023-12-310001045609pld:OutperformancePlanMember2025-01-012025-12-310001045609srt:PartnershipInterestMemberus-gaap:NoncontrollingInterestMember2024-12-310001045609us-gaap:DesignatedAsHedgingInstrumentMembercurrency:USDus-gaap:CashFlowHedgingMemberus-gaap:InterestRateContractMember2024-12-310001045609currency:GBPus-gaap:NondesignatedMemberus-gaap:ForeignExchangeContractMember2023-01-012023-12-310001045609us-gaap:AdditionalPaidInCapitalMember2024-01-012024-12-310001045609pld:UnitedStatesMarketsMemberpld:OperatingPropertiesMemberpld:SeattleMembercountry:US2025-01-012025-12-310001045609pld:PropertiesDevelopedMember2025-12-310001045609pld:UnconsolidatedCoInvestmentVenturesMembersrt:EuropeMember2024-12-310001045609us-gaap:NondesignatedMembercurrency:GBPus-gaap:ForeignExchangeContractMember2024-12-3100010456092024-12-310001045609pld:PerformanceStockUnitsMember2024-12-310001045609us-gaap:DesignatedAsHedgingInstrumentMemberus-gaap:NetInvestmentHedgingMembercurrency:GBPus-gaap:ForeignExchangeContractMember2022-12-310001045609pld:FIBRAMemberpld:UnconsolidatedCoInvestmentVenturesMember2024-12-310001045609pld:DevelopmentPortfolioMemberpld:EuropeMarketsMember2025-12-310001045609pld:SanFranciscoBayAreaMemberpld:DevelopmentPortfolioMemberpld:UnitedStatesMarketsMembercountry:US2025-12-310001045609us-gaap:AccumulatedTranslationAdjustmentMember2024-01-012024-12-310001045609pld:UnitedStatesMarketsMemberpld:OperatingPropertiesMemberpld:LasVegasMembercountry:US2025-12-310001045609pld:MarchTwentySeventeenYenSeniorTermLoanMembercurrency:JPY2025-12-310001045609currency:CADpld:IssuanceOfSeniorNotesMemberpld:FebruaryTwoThousandAndThirtyTwoSeniorNotesMember2025-12-310001045609pld:OperatingPropertiesMemberpld:EuropeMarketsMembercountry:BE2025-01-012025-12-310001045609pld:UnitedStatesMarketsMemberpld:OperatingPropertiesMemberpld:SavannahMembercountry:US2025-01-012025-12-310001045609pld:RealEstateOperationsSegmentMemberus-gaap:OperatingSegmentsMemberpld:OtherAmericasMember2024-12-310001045609pld:CommonCapitalMembersrt:PartnershipInterestMemberus-gaap:LimitedPartnerMember2023-12-310001045609us-gaap:LandImprovementsMember2024-12-310001045609currency:SEKus-gaap:NondesignatedMemberus-gaap:ForeignExchangeContractMember2025-12-310001045609pld:LongTermIncentivePlanUnitsMember2025-12-310001045609pld:DevelopmentPortfolioMembercountry:NLpld:EuropeMarketsMember2025-01-012025-12-310001045609pld:DecemberTwentyTwentyTwoYenSeniorTermLoanMembercurrency:JPY2025-01-012025-12-310001045609pld:ClassACapitalMember2024-01-012024-12-310001045609pld:RealEstateOperationsSegmentMemberus-gaap:OperatingSegmentsMembersrt:EuropeMember2024-12-310001045609pld:PrologisLimitedPartnershipMember2024-12-310001045609pld:UnitedStatesMarketsMemberpld:OperatingPropertiesMemberpld:ColumbusMembercountry:US2025-12-310001045609currency:USD2024-12-310001045609us-gaap:CorporateNonSegmentMember2023-01-012023-12-310001045609us-gaap:NondesignatedMember2025-01-012025-12-310001045609pld:UnitedStatesMarketsMemberpld:OperatingPropertiesMemberpld:BaltimoreMembercountry:US2025-12-310001045609pld:UnitedStatesMarketsMemberpld:DevelopmentPortfolioMemberpld:PortlandMembercountry:US2025-01-012025-12-310001045609us-gaap:DesignatedAsHedgingInstrumentMembercurrency:USDus-gaap:CashFlowHedgingMemberus-gaap:InterestRateContractMember2024-01-012024-12-310001045609pld:AccumulatedShareOfDerivativesFromUnconsolidatedEntitiesMember2024-12-310001045609pld:JanuaryTwoThousandAndThirtyOneToMayTwoThousandAndThirtyFiveSeniorNotesMembercurrency:USDpld:IssuanceOfSeniorNotesMembersrt:MaximumMember2025-01-012025-12-310001045609us-gaap:GeneralPartnerMemberpld:CommonCapitalMembersrt:PartnershipInterestMember2025-01-012025-12-310001045609pld:PrologisLimitedPartnershipMember2025-12-310001045609currency:CADus-gaap:NondesignatedMemberus-gaap:ForeignExchangeContractMember2023-12-310001045609pld:UnconsolidatedCoInvestmentVenturesMember2024-01-012024-12-310001045609pld:ClassACapitalMembersrt:PartnershipInterestMember2024-12-310001045609country:BRpld:OperatingPropertiesMemberpld:OtherAmericasMarketsMember2025-01-012025-12-310001045609pld:DevelopmentPortfolioMembercountry:MXpld:OtherAmericasMarketsMember2025-01-012025-12-310001045609pld:UnitedStatesMarketsMemberpld:DevelopmentPortfolioMemberpld:OrlandoMembercountry:US2025-01-012025-12-310001045609pld:ClassACapitalMember2015-12-310001045609country:BRpld:OperatingPropertiesMemberpld:OtherAmericasMarketsMember2025-12-310001045609pld:RealEstateOperationsSegmentMemberus-gaap:OperatingSegmentsMember2024-01-012024-12-310001045609pld:PrologisTargetedUSLogisticsFundMemberpld:UnconsolidatedCoInvestmentVenturesMember2025-12-310001045609srt:PartnershipInterestMemberpld:CommonUnitsMember2025-01-012025-12-310001045609pld:LimitedPartnersInPrologisLPMember2025-12-310001045609us-gaap:DesignatedAsHedgingInstrumentMembercurrency:CADus-gaap:NetInvestmentHedgingMemberus-gaap:ForeignExchangeContractMember2025-01-012025-12-310001045609us-gaap:AccumulatedGainLossNetCashFlowHedgeParentMember2024-01-012024-12-310001045609pld:MarchTwentySeventeenYenSeniorTermLoanTrancheTwoMembercurrency:JPY2025-12-310001045609pld:DepreciableAndLandImprovementsMembersrt:MinimumMember2025-12-310001045609pld:CreditFacilitiesAndCommercialPaperMember2024-12-310001045609us-gaap:NoncontrollingInterestMember2024-12-310001045609us-gaap:CorporateNonSegmentMember2025-12-3100010456092021-01-012021-12-310001045609pld:MarchTwentySeventeenYenSeniorTermLoanTrancheOneMembercurrency:JPY2025-01-012025-12-310001045609srt:WeightedAverageMemberus-gaap:OtherInvesteesMemberpld:UnconsolidatedCoInvestmentVenturesMember2025-12-310001045609us-gaap:SeniorNotesMember2025-01-012025-12-310001045609srt:PartnershipInterestMember2023-12-310001045609srt:PartnershipInterestMemberus-gaap:NoncontrollingInterestMember2024-01-012024-12-310001045609pld:UnitedStatesMarketsMemberpld:OperatingPropertiesMemberpld:RaleighDurhamMembercountry:US2025-12-310001045609pld:DecemberTwentyEighteenYenSeniorTermLoanMembercurrency:JPY2024-12-310001045609us-gaap:DesignatedAsHedgingInstrumentMemberus-gaap:CashFlowHedgingMemberus-gaap:InterestRateContractMember2025-01-012025-12-310001045609pld:PerformanceStockUnitsMemberpld:TwoThousandTwentyFiveToTwoThousandTwentySevenPerformancePeriodsMember2025-01-012025-12-310001045609pld:UnitedStatesMarketsMemberpld:OperatingPropertiesMemberpld:PortlandMembercountry:US2025-01-012025-12-310001045609pld:RealEstateOperationsSegmentMemberus-gaap:OperatingSegmentsMembersrt:EuropeMember2024-01-012024-12-310001045609us-gaap:CommonStockMember2025-01-012025-12-310001045609us-gaap:DesignatedAsHedgingInstrumentMemberpld:CanadianDollarSeniorNotesMember2025-12-310001045609srt:EuropeMember2025-01-012025-12-310001045609us-gaap:AccumulatedOtherComprehensiveIncomeMember2023-12-310001045609pld:LongTermIncentivePlanUnitsMember2025-01-012025-12-310001045609pld:AccumulatedDebtDesignatedAsNonDerivativeNetInvestmentHedgesMember2023-12-310001045609pld:DanielSLetterMember2025-12-310001045609pld:UnitedStatesMarketsMemberpld:OperatingPropertiesMemberpld:BaltimoreMembercountry:US2025-01-012025-12-310001045609srt:WeightedAverageMemberus-gaap:OtherInvesteesMemberpld:OtherAmericasMemberpld:UnconsolidatedCoInvestmentVenturesMember2024-12-310001045609pld:SanFranciscoBayAreaMemberpld:UnitedStatesMarketsMemberpld:OperatingPropertiesMembercountry:US2025-12-310001045609us-gaap:DesignatedAsHedgingInstrumentMemberus-gaap:CashFlowHedgingMemberus-gaap:InterestRateContractMember2024-12-310001045609us-gaap:LandMember2025-12-310001045609srt:WeightedAverageMemberus-gaap:OtherInvesteesMemberpld:UnconsolidatedCoInvestmentVenturesMemberpld:OtherAmericasMember2025-12-310001045609us-gaap:AdditionalPaidInCapitalMember2024-12-310001045609country:MX2025-12-310001045609us-gaap:CommonStockMember2023-01-012023-12-310001045609pld:DevelopmentPortfolioIncludingCostOfLandPrestabilizedMember2024-12-310001045609us-gaap:CorporateNonSegmentMember2024-01-012024-12-310001045609pld:UnitedStatesMarketsMemberpld:OperatingPropertiesMemberpld:LasVegasMembercountry:US2025-01-012025-12-310001045609pld:PrologisBrazilLogisticsVentureAndOtherJointVenturesMemberpld:UnconsolidatedCoInvestmentVenturesMember2024-12-3100010456092025-01-012025-12-310001045609currency:EURus-gaap:NondesignatedMemberus-gaap:ForeignExchangeContractMember2023-12-310001045609pld:MarchTwentySeventeenYenSeniorTermLoanTrancheTwoMembercurrency:JPY2025-01-012025-12-310001045609pld:UnitedStatesMarketsMemberpld:OperatingPropertiesMemberpld:SouthFloridaMembercountry:US2025-01-012025-12-310001045609srt:WeightedAverageMemberpld:IssuanceOfSeniorNotesMember2025-01-012025-12-310001045609us-gaap:GeneralPartnerMemberpld:PreferredCapitalMembersrt:PartnershipInterestMember2022-12-310001045609us-gaap:DesignatedAsHedgingInstrumentMembercurrency:EURus-gaap:CashFlowHedgingMemberus-gaap:InterestRateContractMember2022-12-310001045609pld:UnconsolidatedCoInvestmentVenturesMembersrt:EuropeMember2024-01-012024-12-310001045609pld:UnitedStatesMarketsMemberpld:DevelopmentPortfolioMemberpld:LasVegasMembercountry:US2025-12-310001045609us-gaap:DisposalGroupHeldforsaleNotDiscontinuedOperationsMember2025-12-310001045609pld:PerformanceStockUnitsMember2024-01-012024-12-310001045609pld:OperatingPropertiesMemberpld:OtherAmericasMarketsMembercountry:CA2025-12-310001045609pld:PrologisIncMember2025-01-012025-12-310001045609pld:RealEstateOperationsSegmentMemberus-gaap:OperatingSegmentsMember2025-12-310001045609us-gaap:DesignatedAsHedgingInstrumentMemberus-gaap:CashFlowHedgingMemberus-gaap:InterestRateContractMember2023-12-310001045609pld:AccumulatedGainLossOnNetInvestmentHedgesMember2024-01-012024-12-310001045609us-gaap:AccumulatedOtherComprehensiveIncomeMember2025-12-310001045609us-gaap:AccumulatedOtherComprehensiveIncomeMember2025-01-012025-12-310001045609country:MX2025-01-012025-12-310001045609pld:UnitedStatesMarketsMemberpld:OperatingPropertiesMemberpld:NashvilleMembercountry:US2025-12-310001045609pld:NipponPrologisREITIncMember2025-12-310001045609pld:ClassACapitalMembersrt:PartnershipInterestMemberus-gaap:LimitedPartnerMember2025-12-310001045609us-gaap:DesignatedAsHedgingInstrumentMemberus-gaap:NetInvestmentHedgingMembercurrency:GBPus-gaap:ForeignExchangeContractMember2024-12-310001045609us-gaap:DesignatedAsHedgingInstrumentMembercurrency:GBPus-gaap:CashFlowHedgingMemberus-gaap:InterestRateContractMember2024-01-012024-12-310001045609pld:UnconsolidatedCoInvestmentVenturesMembersrt:EuropeMember2025-01-012025-12-310001045609currency:CADus-gaap:NondesignatedMemberus-gaap:ForeignExchangeContractMember2022-12-310001045609us-gaap:NondesignatedMembercurrency:GBPus-gaap:ForeignExchangeContractMember2025-12-310001045609currency:CNYpld:TwoThousandTwentyThreeChineseSeniorTermLoanMember2025-01-012025-12-310001045609us-gaap:CommercialPaperMember2025-12-310001045609pld:FIBRAMember2025-12-310001045609pld:YenCreditFacilityMember2025-12-310001045609pld:UnitedStatesMarketsMemberpld:TampaMemberpld:OperatingPropertiesMembercountry:US2025-01-012025-12-310001045609pld:OutperformancePlanMemberus-gaap:ShareBasedCompensationAwardTrancheOneMember2025-01-012025-12-310001045609pld:OutperformancePlanMember2024-01-012024-12-310001045609pld:UnconsolidatedCoInvestmentVenturesMember2025-01-012025-12-310001045609pld:UnitedStatesMarketsMemberpld:OperatingPropertiesMemberpld:ChicagoMembercountry:US2025-12-310001045609pld:PrologisIncMember2024-12-310001045609pld:OctoberTwentySeventeenYenSeniorTermLoanMembercurrency:JPY2025-12-310001045609pld:OperatingPropertiesMembercountry:HUpld:EuropeMarketsMember2025-12-310001045609pld:PerformanceStockUnitsMemberpld:TwoThousandTwentyFiveToTwoThousandTwentySevenPerformancePeriodsMember2024-01-012024-12-310001045609srt:PartnershipInterestMemberpld:PreferredCapitalMember2025-12-310001045609country:JPpld:DevelopmentPortfolioMemberpld:AsiaMarketsMember2025-12-310001045609country:DEpld:DevelopmentPortfolioMemberpld:EuropeMarketsMember2025-12-310001045609us-gaap:DesignatedAsHedgingInstrumentMemberpld:BritishPoundSterlingSeniorNotesMember2023-12-3100010456092023-12-310001045609pld:AccumulatedGainLossOnNetInvestmentHedgesMember2022-12-310001045609us-gaap:RestrictedStockUnitsRSUMember2024-12-310001045609pld:NipponPrologisREITIncMemberpld:UnconsolidatedCoInvestmentVenturesMember2024-12-310001045609us-gaap:AccumulatedDistributionsInExcessOfNetIncomeMember2023-01-012023-12-310001045609us-gaap:DesignatedAsHedgingInstrumentMembercurrency:EURus-gaap:CashFlowHedgingMemberus-gaap:InterestRateContractMember2025-12-310001045609pld:AcquiredIndustrialPropertiesMembersrt:MaximumMember2025-12-310001045609pld:AccumulatedDebtDesignatedAsNonDerivativeNetInvestmentHedgesMember2022-12-310001045609currency:GBPus-gaap:NondesignatedMemberus-gaap:ForeignExchangeContractMember2025-01-012025-12-310001045609us-gaap:NondesignatedMemberus-gaap:ForeignExchangeContractMember2022-12-310001045609pld:TwoThousandTwentyThreeYenSeniorTermLoanMembercurrency:JPY2025-12-310001045609us-gaap:AccumulatedGainLossNetCashFlowHedgeParentMember2022-12-310001045609us-gaap:DesignatedAsHedgingInstrumentMemberus-gaap:NetInvestmentHedgingMemberus-gaap:ForeignExchangeContractMember2024-01-012024-12-310001045609pld:UnitedStatesMarketsMemberpld:OperatingPropertiesMemberpld:CharlotteMembercountry:US2025-01-012025-12-310001045609pld:DevelopmentPortfolioMember2025-12-310001045609pld:PerformanceStockUnitsMember2025-01-012025-12-310001045609pld:UnitedStatesMarketsMemberpld:OperatingPropertiesMemberpld:CentralValleyMembercountry:US2025-01-012025-12-310001045609us-gaap:DesignatedAsHedgingInstrumentMembercurrency:USDus-gaap:CashFlowHedgingMemberus-gaap:InterestRateContractMember2023-01-012023-12-310001045609us-gaap:DesignatedAsHedgingInstrumentMemberus-gaap:NetInvestmentHedgingMemberus-gaap:ForeignExchangeContractMember2022-12-310001045609pld:MarchTwentyNineteenYenSeniorTermLoanMembercurrency:JPY2025-12-310001045609us-gaap:DesignatedAsHedgingInstrumentMemberus-gaap:NetInvestmentHedgingMembercurrency:GBPus-gaap:ForeignExchangeContractMember2023-01-012023-12-310001045609pld:CommonCapitalMembersrt:PartnershipInterestMemberus-gaap:LimitedPartnerMember2024-12-310001045609us-gaap:DesignatedAsHedgingInstrumentMembercurrency:CNYus-gaap:NetInvestmentHedgingMemberus-gaap:ForeignExchangeContractMember2023-01-012023-12-310001045609pld:UnitedStatesMarketsMemberpld:DevelopmentPortfolioMemberpld:AtlantaMembercountry:US2025-12-310001045609srt:PartnershipInterestMember2024-12-310001045609us-gaap:CommonStockMemberpld:OtherConsolidatedEntitiesMember2025-12-310001045609us-gaap:PreferredStockMember2024-12-310001045609pld:JuneTwentyTwentyTwoYenSeniorTermLoanMembercurrency:JPY2025-12-310001045609pld:OperatingPropertiesMemberpld:EuropeMarketsMembercountry:GB2025-12-310001045609us-gaap:AccumulatedTranslationAdjustmentMember2025-01-012025-12-310001045609pld:UnitedStatesMarketsMemberpld:OperatingPropertiesMemberpld:SouthernCaliforniaMembercountry:US2025-01-012025-12-310001045609us-gaap:OperatingSegmentsMemberpld:StrategicCapitalSegmentMembercountry:US2024-01-012024-12-310001045609pld:UnitedStatesMarketsMemberpld:OperatingPropertiesMemberpld:DallasFtWorthMembercountry:US2025-01-012025-12-310001045609us-gaap:OperatingSegmentsMember2025-01-012025-12-310001045609pld:MarchTwentySeventeenYenSeniorTermLoanMembercurrency:JPY2025-01-012025-12-310001045609pld:TwoThousandTwentyFourYenSeniorTermLoanMembercurrency:JPY2025-12-310001045609pld:UnitedStatesMarketsMemberpld:DevelopmentPortfolioMemberpld:CincinnatiMembercountry:US2025-12-310001045609pld:PrologisLimitedPartnershipMember2025-01-012025-12-310001045609pld:LongTermIncentivePlanUnitsMember2024-01-012024-12-3100010456092026-02-110001045609us-gaap:AccumulatedOtherComprehensiveIncomeMember2023-01-012023-12-310001045609us-gaap:OperatingSegmentsMember2024-12-310001045609pld:UnitedStatesMarketsMemberpld:DevelopmentPortfolioMemberpld:OrlandoMembercountry:US2025-12-310001045609pld:OperatingPropertiesMemberpld:EuropeMarketsMember2025-12-310001045609pld:PrologisPromotePlanMembersrt:MinimumMember2025-01-012025-12-310001045609currency:JPY2024-12-3100010456092025-04-012025-06-300001045609pld:UnitedStatesMarketsMemberpld:DevelopmentPortfolioMemberpld:SeattleMembercountry:US2025-12-310001045609pld:GlobalCreditFacility2025Member2025-01-012025-12-310001045609us-gaap:PreferredStockMember2023-12-310001045609srt:PartnershipInterestMemberus-gaap:NoncontrollingInterestMember2025-01-012025-12-310001045609pld:AccumulatedShareOfDerivativesFromUnconsolidatedEntitiesMember2025-12-310001045609pld:CreditFacilitiesAndCommercialPaperMember2025-12-310001045609pld:RealEstateOperationsSegmentMemberus-gaap:OperatingSegmentsMembercountry:US2025-01-012025-12-310001045609us-gaap:NondesignatedMemberus-gaap:ForeignExchangeContractMembersrt:OtherCurrencyMember2023-01-012023-12-310001045609pld:ClassACapitalMember2024-12-310001045609us-gaap:CommonStockMember2025-12-310001045609pld:PrologisChinaCoreLogisticsFundLPMemberpld:UnconsolidatedCoInvestmentVenturesMember2025-12-310001045609srt:PartnershipInterestMember2023-01-012023-12-310001045609pld:UnitedStatesMarketsMemberpld:OperatingPropertiesMemberpld:PortlandMembercountry:US2025-12-31utr:acrepld:Derivativeiso4217:EURpld:Venturexbrli:pureiso4217:JPYutr:sqftpld:Continentiso4217:MXNxbrli:sharespld:Buildingiso4217:CADiso4217:CNYpld:Contractpld:Agentiso4217:JPYxbrli:sharesiso4217:CNYxbrli:sharesxbrli:sharespld:Countrypld:Segmentpld:Landpld:Propertyiso4217:USD
UNITED STATES SECURITIES AND EXCHANGE COMMISSION
Washington, D.C. 20549
FORM 10-K
|
|
|
(Mark One) |
☑ |
|
ANNUAL REPORT PURSUANT TO SECTION 13 OR 15(d) OF THE SECURITIES EXCHANGE ACT OF 1934 For the fiscal year ended December 31, 2025 |
or
|
|
|
☐ |
|
TRANSITION REPORT PURSUANT TO SECTION 13 OR 15(d) OF THE SECURITIES EXCHANGE ACT OF 1934 For the transition period from ______________ to ______________ |
Commission File Number: 001-13545 (Prologis, Inc.) 001-14245 (Prologis, L.P.)

Prologis, Inc.
Prologis, L.P.
(Exact name of registrant as specified in its charter)
|
|
Maryland (Prologis, Inc.) Delaware (Prologis, L.P.) |
94-3281941 (Prologis, Inc.) 94-3285362 (Prologis, L.P.) |
(State or other jurisdiction of incorporation or organization) |
(I.R.S. Employer Identification No.) |
|
|
Pier 1, Bay 1, San Francisco, California |
94111 |
(Address of principal executive offices) |
(Zip Code) |
(415) 394-9000
(Registrants’ telephone number, including area code)
Securities registered pursuant to Section 12(b) of the Act:
|
|
|
|
|
|
|
|
|
Title of Each Class |
|
Trading Symbol(s) |
|
Name of Each Exchange on Which Registered |
Prologis, Inc. |
|
Common Stock, $0.01 par value |
|
PLD |
|
New York Stock Exchange |
Prologis, L.P. |
|
2.250% Notes due 2029 |
|
PLD/29 |
|
New York Stock Exchange |
Prologis, L.P. |
|
5.625% Notes due 2040 |
|
PLD/40 |
|
New York Stock Exchange |
Securities registered pursuant to Section 12(g) of the Act:
Prologis, Inc. – NONE
Prologis, L.P. – NONE
Indicate by check mark if the registrant is a well-known seasoned issuer, as defined in Rule 405 of the Securities Act.
|
|
Prologis, Inc.: Yes ☑ No ☐ |
Prologis, L.P.: Yes ☑ No ☐ |
Indicate by check mark if the registrant is not required to file reports pursuant to Section 13 or Section 15(d) of the Act.
|
|
Prologis, Inc.: Yes ☐ No ☑ |
Prologis, L.P.: Yes ☐ No ☑ |
Indicate by check mark whether the registrant: (1) has filed all reports required to be filed by Section 13 or 15(d) of the Securities Exchange Act of 1934 during the preceding 12 months (or for such shorter period that the registrant was required to file such reports), and (2) has been subject to such filing requirements for the past 90 days. Prologis, Inc.: Yes ☑ No ☐ Prologis, L.P.: Yes ☑ No ☐
Indicate by check mark whether the registrant has submitted electronically every Interactive Data File required to be submitted pursuant to Rule 405 of Regulation S-T (§ 232.405 of this chapter) during the preceding 12 months (or for such shorter periods that the registrant was required to submit such files). Prologis, Inc.: Yes ☑ No ☐ Prologis, L.P.: Yes ☑ No ☐
Indicate by check mark whether the registrant is a large accelerated filer, an accelerated filer, a non-accelerated filer, a smaller reporting company, or an emerging growth company. See the definitions of “large accelerated filer,” “accelerated filer,” “smaller reporting company,” and “emerging growth company” in Rule 12b-2 of the Exchange Act:
|
|
|
|
|
|
|
Prologis, Inc.: |
☑ |
Large accelerated filer |
☐ |
Accelerated filer |
☐ |
Smaller reporting company |
|
☐ |
Non-accelerated filer |
|
☐ |
Emerging growth company |
|
|
|
|
|
|
|
Prologis, L.P.: |
☐ |
Large accelerated filer |
☐ |
Accelerated filer |
☐ |
Smaller reporting company |
|
☑ |
Non-accelerated filer |
|
☐ |
Emerging growth company |
If an emerging growth company, indicate by check mark if the registrant has elected not to use the extended transition period for complying with any new or revised financial accounting standards provided pursuant to Section 13(a) of the Exchange Act. ☐
Indicate by check mark whether the registrant has filed a report on and attestation to its management’s assessment of the effectiveness of its internal control over financial reporting under Section 404(b) of the Sarbanes-Oxley Act (15 U.S.C. 7262(b)) by the registered public accounting firm that prepared or issued its audit report. ☑
If securities are registered pursuant to Section 12(b) of the Act, indicate by check mark whether the financial statements of the registrant included in the filing reflect the correction of an error to previously issued financial statements. ☐
Indicate by check mark whether any of those error corrections are restatements that required a recovery analysis of incentive-based compensation received by any of the registrant’s executive officers during the relevant recovery period pursuant to §240.10D-1(b). ☐
Indicate by check mark whether the registrant is a shell company (as defined in Rule 12b-2 of the Act).
|
|
Prologis, Inc.: Yes ☐ No ☑ |
Prologis, L.P.: Yes ☐ No ☑ |
Based on the closing price of Prologis, Inc.’s common stock on June 30, 2025 the aggregate market value of the voting common equity held by nonaffiliates of Prologis, Inc. was $97,322,102,425.
The number of shares of Prologis, Inc.’s common stock outstanding at February 11, 2026, was approximately 929,559,000.
DOCUMENTS INCORPORATED BY REFERENCE
Portions of Part III of this report are incorporated by reference to the registrant’s definitive proxy statement for the 2026 annual meeting of its stockholders or will be provided in an amendment filed on Form 10-K/A.
Auditor Name: KPMG LLP Auditor Location: Denver, CO Auditor Firm ID: 185
EXPLANATORY NOTE
This report combines the annual reports on Form 10-K for the year ended December 31, 2025, of Prologis, Inc. and Prologis, L.P. Unless stated otherwise or the context otherwise requires, references to “Prologis, Inc.” or the “Parent” mean Prologis, Inc. and its consolidated subsidiaries; and references to “Prologis, L.P.” or the “Operating Partnership” or the “OP” mean Prologis, L.P., and its consolidated subsidiaries. The terms “the Company,” “Prologis,” “we,” “our” or “us” means the Parent and the OP collectively.
The Parent is a real estate investment trust (a “REIT”) and the general partner of the OP. At December 31, 2025, the Parent owned a 97.71% common general partnership interest in the OP and substantially all of the preferred units in the OP. The remaining 2.29% common limited partnership interests are owned by unaffiliated investors and certain current and former directors and officers of the Parent.
We operate the Parent and the OP as one enterprise. The management of the Parent consists of the same members as the management of the OP. These members are officers of the Parent and employees of the OP or one of its subsidiaries. As sole general partner, the Parent has control of the OP through complete responsibility and discretion in the day-to-day management and therefore, consolidates the OP for financial reporting purposes. Because the only significant asset of the Parent is its investment in the OP, the assets and liabilities of the Parent and the OP are the same on their respective financial statements.
We believe combining the annual reports on Form 10-K of the Parent and the OP into this single report results in the following benefits:
•enhances investors’ understanding of the Parent and the OP by enabling investors to view the business as a whole in the same manner as management views and operates the business;
•eliminates duplicative disclosure and provides a more streamlined and readable presentation as a substantial portion of the Company’s disclosure applies to both the Parent and the OP; and
•creates time and cost efficiencies through the preparation of one combined report instead of two separate reports.
It is important to understand the few differences between the Parent and the OP in the context of how we operate the Company. The Parent does not conduct business itself, other than acting as the sole general partner of the OP and issuing public equity from time to time. The OP holds substantially all the assets of the business, directly or indirectly. The OP conducts the operations of the business and is structured as a partnership with no publicly traded equity. Except for net proceeds from equity issuances by the Parent, which are contributed to the OP in exchange for partnership units, the OP generates capital required by the business through the OP’s operations, incurrence of indebtedness and issuance of partnership units to third parties.
The presentation of noncontrolling interests, stockholders’ equity and partners’ capital are the main areas of difference between the consolidated financial statements of the Parent and those of the OP. The differences in the presentations between stockholders’ equity and partners’ capital result from the differences in the equity and capital issuances in the Parent and in the OP.
The preferred stock, common stock, additional paid-in capital, accumulated other comprehensive income (loss) and distributions in excess of net earnings of the Parent are presented as stockholders’ equity in the Parent’s consolidated financial statements. These items represent the common and preferred general partnership interests held by the Parent in the OP and are presented as general partner’s capital within partners’ capital in the OP’s consolidated financial statements. The common limited partnership interests held by the limited partners in the OP are presented as noncontrolling interest within equity in the Parent’s consolidated financial statements and as limited partners’ capital within partners’ capital in the OP’s consolidated financial statements.
To highlight the differences between the Parent and the OP, separate sections in this report, as applicable, individually discuss the Parent and the OP, including separate financial statements and separate Exhibit 31 and 32 certifications. In the sections that combine disclosure of the Parent and the OP, this report refers to actions or holdings as being actions or holdings of Prologis.
The statements in this report that are not historical facts are forward-looking statements within the meaning of Section 27A of the Securities Act of 1933, as amended, and Section 21E of the Securities Exchange Act of 1934, as amended. These forward-looking statements are based on current expectations, estimates and projections about the industry and markets in which we operate as well as management’s beliefs and assumptions. Such statements involve uncertainties that could significantly impact our financial results. Words such as “expects,” “anticipates,” “intends,” “plans,” “believes,” “seeks,” “aims,” and “estimates,” including variations of such words and similar expressions, are intended to identify such forward-looking statements, which generally are not historical in nature. All statements that address operating performance, events or developments that we expect or anticipate will occur in the future — including statements relating to rent and occupancy growth, acquisition and development activity, including data center developments and power procurement related thereto, contribution and disposition activity, general conditions in the geographic areas where we operate, expectations regarding new lines of business, our debt, capital structure and financial position, our ability to earn revenues from co-investment ventures or form new co-investment ventures and the availability of capital in existing or new co-investment ventures — are forward-looking statements. These statements are not guarantees of future performance and involve certain risks, uncertainties and assumptions that are difficult to predict. Although we believe the expectations reflected in any forward-looking statements are based on reasonable assumptions, we can give no assurance that our expectations will be attained, and therefore actual outcomes and results may differ materially from what is expressed or forecasted in such forward-looking statements. Some of the factors that may affect outcomes and results include, but are not limited to: (i) international, national, regional and local economic and political climates and conditions; (ii) changes in global financial markets, interest rates and foreign currency exchange rates; (iii) increased or unanticipated competition for our properties; (iv) risks associated with acquisitions, dispositions and development of properties, including the integration of the operations of significant real estate portfolios; (v) maintenance of Real Estate Investment Trust (“REIT”) status, tax structuring and changes in income tax laws and rates; (vi) availability of financing and capital, the levels of debt that we maintain and our credit ratings; (vii) risks related to our investments in and management of our co-investment ventures, including our ability to establish new co-investment ventures; (viii) risks of doing business internationally, including currency risks; (ix) environmental uncertainties, including risks of natural disasters; and (x) those additional factors discussed under Part I, Item 1A. Risk Factors in this report. We undertake no duty to update any forward-looking statements appearing in this report except as may be required by law.
PART I
ITEM 1. Business
Prologis, Inc. is a self-administered and self-managed REIT and is the sole general partner of Prologis, L.P. through which it holds substantially all of its assets. We operate Prologis, Inc. and Prologis, L.P. as one enterprise and, therefore, our discussion and analysis refers to Prologis, Inc. and its consolidated subsidiaries, including Prologis, L.P. We invest in real estate through wholly owned subsidiaries and other entities through which we co-invest with partners and investors ("co-investment ventures"). We have a significant ownership interest in the co-investment ventures, which are either consolidated or unconsolidated based on our level of control of the entity.
Prologis, Inc. began operating as a fully integrated real estate company in 1997 and elected to be taxed as a REIT under the Internal Revenue Code of 1986, as amended (“Internal Revenue Code” or “IRC”). We believe the current organization and method of operation enable Prologis, Inc. to maintain its status as a REIT. Prologis, L.P. was also formed in 1997.
We operate, manage and measure the operating performance of our properties on an owned and managed (“O&M”) basis. Our O&M portfolio includes our consolidated properties as well as properties owned by our unconsolidated co-investment ventures, which we manage. We make operating decisions based on our total O&M portfolio as we manage the properties without regard to their ownership. We also evaluate our results based on our proportionate economic ownership of each property included in the O&M portfolio (“our share”).
Included in our discussion below are references to funds from operations (“FFO”) and net operating income (“NOI”), neither of which are United States (“U.S.”) generally accepted accounting principles (“GAAP”). See Item 7. Management’s Discussion and Analysis of Financial Condition and Results of Operations for a reconciliation of Net Earnings Attributable to Common Stockholders/Unitholders in the Consolidated Statements of Income to our FFO measures and a reconciliation of NOI to Operating Income in the Consolidated Statements of Income, the most directly comparable GAAP measures.
Our corporate headquarters is located at Pier 1, Bay 1, San Francisco, California 94111, and our other principal office locations are in Amsterdam, Denver, Mexico City, Sao Paulo, Shanghai, Singapore and Tokyo.
Our Internet address is www.prologis.com. All reports required to be filed with the Securities and Exchange Commission (“SEC”) are available and can be accessed free of charge through the Investor Relations section of our website. The common stock of Prologis, Inc. is listed on the New York Stock Exchange (“NYSE”) under the ticker “PLD” and is a component of the Standard & Poor’s (“S&P”) 500.
THE COMPANY
Prologis is the global leader in logistics real estate, operating in high-barrier, high-growth markets across 20 countries on four continents. Our portfolio is concentrated in key commercial hubs, strategically located near end consumers to enable the efficient flow
of goods. We own, manage and develop high-quality logistics facilities and deliver integrated infrastructure solutions that optimize how our customers operate within our buildings. Our services address the evolving needs of modern supply chains, including the growing convergence of physical, digital and energy infrastructure, as logistics facilities increasingly support power and data-intensive operations. Consistent with this strategy, we are leveraging our development capabilities, energy solutions and strategic locations to deliver digital infrastructure requirements through selective development of data centers.
Logistics real estate demand is driven by the essential role supply chains play in the global economy and heightened by several long-term structural factors. These include: (i) customers repositioning their supply chains to meet rising e-commerce penetration and service expectations; (ii) growth in global consumption; (iii) an increased focus on supply chain efficiency and resiliency; and (iv) the need for modern, well-located facilities to support evolving distribution and fulfillment requirements. We believe these factors will continue to support demand for logistics space and relatively low vacancy rates over the long term. In the near term, while economic uncertainty related to trade tensions and shifting policies has increased, our proprietary metrics and customer dialogue indicate that customers are engaged and moving forward with real estate decisions.
Our teams actively manage our portfolio by delivering comprehensive real estate services, including leasing, property management, development, acquisition and disposition expertise. We invest significant capital into new properties through acquisition and development activity, including build-to-suit development, speculative development and redevelopment of properties into industrial properties and data centers. Proceeds from property dispositions, typically through contributions of newly developed properties to our co-investment ventures, data center sales or sales of non-strategic assets to third parties, allow us to recycle capital back into our ongoing investment activities, providing the ability to realize long-term value creation.
While the majority of our properties in the U.S. are wholly owned, we also hold significant ownership interest in properties both in the U.S. and internationally through our investment in co-investment ventures. Partnering with many of the world’s largest institutional investors through co-investment ventures broadens our access to capital, and allows us to expand our investment capacity and enhance and diversify our returns, while mitigating our exposure to foreign currency movements.
Our scale and customer-focused strategy have driven us to expand the services we offer. Our 1.3 billion square foot portfolio serves as the foundation for a comprehensive platform of solutions that address the challenges our customers face in global fulfillment today. Through Prologis Essentials, we deliver solutions to support our customers’ operational, energy and sustainability needs. Our customer experience teams, proprietary technology and strategic partnerships are central to every aspect of the Prologis Essentials platform. These resources allow us to provide customers with differentiated insights and infrastructure solutions to help them advance sustainability goals and improve operational efficiency. We have more than 1 gigawatt of solar generation and storage capacity on our O&M portfolio, including Prologis and third-party owned projects. In addition, the principles of environmental, social and governance ("ESG") are embedded in our business strategy through an integrated approach to global impact and sustainability, which we believe creates value for our customers, investors, employees and communities.
Our Global Presence
At December 31, 2025, we owned or had investments in, on a wholly owned basis or through co-investment ventures, properties and development projects expected to total approximately 1.3 billion square feet across the following geographies:
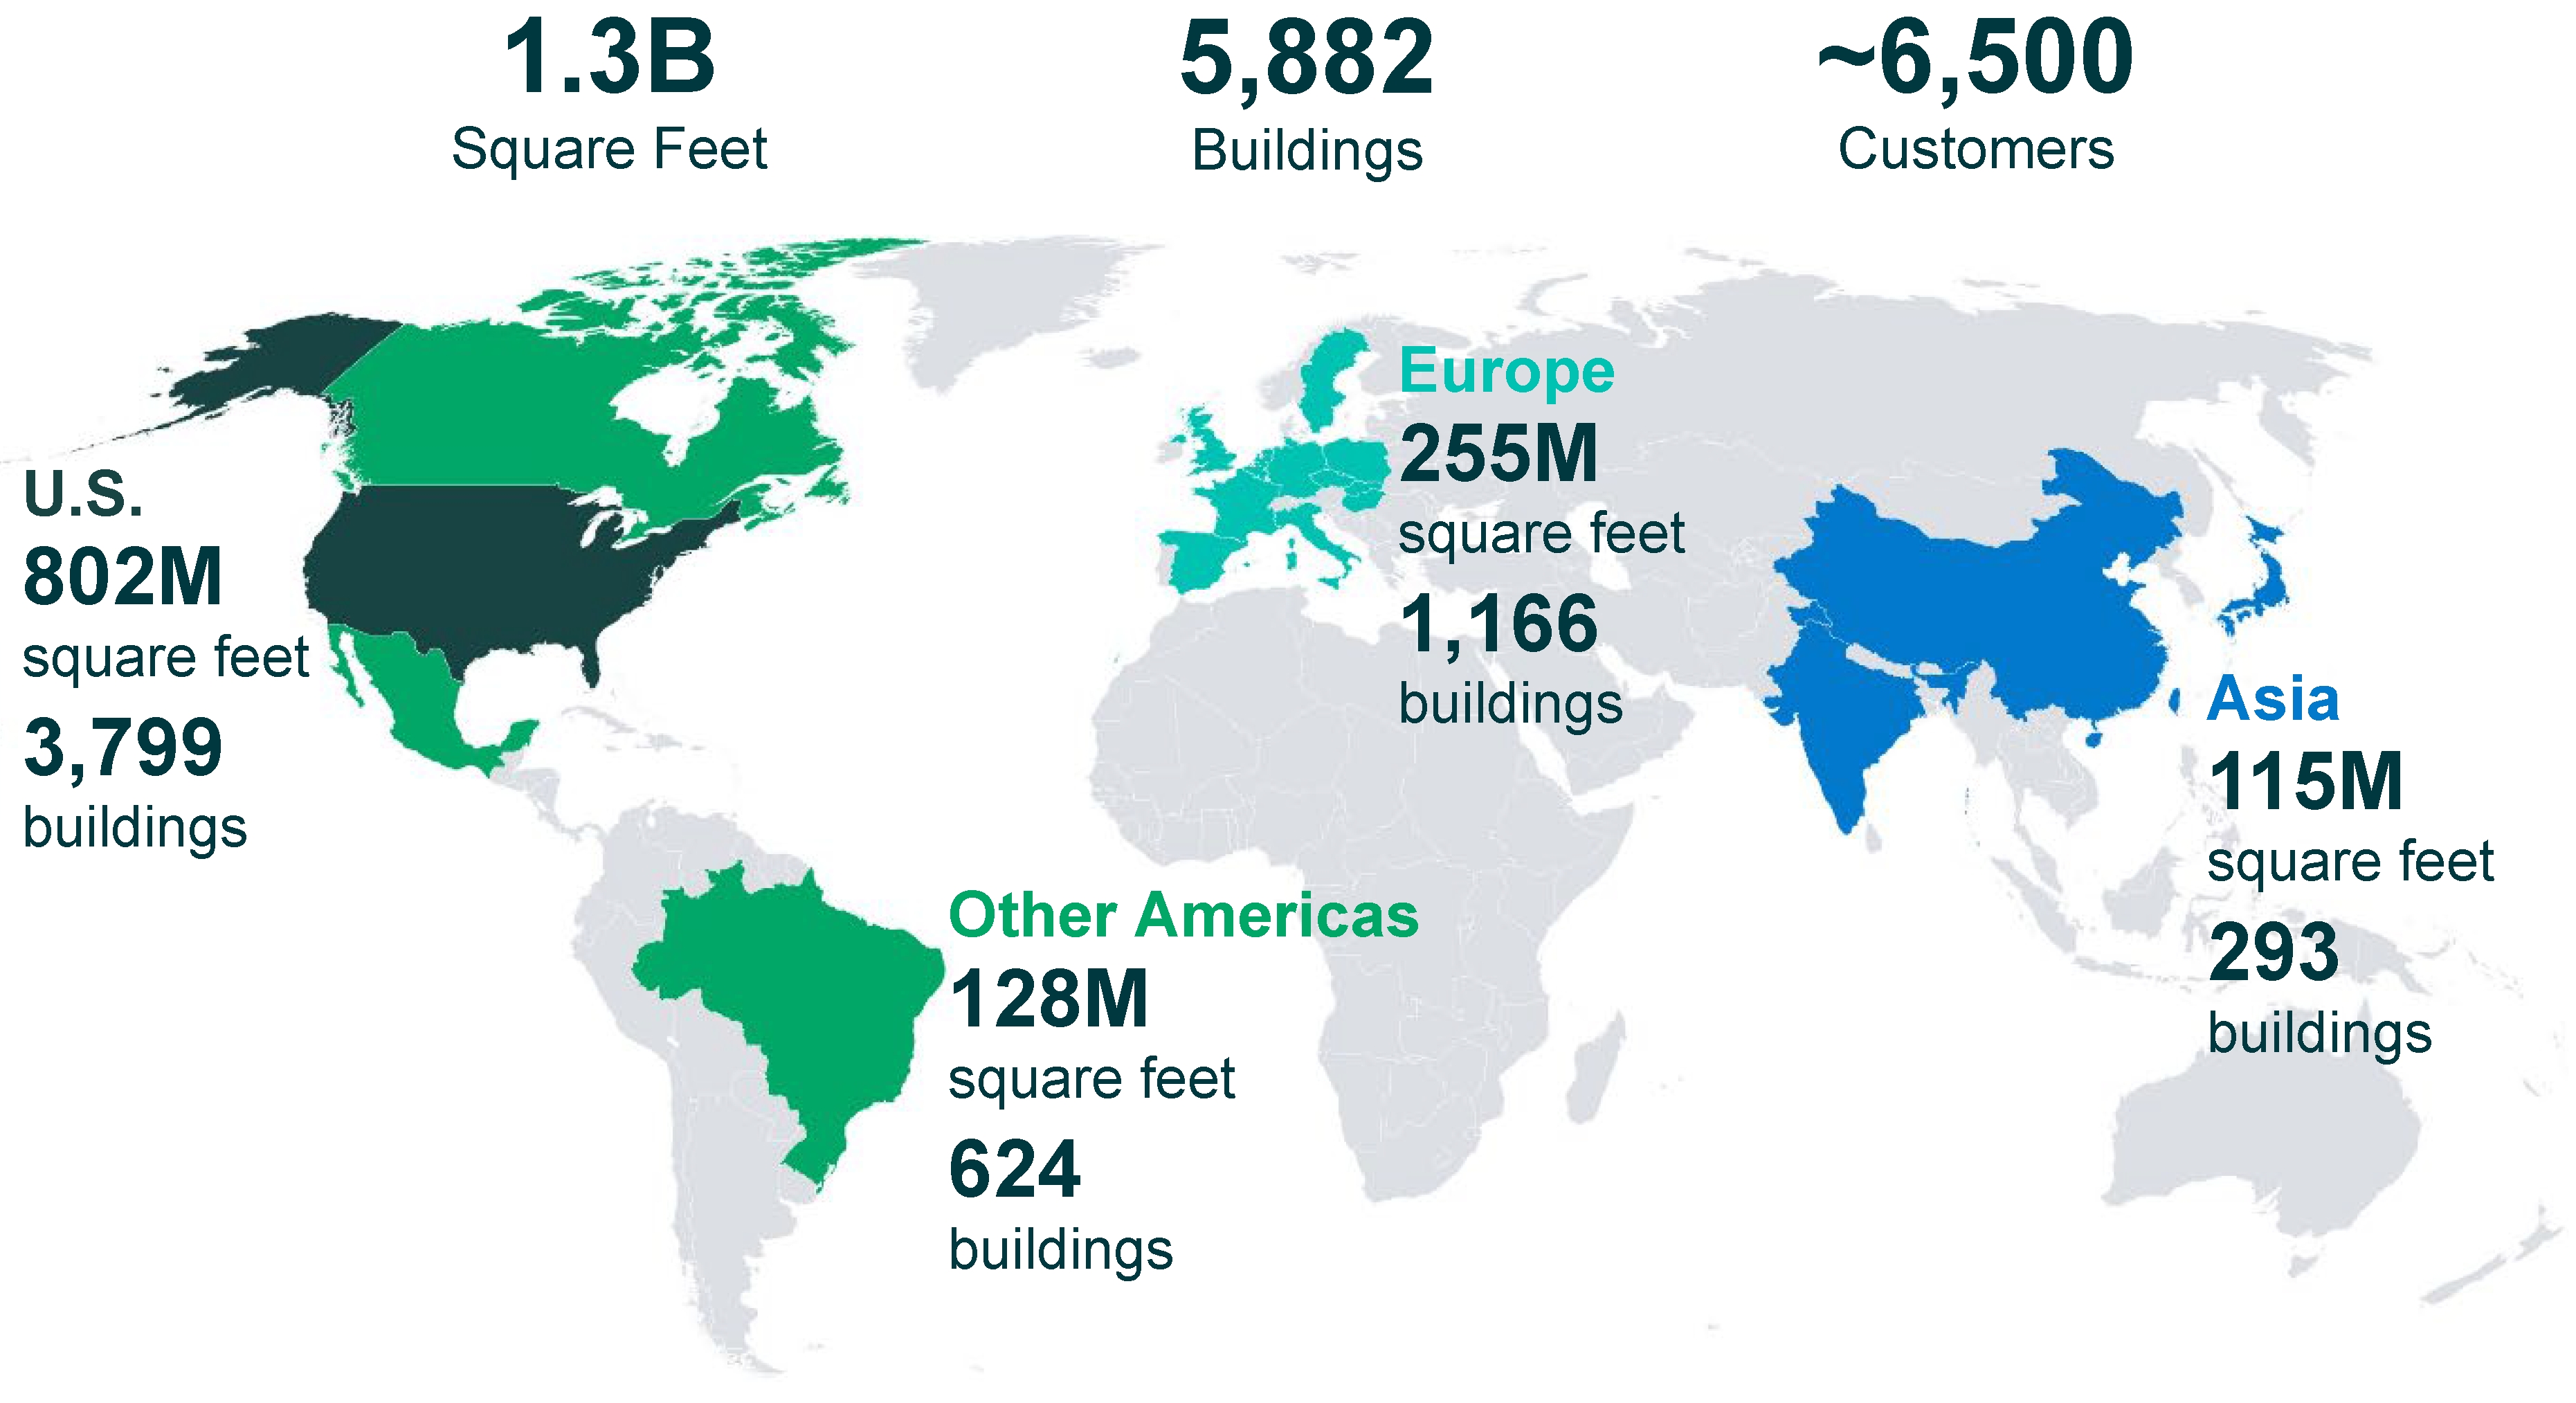
Throughout this discussion, amounts are presented in U.S. dollars, our reporting currency. Included in these amounts are consolidated and unconsolidated investments denominated in foreign currencies, principally the British pound sterling, Canadian dollar, euro and Japanese yen that are impacted by fluctuations in exchange rates when translated to U.S. dollars. We mitigate our exposure to foreign currency fluctuations by investing outside the U.S. through co-investment ventures, borrowing in the functional currency of our subsidiaries and utilizing derivative financial instruments.
REPORTABLE SEGMENTS
Our business comprises two reportable segments: Real Estate (Rental Operations and Development) and Strategic Capital.
Below is information summarizing consolidated activity within our segments over the last three years (in millions):
(1)NOI from the Real Estate Segment is calculated directly from the Consolidated Financial Statements as Rental Revenues and Development Management and Other Revenues less Rental Expenses and Other Expenses. NOI from the Strategic Capital Segment is calculated directly from the Consolidated Financial Statements as Strategic Capital Revenues less Strategic Capital Expenses.
(2)A developed property moves into the operating portfolio when it meets our definition of stabilization, which is the earlier of when a property that was developed has been completed for one year or is 90% occupied. Amounts represent our total expected
investment (“TEI”) upon stabilization, which includes the estimated cost of development or expansion, including land, construction and leasing costs.
(3)Net promote income (expense) is promote revenue earned from third-party investors during the period, net of related cash and stock compensation expenses, and taxes and foreign currency derivative gains and losses, if applicable. In 2025, we had net promote expense primarily from amortization of stock compensation issued to employees related to promote income recognized in prior periods.
Real Estate Segment
Rental Operations. Rental operations comprise the largest component of our reportable segments and generally contributes 90% to 95% of our consolidated revenues, earnings and FFO. We collect rent from our customers through operating leases, including reimbursements for the majority of our property operating costs. Through our global footprint, we have a diversified lease portfolio and our revenues from in-place leases are contractual with fixed or inflation-linked escalations. For leases commenced in 2025, the weighted average lease term in our consolidated operating portfolio was 70 months. We expect to generate earnings growth by increasing rents, maintaining high occupancy rates and controlling expenses. The primary driver of our revenue growth will be the rolling of in-place leases to current market rents upon lease expiration. We believe our active portfolio management, combined with the skills of our property management, maintenance, energy, sustainability and risk management teams allow us to maximize NOI across our portfolio. Substantially all of our consolidated rental revenue, NOI and cash flows from rental operations are generated in the U.S.
Development. Our development business provides the opportunity to profitably build modern logistics facilities that address the evolving requirements of our customers while deepening our presence in our target markets. We are also selectively expanding our development activities to include data centers in certain markets, by focusing on procuring power and securing build-to-suit lease transactions. We believe we have a competitive advantage due to: (i) the strategic locations of our buildings and land sites; (ii) the multidisciplinary expertise of our teams; (iii) the depth of our customer relationships; (iv) our ability to secure and grow access to power; (v) our procurement capabilities that enable us to secure high-demand data center equipment; and (vi) our ability to procure high demand construction materials at a lower cost. Successful development projects contribute significantly to earnings growth as they are leased, begin generating income and increase the value of our Real Estate Segment. In general, we develop properties in the U.S. to hold for the long term or to contribute to our unconsolidated co-investment ventures, and outside the U.S. primarily to contribute to these ventures.
Strategic Capital Segment
We partner with many of the world’s largest institutional investors through co-investment ventures. The business is capitalized through private and public equity, and is comprised of 94% open-ended ventures, long-term ventures and three publicly traded vehicles: (i) Nippon Prologis REIT, Inc. in Japan; (ii) China AMC Prologis Logistics REIT in China; and (iii) FIBRA Prologis in Mexico (which controls and owns more than 99% of Terrafina, also a publicly traded FIBRA). We align our interests with our partners by holding significant ownership interests in the co-investment ventures. Ten of the co-investment ventures are unconsolidated entities, and one is consolidated, with our ownership in the co-investment ventures ranging from 15% to 55%. This structure allows us to reduce our exposure to foreign currency fluctuations for non-U.S. investments. Management of the unconsolidated co-investment ventures comprises our Strategic Capital Segment.
This segment generates durable, long-term cash flows and generally contributes 5% to 10% of our consolidated revenues, earnings and FFO, excluding promotes. We generate strategic capital revenue from our unconsolidated co-investment ventures, principally through asset management and property management services. Revenue earned from asset management fees is primarily driven by the quarterly valuation of the real estate properties owned by the respective ventures. We earn additional revenues by providing leasing, acquisition, construction management, development and disposition services. The majority of the strategic capital revenues are generated outside the U.S. In certain ventures, we also have the ability to earn revenues through incentive fees (“promotes” or “promote revenues”) periodically during the life of a venture, upon liquidation of a venture or upon stabilization of individual venture assets, based primarily on the total return of the investments over certain financial hurdles. Promote revenue is recognized when earned, either at the end of the promote period or upon liquidation or stabilization.
FUTURE GROWTH
We believe that the quality and scale of our portfolio, our ability to add value creation through development, our strategic capital business, the depth of our customer relationships and the strength of our balance sheet are differentiators that allow us to drive growth in revenues, NOI, earnings, FFO and cash flows.
(1)Net effective rent ("NER") is calculated at the beginning of the lease using estimated total cash base rent to be received over the term and annualized and excludes fair value lease amortization from acquisitions. Amounts derived in a currency other than the U.S. dollar have been translated using the average rate from the previous twelve months.
Rent change represents the percentage change in net effective rental rates (average rate over the lease term), on new and renewed leases, commenced during the period compared with previous net effective rental rates for the same respective spaces.
•Rent Growth. As a result of several years of market rent increases, our in-place leases have considerable upside potential to capture higher rents and drive future organic NOI growth. This is evident in the positive rent change we have experienced in every quarter since 2013. For lease rollovers during 2025, the increases to market on our share of the O&M portfolio resulted in increases of approximately 50% on net effective rents. We estimate that our share of the remaining lease mark-to-market is approximately 18% (on an NER basis), which represents the amount by which current market rents exceed our in-place rents based on our share of the O&M portfolio at December 31, 2025. This lease mark-to-market has remained meaningfully positive despite recent quarters of lower or even negative market rental growth, reflecting the accumulated rent growth embedded in our in-place leases remaining to be realized. As a result, even without further market rent increases, we expect lease renewals to drive higher rental income over the coming years.
•Value Creation from Development. Our global development program serves as a profitable way to expand our portfolio, build scale, serve customers and create value for investors. We create these opportunities by sourcing land either through direct ownership, option strategies or Covered Land Plays ("CLPs"), which have intent for future redevelopment. We primarily develop in our existing markets, focusing on logistics facilities while also pursuing higher-and-better-use conversions, such as data centers. A key enabler of these conversions is our energy procurement strategy. By leveraging our scale and relationships with utilities and energy providers, we are advancing on our strategy to secure reliable access to power that enhances the value of our land portfolio and enables us to convert select logistics sites into energy-ready data center developments and capture meaningful value creation consistent with our broader redevelopment strategy. We expect our development activities to increase in the coming year.
Based on our current estimates, our consolidated land and other real estate investments, including options and CLPs, have the potential to support the development of $37.3 billion ($42.6 billion on an O&M basis) of TEI of newly developed buildings. We measure the estimated value creation of a development project as the stabilized value above our TEI. As properties are completed and leased, we expect to capture the value creation principally through gains realized upon contributing these properties to unconsolidated co-investment ventures and through increases in the NOI of the consolidated portfolio.
•Strategic Capital Advantages. Our co-investment ventures provide third-party capital that enables us to grow our O&M portfolio, help self-fund our development activity through the sale or contribution of newly developed assets to these vehicles and generate substantial management fees. We raise capital to support the long-term growth of these ventures while maintaining significant investments of our own. At December 31, 2025, the gross book value of the operating portfolio held by our ten unconsolidated co-investment ventures was $62.4 billion across an aggregate of 562 million square feet. We plan to grow this business and increase revenues by increasing our assets under management in existing and new ventures.
(1)General and Administrative ("G&A") Expenses is a line item in the Consolidated Financial Statements. Adjusted G&A expenses is calculated from our Consolidated Financial Statements as G&A Expenses and Strategic Capital Expenses, less expenses under the Prologis Promote Plan (“PPP”) and property-level management expenses for the properties owned by the ventures.
•Balance Sheet Strength. We have a long standing strategy to build and maintain a strong, flexible balance sheet by using conservative levels of financial leverage. At December 31, 2025, the weighted average remaining term of our consolidated debt was 9 years and the weighted average interest rate was 3.2%. At December 31, 2025, we had total available liquidity of $7.6 billion. We continue to maintain low leverage as a percentage of our real estate investments and our market capitalization. Our low leverage, available liquidity and investment capacity in the co-investment ventures position us to capitalize on opportunistic value-added investments as they arise.
•Our Scale Drives Efficiency. We have scalable systems and infrastructure in place to grow both our consolidated and O&M portfolios with limited incremental G&A expenses, allowing us to focus additions to our workforce in growth areas of the business. Over time, we believe we can continue to grow NOI and strategic capital revenues organically and through accretive development and acquisition activity while further reducing G&A as a percentage of our investments in real estate.
•Staying “Ahead of What’s Next™”. We are focused on creating value beyond real estate by enhancing our customers’ experience, leveraging our scale in procurement and driving innovation through data analytics and digitization. This includes investments in early and growth-stage companies that are focused on emerging technologies for the logistics sector through Prologis Ventures, our corporate venture capital group. Our Prologis Essentials platform provides customers with services and products that support their operational, energy and sustainability needs, simplify decision making and help advance their environmental goals.
Competition
Real estate ownership is highly fragmented, and we face competition from many owners and operators. Competitively priced logistics space could impact our occupancy rates and limit the rents we can charge, which in turn could affect our operating results, particularly during periods of economic uncertainty or elevated new supply. We also face competition in our capital deployment business from regional, national and global operators and developers, and in our strategic capital business from investment and asset managers seeking institutional capital.
Despite this competitive environment, our global reach and local market knowledge, developed over the years, provide us with distinct competitive advantages, including the following:
•a portfolio of properties strategically located in markets with high population densities, growing consumption and significant barriers to entry, typically near major labor pools and extensive transportation infrastructure, including our Last Touch® facilities;
•the ability to leverage the scale and structure of our 1.3 billion square foot O&M portfolio to provide multi-market customers with a single point of contact through our in-house global Customer Led Solutions Team to address their needs;
•services and solutions offered through Prologis Essentials to assist our customers with their operational, energy and sustainability needs and at the same time enhancing the value of our real estate;
•strategically located, global land and redevelopment sites with the potential to support $42.6 billion of TEI in new logistics space on an O&M basis, including build-to-suit development and redevelopment into industrial properties or data centers;
•capabilities to build new data centers and convert existing properties to data centers in key markets, with $686 million of TEI on an O&M basis currently under development;
•local teams with the expertise, experience and relationships to lease our properties and deploy capital advantageously, supported by our in-house government and community affairs and entitlement teams;
•development of logistics facilities with sustainable design features that meet customer needs for efficient, high-quality buildings while supporting their progress toward sustainability goals;
•relationships and a successful track record with investors in our strategic capital business that is comprised of 94% open-ended ventures, long-term ventures and three publicly traded vehicles;
•a market intelligence team that tracks business conditions in real time, allowing us to proactively pursue opportunities, respond to disruptions and create revenue-generating capabilities;
•ongoing investment in technology and talent to support our sustainability objectives, including expansion of renewable energy initiatives and the integration of energy solutions across the portfolio;
•an internal venture capital group, Prologis Ventures, which invests in growth stage companies innovating across the logistics sector; and
•a strong balance sheet and credit ratings, complemented by significant liquidity, borrowing capacity and long-term fixed-rate debt at favorable rates.
Customers
At December 31, 2025, in our Real Estate Segment representing our consolidated properties, we had more than 4,000 customers occupying 649 million square feet of logistics operating properties (6,500 customers occupying 1.3 billion square feet for our O&M portfolio). Our broad customer base represents a spectrum of international, national, regional and local logistics users who operate across various industries, providing diverse goods to consumers throughout the globe.
The strategic location of our global portfolio gives us a unique ability to provide real estate solutions that support our customers' supply chains and help them meet end-consumer delivery expectations. Our properties are positioned at critical points in the supply chain, most notably our infill and Last Touch® facilities, which are located within and adjacent to major cities to ensure same-day delivery to consumers. Additionally, we own import and national distribution centers with access to major seaports and intermodal hubs, as well as regional distribution centers that facilitate broader market reach.
Below are the primary categories of goods in our consolidated real estate properties at December 31, 2025:
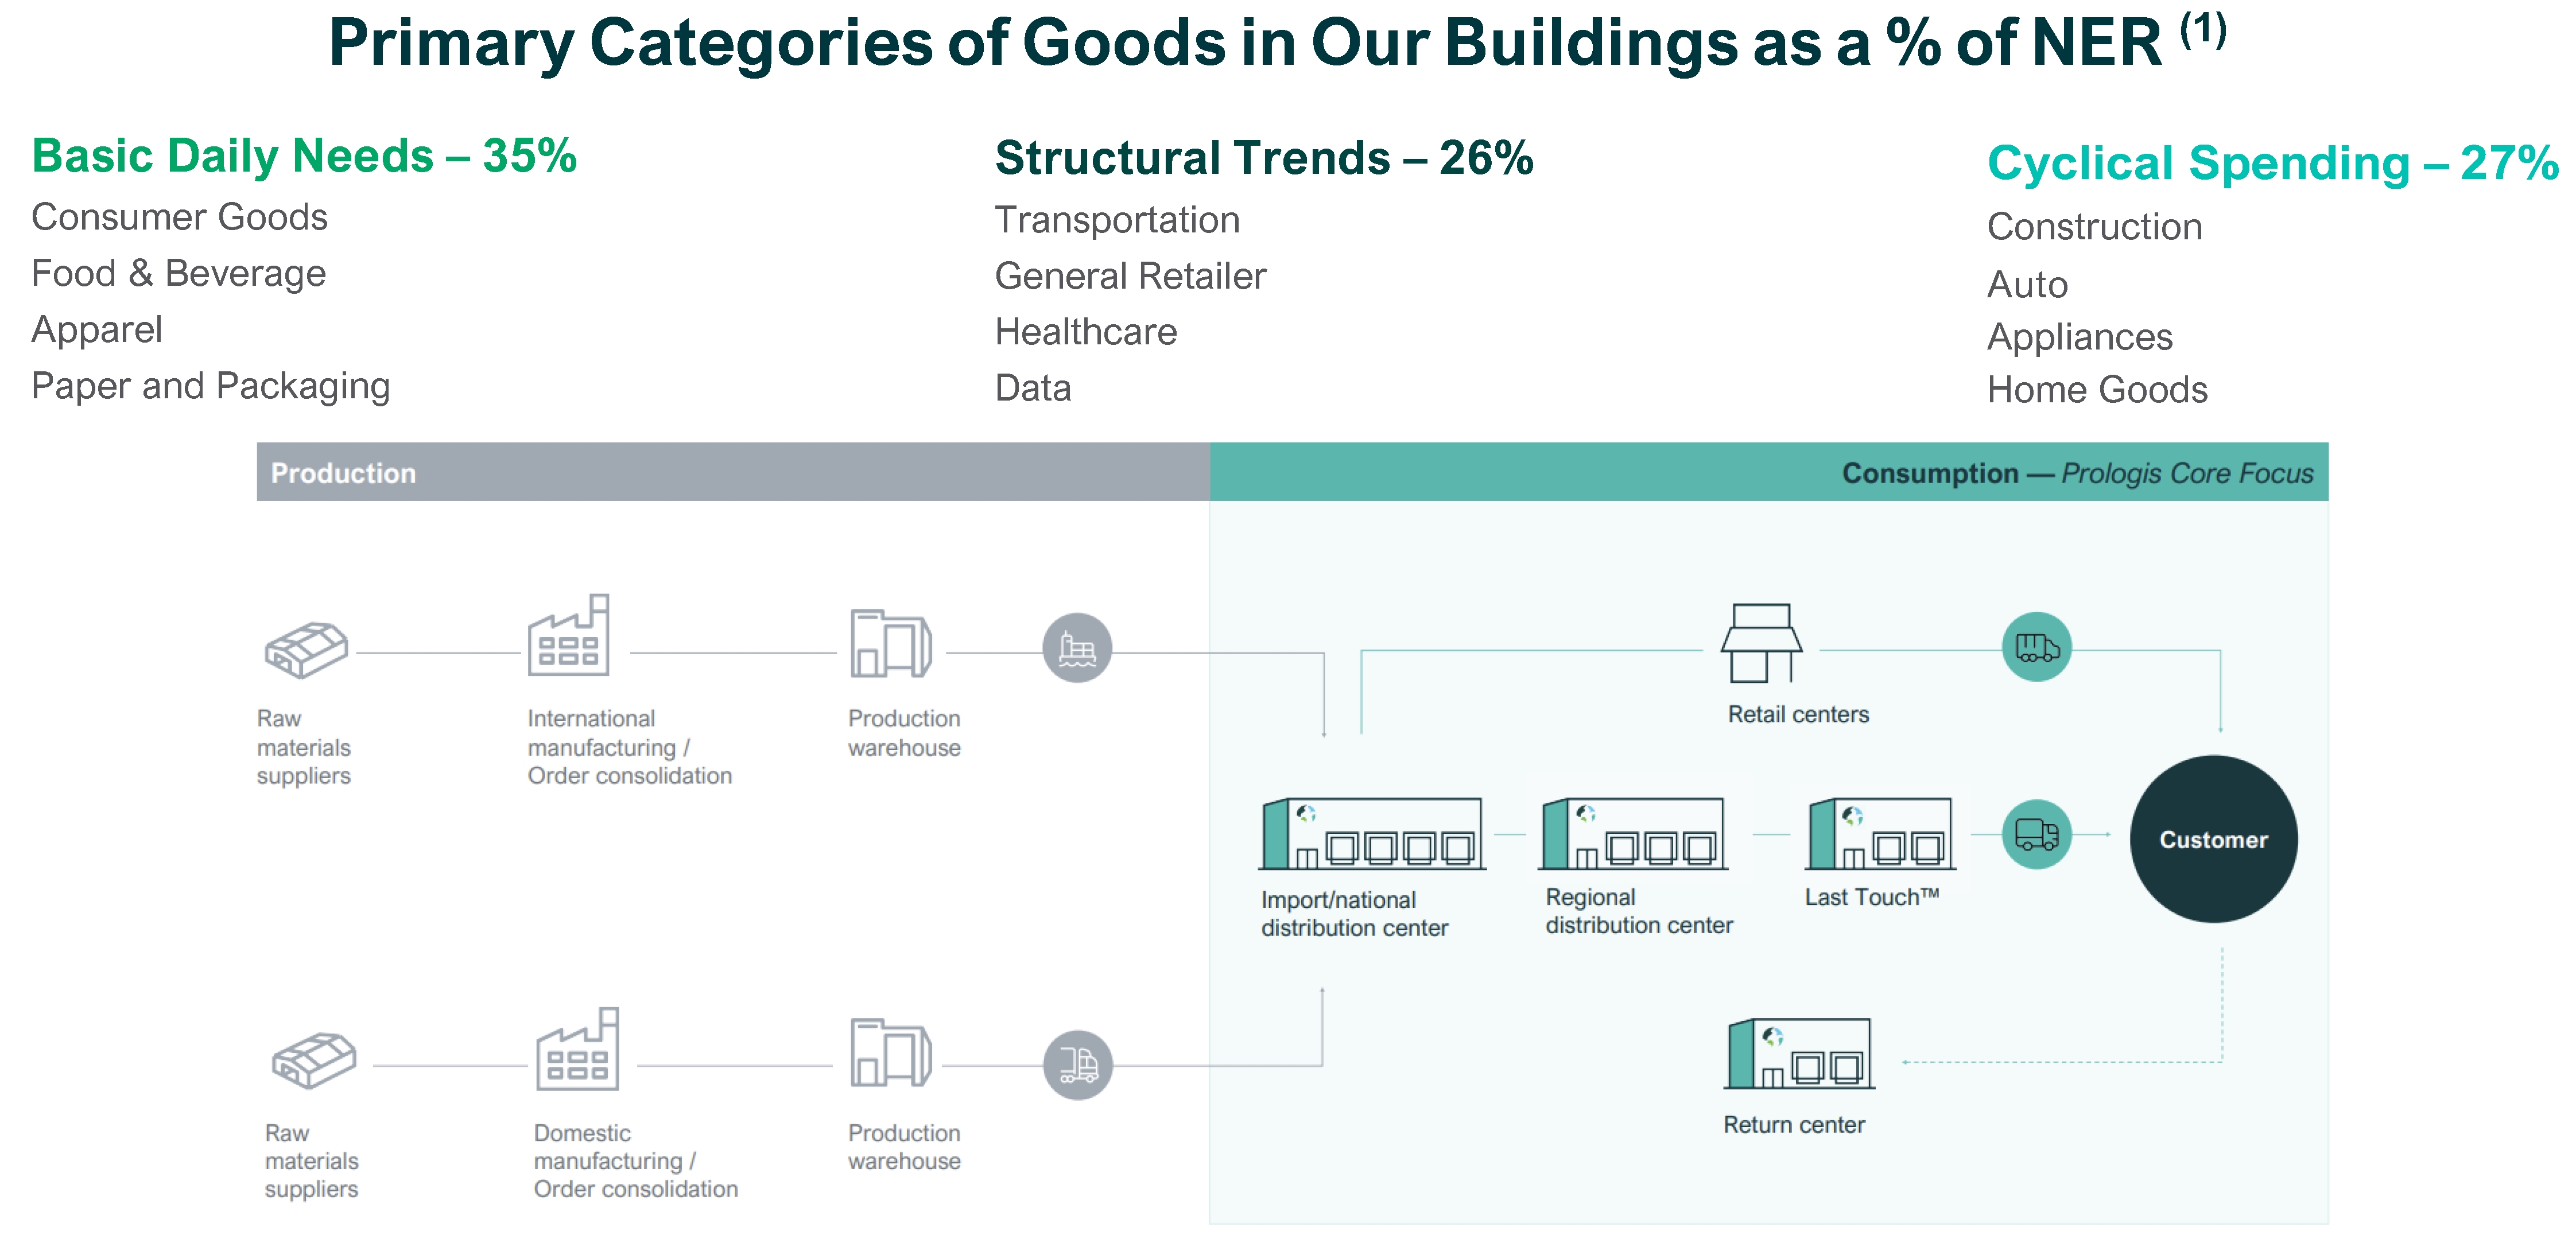
(1)Primary categories do not sum to 100% as the difference is attributable to customers that do not clearly fall into a single category. Additionally, primary categories are listed in order of the largest percentage of NER for each category type.
The following table details our top 25 customers for our consolidated and O&M real estate properties at December 31, 2025 (square feet in millions):
|
|
|
|
|
|
|
|
|
|
Consolidated - Real Estate Segment |
|
|
Owned and Managed |
Top Customers |
% of
NER |
|
Total Occupied Square Feet |
|
Top Customers |
% of
NER |
|
Total Occupied Square Feet |
1. Amazon |
6.3 |
|
35 |
|
1. Amazon |
5.3 |
|
48 |
2. Home Depot |
2.8 |
|
17 |
|
2. Home Depot |
1.8 |
|
19 |
3. FedEx |
1.8 |
|
7 |
|
3. FedEx |
1.4 |
|
11 |
4. UPS |
1.0 |
|
7 |
|
4. DHL |
1.2 |
|
14 |
5. Walmart |
0.8 |
|
5 |
|
5. DSV |
1.2 |
|
14 |
6. GXO |
0.8 |
|
5 |
|
6. Geodis |
1.0 |
|
14 |
7. Geodis |
0.7 |
|
6 |
|
7. GXO |
0.9 |
|
10 |
8. Pepsi |
0.7 |
|
4 |
|
8. UPS |
0.9 |
|
10 |
9. DHL |
0.7 |
|
3 |
|
9. CEVA Logistics |
0.8 |
|
11 |
10. Lululemon |
0.7 |
|
2 |
|
10. Walmart |
0.7 |
|
9 |
Top 10 Customers |
16.3 |
|
91 |
|
Top 10 Customers |
15.2 |
|
160 |
11. GigaCloud |
0.7 |
|
3 |
|
11. Kuehne + Nagle |
0.7 |
|
8 |
12. DSV |
0.7 |
|
3 |
|
12. Maersk |
0.7 |
|
6 |
13. NFI Industries |
0.7 |
|
3 |
|
13. Pepsi |
0.5 |
|
5 |
14. Wayfair |
0.6 |
|
6 |
|
14. Mercado Libre |
0.5 |
|
6 |
15. Ryder |
0.6 |
|
3 |
|
15. GigaCloud |
0.4 |
|
3 |
16. Berkshire Hathaway |
0.5 |
|
2 |
|
16. NFI Industries |
0.4 |
|
4 |
17. Tesla |
0.5 |
|
2 |
|
17. Ryder |
0.4 |
|
4 |
18. Western Post |
0.4 |
|
2 |
|
18. Lululemon |
0.4 |
|
2 |
19. Maersk |
0.4 |
|
2 |
|
19. Burlington Stores |
0.4 |
|
3 |
20. Kellanova |
0.4 |
|
3 |
|
20. Samsung |
0.4 |
|
5 |
21. Imperial Dade |
0.4 |
|
2 |
|
21. Wayfair |
0.4 |
|
6 |
22. RONA |
0.4 |
|
1 |
|
22. Tesla |
0.3 |
|
2 |
23. The Clorox Company |
0.4 |
|
3 |
|
23. ZOZO |
0.3 |
|
5 |
24. OnTrac |
0.4 |
|
1 |
|
24. Berkshire Hathaway |
0.3 |
|
3 |
25. CEVA Logistics |
0.3 |
|
3 |
|
25. Nippon Express |
0.3 |
|
4 |
Top 25 Customers |
23.7 |
|
130 |
|
Top 25 Customers |
21.6 |
|
226 |
In our Strategic Capital Segment, we view our partners and investors as our customers. At December 31, 2025, we had 159 investors in our private equity ventures, several of which invest in multiple ventures.
Our People
Our people are the foundation of our business. They implement our strategy and create value for our customers and shareholders. We seek to recruit and retain talented employees with varied experiences and perspectives. The intent is to create an inclusive and high-performing culture where each employee can do their best work and drive our collective success.
The following charts display our workforce demographics by levels of seniority at December 31, 2025:
|
|
Women, 2025 (1) |
People of Color (U.S. only), 2025 (1) |
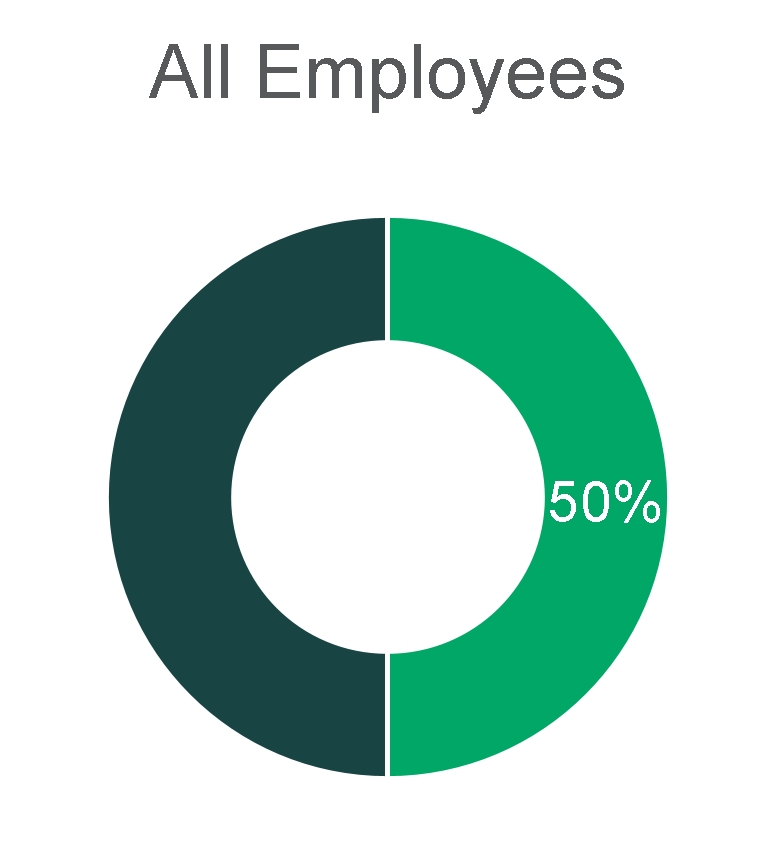 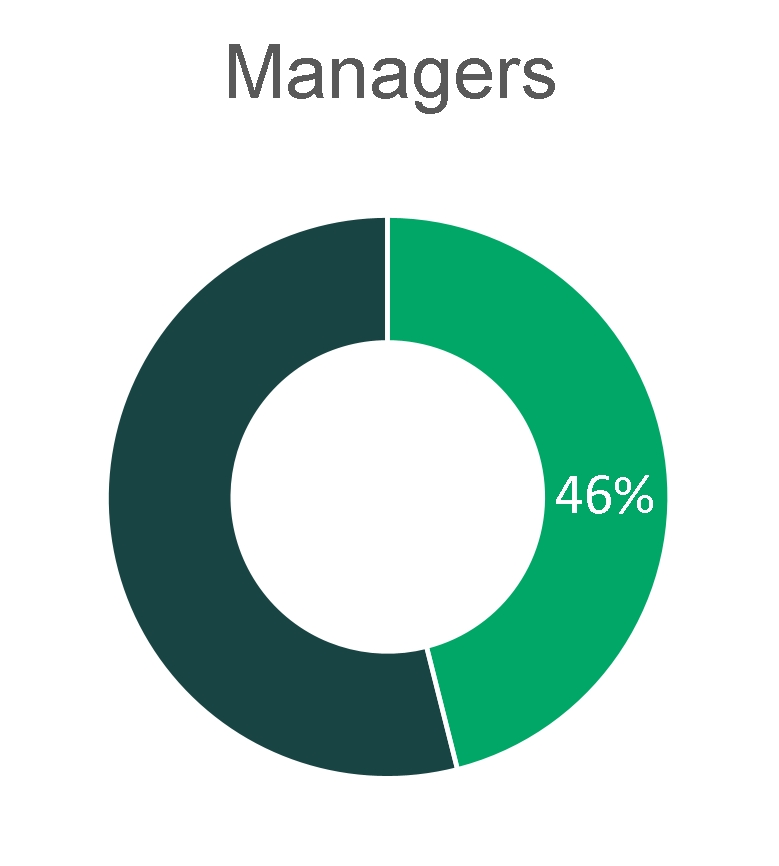 
|
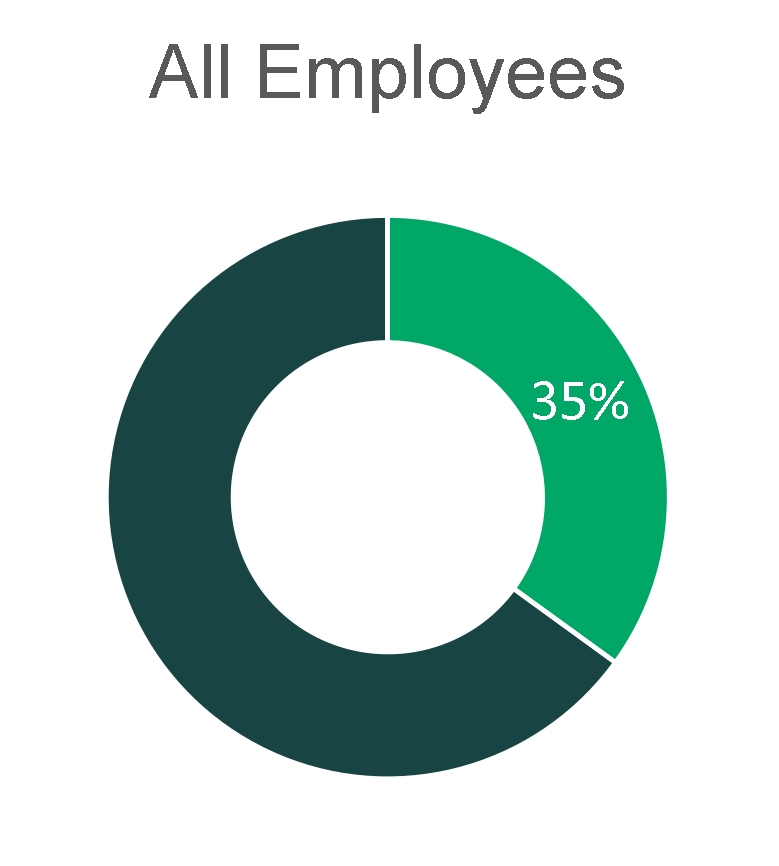 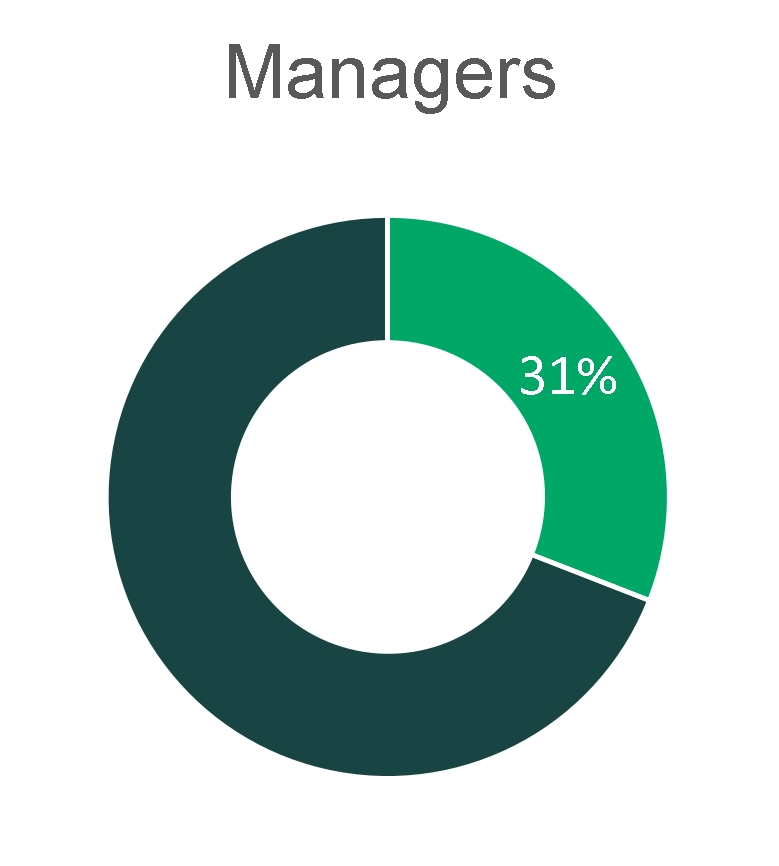 
|
(1) Managers include employees with manager, director or vice president titles. Senior leaders include employees with senior vice president or higher titles.
We align employees’ goals with our overall strategic direction to create a clear link between individual efforts and the long-term success of the company. We communicate at all levels of the organization throughout the year about company goals and strategic initiatives to
ensure awareness and alignment. We then provide continual feedback to all employees on their progress towards those goals as well as budget for external learning and stretch opportunities to support their growth.
Providing our employees with learning and development opportunities through training, education and mentorship is critical to our continued ability to innovate. In 2025, more than 1,800 employees completed more than 14,400 hours of company-provided or company-sponsored learning and development training.
We provide opportunities for our employees to share their insights and perspectives on our company and their work experience. Our most recent employee engagement survey, completed in September 2025, had a participation rate of 92%, with an engagement level of 85% based on respondents' positive responses to the questions that comprise our engagement driver index.
We strive to cultivate a healthy and safe working environment for our employees. We provide workplace flexibility with accountability as determined by role. We continue to attract and retain talent in the industry through competitive compensation, a robust benefits package, pathways to career advancement, talent recognition and individual development planning. We conduct annual pay equity analyses and aim to address differences in compensation not explained by relevant job factors.
The following table summarizes our total number of employees at December 31, 2025:
|
|
|
|
|
Geographies |
|
|
|
U.S. (1) |
|
|
1,649 |
|
Other Americas |
|
|
210 |
|
Europe |
|
|
657 |
|
Asia |
|
|
286 |
|
Total |
|
|
2,802 |
|
(1)This includes employees who were based in the U.S. but also support other geographies.
Prologis employees are not organized under collective bargaining agreements, other than in Brazil, France and Spain, and there is a works council in France.
CODE OF ETHICS AND BUSINESS CONDUCT
We maintain a Code of Ethics and Business Conduct applicable to our board of directors (the “Board”) and all of our officers and employees, including the principal executive officer, the principal financial officer and the principal accounting officer, and other people performing similar functions. A copy of our Code of Ethics and Business Conduct is available on our website, www.prologis.com. In addition to being accessible through our website, copies of our Code of Ethics and Business Conduct can be obtained, free of charge, upon written request to Investor Relations, Pier 1, Bay 1, San Francisco, California 94111. Any amendments to or waivers of our Code of Ethics and Business Conduct that apply to the principal executive officer, the principal financial officer, the principal accounting officer, or other people performing similar functions, and that relate to any matter enumerated in Item 406(b) of Regulation S-K, will be disclosed on our website.
GLOBAL IMPACT AND SUSTAINABILITY
The principles of ESG are ingrained in our business strategy through our integrated approach to global impact and sustainability, which we believe creates value for our customers, investors, employees and communities. As we look toward the future, we have set sustainability goals and objectives that demonstrate our ambition, create accountability and drive alignment with our business strategy. These goals include the utilization of renewable energy sources, along with sustainable development and redevelopment, that create energy savings and reduce our environmental footprint. We have also set goals and objectives to support the communities in which we do business and employ strong governance practices.
Environmental Sustainability
We develop modern and efficient buildings with state-of-the-art technology to stay ahead of our customers’ needs, advance our ability to meet future structural, transportation and energy requirements, and make progress on our own sustainability goals and objectives. This includes new development and redevelopment of buildings that align with leading sustainable building standards and the implementation of solutions and services such as onsite solar generation, energy storage, heat pumps, cool roofs, LED lighting, EV charging stations and other mobility solutions, recycling and xeriscaping. We regularly talk with customers about how Prologis can work with them to enhance the sustainability of their operations. We believe these services and solutions can deliver operational efficiencies, reduce energy and water consumption and decrease greenhouse gas emissions within our customers’ operations and across our own portfolio.
We committed to: (i) installing LED lighting within 100% of our eligible new developments and redevelopments and across 80% of our eligible O&M operating properties by 2025; (ii) achieving 1 gigawatt of solar generation and storage capacity by 2025 on our O&M portfolio, including Prologis and third-party owned projects; and (iii) obtaining sustainable building certifications for 100% of our eligible new
developments and redevelopments. We believe our Prologis Essentials LED and SolarSmart solutions, which provide our customers with energy solutions and savings through efficient lighting and solar panels on our rooftops, help reduce the environmental footprint of our customers and accelerate our progress in these areas.
In 2025, we met these goals. We installed or were scheduled to install LED lighting within 100% of our eligible new developments and redevelopments and across approximately 83% of our eligible logistics facilities (based on square feet) within our O&M operating properties at December 31, 2025. At December 31, 2025, we had 1.1 gigawatts of solar generation and storage capacity on our O&M portfolio, including Prologis and third-party owned projects. To fund our sustainable development activities, we utilized the proceeds from certain senior notes issuances to finance green projects eligible under our green bond framework. For development properties in our O&M portfolio that were approved by our Investment Committee after June 2021 and that reached stabilization during 2025, we certified 62% of our eligible developments and redevelopments with sustainable building certifications and 38% were scheduled for sustainable building certification, totaling 100% of eligible developments and redevelopments.
Social Impact
We are committed to social responsibility and strengthening relationships important to our business through customer partnerships, investor outreach, community involvement, supplier engagement and labor solutions, as discussed above. We work in partnership with local leaders, institutions and organizations to create jobs and job training programs, expand opportunities for students with diverse backgrounds to study real estate, promote health and safety and enhance recreational and transit infrastructure. We believe these efforts help create a more stable and predictable business environment for Prologis and our customers, drive economic development and support social wellness and well-being in the communities we serve.
For our customers, where recruitment and retention of logistics talent is a key challenge, we are helping build a talent pipeline through our Community Workforce Initiative (“CWI”), founded in 2018. The CWI is a talent development program that advances the skills and capabilities of logistics talent, with an emphasis on revitalizing career pathways and creating economic opportunities in the communities where we operate. In 2018, we set a goal to train 25,000 individuals by 2025 by partnering with leading public sector organizations and leveraging digital learning technologies to develop innovative training solutions. We met this goal in 2023, two years early, and have continued to train individuals since achieving it.
Beginning in 2019, we committed to spending 75,000 hours supporting our local communities by 2025. To achieve this goal, we enable our employees to spend 40 working hours a year to volunteer, including at our company-sponsored day of service where employees around the globe volunteer on projects to help in their local communities. At December 31, 2025, we surpassed this goal by reaching a total of 96,000 hours. In addition, we encourage our employees to support their local communities outside of working hours with our Dollars for Doers and other matching gifts programs, through which Prologis donates to eligible charities and non-profit organizations based on employees’ personal volunteer hours or dollar donations.
Governance Practices
We strive to promote a culture of uncompromising integrity, including through our governance practices and corporate oversight. Our Board independence and diversity, open communication with our stockholders and risk management framework that supports our investment and process decisions, all serve to mitigate risk and preserve value for our company.
Over the past eleven years we have onboarded nine new directors with a breadth of experience, increasing the ethnic, gender and geographical diversity of the Board. The charters of our Board Governance and Nomination Committee and Talent and Compensation Committee provide that such committees have specific oversight over global impact and sustainability matters and inclusion and diversity matters, respectively.
The strength of our balance sheet and credit ratings, dedication to proactive risk mitigation and engagement with our employees through ethics and anti-corruption training protects the financial, operational and reputational resilience of our company. Our global risk management team works with our Board to conduct regular enterprise-wide risk assessments to ensure proper oversight over real estate, financial and emerging risks across our global organization. We remain committed to ensuring that 100% of our employees complete ethics training annually, a commitment we continued to achieve in 2025. Along with this commitment, our employees completed more than 4,100 hours of information technology security, workplace safety, compliance and other ethics training in 2025. Our approach is reinforced by our Code of Ethics and Business Conduct, as described above.
ENVIRONMENTAL MATTERS
By the nature of our industry, we are exposed to various environmental risks that may result in unanticipated losses and affect our operating results and financial condition. Either the previous owners or we have conducted environmental reviews on a majority of the properties we have acquired, including land. While some of these assessments have led to further investigation and sampling, none of the environmental assessments have revealed an environmental liability that we believe would have a material adverse effect beyond amounts recorded at December 31, 2025. See further discussion in Item 1A. Risk Factors and Note 15 to the Consolidated Financial Statements in Item 8. Financial Statements and Supplementary Data.
GOVERNMENTAL MATTERS
Given the global nature of our business, we are subject to various regulatory requirements, tax and other laws as well as exposed to economic and geopolitical matters such as taxes, tariffs, trade wars and laws within the countries in which we operate and unexpected changes in these items may result in unanticipated losses, adverse tax consequences and affect our operating results and financial condition. Changes in global business operations, such as the increasing adoption of artificial intelligence ("AI"), despite human oversight, may also adversely impact our business, financial condition or results of operations. In addition, we may be impacted by the ability of our non-U.S. subsidiaries to distribute or otherwise transfer cash among our subsidiaries due to currency exchange control regulations and transfer pricing regulations. The impact of regional or country-specific economic instability, including government shutdowns or other internal trade alliances or agreements could also have a material adverse effect on our business, financial condition or results of operations. See further discussion in Item 1A. Risk Factors.
INSURANCE COVERAGE
We carry insurance coverage for our properties. We determine the type of coverage and the policy specifications and limits based on what we deem to be the risks associated with our ownership of properties and our business operations in specific markets. Such coverage typically includes property damage and rental loss insurance resulting from such perils as fire, windstorm, flood, earthquake and terrorism; commercial general liability insurance; and environmental insurance. Insurance is maintained through a combination of commercial insurance, self-insurance and a wholly owned captive insurance entity. The business of our wholly owned captive insurance entity is ancillary to the owning and operating of our real estate. The costs to insure our properties are primarily covered through expense reimbursements from our customers. Additionally, in 2024 we sponsored a catastrophe bond issuance that provides further insurance coverage through 2027 for potential losses resulting from earthquake risks in the U.S. We believe our insurance coverage contains policy specifications and insured limits that are customary for similar properties, business activities and markets and we believe our properties are adequately insured. See further discussion in Item 1A. Risk Factors.
ITEM 1A. Risk Factors
Our operations and structure involve various risks that could adversely affect our business and financial condition, including but not limited to, our financial position, results of operations, cash flow, ability to make distributions and payments to security holders and the market value of our securities. These risks relate to Prologis as well as our investments in consolidated and unconsolidated entities and include among others, (i) risks related to our global operations; (ii) risks related to our business; (iii) risks related to financing and capital; and (iv) risks related to income taxes.
Risks Related to our Global Operations
As a global company, we are subject to social, geopolitical and economic risks associated with conducting business in many countries and our results of operations and financial condition may be materially and adversely affected.
We conduct a significant portion of our business and employ a substantial number of people outside of the U.S. During 2025, we generated approximately $788 million, or 9.0% of our consolidated revenues, from operations outside the U.S. Circumstances and developments related to international operations that could negatively impact us include, but are not limited to, the following factors:
•difficulties and costs of staffing and managing international operations in certain geographies, including differing employment practices and labor issues;
•local businesses and cultural factors that differ from our domestic standards and practices;
•volatility in currencies and currency restrictions, which may prevent the availability of capital or the transfer of profits to the U.S.;
•challenges in establishing effective controls and procedures to regulate operations in different geographies and to monitor compliance with applicable regulations, such as the Foreign Corrupt Practices Act, the United Kingdom (“U.K.”) Bribery Act and other similar laws;
•changes in regulatory and environmental requirements, taxes, tariffs, trade wars and laws within the countries in which we operate;
•the responsibility of complying with multiple and potentially conflicting laws, such as those regarding corrupt practices, human rights, employment and licensing;
•changes in general economic conditions due to inflation, elevated interest rates, regional or country-specific business cycles, supply chain disruptions, economic downturns or recessions and economic instability, including government shutdowns and withdrawals from the European Union or other international trade alliances or agreements;
•political instability, uncertainty over property rights, territorial disputes, military conflict, war or expansion of hostilities, civil unrest, drug trafficking, political activism or the continuation or escalation of terrorist or gang activities;
•public health crises, such as outbreaks of global pandemics or contagious diseases;
•changes in technological advances, including the increasing adoption of AI;
•foreign ownership restrictions in operations with the respective countries; and
•access to capital may be more restricted, or unavailable on favorable terms or at all in certain locations.
In addition, we may be impacted by the ability of our non-U.S. subsidiaries to dividend or otherwise transfer cash among our subsidiaries due to currency exchange control regulations, transfer pricing regulations and potentially adverse tax consequences, among other factors.
We cannot predict the extent to which these social, geopolitical and economic risks may impact our business and operating results and that of our co-investment ventures, but their impact may include the following:
•existing customers and potential customers of our logistics facilities may be adversely affected by the decrease in economic activity, changes in regulation or disruptions in the supply chain, which could in turn disrupt their business and affect their ability to enter into new leasing transactions or satisfy rental payments;
•government, labor or other restrictions may add new or additional compliance requirements as a developer or prevent us from completing the development or leasing of properties currently under development or making our properties ready for our customers to move in;
•our ability to recover our investments in real estate assets may be hindered by current market conditions;
•increases in material costs as a result of labor shortages and supply chain disruptions may make the development of properties more costly than we originally budgeted or impact transportation routes of our suppliers or our customers; and
•our workforce, including our executives, may become ill or have difficulty working remotely, caring for our properties and/or customers creating inefficiencies, delays or disruptions in our business.
Any prolonged economic downturn, disruption in the financial markets or public health crises may also impact our ability to access capital markets to issue debt or equity securities and to complete real estate transactions at attractive pricing or at all.
Compliance or failure to comply with regulatory requirements could result in substantial costs.
We are required to comply with many regulations in different countries, including (but not limited to) the Foreign Corrupt Practices Act, the U.K. Bribery Act and similar laws and regulations. Our properties are also subject to various federal, state and local regulatory requirements, such as the Americans with Disabilities Act and state and local fire, life-safety, energy and greenhouse gas emissions requirements. Noncompliance could result in the imposition of governmental fines or the award of damages to private litigants. While we believe that we are currently in material compliance with these regulatory requirements, the requirements may change or new requirements may be imposed that could require significant unanticipated expenditures by us.
Disruptions in the global capital and credit markets may adversely affect our operating results and financial condition.
To the extent there is turmoil in the global financial markets, this turmoil has the potential to adversely affect: (i) the value of our properties; (ii) the availability or the terms of financing that we have or may anticipate utilizing; (iii) our ability to make principal and interest payments on, or refinance any outstanding debt when due; and (iv) the ability of our customers to enter into new leasing transactions or satisfy rental payments under existing leases. Disruptions in the capital and credit markets may also adversely affect the market price of our securities and our ability to make distributions and payments to our security holders.
The depreciation in the value of the foreign currency in countries where we have a significant investment may adversely affect our results of operations and financial position.
We hold significant real estate investments in international markets where the U.S. dollar is not the functional currency. At December 31, 2025, approximately $13.7 billion, or 13.8% of our total consolidated assets, were invested in a currency other than the U.S. dollar, principally the British pound sterling, Canadian dollar, euro and Japanese yen. For the year ended December 31, 2025, $432.8 million, or 6.6% of our total consolidated segment NOI, was denominated in a currency other than the U.S. dollar. See Note 16 to the Consolidated Financial Statements in Item 8. Financial Statements and Supplementary Data for more information on these amounts. As a result, we are exposed to foreign currency risk due to potential fluctuations in exchange rates between foreign currencies and the U.S. dollar. While we endeavor to manage this risk through our hedging and financing activities, a significant change
in the value of the foreign currency of one or more countries where we have a significant investment may have a material adverse effect on our business and, specifically, our U.S. dollar reported financial position and results of operations.
Our hedging of foreign currency and interest rate risk may not effectively limit our exposure to these risks.
We attempt to mitigate our risk by borrowing in the currencies in which we have significant investments thereby providing a natural hedge. We may also enter into derivative financial instruments that we designate as net investment hedges, as these amounts offset the translation adjustments on the underlying net assets of our foreign investments. We enter into other foreign currency contracts, such as forwards, to reduce fluctuations in foreign currency cash flow associated with the translation of future earnings of our international subsidiaries. Although we attempt to mitigate the potential adverse effects of changes in foreign currency rates, there can be no assurance that those attempts will be successful. In addition, we occasionally use interest rate contracts to manage interest rate risk and limit the impact of future interest rate changes on earnings and cash flows. Hedging arrangements involve risks, such as the risk of fluctuation in the relative value of the foreign currency or interest rates and the risk that counterparties may fail to honor their obligations under these arrangements. The funds required to settle such arrangements could be significant depending on the stability and movement of the hedged foreign currency or the size of the underlying financing and the applicable interest rates at the time of the breakage. The failure to hedge effectively against foreign exchange changes or interest rate changes may adversely affect our business.
Risks Related to our Business
General economic conditions and other events or occurrences that affect areas in which our properties are geographically concentrated may impact financial results.
We are exposed to the economic conditions and other events and occurrences in the local, regional, national and international geographies in which we own properties. Our operating performance is further impacted by the economic conditions of the specific markets in which we have concentrations of properties.
At December 31, 2025, 30.6% of our consolidated operating properties or $24.7 billion (based on consolidated gross book value, or investment before depreciation) were located in California (Central Valley, San Francisco Bay Area and Southern California markets), which represented 23.6% of the aggregate square footage of our operating properties and 31.9% of our consolidated operating property NOI. Our revenues from, and the value of, our properties located in California may be affected by local real estate conditions (such as an oversupply of or reduced demand for logistics properties) and the local economic climate. Business layoffs, downsizing, industry slowdowns, changing demographics and other factors may adversely impact California’s economic climate. Because of the investment we have located in California, a downturn in California’s economy or real estate conditions, including state income tax and property tax laws, could adversely affect our business.
In addition to California, we also have significant holdings (defined as more than 3% of total consolidated investment before depreciation) in operating properties in certain markets located in Atlanta, Chicago, Dallas/Fort Worth, Houston, Lehigh Valley, New Jersey/New York City, Seattle and South Florida. Of these markets, no single market contributed more than 10% of our total consolidated investment before depreciation in operating properties. Our operating performance could be adversely affected if conditions become less favorable in any of the markets in which we have a concentration of properties. Conditions such as an oversupply of logistics space or a reduction in demand for logistics space, among other factors, may impact operating conditions. Any material oversupply of logistics space or material reduction in demand for logistics space could adversely affect our overall business.
Our O&M portfolio, which includes our consolidated properties and properties owned by our unconsolidated co-investment ventures, has concentrations of properties in the same markets mentioned above, as well as in markets in Germany, Japan, Mexico and the U.K., and are subject to the economic conditions in those markets.
Real estate investments are not as liquid as certain other types of assets, which may reduce economic returns to investors.
Real estate investments are not as liquid as certain other types of investments and this lack of liquidity may limit our ability to react promptly to changes in economic or other conditions. Significant expenditures associated with real estate investments, such as secured mortgage debt payments, real estate taxes and maintenance costs, are generally not reduced when circumstances cause a reduction in income from the investments. As a REIT, under the IRC, we are only able to hold property for sale in the ordinary course of business through taxable REIT subsidiaries in order to not incur punitive taxation on any tax gain from the sale of such property. We may dispose of certain properties that have been held for investment to generate liquidity. If we do not satisfy certain safe harbors or we believe there is too much risk of incurring the punitive tax on any tax gain from the sale, we may not pursue such sales.
We may decide to sell or contribute properties to certain of our co-investment ventures or sell properties to third parties to generate proceeds to fund our capital deployment activities. Our ability to sell or contribute properties on advantageous terms is affected by: (i) competition from other owners of properties that are trying to dispose of their properties; (ii) economic and market conditions, including the capitalization rates applicable to our properties; and (iii) other factors beyond our control. If our competitors sell assets similar to assets we intend to divest in the same markets or at valuations below our valuations for comparable assets, we may be unable to divest our assets at favorable pricing or at all. The co-investment ventures or third parties who might acquire our properties may need to have
access to debt and equity capital, in the private and public markets, in order to acquire properties from us. Should they have limited or no access to capital on favorable terms, then dispositions and contributions could be delayed.
If we do not have sufficient cash available to us through our operations, sales or contributions of properties or available credit facilities to continue operating our business as usual, we may need to find alternative ways to increase our liquidity. Such alternatives may include, without limitation, divesting properties at less than optimal terms, incurring debt, entering into leases with new customers at lower rental rates or less than optimal terms or entering into lease renewals with our existing customers without an increase in rental rates. There can be no assurance, however, that such alternative ways to increase our liquidity will be available to us. Additionally, taking such measures to increase our liquidity may adversely affect our business, and in particular, our distributable cash flow and debt covenants.
Our investments are concentrated in the logistics sector and our business would be adversely affected by an economic downturn in that sector.
Our investments in real estate assets are concentrated in the logistics sector. This concentration may expose us to the risk of economic downturns in this sector to a greater extent than if our business activities were more diversified.
Investments in real estate properties are subject to risks that could adversely affect our business.
Investments in real estate properties are subject to varying degrees of risk. While we seek to minimize these risks through geographic diversification of our portfolio, market research and our asset management capabilities, these risks cannot be eliminated. Factors that may affect real estate values and cash flows include:
•local conditions, such as oversupply or a reduction in demand;
•technological changes, such as reconfiguration of supply chains, autonomous vehicles, robotics, 3D printing or other technologies;
•the attractiveness of our properties to potential customers and competition from other available properties;
•increasing costs of maintaining, insuring, renovating and making improvements to our properties;
•our ability to reposition our properties due to changes in the business and logistics needs of our customers;
•our ability to lease the properties at favorable rates and control variable operating costs; and
•governmental and environmental regulations and the associated potential liability under, and changes in, environmental, zoning, usage, tax, tariffs and other laws.
These factors may affect our ability to recover our investment in the properties and result in impairment charges.
Our customers may be unable to meet their lease obligations or we may be unable to lease vacant space, renew leases or re-lease space on favorable terms as leases expire.
Our operating results and distributable cash flow would be adversely affected if a significant number of our customers were unable to meet their lease obligations. At December 31, 2025, our top 10 customers accounted for 16.3% of our consolidated NER and 15.2% of our O&M NER. In the event of default by a significant number of customers, we may experience delays and incur substantial costs in enforcing our rights as landlord, and we may be unable to re-lease spaces. A customer may experience a downturn in its business, which may cause the loss of the customer or may weaken its financial condition, resulting in the customer’s failure to make rental payments when due or requiring a restructuring that might reduce cash flow from the lease. In addition, a customer may seek the protection of bankruptcy, insolvency or similar laws, which could result in the rejection and termination of such customer’s lease and thereby cause a reduction in our available cash flow.
We are also subject to the risk that, upon lease expiration, existing customers may not renew, the space may not be re-leased to new customers or the terms of renewal or re-leasing, including the cost of required renovations or concessions to customers, may be less favorable to us than current lease terms. Our competitors may offer space at rental rates below current market rates or below what we currently charge, and we may be pressured to reduce our rates to retain customers when leases expire, or risk losing potential customers. Additionally, rising inflation or costs could negatively impact our net operating income on existing leases with contractual guaranteed base rent and fixed charges, inclusive of certain rental expenses.
We may acquire properties and companies that involve risks that could adversely affect our business and financial condition.
We have acquired properties and will continue to acquire properties through the direct acquisition of real estate, the acquisition of entities that own real estate or through additional investments in co-investment ventures that acquire properties. The acquisition of
properties involves risks, including the risk that the acquired property will not perform as anticipated and that any actual costs for rehabilitation, repositioning, renovation and improvements identified in the pre-acquisition due diligence process will exceed estimates. When we acquire properties, we may face risks associated with entering a new market such as a lack of market knowledge or understanding of the local economy, forging new business relationships in the area and unfamiliarity with local government and permitting procedures. Additionally, there is, and we expect that there will continue to be, significant competition for properties that meet our investment criteria as well as risks associated with obtaining financing for acquisition activities. The acquired properties or entities may be subject to liabilities, including tax liabilities, which may be without any recourse, or with only limited recourse, with respect to unknown liabilities. As a result, if a liability were asserted against us based on our new ownership of any of these entities or properties, then we may have to pay substantial sums to settle it.
We may be unable to integrate the operations of newly acquired companies and realize the anticipated synergies and other benefits or do so within the anticipated timeframe. Potential difficulties we may encounter in the integration process include: (i) the inability to dispose of non-industrial assets or operations that are outside of our area of expertise; (ii) potential unknown liabilities and unforeseen increased expenses, delays or regulatory conditions associated with these transactions; and (iii) performance shortfalls as a result of the diversion of management’s attention caused by completing these transactions and integrating the companies’ operations.
Our real estate development and redevelopment strategies may not be successful.
Our real estate development and redevelopment strategy is primarily focused on monetizing land and redevelopment sites in the future through development of logistics facilities to hold for long-term investment and for contribution or sale to a co-investment venture or third party, depending on market conditions, our liquidity needs and other factors. We may increase our investment in the development, renovation and redevelopment business and we expect to complete the build-out and leasing of our current development portfolio. We may also develop, renovate or redevelop properties within existing or newly formed co-investment ventures, or develop and redevelop properties into data centers. The real estate development, renovation and redevelopment business includes the following significant risks:
•we may not be able to obtain financing for development projects on favorable terms or at all;
•we may explore development opportunities that may be abandoned and the related investment impaired;
•we may not be able to obtain, or may experience delays in obtaining, all necessary zoning, land-use, building, occupancy and other permits, authorizations and agreements from governmental authorities or utilities for our development projects, including as related to obtaining sufficient or reliable power for our data centers;
•we may incur higher construction and other costs for our development projects, due primarily to this inflationary environment, along with the evolving technological demands for data centers, which are more power-intensive, or additional costs related to regulation that exceed our estimates and projects may not be completed, delivered or stabilized as planned due to defects or other issues;
•even if power is secured for our data center developments, unanticipated disruptions to the supply of such power (including initial delivery delays) or increases in the cost of such power due to impacts from local regulatory changes, availability of fuel sources, or natural disasters, could impact our ability to lease or sell such assets as intended;
•we may not be able to attract third-party investment in new development co-investment ventures or sufficient customer demand for our product;
•we may have properties that perform below anticipated levels, producing cash flows below budgeted amounts;
•we may seek to sell certain land parcels and not be able to find a third party to acquire such land or the sales price will not allow us to recover our investment, resulting in impairment charges;
•we may not be able to lease properties we develop on favorable terms or at all;
•we may not be able to capture the anticipated enhanced value created by our value-added properties on expected timetables or at all;
•we may experience delays (temporary or permanent) if there is public or government opposition to our activities; and
•we may have substantial renovation, new development and redevelopment activities, regardless of their ultimate success, that require a significant amount of management’s time and attention, diverting their attention from our day-to-day operations.
We are subject to risks and liabilities in connection with forming and attracting third-party investment in co-investment ventures, investing in new or existing co-investment ventures, and managing properties through co-investment ventures.
At December 31, 2025, we had investments in co-investment ventures, both public and private, that owned real estate with a gross book value of approximately $73.8 billion. Our organizational documents do not limit the amount of available funds that we may invest in these ventures, and we may and currently intend to develop and acquire properties through co-investment ventures and investments in other entities when warranted by the circumstances. However, there can be no assurance that we will be able to form new co-investment ventures, or attract third-party investment or that additional investments in new or existing ventures to develop or acquire properties will be successful. Further, there can be no assurance that we are able to realize value from our existing or future investments. The same factors that impact the valuation of our consolidated portfolio, as discussed above, also impact the portfolios held by the co-investment ventures and could result in other than temporary impairment of our investment and a reduction in fee revenues.
Our co-investment ventures involve certain additional risks that we do not otherwise face, including:
•our partners may share certain approval rights over major decisions made on behalf of the ventures;
•our partners may seek to redeem their investment, and may do so simultaneously, causing the venture to seek capital to satisfy these requests on less than optimal terms;
•if our partners fail to fund their share of any required capital contributions, then we may choose to contribute such capital;
•our partners might have economic or other business interests or goals that are inconsistent with our business interests or goals that would affect our ability to operate the venture;
•the venture or other governing agreements often restrict the transfer of an interest in the co-investment venture or may otherwise restrict our ability to sell the interest when we desire or on advantageous terms;
•our relationships with our partners are generally contractual in nature and may be terminated or dissolved under the terms of the agreements, and in such event, we may not continue to invest in or manage the assets underlying such relationships resulting in a decrease in our assets under management and a reduction in fee revenues. This may also require us to acquire the properties in order to maintain an investment in the portfolio; and
•disputes between us and our partners may result in litigation or arbitration that would increase our expenses and prevent our officers and directors from focusing their time and effort on our business and result in subjecting the properties owned by the applicable co-investment venture to additional risk.
We generally seek to maintain sufficient influence over our co-investment ventures to permit us to achieve our business objectives; however, we may not be able to continue to do so indefinitely. We have formed publicly traded investment vehicles, such as Nippon Prologis REIT, Inc., China AMC Prologis Logistics REIT and FIBRA Prologis, for which we serve as sponsor or manager. These entities bear their own risks related to trading markets, foreign currency exchange rates and market demand. We have contributed, and may continue to contribute assets into such vehicles. There is a risk that our managerial relationship may be terminated.
We have also made investments in early and growth-stage companies that are focused on emerging technology. These companies may not be successful at raising additional capital or generating cash flows to sustain operations, which could result in the impairment of our investment. In addition, through Prologis Essentials, we are investing in the development of new business lines that are complementary to our core business. These business lines may not be successful and may include risks that are different than investing in our core real estate business.
We are exposed to various environmental risks, which may result in unanticipated losses that could affect our business and financial condition.
Under various federal, state and local laws, ordinances and regulations, a current or previous owner, developer or operator of real estate may be liable for the costs of removal or remediation of certain hazardous or toxic substances. The costs of removal or remediation of such substances could be substantial. Such laws often impose liability without regard to whether the owner or operator knew of, or was responsible for, the release or presence of such hazardous substances. In addition, third parties may sue the owner or operator of a site for damages based on personal injury, property damage or other costs, including investigation and clean-up costs, resulting from the environmental contamination.
Environmental laws in some countries, including the U.S., also require that owners or operators of buildings containing asbestos properly manage and maintain the asbestos, adequately inform or train those who may come into contact with asbestos and undertake special precautions, including removal or other abatement, in the event that asbestos is disturbed during building renovation or demolition. These laws may impose fines and penalties on building owners or operators who fail to comply with these requirements and
may allow third parties to seek recovery from owners or operators for personal injury associated with exposure to asbestos. Some of our properties are known to contain asbestos-containing building materials.
In addition, some of our properties are leased or have been leased, in part, to owners and operators of businesses that use, store or otherwise handle petroleum products or other hazardous or toxic substances, creating a potential for the release of such hazardous or toxic substances. Furthermore, certain of our properties are on, adjacent to or near other properties that have contained or currently contain petroleum products or other hazardous or toxic substances, or upon which others have engaged, are engaged or may engage in activities that may release such hazardous or toxic substances. From time to time, we may acquire properties, or interests in properties, with known adverse environmental conditions for which we believe that the environmental liabilities associated with these conditions are quantifiable and that the acquisition will yield a superior risk-adjusted return. In connection with certain divested properties, we have agreed to remain responsible for, and to bear the cost of, remediating or monitoring certain environmental conditions on the properties.
We are exposed to the impacts of climate change and could be required to comply with new or stricter regulations, which may result in unanticipated losses that could affect our business and financial condition.
We are also exposed to physical risks from changes in climate. Our logistics facilities and the global supply chain are and may continue to be exposed to severe weather events, such as storms or floods. If the frequency of extreme weather events increases, our exposure to these events could increase. We may also be adversely impacted by transition risks, such as potential impacts to the supply chain as a real estate developer or changes in laws or regulations, including the need to invest in low-carbon technologies like solar and battery storage, electric vehicle charging, and LED lighting. We cannot give any assurance that other such conditions do not currently exist, may not arise in the future or that we will successfully integrate them into our business. The impacts of climate change on our real estate properties could adversely affect our ability to lease, develop or sell such properties or to borrow using such properties as collateral.
Our business and operations could suffer in the event of system failures, cybersecurity attacks or risks associated with AI.
Despite system redundancy, the implementation of security measures and the existence of a disaster recovery plan for our internal and hosted information technology systems, our systems are vulnerable to damages from any number of sources, including energy blackouts, natural disasters, terrorism, war, adverse impacts of AI, telecommunication failures and cybersecurity attacks, such as malware, ransomware, or unauthorized access. Any system failure or accident that causes interruptions in our operations could result in a material disruption to our business. We may incur additional costs for remediation caused by such disruptions. Third-party security events at vendors, sub-processors, and service providers could also impact our data and operations through unauthorized access to information or disruption of services which may ultimately result in losses. Despite training, detection systems and response procedures, an increase in email attacks (phishing and business email compromise) and the rise in use of AI tools may create disruption to our business, financial and reputational risk.
Although security incidents have had an insignificant financial impact on our operating results, the rising frequency of attempts may lead to increased costs to protect the company and respond to any events, including additional personnel, consultants and protection technologies. Any compromise of our security could result in a violation of applicable privacy and other laws, unauthorized access to information of ours and others, significant legal and financial exposure, damage to our reputation, loss or misuse of the information and a loss of confidence in our security measures, which could negatively impact our business. Additionally, remediation costs for security events may not be covered by our insurance.
Our insurance coverage does not cover all potential losses.
We and our unconsolidated co-investment ventures carry insurance coverage including property damage and rental loss insurance resulting from certain perils such as fire and additional perils as covered under an extended coverage policy, namely windstorm, flood, earthquake and terrorism; commercial general liability insurance; and environmental insurance, as appropriate for the markets where each of our properties and business operations are located. The insurance coverage contains policy specifications and insured limits customarily carried for similar properties, business activities and markets. We believe our properties and the properties of our co-investment ventures are adequately insured. Certain losses, however, including losses from earthquakes, acts of war, acts of terrorism or riots and pandemics, generally are not insured against or not fully insured against because it is not deemed economically feasible or prudent to do so. If an uninsured loss or a loss in excess of insured limits occurs with respect to one or more of our properties, we could experience a significant loss of capital invested and future revenues in these properties and could potentially remain obligated under any recourse debt associated with the property.
Furthermore, we cannot be sure that the insurance companies will be able to continue to offer products with sufficient coverage at commercially reasonable rates. If we experience a loss that is uninsured or that exceeds insured limits with respect to one or more of our properties or if the insurance companies fail to meet their coverage commitments to us in the event of an insured loss, then we could lose the capital invested in the damaged properties, as well as the anticipated future revenues from those properties and, if there is recourse debt, then we would remain obligated for any mortgage debt or other financial obligations related to the properties. Any such losses or higher insurance costs could adversely affect our business.
A number of our investments, both wholly owned and owned through co-investment ventures, are located in areas that are known to be subject to earthquake activity. U.S. properties located in active seismic areas include properties in our markets in California and Washington. International properties located in active seismic areas include Japan and Mexico. We generally carry earthquake insurance on our properties located in areas historically subject to seismic activity, subject to coverage limitations and deductibles, if we believe it is commercially reasonable. We evaluate our earthquake insurance coverage annually in light of current industry practice through an analysis prepared by outside consultants and in some specific instances have elected to self-insure our earthquake exposure based on this analysis. We have elected not to carry earthquake insurance for our assets in Japan based on this analysis. See Item 2. Properties for more information on the markets above exposed to seismic activities.
Furthermore, a number of our properties are located in areas that are known to be subject to hurricane or flood risk. We carry hurricane and flood hazard insurance on all of our properties located in areas historically subject to such activity, subject to coverage limitations and deductibles, if we believe it is commercially reasonable. We evaluate our insurance coverage annually in light of current industry practice through an analysis prepared by outside consultants.
Our business could be adversely impacted if we have deficiencies in our disclosure controls and procedures or internal control over financial reporting.
The design and effectiveness of our disclosure controls and procedures and internal control over financial reporting may not prevent all errors, misstatements or misrepresentations. While management continually reviews the effectiveness of our disclosure controls and procedures and internal control over financial reporting, there can be no guarantee that our internal control over financial reporting will be effective in accomplishing all control objectives all of the time. Deficiencies, including any material weakness, in our internal control over financial reporting that may occur in the future could result in misstatements or restatements of our financial statements or a decline in the price of our securities.
Risks associated with our dependence on key personnel.
We depend on the deep industry knowledge and the efforts of our executive officers and other key employees. From time to time, our personnel and their roles may change. While we believe that we are able to retain our key talent and find suitable employees to meet our needs, the loss of key personnel, any change in their roles or the limitation of their availability could adversely affect our business. If we are unable to continue to attract and retain our executive officers or other key employees, or if compensation costs required to attract and retain such personnel become more expensive, our performance and competitive position could be materially adversely affected.
Risks Related to Financing and Capital
In order to meet REIT distribution requirements we may need access to external sources of capital.
To qualify as a REIT, we are required each year to distribute at least 90% of our REIT taxable income (determined without regard to the dividends-paid deduction and by excluding any net capital gain) to our stockholders and we may be subject to tax to the extent our taxable income is not fully distributed. Historically, we have satisfied these distribution requirements by making cash distributions to our stockholders, however, we may elect to pay a portion of the distribution in shares of our stock. Assuming we continue to satisfy these distribution requirements with cash, we may not be able to fund all future capital needs, including acquisition and development activities, from cash retained from operations and may have to rely on third-party sources of capital. Furthermore, to maintain our REIT status and not have to pay federal income and excise taxes, we may need to borrow funds on a short-term basis to meet the REIT distribution requirements even if the then-prevailing market conditions are not favorable for these borrowings. These short-term borrowing needs could result from differences in timing between the actual receipt of cash and inclusion of income for federal income tax purposes, or the effect of nondeductible capital expenditures, the creation of reserves or required debt or amortization payments. Our ability to access debt and equity capital on favorable terms or at all depends on a number of factors, including general market conditions, the market’s perception of our growth potential, our current and potential future earnings and cash distributions and the market price of our securities.
Covenants in our credit agreements could limit our flexibility and breaches of these covenants could adversely affect our financial condition.
The terms of our various credit agreements, including our credit facilities and term loans, the indentures under which certain of our senior notes are issued and other note agreements, require us to comply with a number of customary financial covenants, such as maintaining debt service coverage ratios, leverage ratios and fixed charge coverage ratios. These covenants may limit our flexibility to run our business, and breaches of these covenants could result in defaults under the instruments governing the applicable indebtedness. If we default under the covenant provisions and are unable to cure the default, refinance the indebtedness or meet payment obligations, our business and financial condition generally and, in particular, the amount of our distributable cash flow could be adversely affected.
Adverse changes in our credit ratings could negatively affect our financing activity.
At December 31, 2025, our credit ratings were A from Standard and Poor's and A2 from Moody's, both with stable outlooks. A securities rating is not a recommendation to buy, sell or hold securities and may be revised or withdrawn at any time by the issuing agency.
The credit ratings of our senior notes and preferred stock are based on our operating performance, liquidity and leverage ratios, overall financial position and other factors employed by the credit rating agencies in their rating analyses of us. Our credit ratings can affect the amount of capital we can access, as well as the terms and pricing of any debt we may incur. There can be no assurance that we will be able to maintain our current credit ratings, and in the event our credit ratings are downgraded, we would likely incur higher borrowing costs and may encounter difficulty in obtaining additional financing. Also, a downgrade in our credit ratings may trigger additional payments or other negative consequences under our credit facilities and other debt instruments. Adverse changes in our credit ratings could negatively impact our business and, in particular, our refinancing and other capital market activities, our ability to manage debt maturities, our future growth and our development and acquisition activity.
We may be unable to refinance our debt or our cash flow may be insufficient to make required debt payments.
We are subject to risks normally associated with debt financing, including the risk that our cash flow will be insufficient to meet required payments of principal and interest. There can be no assurance that we will be able to refinance any maturing indebtedness, that such refinancing would be on terms as favorable as the terms of the maturing indebtedness, or that we will be able to otherwise obtain funds by selling assets or raising equity to make required payments on maturing indebtedness. If we are unable to refinance our indebtedness at maturity or meet our payment obligations, our business and financial condition will be negatively impacted and, if the maturing debt is secured, the lender may foreclose on the property securing such indebtedness. Our credit facilities and certain other debt bears interest at variable rates. Increases in market interest rates would increase our interest expense under these agreements.
Our stockholders may experience dilution if we issue additional common stock or units in the OP.
Any additional future issuance of common stock or OP units will reduce the percentage of our common stock and units owned by investors. In most circumstances, stockholders and unitholders will not be entitled to vote on whether or not we issue additional common stock or units. In addition, depending on the terms and pricing of any additional offering of our common stock or OP units and the utilization of the proceeds, our stockholders and unitholders may experience dilution in both book value and fair value of their common stock or units.
Risks Related to Income Tax
The failure of Prologis, Inc. to qualify as a REIT would have serious adverse consequences.
Prologis, Inc. elected to be taxed as a REIT under Sections 856 through 860 of the IRC commencing with the taxable year ended December 31, 1997. We believe Prologis, Inc. has been organized and operated to qualify as a REIT under the IRC and believe that the current organization and method of operation comply with the rules and regulations promulgated under the IRC to enable Prologis, Inc. to continue to qualify as a REIT. However, it is possible that we are organized or have operated in a manner that would not allow Prologis, Inc. to qualify as a REIT, or that our future operations could cause Prologis, Inc. to fail to qualify. Qualification as a REIT requires us to satisfy numerous requirements (some annually and others on a quarterly basis) established under highly technical and complex sections of the IRC for which there are only limited judicial and administrative interpretations and involves the determination of various factual matters and circumstances not entirely within our control. For example, to qualify as a REIT, Prologis, Inc. must derive at least 95% of its gross income in any year from qualifying sources. In addition, Prologis, Inc. must pay dividends to its stockholders aggregating annually at least 90% of its taxable income (determined without regard to the dividends paid deduction and by excluding capital gains) and must satisfy specified asset tests on a quarterly basis. Historically, we have satisfied these distribution requirements by making cash distributions to our stockholders, but we may choose to satisfy these requirements by making distributions of cash, stock or other property. The provisions of the IRC and applicable Treasury regulations regarding qualification as a REIT are more complicated for Prologis, Inc. because we hold substantially all of our assets through the OP.
If Prologis, Inc. fails to qualify as a REIT in any taxable year, we will be required to pay federal income tax (including, for taxable years prior to 2018, any applicable alternative minimum tax) on taxable income at regular corporate rates. Unless we are entitled to relief under certain statutory provisions, Prologis, Inc. would be disqualified from treatment as a REIT for the four taxable years following the year in which it lost the qualification and would be subject to corporate tax on built-in gains that exist at the time of REIT re-election if recognized within the five-year period after re-election, and potentially 10 years for certain states. If Prologis, Inc. lost its REIT status, our net earnings would be significantly reduced for each of the years involved. In addition, we may need to borrow additional funds or liquidate some investments to pay any additional tax liability. Accordingly, funds available for investment, operations and distributions would be reduced.
Furthermore, we own a direct or indirect interest in certain subsidiary REITs that elected to be taxed as REITs under Sections 856 through 860 of the IRC. Provided that each subsidiary REIT qualifies as a REIT, our interest in such subsidiary REIT will be treated as a qualifying real estate asset for purposes of the REIT asset tests, and any dividend income or gains derived by us from such subsidiary REIT will generally be treated as income that qualifies for purposes of the REIT 95% and 75% gross income tests. To qualify as a REIT, the subsidiary REIT must independently satisfy all of the REIT qualification requirements. If such subsidiary REIT were to fail to qualify
as a REIT, and certain relief provisions did not apply, it would be treated as a regular taxable corporation and its income would be subject to U.S. federal income tax. In addition, a failure of the subsidiary REIT to qualify as a REIT would have an adverse effect on the ability of Prologis, Inc. to comply with the REIT income and asset tests, and thus its ability to qualify as a REIT.
In addition, we may acquire properties through the acquisition of REIT entities that own the real estate. If a gain in such assets is not otherwise recognized by the seller or target in such acquisitions, and such entities were to fail to satisfy the REIT requirements for any year, they would be disqualified from treatment as a REIT for the four taxable years following the year in which the REIT qualification was lost and the acquired assets would be subject to corporate tax on built-in gains that exist at the time of REIT re-election or, if earlier, at the time of Prologis’ acquisition of the assets. A sale of such assets within the 5-year recognition period, and potentially 10 years for certain states, could result in corporate tax liabilities that could be significant.
Certain property transfers may generate prohibited transaction income, resulting in a penalty tax on gain attributable to the transaction.
From time to time, we may transfer or otherwise dispose of some of our properties, including by contributing properties to our co-investment ventures. Under the IRC, any gain resulting from transfers of properties we hold as inventory or primarily for sale to customers in the ordinary course of business is treated as income from a prohibited transaction subject to a 100% penalty tax. We do not believe that our transfers or disposals of property or our contributions of properties into our co-investment ventures are prohibited transactions. However, whether property is held for investment purposes is a question of fact that depends on all the facts and circumstances surrounding the particular transaction. The Internal Revenue Service (“IRS”) may contend that certain transfers or dispositions of properties by us or contributions of properties into our co-investment ventures are prohibited transactions. While we believe that the IRS would not prevail in any such dispute, if the IRS were to argue successfully that a transfer, disposition or contribution of property constituted a prohibited transaction, we would be required to pay a 100% penalty tax on any gain allocable to us from the prohibited transaction. In addition, income from a prohibited transaction might adversely affect our ability to satisfy the income tests for qualification as a REIT.
Legislative or regulatory action could adversely affect us.
In recent years, numerous legislative, judicial and administrative changes have been made to the U.S., state, local and foreign income tax laws applicable to investments in real estate, REITs, similar entities and investments. Additional changes are likely to continue to occur in the future, both in and outside of the U.S. and may impact our taxation or that of our stockholders. Any increases in tax liability could be substantial and would reduce the amount of cash available for other purposes.
Complying with REIT requirements may limit our flexibility or cause us to forego otherwise attractive opportunities.
Our use of taxable REIT subsidiaries (“TRSs”) enables us to engage in non-REIT qualifying business activities. Under the IRC, no more than 20% of the value of the assets of a REIT may be represented by securities of one or more TRSs and other non-qualifying assets. This limitation may hinder our ability to make certain attractive investments, including the purchase of non-qualifying assets, the expansion of non-real estate activities and investments in the businesses to be conducted by our TRSs, and to that extent limit our opportunities.
None.
ITEM 1C. Cybersecurity
Due to our reliance on digital technology and electronic communications to run our business, cybersecurity threats and incidents pose an ongoing and escalating risk to our internal and third-party provided information systems and data, reputation and shareholder value, results of operations and financial condition. Our Chief Technology Officer, who reports directly to our Chief Executive Officer, holds over 25 years of experience in information technology, specifically infrastructure, information security and fraud, and identity solutions at large global companies, and our Vice President of Information Technology (“IT”) Governance, who reports to our Chief Technology Officer, holds over 20 years of experience in various information security roles. Together, our Chief Technology Officer and Vice President of IT Governance ("IT leadership") oversee and lead our information security program and our business strategy, financial planning and capital allocation around our cybersecurity risk management and governance practices. We also have an established Incident Response Team (“IRT”) to respond to and manage cybersecurity events. This team includes our IT leadership as well as senior leadership from our accounting, legal, corporate communications and risk management departments with subject-matter expertise and established tenure at Prologis in their respective areas. The IRT is tasked with taking appropriate action to safeguard the integrity of our information systems, data and network resources, investigate whether a breach occurred, define disclosures, communicate effectively with key audiences, including the Board as necessary, mitigate cybersecurity incident risks and provide a resolution through our cybersecurity incident communication protocols. Additionally, on an annual basis the IRT is involved and engaged in security initiatives, including tabletop exercises facilitated both internally and externally, to stay relevant on current practices in the areas of cybersecurity.
The processes implemented by our IT leadership and IRT to oversee and identify cybersecurity risks are based on the Prologis Information Security Policy governed by the United States National Institute of Standards and Technology Cybersecurity Framework. The framework focuses on six key categories of cybersecurity risk management and governance: (i) govern: establish and monitor risk management strategy, expectations and policies to ensure accountability and informed decision-making across the organization; (ii) identify: develop an organizational understanding to manage cybersecurity risk to systems, people, assets, data and capabilities; (iii) protect: develop and implement appropriate safeguards to ensure delivery of critical services; (iv) detect: develop and implement appropriate activities to identify the occurrence of a cybersecurity event; (v) respond: develop and implement appropriate activities to take actions regarding a detected cybersecurity incident; and (vi) recover: develop and implement appropriate activities to maintain plans for resilience and to restore any capabilities or service that were impaired due to a cybersecurity incident. This framework is utilized within our organization as part of an integrated risk management program that involves participation from employees, to our Board and third-party service providers, with whom we have protocols in place to mitigate cybersecurity incident risks within our supply chain through the products and services we provide and use. Additionally, all employees and contractors are required to attend mandatory cybersecurity training on an annual basis.
Our IT leadership reports to the Board on an annual basis on cybersecurity matters and, as necessary, when incidents arise in accordance with our cybersecurity incident communication protocols. Our Board, specifically our Audit Committee, oversees cybersecurity risks and we believe contains the necessary expertise to perform those duties, including specific industry experience within information technology. Additionally, Prologis’ cybersecurity risk management practices are reviewed and benchmarked against its peers through regular participation in a third-party security benchmarking survey. Our IT infrastructure is externally audited as part of our Sarbanes-Oxley audit process and our controls include information security standards. We also maintain standalone cybersecurity insurance and strive to adhere to local cybersecurity regulations in all the countries we do business. We believe that risks from cybersecurity threats, including as a result of any previous cybersecurity incidents, have not materially affected, and are not reasonably likely to materially affect Prologis, including its business strategy, results of operations or financial condition. Please refer to “Our business and operations could suffer in the event of system failures, cybersecurity attacks or risks associated with AI” under Item 1A. Risk Factors.
ITEM 2. Properties
GEOGRAPHIC DISTRIBUTION
We predominately invest in logistics facilities. Our properties are typically used for distribution, storage, packaging, assembly and light manufacturing of consumer products. The vast majority of our operating properties are used by our customers for retail and online fulfillment and business-to-business transactions.
The following tables provide details of our consolidated operating properties, investment in land and development portfolio and our O&M portfolio. The O&M portfolio includes the properties we consolidate and the properties owned by our unconsolidated co-investment ventures reflected at 100% of the amount included in the ventures’ financial statements as calculated on a GAAP basis, not our proportionate share.
Included in the operating property information below for our consolidated operating properties are 541 buildings owned primarily by one co-investment venture that we consolidate but of which we own less than 100% of the equity. No individual property or market amounted to 10% or more of our consolidated total assets at December 31, 2025, or generated revenue equal to 10% or more of our consolidated total revenues for the year ended December 31, 2025, with the exception of the Southern California market. Dollars and square feet in the following tables are in millions:
|
|
|
|
|
|
|
|
|
|
|
|
|
|
|
|
|
|
|
|
|
|
|
Operating Properties |
|
|
|
Consolidated |
|
|
O&M |
|
Geographies |
|
Rentable Square Footage |
|
|
Gross Book Value |
|
|
Encumbrances (1) |
|
|
Rentable Square Footage |
|
|
Gross Book Value |
|
U.S.: |
|
|
|
|
|
|
|
|
|
|
|
|
|
|
|
Atlanta |
|
|
45 |
|
|
$ |
3,842 |
|
|
$ |
- |
|
|
|
52 |
|
|
$ |
4,491 |
|
Baltimore/Washington D.C. |
|
|
14 |
|
|
|
2,076 |
|
|
|
- |
|
|
|
18 |
|
|
|
2,777 |
|
Central Valley |
|
|
21 |
|
|
|
1,836 |
|
|
|
- |
|
|
|
23 |
|
|
|
1,985 |
|
Chicago |
|
|
52 |
|
|
|
5,060 |
|
|
|
- |
|
|
|
70 |
|
|
|
6,842 |
|
Dallas/Ft. Worth |
|
|
52 |
|
|
|
4,748 |
|
|
|
- |
|
|
|
61 |
|
|
|
5,630 |
|
Houston |
|
|
31 |
|
|
|
3,251 |
|
|
|
- |
|
|
|
37 |
|
|
|
3,802 |
|
Lehigh Valley |
|
|
31 |
|
|
|
4,003 |
|
|
|
- |
|
|
|
36 |
|
|
|
4,593 |
|
New Jersey/New York City |
|
|
43 |
|
|
|
7,943 |
|
|
|
2 |
|
|
|
54 |
|
|
|
9,879 |
|
San Francisco Bay Area |
|
|
24 |
|
|
|
4,150 |
|
|
|
19 |
|
|
|
29 |
|
|
|
4,951 |
|
Seattle |
|
|
17 |
|
|
|
2,911 |
|
|
|
- |
|
|
|
25 |
|
|
|
3,831 |
|
South Florida |
|
|
22 |
|
|
|
4,076 |
|
|
|
63 |
|
|
|
30 |
|
|
|
5,371 |
|
Southern California |
|
|
108 |
|
|
|
18,686 |
|
|
|
7 |
|
|
|
127 |
|
|
|
21,136 |
|
Remaining Markets – U.S. (18 markets) (2) |
|
|
157 |
|
|
|
14,291 |
|
|
|
62 |
|
|
|
194 |
|
|
|
17,694 |
|
Subtotal U.S. |
|
|
617 |
|
|
|
76,873 |
|
|
|
153 |
|
|
|
756 |
|
|
|
92,982 |
|
Other Americas: |
|
|
|
|
|
|
|
|
|
|
|
|
|
|
|
Brazil |
|
|
1 |
|
|
|
77 |
|
|
|
- |
|
|
|
20 |
|
|
|
1,028 |
|
Canada |
|
|
13 |
|
|
|
1,453 |
|
|
|
- |
|
|
|
13 |
|
|
|
1,453 |
|
Mexico |
|
|
2 |
|
|
|
142 |
|
|
|
- |
|
|
|
68 |
|
|
|
5,493 |
|
Subtotal Other Americas |
|
|
16 |
|
|
|
1,672 |
|
|
|
- |
|
|
|
101 |
|
|
|
7,974 |
|
Europe: |
|
|
|
|
|
|
|
|
|
|
|
|
|
|
|
France |
|
|
1 |
|
|
|
39 |
|
|
|
- |
|
|
|
36 |
|
|
|
3,899 |
|
Germany |
|
* |
|
|
|
37 |
|
|
|
- |
|
|
|
38 |
|
|
|
4,855 |
|
Netherlands |
|
|
1 |
|
|
|
86 |
|
|
|
- |
|
|
|
31 |
|
|
|
3,844 |
|
U.K. |
|
|
2 |
|
|
|
459 |
|
|
|
- |
|
|
|
34 |
|
|
|
8,801 |
|
Remaining Countries – Europe (8 countries) (2) |
|
|
4 |
|
|
|
436 |
|
|
|
- |
|
|
|
106 |
|
|
|
9,822 |
|
Subtotal Europe |
|
|
8 |
|
|
|
1,057 |
|
|
|
- |
|
|
|
245 |
|
|
|
31,221 |
|
Asia: |
|
|
|
|
|
|
|
|
|
|
|
|
|
|
|
China |
|
|
- |
|
|
|
- |
|
|
|
- |
|
|
|
53 |
|
|
|
3,005 |
|
India |
|
* |
|
|
|
18 |
|
|
|
- |
|
|
* |
|
|
|
18 |
|
Japan |
|
|
3 |
|
|
|
273 |
|
|
|
- |
|
|
|
51 |
|
|
|
7,086 |
|
Singapore |
|
|
1 |
|
|
|
150 |
|
|
|
- |
|
|
|
1 |
|
|
|
150 |
|
Subtotal Asia |
|
|
4 |
|
|
|
441 |
|
|
|
- |
|
|
|
105 |
|
|
|
10,259 |
|
Total operating portfolio (3) |
|
|
645 |
|
|
|
80,043 |
|
|
|
153 |
|
|
|
1,207 |
|
|
|
142,436 |
|
Value-added properties (4) |
|
|
4 |
|
|
|
687 |
|
|
|
- |
|
|
|
6 |
|
|
|
968 |
|
Total operating properties |
|
|
649 |
|
|
$ |
80,730 |
|
|
$ |
153 |
|
|
|
1,213 |
|
|
$ |
143,404 |
|
|
|
|
|
|
|
|
|
|
|
|
|
|
|
|
|
Items notated by ‘*’ indicate an amount less than one million that rounds to zero. |
|
|
|
|
|
|
|
|
|
|
|
|
|
|
|
|
|
|
|
|
|
|
|
|
Consolidated – Investment in Land |
|
|
Consolidated – Development Portfolio |
|
Geographies |
|
Acres |
|
|
Estimated Build Out Potential
(square feet) (5) |
|
|
Current Investment |
|
|
Rentable Square Footage Upon Completion |
|
|
TEI (6) |
|
U.S.: |
|
|
|
|
|
|
|
|
|
|
|
|
|
|
|
Atlanta |
|
|
319 |
|
|
|
3 |
|
|
$ |
44 |
|
|
|
2 |
|
|
$ |
239 |
|
Baltimore/Washington D.C. |
|
|
111 |
|
|
|
1 |
|
|
|
83 |
|
|
* |
|
|
|
66 |
|
Central Valley |
|
|
633 |
|
|
|
10 |
|
|
|
203 |
|
|
|
3 |
|
|
|
402 |
|
Chicago |
|
|
84 |
|
|
|
1 |
|
|
|
24 |
|
|
|
- |
|
|
|
- |
|
Dallas/Ft. Worth |
|
|
495 |
|
|
|
7 |
|
|
|
192 |
|
|
|
- |
|
|
|
- |
|
Houston |
|
|
400 |
|
|
|
6 |
|
|
|
164 |
|
|
* |
|
|
|
46 |
|
Lehigh Valley |
|
|
105 |
|
|
|
1 |
|
|
|
39 |
|
|
|
- |
|
|
|
- |
|
New Jersey/New York City |
|
|
343 |
|
|
|
3 |
|
|
|
360 |
|
|
|
1 |
|
|
|
219 |
|
San Francisco Bay Area |
|
|
41 |
|
|
|
1 |
|
|
|
75 |
|
|
|
1 |
|
|
|
154 |
|
Seattle |
|
|
45 |
|
|
|
1 |
|
|
|
39 |
|
|
* |
|
|
|
41 |
|
South Florida |
|
|
81 |
|
|
|
1 |
|
|
|
104 |
|
|
* |
|
|
|
80 |
|
Southern California |
|
|
565 |
|
|
|
9 |
|
|
|
693 |
|
|
|
1 |
|
|
|
259 |
|
Remaining Markets – U.S. (15 markets) |
|
|
2,289 |
|
|
|
33 |
|
|
|
866 |
|
|
|
3 |
|
|
|
1,055 |
|
Subtotal U.S. |
|
|
5,511 |
|
|
|
77 |
|
|
|
2,886 |
|
|
|
11 |
|
|
|
2,561 |
|
Other Americas: |
|
|
|
|
|
|
|
|
|
|
|
|
|
|
|
Brazil |
|
|
658 |
|
|
|
14 |
|
|
|
268 |
|
|
|
- |
|
|
|
- |
|
Canada |
|
|
362 |
|
|
|
7 |
|
|
|
667 |
|
|
|
1 |
|
|
|
224 |
|
Mexico |
|
|
743 |
|
|
|
14 |
|
|
|
292 |
|
|
|
2 |
|
|
|
224 |
|
Subtotal Other Americas |
|
|
1,763 |
|
|
|
35 |
|
|
|
1,227 |
|
|
|
3 |
|
|
|
448 |
|
Europe: |
|
|
|
|
|
|
|
|
|
|
|
|
|
|
|
France |
|
|
168 |
|
|
|
3 |
|
|
|
54 |
|
|
|
1 |
|
|
|
85 |
|
Germany |
|
|
51 |
|
|
|
1 |
|
|
|
67 |
|
|
* |
|
|
|
34 |
|
Netherlands |
|
|
55 |
|
|
|
1 |
|
|
|
61 |
|
|
* |
|
|
|
36 |
|
U.K. |
|
|
270 |
|
|
|
6 |
|
|
|
210 |
|
|
|
2 |
|
|
|
743 |
|
Remaining Countries – Europe (7 countries) |
|
|
635 |
|
|
|
12 |
|
|
|
154 |
|
|
|
2 |
|
|
|
153 |
|
Subtotal Europe |
|
|
1,179 |
|
|
|
23 |
|
|
|
546 |
|
|
|
5 |
|
|
|
1,051 |
|
Asia: |
|
|
|
|
|
|
|
|
|
|
|
|
|
|
|
India |
|
|
263 |
|
|
|
6 |
|
|
|
74 |
|
|
|
1 |
|
|
|
64 |
|
Japan |
|
|
99 |
|
|
|
6 |
|
|
|
155 |
|
|
|
4 |
|
|
|
714 |
|
Subtotal Asia |
|
|
362 |
|
|
|
12 |
|
|
|
229 |
|
|
|
5 |
|
|
|
778 |
|
Total land and development portfolio |
|
|
8,815 |
|
|
|
147 |
|
|
$ |
4,888 |
|
|
|
24 |
|
|
$ |
4,838 |
|
|
|
|
|
|
|
|
|
|
|
|
|
|
|
|
|
Items notated by ‘*’ indicate an amount less than one million that rounds to zero. |
|
(1)Certain of our consolidated properties are pledged as security under secured mortgage debt and assessment bonds. For purposes of this table, the total principal balance of a debt issuance that is secured by a pool of properties is allocated among the properties in the pool based on each property’s investment balance. In addition to the amounts reflected here, we also have $43 million of encumbrances related to one land parcel included in the consolidated portfolio.
(2)No remaining market within the U.S. or country within Europe represented more than 2% of the total gross book value of the consolidated and O&M operating properties.
(3)Included in our consolidated operating properties are properties that we consider to be held for contribution and are presented within Assets Held for Sale or Contribution in the Consolidated Balance Sheets. We include these properties in our operating portfolio as they are expected to be contributed to our co-investment ventures and remain in our O&M operating portfolio. At December 31, 2025, we had investments in real estate properties that were expected to be contributed to our unconsolidated co-investment ventures totaling $169 million and aggregating 1 million square feet. See Note 5 to the Consolidated Financial Statements in Item 8. Financial Statements and Supplementary Data for further information on our Assets Held for Sale or Contribution.
(4)Value-added properties are properties we have either acquired at a discount and believe we could provide greater returns post-stabilization or properties we expect to repurpose to higher uses.
(5)Represents the estimated finished square feet available for lease upon completion of a building on existing parcels of land.
(6)TEI is based on current projections and is subject to change. As noted in the table below, our current investment in the development portfolio was $3.0 billion, leaving approximately $1.8 billion of additional required investment. At December 31, 2025, based on TEI, approximately 24% of the properties in the development portfolio were completed but not yet stabilized, 54% of the properties were expected to be completed before December 31, 2026, and the remaining properties were expected to be completed before September 2027. TEI excludes $262 million related to a development recorded as a note receivable that is
included in other real estate investments and includes the development of data centers with an aggregate TEI of $686 million, on a consolidated basis.
The following table summarizes our investment in consolidated real estate properties at December 31, 2025 (in millions):
|
|
|
|
|
|
|
Investment Before Depreciation |
|
Operating properties, excluding assets held for sale or contribution |
|
$ |
80,561 |
|
Development portfolio, including cost of land |
|
|
3,019 |
|
Land |
|
|
4,888 |
|
Other real estate investments (1) |
|
|
6,661 |
|
Total consolidated real estate properties |
|
$ |
95,129 |
|
(1)Included in other real estate investments were principally: (i) land parcels we own and lease to third parties; (ii) renewable energy assets, including solar, electric vehicle charging and energy storage; (iii) non-strategic real estate assets that we do not intend to operate long term; (iv) newly developed and stabilized data centers; and (v) non-industrial real estate assets that we intend to redevelop as industrial properties or data centers.
LEASE EXPIRATIONS
We generally lease our properties on a long-term basis (the weighted average term for leases commenced, including new leases and renewals, in 2025 was 70 months). The following table summarizes the lease expirations of our consolidated operating portfolio for leases in place at December 31, 2025 (dollars and square feet in millions):
|
|
|
|
|
|
|
|
|
|
|
|
|
|
|
|
|
|
|
|
|
|
NER |
|
|
|
Occupied Square Feet |
|
|
Dollars |
|
|
% of Total |
|
|
Dollars Per Square Foot |
|
2026 (1) |
|
|
71 |
|
|
$ |
547 |
|
|
|
9.6 |
% |
|
$ |
7.70 |
|
2027 |
|
|
104 |
|
|
|
854 |
|
|
|
14.9 |
% |
|
|
8.21 |
|
2028 |
|
|
90 |
|
|
|
825 |
|
|
|
14.4 |
% |
|
|
9.17 |
|
2029 |
|
|
82 |
|
|
|
783 |
|
|
|
13.7 |
% |
|
|
9.55 |
|
2030 |
|
|
76 |
|
|
|
762 |
|
|
|
13.3 |
% |
|
|
10.03 |
|
2031 |
|
|
54 |
|
|
|
506 |
|
|
|
8.8 |
% |
|
|
9.37 |
|
2032 |
|
|
37 |
|
|
|
335 |
|
|
|
5.9 |
% |
|
|
9.05 |
|
2033 |
|
|
29 |
|
|
|
284 |
|
|
|
5.0 |
% |
|
|
9.79 |
|
2034 |
|
|
17 |
|
|
|
180 |
|
|
|
3.1 |
% |
|
|
10.59 |
|
2035 |
|
|
20 |
|
|
|
255 |
|
|
|
4.5 |
% |
|
|
12.75 |
|
Thereafter |
|
|
33 |
|
|
|
395 |
|
|
|
6.8 |
% |
|
|
11.97 |
|
|
|
|
613 |
|
|
$ |
5,726 |
|
|
|
100.0 |
% |
|
$ |
9.34 |
|
Month to month |
|
|
3 |
|
|
|
|
|
|
|
|
|
|
Total consolidated |
|
|
616 |
|
|
|
|
|
|
|
|
|
|
(1)We have signed leases that were due to expire in 2026, totaling 32 million square feet in our consolidated portfolio (4.2% of total NER). These are excluded from 2026 expirations and are reflected at their respective expiration year.
CO-INVESTMENT VENTURES
Included in our O&M portfolio are consolidated and unconsolidated co-investment ventures that hold investments in real estate properties, primarily logistics facilities, that we also manage. Our unconsolidated co-investment ventures are accounted for under the equity method. The amounts included for the unconsolidated ventures are reflected at 100% of the amount included in the ventures’ financial statements as calculated on a GAAP basis, not our proportionate share. The following table summarizes our consolidated and unconsolidated co-investment ventures at December 31, 2025 (in millions):
|
|
|
|
|
|
|
|
|
|
|
|
|
|
|
|
|
|
|
Operating Properties |
|
|
|
|
|
|
|
|
|
Square Feet |
|
|
Gross
Book Value |
|
|
Investment
in Land |
|
|
Development Portfolio – TEI |
|
Consolidated Co-Investment Venture |
|
|
|
|
|
|
|
|
|
|
|
|
U.S.: |
|
|
|
|
|
|
|
|
|
|
|
|
Prologis U.S. Logistics Venture (“USLV”) |
|
|
78 |
|
|
$ |
8,439 |
|
|
$ |
5 |
|
|
$ |
- |
|
Total |
|
|
78 |
|
|
$ |
8,439 |
|
|
$ |
5 |
|
|
$ |
- |
|
|
|
|
|
|
|
|
|
|
|
|
|
|
Unconsolidated Co-Investment Ventures |
|
|
|
|
|
|
|
|
|
|
|
|
U.S.: |
|
|
|
|
|
|
|
|
|
|
|
|
Prologis Targeted U.S. Logistics Fund (“USLF”) |
|
|
139 |
|
|
$ |
16,210 |
|
|
$ |
21 |
|
|
$ |
126 |
|
Other Americas: |
|
|
|
|
|
|
|
|
|
|
|
|
FIBRA Prologis |
|
|
66 |
|
|
|
5,373 |
|
|
|
22 |
|
|
|
- |
|
Prologis Brazil Logistics Venture ("PBLV") and other joint
ventures |
|
|
19 |
|
|
|
951 |
|
|
|
12 |
|
|
|
194 |
|
Subtotal Other Americas |
|
|
85 |
|
|
|
6,324 |
|
|
|
34 |
|
|
|
194 |
|
Europe: |
|
|
|
|
|
|
|
|
|
|
|
|
Prologis European Logistics Fund (“PELF”) |
|
|
174 |
|
|
|
22,117 |
|
|
|
8 |
|
|
|
39 |
|
Prologis European Logistics Partners (“PELP”) |
|
|
64 |
|
|
|
8,205 |
|
|
|
210 |
|
|
|
39 |
|
Subtotal Europe |
|
|
238 |
|
|
|
30,322 |
|
|
|
218 |
|
|
|
78 |
|
Asia: |
|
|
|
|
|
|
|
|
|
|
|
|
Nippon Prologis REIT, Inc. (“NPR”) |
|
|
45 |
|
|
|
6,200 |
|
|
|
- |
|
|
|
- |
|
Prologis Japan Core Logistics Fund ("PJLF") |
|
|
4 |
|
|
|
614 |
|
|
|
- |
|
|
|
- |
|
Prologis China Core Logistics Fund (“PCCLF”) |
|
|
26 |
|
|
|
1,919 |
|
|
|
- |
|
|
|
- |
|
China AMC Prologis Logistics REIT ("Prologis C-REIT") |
|
|
4 |
|
|
|
328 |
|
|
|
- |
|
|
|
- |
|
Prologis China Logistics Venture |
|
|
23 |
|
|
|
757 |
|
|
|
26 |
|
|
|
71 |
|
Subtotal Asia |
|
|
102 |
|
|
|
9,818 |
|
|
|
26 |
|
|
|
71 |
|
Total |
|
|
564 |
|
|
$ |
62,674 |
|
|
$ |
299 |
|
|
$ |
469 |
|
For more information regarding our unconsolidated and consolidated co-investment ventures, see Notes 4 and 10 to the Consolidated Financial Statements in Item 8. Financial Statements and Supplementary Data.
ITEM 3. Legal Proceedings
From time to time, we and our co-investment ventures are parties to a variety of legal proceedings arising in the ordinary course of business. We believe that, with respect to any such matters to which we are currently a party, the ultimate disposition of any such matter will not result in a material adverse effect on our business, financial position or results of operations.
ITEM 4. Mine Safety Disclosures
Not Applicable.
PART II
ITEM 5. Market for Registrant’s Common Equity, Related Stockholder Matters and Issuer Purchases of Equity Securities
MARKET INFORMATION AND HOLDERS
Our common stock is listed on the NYSE under the symbol “PLD.”
Stock Performance Graph
The following line graph compares the change in Prologis, Inc. cumulative total stockholder’s return on shares of its common stock from December 31, 2020, to the cumulative total return of the S&P 500 Stock Index and the Financial Times and Stock Exchange NAREIT Equity REITs Index from December 31, 2020, to December 31, 2025. The graph assumes an initial investment of $100 in our common stock and each of the indices on December 31, 2020, and, as required by the SEC, the reinvestment of all dividends. The return shown on the graph is not necessarily indicative of future performance.
This graph and the accompanying text are not “soliciting material,” are not deemed filed with the SEC and are not to be incorporated by reference in any filing by the Company under the Securities Act of 1933, as amended, or the Securities Exchange Act of 1934, as amended, whether made before or after the date hereof and irrespective of any general incorporation language in any such filing.
PREFERRED STOCK DIVIDENDS
At December 31, 2025, we had 1.3 million shares of Series Q preferred stock outstanding with a liquidation preference of $50 per share that will be redeemable at our option on or after November 13, 2026. Dividends payable per share were $4.27 for the year ended December 31, 2025.
For more information regarding dividends, see Note 8 to the Consolidated Financial Statements in Item 8. Financial Statements and Supplementary Data.
SALES OF UNREGISTERED SECURITIES
During 2025, we issued 2.4 million shares of common stock of Prologis, Inc. in connection with the redemption of common units of Prologis, L.P. pursuant to the terms of the limited partnership agreement of Prologis, L.P. These issuances were made in reliance on the exemption from registration requirements of the Securities Act of 1933, as amended, afforded by Section 4(a)(2) thereof.
PURCHASES OF EQUITY SECURITIES
During 2025, we did not purchase any common stock of Prologis, Inc. in connection with our share purchase program.
SECURITIES AUTHORIZED FOR ISSUANCE UNDER EQUITY COMPENSATION PLANS
For information regarding securities authorized for issuance under our equity compensation plans, see Notes 8 and 11 to the Consolidated Financial Statements in Item 8. Financial Statements and Supplementary Data.
OTHER STOCKHOLDER MATTERS
Common Stock Plans
Further information relative to our equity compensation plans will be provided in our 2026 Proxy Statement or in an amendment filed on Form 10-K/A.
ITEM 6. [Reserved]
ITEM 7. Management’s Discussion and Analysis of Financial Condition and Results of Operations
The following discussion should be read in conjunction with the Consolidated Financial Statements included in Item 8. Financial Statements and Supplementary Data of this report and the matters described under Item 1A. Risk Factors.
A discussion regarding our financial condition and results of operations for 2025 compared to 2024 is presented below. Information on 2023 is included in graphs only to show year over year trends in our results of operations and operating metrics. Our financial condition for 2023, results of operations for 2023, and 2024 compared to 2023 are referenced throughout this document and can be found under Item 7. Management’s Discussion and Analysis of Financial Condition and Results of Operations, which is incorporated by reference herein to our Annual Report on Form 10-K for the fiscal year ended December 31, 2024, filed with the SEC on February 14, 2025, and is available on the SEC’s website at www.sec.gov and our Investor Relations website at ir.prologis.com.
MANAGEMENT’S OVERVIEW
Summary of 2025
Our operating results and leasing activity remained resilient in 2025, with performance strengthening as the year progressed, despite economic disruption related to tariff policy proposals announced in April. Leasing activity in our consolidated portfolio remained healthy, supported by improved customer sentiment and market conditions, with 112 million square feet of new leases signed during the year (228 million square feet on an O&M basis).
Our results during 2025 continued to reflect the favorable mark-to-market of our existing leases, reflecting increases in market rents over the past several years. As a result, rent change on rollover and same-store growth in our O&M portfolio remained strong. This lease mark-to-market remained meaningfully positive at 18% (on an NER and our share basis), despite recent quarters of lower, or in some cases negative, market rental growth, reflecting the accumulated rent growth embedded in our in-place leases that remains to be realized.
These factors contributed to occupancy in our operating portfolio of 95.6% at December 31, 2025, and rent change on leases that commenced during the year of 50.1% on a net effective basis, both metrics based on our ownership share.
Demand conditions were also evident in our development activity. We focused on starting build-to-suit projects during 2025 and commenced $2.9 billion of consolidated development projects, of which 60.9% were build-to-suit projects.
While we believe we are well-positioned for long-term revenue growth, supported by embedded rent growth in our in-place portfolio and our development pipeline, the potential impact of ongoing economic uncertainty on our business, future financial condition and operating results remains difficult to predict.
We completed the following significant activities in 2025, as described in the Notes to the Consolidated Financial Statements:
•We generated net proceeds of $2.7 billion and realized net gains on real estate transactions of $944 million, principally from the contribution of properties we developed to our unconsolidated co-investment ventures in the U.S. and Europe and sales to third parties in the U.S., including a data center.
•In December, we listed China AMC Prologis Logistics REIT ("Prologis C-REIT") on the Shenzhen Stock Exchange. The Prologis C-REIT purchased properties from our open-ended venture in China. At December 31, 2025, we owned 20.7% of the venture.
•At December 31, 2025, we had total available liquidity of $7.6 billion, including available capacity on our credit facilities of $6.5 billion and unrestricted cash balances of $1.1 billion.
•At December 31, 2025, our total debt was $35.0 billion with a weighted average term of 9 years and an effective interest rate of 3.2%. Our financing activities during the year included the following:
•In May 2025, we amended and restated one of our global credit facilities while maintaining its existing borrowing capacity of $3.0 billion and extending the maturity date to June 2029, with an option to extend to June 2030.
•In June 2025, we established an additional commercial paper program, under which we may issue, repay and re-issue short-term unsecured commercial paper notes (“CPNs”) denominated in British pound sterling, euros or U.S. dollars in an aggregate amount of up to €1.0 billion (or its equivalent in other currencies). At any point in time, we are required to maintain available commitments under our credit facilities in an amount at least equal to the amount of the CPNs outstanding.
•We issued $3.4 billion of senior notes with an issuance date weighted average interest rate of 4.2% and weighted average term of 8 years (principal in millions):
|
|
|
|
|
|
|
|
|
|
|
|
|
|
|
|
|
|
|
|
|
|
|
Aggregate Principal |
|
|
Issuance Date Weighted Average |
|
|
|
Issuance Date |
|
Borrowing Currency |
|
|
USD (1) |
|
|
Interest Rate |
|
Term (Years) |
|
Maturity Dates |
|
February |
|
C$ |
|
750 |
|
|
$ |
520 |
|
|
4.2% |
|
|
8.0 |
|
|
|
February 2033 |
|
May |
|
$ |
|
1,250 |
|
|
$ |
1,250 |
|
|
5.1% |
|
|
8.3 |
|
|
|
January 2031 – May 2035 |
|
September |
|
€ |
|
1,000 |
|
|
$ |
1,178 |
|
|
3.6% |
|
|
9.5 |
|
|
|
September 2032 – 2037 |
|
October |
|
C$ |
|
700 |
|
|
$ |
501 |
|
|
3.6% |
|
|
6.3 |
|
|
|
February 2032 |
|
Total |
|
|
|
|
|
$ |
3,449 |
|
|
4.2% |
|
|
8.4 |
|
|
|
|
|
|
|
|
|
|
|
|
|
|
|
|
|
|
|
|
|
|
(1) The exchange rate used to calculate into U.S. dollars was the spot rate at the settlement date. |
RESULTS OF OPERATIONS
We evaluate our business operations based on the NOI of our two reportable segments: Real Estate (Rental Operations and Development) and Strategic Capital. NOI by segment is a non-GAAP performance measure that is calculated using revenues and expenses directly from our financial statements. We consider NOI by segment to be an appropriate supplemental measure of our performance because it helps management and investors understand our operating results.
Below is our NOI by segment per the Consolidated Financial Statements and a reconciliation of NOI by segment to Operating Income per the Consolidated Financial Statements (in millions):
|
|
|
|
|
|
|
|
|
|
|
2025 |
|
|
2024 |
|
Real estate segment: |
|
|
|
|
|
|
Rental revenues |
|
$ |
8,159 |
|
|
$ |
7,515 |
|
Development management and other revenues |
|
|
39 |
|
|
|
14 |
|
Rental expenses |
|
|
(1,964 |
) |
|
|
(1,765 |
) |
Other expenses |
|
|
(46 |
) |
|
|
(47 |
) |
Real Estate Segment – NOI |
|
|
6,188 |
|
|
|
5,717 |
|
|
|
|
|
|
|
|
Strategic capital segment: |
|
|
|
|
|
|
Strategic capital revenues |
|
|
592 |
|
|
|
672 |
|
Strategic capital expenses |
|
|
(271 |
) |
|
|
(292 |
) |
Strategic Capital Segment – NOI |
|
|
321 |
|
|
|
380 |
|
|
|
|
|
|
|
|
General and administrative expenses |
|
|
(469 |
) |
|
|
(419 |
) |
Depreciation and amortization expenses |
|
|
(2,626 |
) |
|
|
(2,580 |
) |
Operating income before gains on real estate transactions, net |
|
|
3,414 |
|
|
|
3,098 |
|
Gains on dispositions of development properties and land, net |
|
|
258 |
|
|
|
414 |
|
Gains on other dispositions of investments in real estate, net |
|
|
686 |
|
|
|
904 |
|
Operating income |
|
$ |
4,358 |
|
|
$ |
4,416 |
|
See Note 16 to the Consolidated Financial Statements for more information on our segments and a reconciliation of each reportable segment’s NOI to Operating Income and Earnings Before Income Taxes.
Real Estate Segment
This reportable segment principally includes rental revenue and rental expenses recognized from our consolidated properties. This segment also includes the operating results of our renewable energy assets. We allocate the costs of our property management and leasing functions to the Real Estate Segment through Rental Expenses and the Strategic Capital Segment through Strategic Capital
Expenses, both in the Consolidated Financial Statements, based on the square footage of the relative portfolios. In addition, this segment is impacted by our development, acquisition and disposition activities.
Below are the components of Real Estate Segment NOI, derived directly from line items in the Consolidated Financial Statements (in millions):
|
|
|
|
|
|
|
|
|
|
|
2025 |
|
|
2024 |
|
Rental revenues |
|
$ |
8,159 |
|
|
$ |
7,515 |
|
Development management and other revenues |
|
|
39 |
|
|
|
14 |
|
Rental expenses |
|
|
(1,964 |
) |
|
|
(1,765 |
) |
Other expenses |
|
|
(46 |
) |
|
|
(47 |
) |
Real Estate Segment – NOI |
|
$ |
6,188 |
|
|
$ |
5,717 |
|
The $471 million change in Real Estate Segment (“RES”) NOI in 2025 compared to 2024, was impacted by the following activities (in millions):
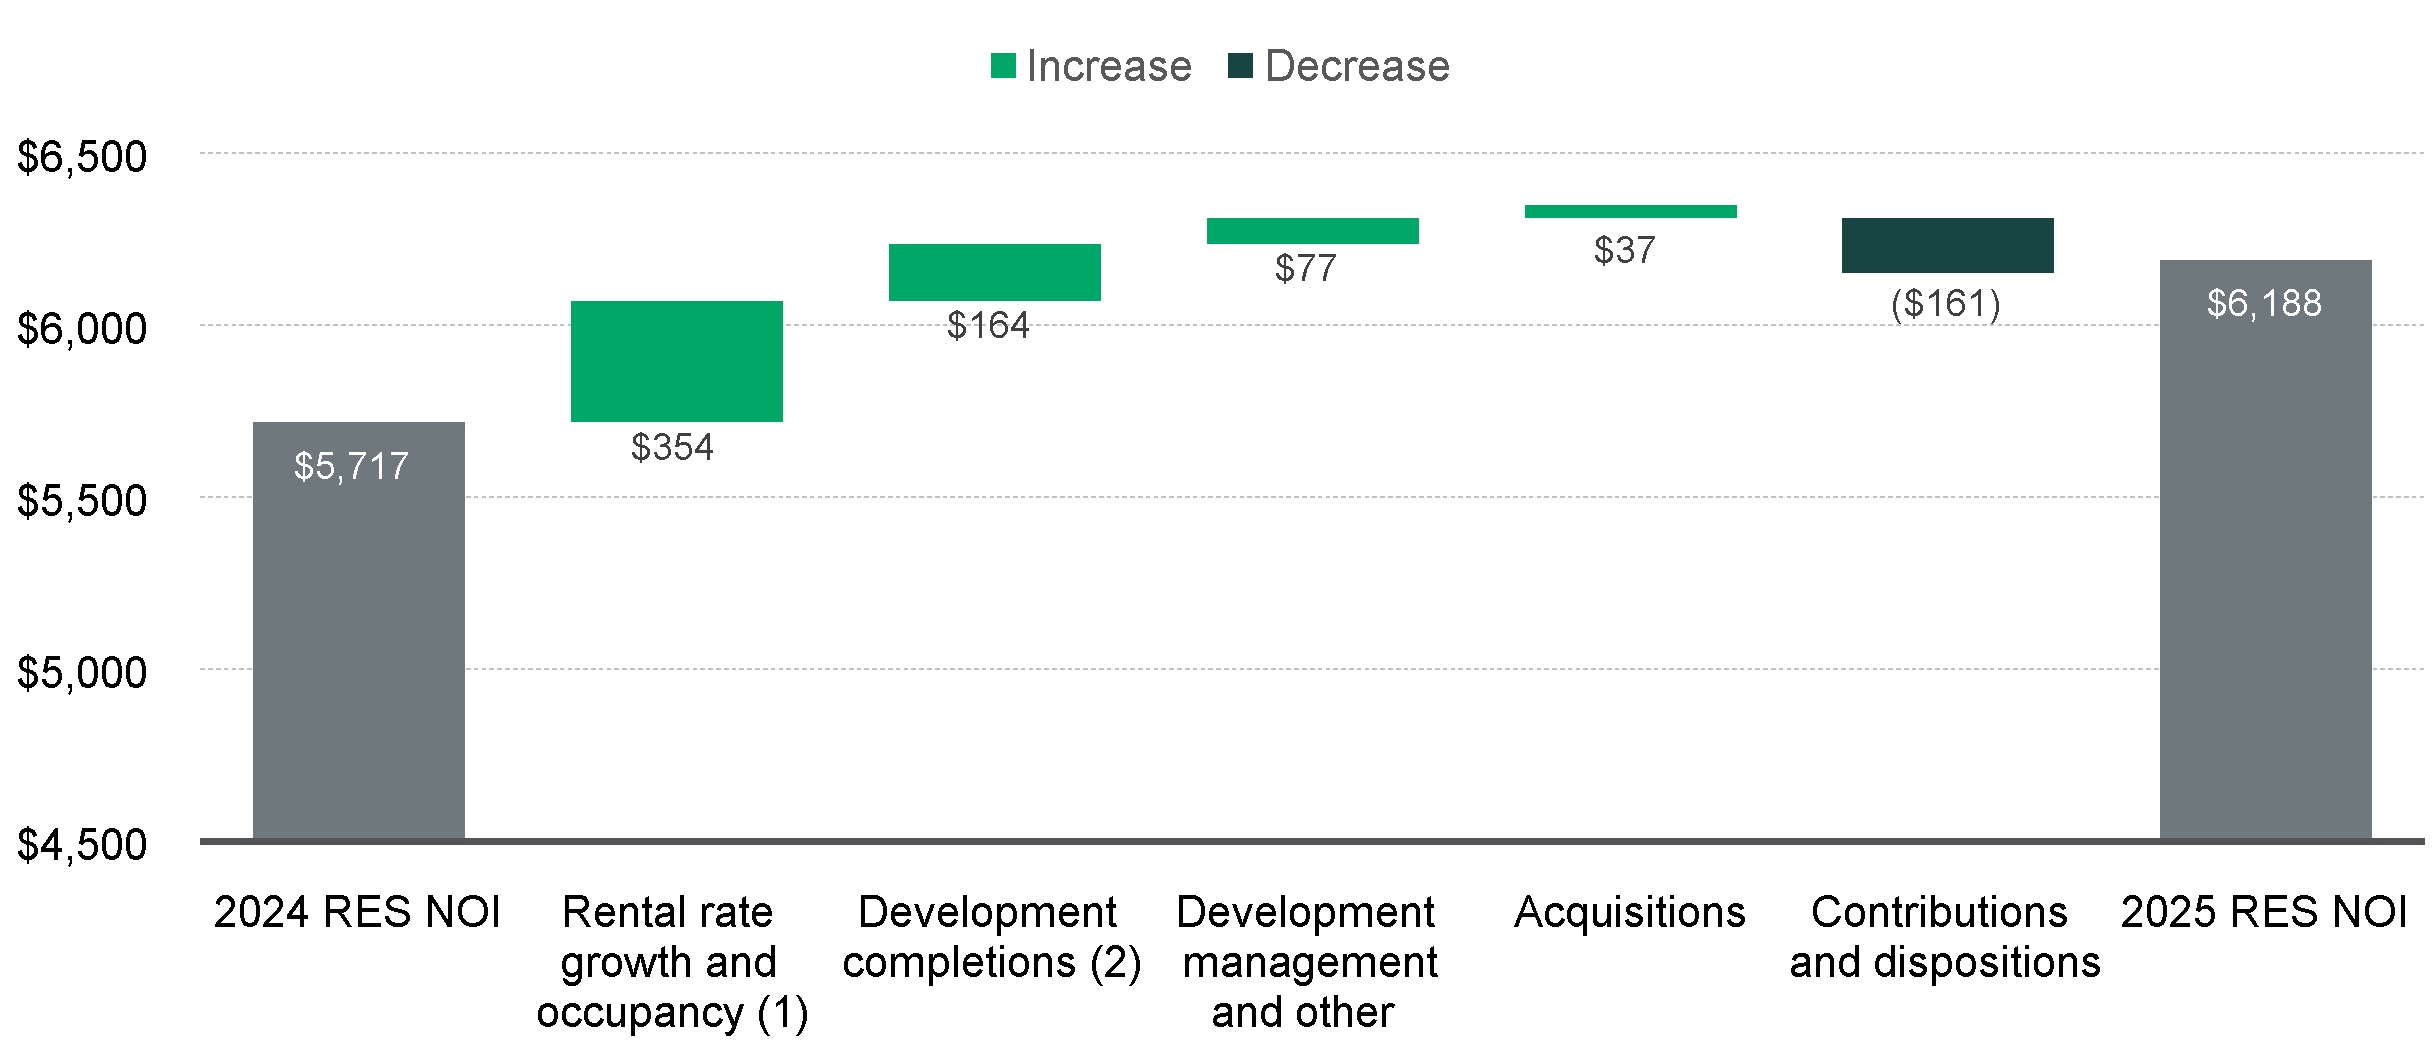
(1)Significant rent change due to higher rental rates on the rollover of leases during both periods continues to be a key driver of increasing rental income. See below for key metrics on rent change on rollover and occupancy.
(2)We calculate changes in NOI from development completions period over period by comparing the change in NOI generated on the pool of developments that completed on or after January 1, 2024 through December 31, 2025.
Below are key operating metrics of our consolidated operating portfolio:
(1) Consolidated square feet of leases commenced and weighted average net effective rent change were calculated for leases with initial terms of one year or greater.
Development Activity
The following table summarizes consolidated development activity (dollars and square feet in millions):
|
|
|
|
|
|
|
|
|
|
|
2025 |
|
|
2024 |
|
Starts: |
|
|
|
|
|
|
Number of new development buildings started during the period |
|
|
41 |
|
|
|
26 |
|
Square feet |
|
|
15 |
|
|
|
7 |
|
TEI |
|
$ |
2,943 |
|
|
$ |
1,235 |
|
Percentage of build-to-suits based on TEI |
|
|
60.9 |
% |
|
|
28.6 |
% |
|
|
|
|
|
|
|
Stabilizations: |
|
|
|
|
|
|
Number of development buildings stabilized during the period |
|
|
40 |
|
|
|
72 |
|
Square feet |
|
|
11 |
|
|
|
24 |
|
TEI |
|
$ |
2,271 |
|
|
$ |
4,130 |
|
Percentage of build-to-suits based on TEI |
|
|
43.8 |
% |
|
|
32.7 |
% |
Weighted average stabilized yield (1) |
|
|
6.7 |
% |
|
|
6.2 |
% |
Estimated value at completion |
|
$ |
2,848 |
|
|
$ |
4,923 |
|
Estimated weighted average margin (2) |
|
|
25.4 |
% |
|
|
19.2 |
% |
Estimated value creation |
|
$ |
577 |
|
|
$ |
793 |
|
(1)We calculate the weighted average stabilized yield as estimated NOI assuming stabilized occupancy divided by TEI.
(2)Estimated weighted average margin is calculated on development properties as estimated value creation, less estimated closing costs and taxes, if any, on properties expected to be sold or contributed, divided by TEI. Development margins fluctuate depending on several factors including cost of capital, changes in capitalization rates that are used to estimate value at completion and location and type of development, such as build-to-suit or speculative.
At December 31, 2025, the consolidated development portfolio, including properties under development and pre-stabilized properties, was expected to be completed before September 2027 with a TEI of $5.1 billion and was 53.5% leased, including $686 million of TEI for data centers. Our investment in the development portfolio was $3.0 billion at December 31, 2025. For additional information on our development portfolio at December 31, 2025, see Item 2. Properties.
Capital Expenditures
We capitalize costs incurred in improving and leasing our consolidated operating properties and other real estate investments as part of the investment basis or within Other Assets in the Consolidated Balance Sheets. The following graph summarizes capitalized expenditures and leasing costs during each year and excludes development costs and spend subsequent to stabilization that is structural in nature:
Strategic Capital Segment
This reportable segment includes revenues from asset management and property management services, transactional services for acquisition, disposition and leasing activity and promote revenue earned from the unconsolidated co-investment ventures. Revenues associated with the Strategic Capital Segment fluctuate because of changes in the size of the portfolios through acquisitions and dispositions, the fair value of the properties, timing of promotes, foreign currency exchange rates and other transactional activity. These revenues are reduced by the direct costs associated with the asset and property-level management expenses for the properties owned by these ventures. We allocate the costs of our property management and leasing functions to the Strategic Capital Segment through
Strategic Capital Expenses and to the Real Estate Segment through Rental Expenses both in the Consolidated Financial Statements, based on the square footage of the relative portfolios. For further details regarding the key property information and summarized financial condition and operating results of our unconsolidated co-investment ventures, refer to Note 4 to the Consolidated Financial Statements.
Below are the components of Strategic Capital Segment NOI derived directly from the line items in the Consolidated Financial Statements (in millions):
|
|
|
|
|
|
|
|
|
|
|
2025 |
|
|
2024 |
|
Strategic capital revenues |
|
$ |
592 |
|
|
$ |
672 |
|
Strategic capital expenses |
|
|
(271 |
) |
|
|
(292 |
) |
Strategic Capital Segment – NOI |
|
$ |
321 |
|
|
$ |
380 |
|
Below is additional detail of our Strategic Capital Segment revenues, expenses and NOI (in millions):
|
|
|
|
|
|
|
|
|
|
|
|
|
|
|
|
|
|
|
|
|
|
|
|
|
|
|
|
|
|
|
|
|
|
|
|
|
|
|
|
|
|
|
U.S. (1) |
|
|
Other Americas |
|
|
Europe |
|
|
Asia |
|
|
Total |
|
|
|
2025 |
|
|
2024 |
|
|
2025 |
|
|
2024 |
|
|
2025 |
|
|
2024 |
|
|
2025 |
|
|
2024 |
|
|
2025 |
|
|
2024 |
|
Strategic capital revenues ($) |
|
|
|
|
|
|
|
|
|
|
|
|
|
|
|
|
|
|
|
|
|
|
|
|
|
|
|
|
|
|
Recurring fees (2) |
|
|
178 |
|
|
|
168 |
|
|
|
82 |
|
|
|
60 |
|
|
|
190 |
|
|
|
170 |
|
|
|
71 |
|
|
|
74 |
|
|
|
521 |
|
|
|
472 |
|
Transactional fees (3) |
|
|
21 |
|
|
|
17 |
|
|
|
8 |
|
|
|
7 |
|
|
|
28 |
|
|
|
24 |
|
|
|
12 |
|
|
|
13 |
|
|
|
69 |
|
|
|
61 |
|
Promote revenue (4) |
|
|
- |
|
|
|
112 |
|
|
|
- |
|
|
|
25 |
|
|
|
1 |
|
|
|
1 |
|
|
|
1 |
|
|
|
1 |
|
|
|
2 |
|
|
|
139 |
|
Total strategic capital revenues ($) |
|
|
199 |
|
|
|
297 |
|
|
|
90 |
|
|
|
92 |
|
|
|
219 |
|
|
|
195 |
|
|
|
84 |
|
|
|
88 |
|
|
|
592 |
|
|
|
672 |
|
Strategic capital expenses ($) (4) |
|
|
(132 |
) |
|
|
(155 |
) |
|
|
(22 |
) |
|
|
(21 |
) |
|
|
(73 |
) |
|
|
(76 |
) |
|
|
(44 |
) |
|
|
(40 |
) |
|
|
(271 |
) |
|
|
(292 |
) |
Strategic Capital Segment – NOI ($) |
|
|
67 |
|
|
|
142 |
|
|
|
68 |
|
|
|
71 |
|
|
|
146 |
|
|
|
119 |
|
|
|
40 |
|
|
|
48 |
|
|
|
321 |
|
|
|
380 |
|
(1)The U.S. expenses include compensation and personnel costs for employees who are based in the U.S. but also support other geographies.
(2)Recurring fees include asset management and property management fees.
(3)Transactional fees include leasing commissions, acquisition, disposition, development and other fees.
(4)We generally earn promote revenue directly from third-party investors in the co-investment ventures based on the cumulative returns of the venture over a three-year period or the stabilization of individual development projects owned by the venture. Changes in asset valuations within the co-investment ventures during the promote period is one of the significant inputs to the calculation of promote revenues.
The Prologis Promote Plan ("PPP") awards up to 25% of the third-party portion of the promotes earned by us from the co-investment ventures to our employees. This award is issued as a combination of cash and equity-based awards, pursuant to the terms of the PPP and expensed through Strategic Capital Expenses in the Consolidated Statements of Income, as vested. As a result, expenses recognized in the current period may relate to promote revenues recognized in prior periods.
G&A Expenses
G&A expenses were $469 million and $419 million for 2025 and 2024, respectively. G&A expenses increased in 2025 compared to 2024, principally due to inflationary increases and higher compensation expenses including additions in our workforce in growth areas of the business. We capitalize certain internal costs that are incremental and directly related to our development and building improvement activities.
The following table summarizes capitalized G&A expenses (dollars in millions):
|
|
|
|
|
|
|
|
|
|
|
2025 |
|
|
2024 |
|
Building and land development activities |
|
$ |
116 |
|
|
$ |
133 |
|
Operating building improvements and other |
|
|
59 |
|
|
|
56 |
|
Total capitalized G&A expenses |
|
$ |
175 |
|
|
$ |
189 |
|
Capitalized compensation and related costs as a percentage of total |
|
|
21.0 |
% |
|
|
24.4 |
% |
Depreciation and Amortization Expenses
Depreciation and amortization expenses were $2.6 billion in both 2025 and 2024.
The $46 million change in depreciation and amortization expenses in 2025 compared to 2024, was impacted by the following items (in millions):
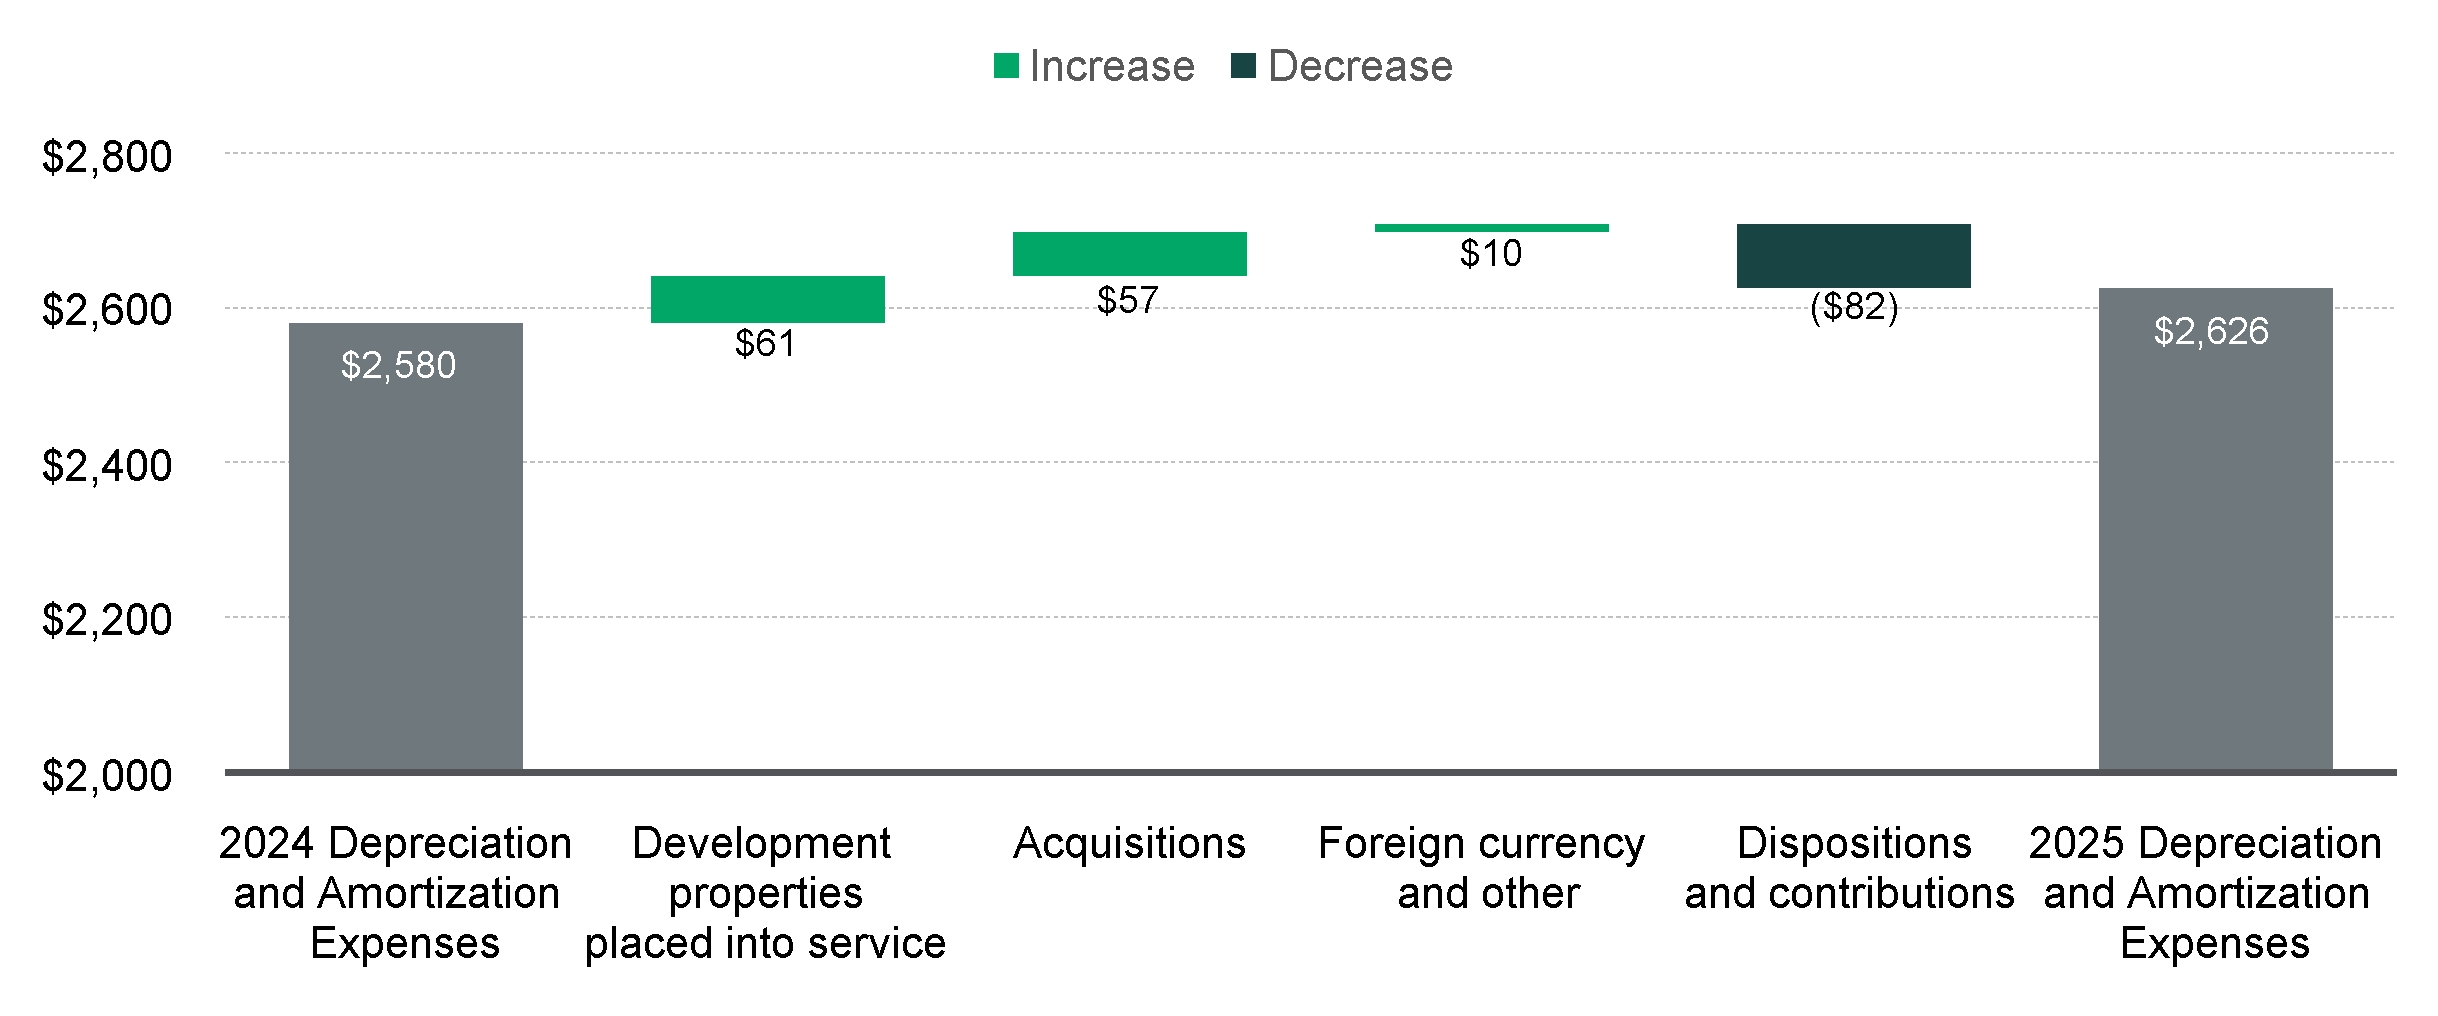
Gains on Real Estate Transactions, Net
Gains on the disposition of development properties and land were $258 million and $414 million for 2025 and 2024, respectively, principally from the contribution of properties we developed to unconsolidated co-investment ventures in Europe and the U.S. in 2025 and the U.S., Mexico and Europe in 2024, and from sales to third parties in the U.S. in 2025.
Gains on other dispositions of investments in real estate were $686 million and $904 million for 2025 and 2024, respectively, principally from the sales of properties to third parties and the contribution of operating properties to our unconsolidated co-investment venture in the U.S. during both years.
Historically, we have utilized the proceeds from these dispositions primarily to fund our acquisition and development activities. See Note 3 to the Consolidated Financial Statements for further information on these transactions.
Our Owned and Managed (“O&M”) Operating Portfolio
We manage our business and evaluate operating performance on an O&M basis, which includes our consolidated properties and properties owned by our unconsolidated co-investment ventures. We believe reviewing the results on this basis enables management to assess performance more comprehensively as we manage the properties without regard to their ownership. We do not control the unconsolidated co-investment ventures for purposes of GAAP and the presentation of the ventures’ operating information does not represent a legal claim.
Our O&M operating portfolio excludes our development portfolio, value-added properties, non-industrial properties and properties we consider non-strategic that we do not intend to hold for the long term, including those classified as held for sale or within other real estate investments. Value-added properties are properties we have either acquired at a discount and believe we could provide greater returns post-stabilization or properties we expect to repurpose to higher uses. See below for information on our O&M operating portfolio at December 31 (square feet in millions):
|
|
|
|
|
|
|
|
|
|
|
|
|
|
|
|
|
|
|
|
|
2025 |
|
2024 |
|
Number of Properties |
|
|
Square
Feet |
|
|
Percentage Occupied |
|
Number of Properties |
|
|
Square
Feet |
|
|
Percentage Occupied |
Consolidated |
|
2,968 |
|
|
|
645 |
|
|
95.4% |
|
|
2,981 |
|
|
|
644 |
|
|
95.4% |
Unconsolidated |
|
2,472 |
|
|
|
562 |
|
|
96.3% |
|
|
2,423 |
|
|
|
548 |
|
|
96.6% |
Total |
|
5,440 |
|
|
|
1,207 |
|
|
95.8% |
|
|
5,404 |
|
|
|
1,192 |
|
|
95.9% |
Below are the key leasing metrics of our O&M operating portfolio.
(1)Square feet of leases commenced and weighted average net effective rent change were calculated for leases with initial terms of one year or greater. We retained approximately 70% or more of our customers, based on the total square feet of leases commenced, for each year.
(2)Turnover costs include external leasing commissions and tenant improvements and represent the estimated obligations incurred in connection with the lease commencement for leases greater than one year.
Same Store Analysis
Our same store metrics are non-GAAP financial measures, which are commonly used in the real estate industry and expected from the financial community, on both a net effective and cash basis. We evaluate the performance of the operating properties we own and manage using a “same store” analysis because the population of properties in this analysis is consistent from period to period, which allows us and investors to analyze our ongoing business operations. We determine our same store metrics on property NOI, which is calculated as rental revenue less rental expense for the applicable properties in the same store population for both consolidated and unconsolidated properties based on our ownership interest, as further defined below.
We define our same store population for the three months ended December 31, 2025 as the properties in our O&M operating portfolio, including the property NOI for both consolidated properties and properties owned by the unconsolidated co-investment ventures, at January 1, 2024 and owned throughout the same three-month period in both 2024 and 2025. We believe the drivers of property NOI for the consolidated portfolio are generally the same for the properties owned by the ventures in which we invest and therefore we evaluate the same store metrics of the O&M portfolio based on Prologis’ ownership in the properties (“Prologis Share”). The same store population excludes properties held for sale to third parties, along with development properties that were not stabilized at the beginning of the period (January 1, 2024) and properties acquired or disposed of to third parties during the period. To derive an appropriate measure of period-to-period operating performance, we remove the effects of foreign currency exchange rate movements by using the reported period-end exchange rate to translate from local currency into the U.S. dollar, for both periods.
As non-GAAP financial measures, the same store metrics have certain limitations as an analytical tool and may vary among real estate companies. As a result, we provide a reconciliation of Rental Revenues less Rental Expenses (“Property NOI”) (from our Consolidated Financial Statements prepared in accordance with U.S. GAAP) to our Same Store Property NOI measures.
We evaluate the results of our same store portfolio on a quarterly basis. The following is a reconciliation of our consolidated rental revenues, rental expenses and property NOI for each quarter in 2025 and 2024 to the full year, as included in the Consolidated Statements of Income and within Note 18 to the Consolidated Financial Statements and to the respective amounts in our same store portfolio analysis for the three months ended December 31 (dollars in millions):
|
|
|
|
|
|
|
|
|
|
|
|
|
|
|
|
|
|
|
|
|
|
|
Three Months Ended |
|
|
|
|
|
|
March 31, |
|
|
June 30, |
|
|
September 30, |
|
|
December 31, |
|
|
Full Year |
|
2025 |
|
|
|
|
|
|
|
|
|
|
|
|
|
|
|
Rental revenues |
|
$ |
1,987 |
|
|
$ |
2,026 |
|
|
$ |
2,054 |
|
|
$ |
2,092 |
|
|
$ |
8,159 |
|
Rental expenses |
|
|
(488 |
) |
|
|
(488 |
) |
|
|
(485 |
) |
|
|
(503 |
) |
|
|
(1,964 |
) |
Property NOI |
|
$ |
1,499 |
|
|
$ |
1,538 |
|
|
$ |
1,569 |
|
|
$ |
1,589 |
|
|
$ |
6,195 |
|
2024 |
|
|
|
|
|
|
|
|
|
|
|
|
|
|
|
Rental revenues |
|
$ |
1,828 |
|
|
$ |
1,852 |
|
|
$ |
1,897 |
|
|
$ |
1,938 |
|
|
$ |
7,515 |
|
Rental expenses |
|
|
(454 |
) |
|
|
(445 |
) |
|
|
(427 |
) |
|
|
(439 |
) |
|
|
(1,765 |
) |
Property NOI |
|
$ |
1,374 |
|
|
$ |
1,407 |
|
|
$ |
1,470 |
|
|
$ |
1,499 |
|
|
$ |
5,750 |
|
|
|
|
|
|
|
|
|
|
|
|
|
|
Three Months Ended
December 31, |
|
|
|
|
|
2025 |
|
|
2024 |
|
|
% Change |
|
Reconciliation of Consolidated Property NOI to Same Store Property NOI measures: |
|
|
|
|
|
|
|
|
|
|
Rental revenues |
$ |
2,092 |
|
|
$ |
1,938 |
|
|
|
|
Rental expenses |
|
(503 |
) |
|
|
(439 |
) |
|
|
|
Consolidated Property NOI |
$ |
1,589 |
|
|
$ |
1,499 |
|
|
|
|
|
|
|
|
|
|
|
|
|
Adjustments to derive same store results: |
|
|
|
|
|
|
|
|
Property NOI from consolidated properties not included in same store portfolio and
other adjustments (1) |
|
(228 |
) |
|
|
(188 |
) |
|
|
|
Property NOI from unconsolidated co-investment ventures included in same store
portfolio (1)(2) |
|
924 |
|
|
|
871 |
|
|
|
|
Third parties' share of Property NOI from properties included in same store
portfolio (1)(2) |
|
(731 |
) |
|
|
(698 |
) |
|
|
|
Prologis Share of Same Store Property NOI – Net Effective (2) |
$ |
1,554 |
|
|
$ |
1,484 |
|
|
|
4.7 |
% |
Consolidated properties straight-line rent and fair value lease amortization
included in same store portfolio (3) |
|
(117 |
) |
|
|
(124 |
) |
|
|
|
Unconsolidated co-investment ventures straight-line rent and fair value lease
amortization included in same store portfolio (3) |
|
(37 |
) |
|
|
(23 |
) |
|
|
|
Third parties' share of straight-line rent and fair value lease amortization included
in same store portfolio (2)(3) |
|
27 |
|
|
|
13 |
|
|
|
|
Prologis Share of Same Store Property NOI – Cash (2)(3) |
$ |
1,427 |
|
|
$ |
1,350 |
|
|
|
5.7 |
% |
(1)We exclude properties held for sale to third parties, along with development properties that were not stabilized at the beginning of the periods and properties acquired or disposed of to third parties during the periods. We also exclude one-time items due to early lease terminations, including termination fees received from customers and the write-off of related lease assets and liabilities, that are not indicative of the property’s recurring operating performance in order to evaluate the growth or decline in each property's rental revenues. Same Store Property NOI is adjusted to include an allocation of property management expenses for our consolidated properties based on the property management services provided to each property (generally, based on a percentage of revenues). On consolidation, these amounts are eliminated and the actual costs of providing property management and leasing services are recognized as part of our consolidated rental expense.
(2)We include the Property NOI for the same store portfolio for both consolidated properties and properties owned by the co-investment ventures based on our investment in the underlying properties. In order to calculate our share of Same Store Property NOI from the co-investment ventures in which we own less than 100%, we use the co-investment ventures’ underlying Property NOI for the same store portfolio and apply our ownership percentage at December 31, 2025 to the Property NOI for both periods, including the properties contributed during the periods. We adjust the total Property NOI from the same store portfolio of the co-investment ventures by subtracting the third parties’ share of both consolidated and unconsolidated co-investment ventures.
During the periods presented, certain wholly owned properties were contributed to a co-investment venture and are included in the same store portfolio. Neither our consolidated results nor those of the co-investment ventures, when viewed individually,
would be comparable on a same store basis because of the changes in composition of the respective portfolios from period to period (e.g. the results of a contributed property are included in our consolidated results through the contribution date and in the results of the venture subsequent to the contribution date based on our ownership interest at the end of the period). As a result, only line items labeled “Prologis Share of Same Store Property NOI” are comparable period over period.
(3)We further remove certain noncash items (straight-line rent and fair value lease amortization) included in the financial statements prepared in accordance with U.S. GAAP to reflect a Same Store Property NOI – Cash measure.
We manage our business and compensate our executives based on the same store results of our O&M portfolio at 100% as we manage our portfolio on an ownership blind basis. We calculate those results by including 100% of the properties included in our same store portfolio.
Other Components of Income (Expense)
Earnings from Unconsolidated Entities, Net
We recognized net earnings from unconsolidated entities, which are primarily accounted for using the equity method, of $403 million and $354 million during 2025 and 2024, respectively.
The earnings we recognize from unconsolidated entities can be impacted by: (i) the size, rental rates and occupancy of the portfolio of properties owned by each venture; (ii) interest expense based on the size and terms of the debt; (iii) gains or losses from dispositions of properties, impairments and extinguishments of debt; (iv) our ownership interest in each venture; (v) other variances in revenues and expenses of each venture; and (vi) fluctuations in foreign currency exchange rates used to translate our share of net earnings to U.S. dollars.
See the discussion of our unconsolidated entities above in the Strategic Capital Segment discussion and in Note 4 to the Consolidated Financial Statements for a further breakdown of our share of net earnings recognized.
Interest Expense
The following table details our net interest expense (dollars in millions):
|
|
|
|
|
|
|
|
|
|
|
2025 |
|
|
2024 |
|
Gross interest expense |
|
$ |
1,024 |
|
|
$ |
893 |
|
Amortization of debt discount and debt issuance costs, net |
|
|
85 |
|
|
|
79 |
|
Capitalized amounts |
|
|
(107 |
) |
|
|
(108 |
) |
Net interest expense |
|
$ |
1,002 |
|
|
$ |
864 |
|
Weighted average effective interest rate during the year |
|
|
3.2 |
% |
|
|
3.1 |
% |
Interest expense increased in 2025, as compared to 2024, principally due to the issuance of senior notes to finance acquisition and development activities with higher interest rates on new issuances. We issued $3.4 billion of senior notes during 2025 and $4.2 billion during 2024, with a weighted average interest rate of 4.2% and 4.8%, respectively, at the issuance date.
See Note 7 to the Consolidated Financial Statements and the Liquidity and Capital Resources section below, for further discussion of our debt and borrowing costs.
Foreign Currency, Derivative and Other Gains (Losses) and Other Income (Expense), Net
We recognized foreign currency, derivative and other gains (losses) and other income (expense), net, of $15 million and $209 million for 2025 and 2024, respectively. This activity resulted principally from three types of transactions during 2025 and 2024: (i) interest income earned on short-term investments and other income ($130 million and $88 million, respectively); (ii) realized gains on the settlement of undesignated derivatives ($11 million and $53 million, respectively); and (iii) unrealized changes in the fair value of undesignated derivatives and the remeasurement of the unhedged foreign debt that was designated as a nonderivative net investment hedge ($138 million of losses and $87 million of gains, respectively).
Given the global nature of our operations, we are exposed to foreign currency exchange risk related to investments in and earnings from our foreign investments. We primarily hedge our foreign currency risk related to our investments by borrowing in the currencies in which we invest thereby providing a natural hedge. We have issued debt in a currency that is not the same functional currency of the borrowing entity and have designated a portion of the debt as a nonderivative net investment hedge. We recognize the remeasurement and settlement of the translation adjustment on the unhedged portion of the debt and accrued interest in unrealized gains or losses. We may use derivative financial instruments to manage foreign currency exchange rate risk related to our earnings. We recognize the change in fair value of the undesignated derivative contracts in unrealized gains and losses. Upon settlement of these transactions, we recognize realized gains or losses.
See Note 2 to the Consolidated Financial Statements for more information about our foreign currency and derivative financial instrument policies and Note 14 to the Consolidated Financial Statements for more information about our derivative and nonderivative transactions.
Income Tax Expense
We recognize income tax expense related to our taxable REIT subsidiaries and in the local, state and foreign jurisdictions in which we operate. Our current income tax expense (benefit) fluctuates from period to period based primarily on the timing of our taxable income, including gains on the disposition of properties, fees earned from the co-investment ventures and taxable earnings from unconsolidated co-investment ventures. Deferred income tax expense (benefit) is generally a function of the period’s temporary differences and the utilization of net operating losses generated in prior years that had been previously recognized as deferred income tax assets in taxable subsidiaries.
The following table summarizes our income tax expense (benefit) (in millions):
|
|
|
|
|
|
|
|
|
|
|
2025 |
|
|
2024 |
|
Current income tax expense (benefit): |
|
|
|
|
|
|
Income tax expense (benefit) |
|
$ |
173 |
|
|
$ |
116 |
|
Income tax expense (benefit) on dispositions |
|
|
27 |
|
|
|
30 |
|
Total current income tax expense (benefit) |
|
|
200 |
|
|
|
146 |
|
|
|
|
|
|
|
|
Deferred income tax expense (benefit): |
|
|
|
|
|
|
Income tax expense (benefit) |
|
|
4 |
|
|
|
21 |
|
Total deferred income tax expense (benefit) |
|
|
4 |
|
|
|
21 |
|
Total income tax expense |
|
$ |
204 |
|
|
$ |
167 |
|
Our income taxes are discussed in more detail in Note 12 to the Consolidated Financial Statements.
Net Earnings Attributable to Noncontrolling Interests
Net earnings attributable to noncontrolling interests represents the third-party investors’ share of the earnings generated in consolidated entities in which we do not own 100% of the equity, reduced by the third-party share of fees or promotes we earned during the period. We had net earnings attributable to noncontrolling interests of $237 million and $216 million in 2025 and 2024, respectively. Included in these amounts were $81 million and $93 million in 2025 and 2024, respectively, of net earnings attributable to the common limited partnership unitholders of Prologis, L.P.
See Note 10 to the Consolidated Financial Statements for further information on our noncontrolling interests.
Other Comprehensive Income (Loss)
The key driver of changes in Accumulated Other Comprehensive Income (Loss) (“AOCI/L”) in the Consolidated Financial Statements in 2025 and 2024, was the currency translation adjustment derived from changes in exchange rates during both periods principally on our net investments in real estate outside the U.S. and the borrowings we issue in the functional currencies of the countries where we invest. These borrowings serve as a natural hedge of our foreign investments. In addition, we use derivative financial instruments, such as foreign currency contracts to manage foreign currency exchange rate risk related to our foreign investments and interest rate contracts to manage interest rate risk, that when designated the change in fair value is included in AOCI/L.
See Note 2 to the Consolidated Financial Statements for more information about our foreign currency and derivative financial instrument policies and Note 14 to the Consolidated Financial Statements for more information about our derivative and nonderivative transactions and other comprehensive income (loss).
ENVIRONMENTAL MATTERS
See Note 15 in the Consolidated Financial Statements for further information about environmental liabilities.
LIQUIDITY AND CAPITAL RESOURCES
Overview
We believe our ability to generate cash from operating activities, distributions from our co-investment ventures, contributions and dispositions of properties and available financing sources provides sufficient capacity to meet our anticipated future development, acquisition, operating, debt service, dividend and distribution requirements.
Near-Term Principal Cash Sources and Uses
In addition to dividends and distributions, we expect our primary cash needs will consist of the following:
•completion of the development and leasing of the properties in our consolidated development portfolio (at December 31, 2025, 77 properties in our development portfolio were 53.5% leased with a current investment of $3.0 billion and a TEI of $5.1 billion when completed and leased, leaving $2.1 billion of estimated additional required investment);
•development of new industrial properties that we may hold for long-term investment or subsequently contribute to unconsolidated co-investment ventures or sell to third parties, including the acquisition of land;
•development of data centers, including capital for the acquisition of land, site preparation, power procurement activities to secure long-term energy capacity and turnkey data center infrastructure and equipment;
•the acquisition of other real estate investments that we acquire with the intention of redeveloping into industrial properties and data centers;
•capital expenditures and leasing costs on properties in our operating portfolio;
•investments in renewable energy, energy storage and mobility infrastructure to serve our customers and achieve our sustainability goals;
•repayment of debt and scheduled principal payments of $1.9 billion in 2026;
•additional investments in current and future co-investment ventures and other ventures; and
•the acquisition of operating properties or portfolios of operating properties (depending on market and other conditions), for direct, long-term investment in our consolidated portfolio (this might include acquisitions from our unconsolidated entities).
We expect to fund our cash needs principally from the following sources (subject to market conditions):
•net cash flow from property operations;
•fees earned for services performed on behalf of co-investment ventures;
•distributions received from co-investment ventures;
•proceeds from the contribution of properties to current or future co-investment ventures;
•proceeds from the disposition of properties or other investments to third parties;
•available unrestricted cash balances ($1.1 billion at December 31, 2025);
•available capacity under our current credit facility arrangements that allows us to borrow on a short-term basis, with maturities generally ranging from overnight to three months ($6.5 billion available at December 31, 2025), including our commercial paper programs; and
•proceeds from the issuance of debt.
In the long term, we may also voluntarily repurchase our outstanding debt or equity securities (depending on prevailing market conditions, our liquidity, contractual restrictions and other factors) through cash purchases, open-market purchases, privately negotiated transactions, tender offers or otherwise. We may also fund our cash needs from the issuance of equity securities, subject to market conditions, and through the sale of a portion of our investments in co-investment ventures.
Debt
The following table summarizes information about our consolidated debt by currency at December 31 (dollars in millions):
|
|
|
|
|
|
|
|
|
|
|
|
|
|
|
|
|
|
|
|
|
|
|
2025 |
|
|
2024 |
|
|
|
Weighted Average
Interest Rate |
|
Amount
Outstanding |
|
|
% of Total |
|
|
Weighted Average
Interest Rate |
|
Amount
Outstanding |
|
|
% of Total |
|
British pound sterling |
|
3.0% |
|
$ |
1,844 |
|
|
|
5.3 |
% |
|
3.1% |
|
$ |
1,715 |
|
|
|
5.6 |
% |
Canadian dollar |
|
4.4% |
|
|
2,005 |
|
|
|
5.7 |
% |
|
4.7% |
|
|
1,262 |
|
|
|
4.1 |
% |
Euro |
|
2.2% |
|
|
12,302 |
|
|
|
35.1 |
% |
|
2.1% |
|
|
9,900 |
|
|
|
32.1 |
% |
Japanese yen |
|
1.2% |
|
|
2,930 |
|
|
|
8.4 |
% |
|
1.1% |
|
|
2,911 |
|
|
|
9.4 |
% |
U.S. dollar |
|
4.1% |
|
|
15,386 |
|
|
|
43.9 |
% |
|
4.1% |
|
|
14,458 |
|
|
|
46.8 |
% |
Other |
|
3.8% |
|
|
570 |
|
|
|
1.6 |
% |
|
3.6% |
|
|
633 |
|
|
|
2.0 |
% |
Total debt (1) |
|
3.2% |
|
$ |
35,037 |
|
|
|
100.0 |
% |
|
3.1% |
|
$ |
30,879 |
|
|
|
100.0 |
% |
(1)The weighted average remaining term for total debt outstanding at both December 31, 2025 and 2024 was 9 years.
At December 31, 2025, our credit ratings were A from Standard and Poor's and A2 from Moody's, both with stable outlooks. These ratings support our ability to access capital at favorable interest rates. Adverse changes to our credit ratings could negatively affect our business and our future growth, particularly our refinancing and capital markets activities, our ability to manage debt maturities and our development and acquisition plans. A securities rating is not a recommendation to buy, sell or hold securities and may be revised or withdrawn at any time by the issuing agency.
At December 31, 2025, we were in compliance with all of our financial debt covenants. These covenants include customary financial covenants, such as maintaining debt service coverage, leverage and fixed charge coverage ratios.
See Note 7 to the Consolidated Financial Statements for further discussion on our debt.
Equity Commitments Related to Certain Co-Investment Ventures
Certain co-investment ventures have equity commitments from us and our venture partners. Our venture partners fulfill their equity commitment with cash. We may fulfill our equity commitment through contributions of properties or cash.
The following table summarizes the remaining equity commitments at December 31, 2025 (dollars in millions):
|
|
|
|
|
|
|
|
|
|
|
|
|
|
|
|
|
Equity Commitments (1) |
|
|
|
|
|
Prologis |
|
|
Venture Partners |
|
|
Total |
|
|
Expiration Date |
Prologis Brazil Logistics Venture |
|
$ |
33 |
|
|
$ |
133 |
|
|
$ |
166 |
|
|
2028 |
Prologis European Logistics Fund |
|
|
- |
|
|
|
60 |
|
|
|
60 |
|
|
2028 (2) |
Prologis Japan Core Logistics Fund |
|
|
78 |
|
|
|
402 |
|
|
|
480 |
|
|
2033 |
Prologis China Logistics Venture |
|
|
49 |
|
|
|
278 |
|
|
|
327 |
|
|
2027 – 2028 |
Total |
|
$ |
160 |
|
|
$ |
873 |
|
|
$ |
1,033 |
|
|
|
(1)The equity commitments for the co-investment ventures that operate in a different functional currency than the U.S. dollar were calculated using the foreign currency exchange rate at December 31, 2025.
(2)Venture partners generally have the option to cancel their equity commitment starting 18 months after the initial commitment date.
See the Cash Flow Summary below for more information about our investment activity in our co-investment ventures.
Cash Flow Summary
The following table summarizes our cash flow activity (in millions):
|
|
|
|
|
|
|
|
|
2025 |
|
|
2024 |
|
Net cash provided by (used in) operating activities |
$ |
5,008 |
|
|
$ |
4,912 |
|
Net cash provided by (used in) investing activities |
$ |
(3,630 |
) |
|
$ |
(3,099 |
) |
Net cash provided by (used in) financing activities |
$ |
(1,564 |
) |
|
$ |
(1,000 |
) |
Net increase (decrease) in cash and cash equivalents, including the effect of foreign currency
exchange rates on cash |
$ |
(173 |
) |
|
$ |
788 |
|
Operating Activities
Cash provided by and used in operating activities, exclusive of changes in receivables and payables, was impacted by the following significant activities:
•Real Estate Segment. We generate the majority of our operating cash through the net revenues of our Real Estate Segment, including the recovery of our operating costs. Cash flows generated by the Real Estate Segment are impacted by our acquisition, development and disposition activities, which are among the drivers of NOI recognized during each period. See the Results of Operations section above for further explanation of our Real Estate Segment. The revenues from this segment include noncash adjustments for straight-lined rents and amortization of above and below market leases of $691 million and $645 million in 2025 and 2024, respectively.
•Strategic Capital Segment. We also generate operating cash through the fee revenue from our Strategic Capital Segment by providing asset management and property management and other services to our unconsolidated co-investment ventures. See the Results of Operations section above for the key drivers of the net revenues from our Strategic Capital Segment. Included in Strategic Capital Revenues in the Consolidated Statements of Income are the promotes we earn from the third-party investors in our co-investment ventures, which are recognized in operating activities in the period the cash is received, generally the quarter after the revenue is recognized.
•G&A expenses and equity-based compensation awards. We incurred $469 million and $419 million of G&A expenses in 2025 and 2024, respectively. We recognized equity-based, noncash compensation expenses of $185 million and $232 million in 2025 and 2024, respectively, which were recorded to Rental Expenses in the Real Estate Segment, Strategic Capital Expenses in the Strategic Capital Segment and G&A Expenses in the Consolidated Statements of Income.
•Operating distributions from unconsolidated entities. We received $645 million and $562 million of distributions as a return on our investment from the cash flows generated from the operations of our unconsolidated entities in 2025 and 2024, respectively.
•Cash paid for interest, net of amounts capitalized. We paid interest, net of amounts capitalized, of $842 million and $711 million in 2025 and 2024, respectively. See Note 7 to the Consolidated Financial Statements for further information on this activity.
•Cash paid for income taxes, net of refunds. We paid income taxes, net of refunds, of $143 million and $130 million in 2025 and 2024, respectively. See Note 12 to the Consolidated Financial Statements for further information on this activity.
Investing Activities
Cash provided by investing activities is driven by proceeds from the sale of real estate assets that include the contribution of properties we developed to our unconsolidated co-investment ventures as well as the sale of data centers and non-strategic operating properties. Cash used in investing activities is principally driven by our capital deployment activities of investing in the development of operating properties and data centers, acquisitions and capital expenditures as discussed above. Acquisition activity includes operating properties, real estate portfolios, land for future development and other real estate assets that we acquired with the intent to redevelop in the future. See Note 3 to the Consolidated Financial Statements for further information on these activities. In addition, the following significant transactions also impacted our cash used in and provided by investing activities:
•Investments in and advances to our unconsolidated entities. We invested cash in our unconsolidated entities of $312 million and $541 million in 2025 and 2024, respectively, representing our proportionate share, for the acquisition of properties, development and repayment of debt by the ventures. See Note 4 to the Consolidated Financial Statements for more detail on our unconsolidated co-investment ventures.
•Return of investment from unconsolidated entities. We received distributions from unconsolidated entities as a return of investment of $104 million and $58 million in 2025 and 2024, respectively, representing our proportionate share. Included in these amounts were distributions from venture activities, including proceeds from property sales, debt refinancing and the redemption of our investment in certain unconsolidated entities.
•Net proceeds from (payments on) the settlement of net investment hedges. We made net payments of $21 million and received net proceeds of $13 million for the settlement of net investment hedges in 2025 and 2024, respectively. See Note 14 to the Consolidated Financial Statements for further information on our derivative transactions.
•Purchase of short-term investments. We invested €150 million ($177 million at December 31, 2025) of cash into a short-term money market with a maturity of four months.
Financing Activities
Cash provided by and used in financing activities is principally driven by proceeds from and payments on credit facilities, commercial paper and other debt, along with dividends paid on common and preferred stock and noncontrolling interest contributions and distributions. Our credit facilities and our commercial paper support our cash needs for general corporate purposes on a short-term basis. The maturities of the borrowings under the credit facilities and the notes under the commercial paper programs generally range from overnight to three months.
Our repurchase of and payments on debt and proceeds from the issuance of debt consisted of the following activity (in millions):
|
|
|
|
|
|
|
|
|
|
|
2025 |
|
|
2024 |
|
Repurchase of and payments on debt (including extinguishment costs) |
|
|
|
|
|
|
Regularly scheduled debt principal payments and payments at maturity |
|
$ |
337 |
|
|
$ |
330 |
|
Secured mortgage debt |
|
|
- |
|
|
|
89 |
|
Senior notes |
|
|
365 |
|
|
|
- |
|
Term loans |
|
|
- |
|
|
|
500 |
|
Total |
|
$ |
702 |
|
|
$ |
919 |
|
|
|
|
|
|
|
|
Proceeds from the issuance of debt |
|
|
|
|
|
|
Secured mortgage debt |
|
$ |
4 |
|
|
$ |
7 |
|
Senior notes |
|
|
3,431 |
|
|
|
4,149 |
|
Term loans |
|
|
26 |
|
|
|
350 |
|
Total |
|
$ |
3,461 |
|
|
$ |
4,506 |
|
Unconsolidated Co-Investment Venture Debt
We had investments in and advances to our unconsolidated co-investment ventures of $10.3 billion at December 31, 2025. These ventures had total third-party debt of $19.7 billion at December 31, 2025 with a weighted average remaining term of 6 years and weighted average interest rate of 3.5%. Certain of our ventures do not have third-party debt and are therefore excluded. This debt is non-recourse to Prologis and other investors in the co-investment ventures and bears interest as follows at December 31, 2025 (dollars in millions):
|
|
|
|
|
|
|
|
|
|
|
|
|
|
|
Total Debt (1) |
|
|
Weighted Average
Interest Rate |
|
Gross Book Value of Real Estate (1) |
|
|
Ownership % |
Prologis Targeted U.S. Logistics Fund |
|
$ |
6,386 |
|
|
4.3% |
|
$ |
16,761 |
|
|
31.9% |
FIBRA Prologis |
|
|
2,429 |
|
|
5.1% |
|
|
6,710 |
|
|
34.6% |
Prologis European Logistics Fund |
|
|
7,101 |
|
|
3.1% |
|
|
22,284 |
|
|
26.4% |
Nippon Prologis REIT |
|
|
2,302 |
|
|
0.9% |
|
|
6,282 |
|
|
15.3% |
Prologis Japan Core Logistics Fund |
|
|
334 |
|
|
1.3% |
|
|
614 |
|
|
16.3% |
Prologis China Core Logistics Fund |
|
|
809 |
|
|
4.1% |
|
|
1,964 |
|
|
15.5% |
Prologis China Logistics Venture |
|
|
313 |
|
|
3.9% |
|
|
806 |
|
|
15.0% |
Total |
|
$ |
19,674 |
|
|
|
|
$ |
55,421 |
|
|
|
(1)The weighted average loan-to-value ratio for all unconsolidated co-investment ventures was 30.1% at December 31, 2025 based on gross book value. Loan-to-value, a non-GAAP measure, was calculated as the percentage of total third-party debt to the gross book value of real estate for each venture and weighted based on the cumulative gross book value of all unconsolidated co-investment ventures.
At December 31, 2025, we did not guarantee any third-party debt of the unconsolidated co-investment ventures. In our role as the manager or sponsor, we work with the co-investment ventures to maintain sufficient liquidity and refinance their maturing debt. There can be no assurance that the co-investment ventures will be able to refinance any maturing indebtedness on terms as favorable as the maturing debt, or at all. If the ventures are unable to refinance the maturing indebtedness with newly issued debt, they may be able to obtain funds by voluntary capital contributions from us and our partners or by selling assets. Certain of our ventures also have credit facilities, or unencumbered properties, both of which may be used to obtain funds.
Dividend and Distribution Requirements
Our dividend policy on our common stock is to distribute a percentage of our cash flow to ensure that we will meet the dividend requirements of the Internal Revenue Code ("IRC"), relative to maintaining our REIT status, while still allowing us to retain cash to fund our capital deployment and other investment activities.
Under the IRC, REITs may be subject to certain federal income and excise taxes on undistributed taxable income.
Outstanding Common Shares and Units Eligible for Dividends and Distributions
At December 31, 2025 the total outstanding shares of the Parent's common stock and common limited partnership units in the OP eligible for dividends and distributions were as follows (in thousands):
|
|
|
|
|
Shares/Units |
|
Common shares outstanding |
|
929,153 |
|
Common limited partnership units outstanding |
|
21,758 |
|
Total outstanding common shares and units eligible for dividends and distributions |
|
950,911 |
|
We paid quarterly cash dividends of $1.01 and $0.96 per common share in 2025 and 2024, respectively. Our future common stock dividends, if and as declared, may vary and will be determined by the Board based upon the circumstances prevailing at the time, including our financial condition, operating results and REIT distribution requirements, and may be adjusted at the discretion of the Board during the year.
We make distributions on the common limited partnership units outstanding at the same per unit amount as our common stock dividend.
Class A common limited partnership units ("Class A Units") Distributions
The Class A Units in the OP were entitled to a quarterly distribution equal to $0.64665 per unit so long as the common units received a quarterly distribution of at least $0.40 per unit. We paid a quarterly cash distribution of $0.64665 per Class A Unit in both 2025 and 2024, totaling $1.93995 per unit during the year ended December 31, 2025, and $2.58660 per unit during the year ended December 31, 2024. During the year ended December 31, 2025, all Class A Units were converted into common limited partnership units, leaving none outstanding to be converted at December 31, 2025.
Preferred Stock Dividends
At December 31, 2025, our Series Q preferred stock had an annual dividend rate of 8.54% per share and the dividends are payable quarterly in arrears.
Pursuant to the terms of our preferred stock, we are restricted from declaring or paying any dividend with respect to our common stock unless and until all cumulative dividends with respect to the preferred stock have been paid and sufficient funds have been set aside for dividends that have been declared for the relevant dividend period with respect to the preferred stock.
Other Commitments
On an ongoing basis, we are engaged in various stages of negotiations for the acquisition or disposition of individual properties or portfolios of properties.
CRITICAL ACCOUNTING POLICIES
A critical accounting policy is one that involves an estimate or assumption that is subjective and requires management judgment about the effect of a matter that is inherently uncertain and material to an entity’s financial condition and results of operations. Management’s judgment considers historical and current economic conditions and expectations for the future. Changes in estimates could affect our financial position and specific items in our results of operations that are used by stockholders, potential investors, industry analysts and lenders in their evaluation of our performance. Of the significant accounting policies discussed in Note 2 to the Consolidated Financial Statements, those presented below have been identified by us as meeting the criteria to be considered critical accounting policies for our financial condition at December 31, 2025, and 2024 and our operating results for the three-year period ended December 31, 2025. Refer to Note 2 for more information on these critical accounting policies.
Asset Acquisitions
We generally account for an acquisition of a single property or portfolio of properties as an asset acquisition. We measure the real estate assets acquired through an asset acquisition based on their cost or total consideration exchanged. The difference between the cost and the estimated fair value (excess or bargain consideration) is allocated to the real estate properties and related lease intangibles on a relative fair value basis. Assets we do not intend to hold long-term are recorded at fair value. At a property level, we allocate the fair value to the components, which include buildings, land, improvements, and intangible assets or liabilities related to acquired leases. The most significant portion of the allocation is to building and land and requires the use of market based estimates and assumptions.
The fair value of real estate properties subject to purchase price allocation is based on the expected future cash flows of the property and various characteristics of the markets where the property is located utilizing an income approach methodology, which may be a
discounted cash flow analysis or applying a capitalization rate to the estimated net operating income of a property. Key assumptions may include market rents and capitalization rates. Estimates of future cash flows are based on a number of factors including historical operating results, known trends and market and economic conditions. We determine capitalization rates by market based on recent transactions and other market data and adjust if necessary, based on the property characteristics. The fair value of land is generally based on relevant market data, such as a comparison of the subject site to similar parcels that have recently been sold or are currently being offered on the market for sale. For acquisitions of a significant portfolio of properties, the use of different assumptions to value the acquired properties and allocate the most significant portion of the property value between the building and land could affect the depreciation expense we recognize over the estimated remaining useful life.
Recoverability of Real Estate Assets
We assess the carrying values of our respective long-lived assets whenever events or changes in circumstances indicate that the carrying amounts of these assets may not be fully recoverable. This assessment is primarily triggered based on the shortening of the expected hold period due to a change in our intent to sell a property in the near term. We have processes to monitor our intent with regard to our investments and the estimated disposition value in comparison to the current carrying value. If our assessment of potential triggering events indicates that the carrying value of a property that we expect to sell in the near term is not recoverable, we recognize an impairment charge for the amount by which the carrying value exceeds the current estimated fair value of the property. We determine the fair value of the property based on the estimated proceeds from disposition that are based on quoted market values, third-party appraisals or discounted cash flow models that utilize the future net operating income of the property and expected market capitalization rates. Changes in economic and operating conditions could impact our intent and the assumptions used in determining the fair value that could result in future impairment.
NEW ACCOUNTING PRONOUNCEMENTS
See Note 2 to the Consolidated Financial Statements.
FUNDS FROM OPERATIONS ATTRIBUTABLE TO COMMON STOCKHOLDERS/UNITHOLDERS (“FFO”)
FFO is a non-GAAP financial measure that is commonly used in the real estate industry, with net earnings as the most directly comparable GAAP measure.
The National Association of Real Estate Investment Trusts ("NAREIT") defines FFO as earnings computed under GAAP to exclude depreciation and gains and losses from sales net of any related tax, along with impairment charges, of previously depreciated properties. We exclude the gains on revaluation of equity investments upon acquisition of a controlling interest and the gain recognized from a partial sale of our investment, as these are similar to gains from the sales of previously depreciated properties. This measure excludes similar adjustments from our unconsolidated entities and the third parties' share of our consolidated ventures.
Our FFO Measures
Our FFO measures begin with NAREIT’s definition, with certain adjustments to calculate FFO, as modified by Prologis, and Core FFO, both as defined below, to reflect our business and execution of our management strategy. While these adjustments are subject to significant fluctuations from period to period, with both positive and negative short-term impacts, the removal of the effects of these items enhances our understanding of the core operating performance of our properties over the long term.
We use FFO, as modified by Prologis, so that management, analysts and investors are able to evaluate our performance against other REITs that do not have similar operations or operations in jurisdictions outside the U.S. We use Core FFO to (i) assess our operating performance as compared to other real estate companies; (ii) evaluate our performance and the performance of our properties in comparison with expected results and results of previous periods; (iii) evaluate the performance of our management; (iv) budget and forecast future results to assist in the allocation of resources; (v) provide guidance to the financial markets to understand our expected operating performance; and (vi) evaluate how a specific potential investment will impact our future results.
We calculate our FFO measures based on our proportionate ownership share of both our unconsolidated entities and consolidated ventures. We reflect our share of our FFO measures for unconsolidated entities by applying our average ownership percentage for the period to the applicable adjustments on an entity-by-entity basis. We reflect our share for consolidated ventures in which we do not own 100% of the equity by removing the noncontrolling interests share of the applicable adjustments based on our average ownership percentage for the applicable periods.
FFO, as modified by Prologis attributable to common stockholders/unitholders (“FFO, as modified by Prologis”)
To arrive at FFO, as modified by Prologis, we adjust the NAREIT defined FFO measure to exclude:
•deferred income tax benefits and deferred income tax expenses recognized by our subsidiaries;
•current income tax expense related to acquired tax liabilities that were recorded as deferred tax liabilities in an acquisition, to the extent the expense is offset with a deferred income tax benefit in earnings that is excluded from our defined FFO measure; and
•foreign currency exchange gains and losses resulting from: (i) debt transactions between us and our foreign entities; (ii) third-party debt that is used to hedge our investment in foreign entities; (iii) derivative financial instruments related to any such debt transactions; and (iv) mark-to-market adjustments associated with derivative and other financial instruments.
Core FFO attributable to common stockholders/unitholders (“Core FFO”)
To arrive at Core FFO, we adjust FFO, as modified by Prologis, to exclude the following:
•gains or losses from the disposition of land and development properties that were developed with the intent to contribute or sell;
•income tax expense related to the sale of investments in real estate;
•impairment charges recognized related to our investments in real estate generally as a result of our change in intent to contribute or sell these properties; and
•gains or losses from the early extinguishment of debt and redemption and repurchase of preferred stock.
Limitations on the use of our FFO measures
While we believe our modified FFO measures are important supplemental measures, neither NAREIT's nor our measures of FFO should be used alone because they exclude significant components of net earnings computed under GAAP and are, therefore, limited as an analytical tool. Some of these limitations arise from excluding income tax expense that may be payable or depreciation and amortization expenses that reflect costs necessary to maintain operating performance. In addition, our FFO measure does not reflect changes in asset values resulting from fluctuations in market conditions or foreign currency exchange rates nor costs or benefits from settlement of deferred income taxes or the extinguishment of debt. We do not use NAREIT's nor our measures of FFO as alternatives to net earnings computed under GAAP or as alternatives to cash from operating activities computed under GAAP or as indicators of our ability to fund our cash needs. We compensate for the limitations by using our FFO measures only in conjunction with net earnings computed under GAAP when making our decisions. This information should be read with our complete Consolidated Financial Statements prepared under GAAP. To assist investors in compensating for these limitations, we reconcile our modified FFO measures from consolidated net earnings attributable to common stockholders computed under GAAP as follows (in millions):
|
|
|
|
|
|
|
|
|
|
|
2025 |
|
|
2024 |
|
Reconciliation of net earnings attributable to common stockholders to FFO measures: |
|
|
|
|
|
|
Net earnings attributable to common stockholders |
|
$ |
3,322 |
|
|
$ |
3,726 |
|
|
|
|
|
|
|
|
Add (deduct) NAREIT defined adjustments: |
|
|
|
|
|
|
Real estate related depreciation and amortization |
|
|
2,539 |
|
|
|
2,504 |
|
Gains on other dispositions of investments in real estate, net of taxes (excluding development
properties and land) |
|
|
(685 |
) |
|
|
(899 |
) |
Adjustments related to noncontrolling interests |
|
|
(47 |
) |
|
|
(31 |
) |
Our proportionate share of adjustments related to unconsolidated entities |
|
|
551 |
|
|
|
495 |
|
NAREIT defined FFO attributable to common stockholders/unitholders |
|
$ |
5,680 |
|
|
$ |
5,795 |
|
|
|
|
|
|
|
|
Add (deduct) our modified adjustments: |
|
|
|
|
|
|
Unrealized foreign currency, derivative and other losses (gains), net |
|
|
125 |
|
|
|
(68 |
) |
Deferred income tax expense (benefit) |
|
|
4 |
|
|
|
21 |
|
Reconciling items related to noncontrolling interests |
|
|
(1 |
) |
|
|
- |
|
Our proportionate share of adjustments related to unconsolidated entities |
|
|
(29 |
) |
|
|
(7 |
) |
FFO, as modified by Prologis attributable to common stockholders/unitholders |
|
$ |
5,779 |
|
|
$ |
5,741 |
|
|
|
|
|
|
|
|
Adjustments to arrive at Core FFO: |
|
|
|
|
|
|
Gains on dispositions of development properties and land, net |
|
|
(258 |
) |
|
|
(414 |
) |
Current income tax expense (benefit) on dispositions |
|
|
26 |
|
|
|
25 |
|
Losses (gains) on early extinguishment of debt, net |
|
|
3 |
|
|
|
(1 |
) |
Adjustments related to noncontrolling interests |
|
|
15 |
|
|
|
6 |
|
Our proportionate share of adjustments related to unconsolidated entities |
|
|
(4 |
) |
|
|
(52 |
) |
Core FFO attributable to common stockholders/unitholders |
|
$ |
5,561 |
|
|
$ |
5,305 |
|
ITEM 7A. Quantitative and Qualitative Disclosures About Market Risk
We are exposed to the impact of foreign exchange-related variability and earnings volatility on our foreign investments and interest rate changes. See our risk factors in Item 1A. Risk Factors, specifically Risks Related to our Global Operations and Risks Related to Financing and Capital. See also Notes 2 and 14 in the Consolidated Financial Statements in Item 8. Financial Statements and Supplementary Data for more information about our foreign operations and derivative financial instruments.
We monitor our market risk exposures using a sensitivity analysis. Our sensitivity analysis estimates the exposure to market risk sensitive instruments assuming a hypothetical 10% adverse change in foreign currency exchange rates or interest rates at December 31, 2025. The results of the sensitivity analysis are summarized in the following sections. The sensitivity analysis is of limited predictive value. As a result, revenues and expenses, as well as our ultimate realized gains or losses with respect to foreign currency exchange rate and interest rate fluctuations will depend on the exposures that arise during a future period, hedging strategies at the time and the prevailing foreign currency exchange rates and interest rates.
Foreign Currency Risk
We are exposed to foreign currency exchange variability related to investments in and earnings from our foreign investments. Foreign currency market risk is the possibility that our results of operations or financial position could be better or worse than planned because of changes in foreign currency exchange rates. We primarily mitigate this risk by borrowing in the currencies where we invest, creating a natural hedge. In addition, we use derivative financial instruments, such as foreign currency contracts designated as net investment hedges, which offset translation adjustments on the net assets of our foreign investments. At December 31, 2025, after consideration of our ability to borrow in the foreign currencies in which we invest and also derivative and nonderivative financial instruments as discussed in Note 14 to the Consolidated Financial Statements, we had minimal net equity denominated in a currency other than the U.S. dollar.
For the year ended December 31, 2025, $697 million or 7.9% of our total consolidated revenue was denominated in foreign currencies. We enter into foreign currency contracts that we do not designate, such as forwards, to reduce the impact from fluctuations in foreign currency associated with the translation of the future earnings of our international subsidiaries. At December 31, 2025, we had foreign currency contracts denominated principally in British pound sterling, Canadian dollar, euro and Japanese yen, with an aggregate notional amount of $1.4 billion. As we do not designate these foreign currency contracts as hedges, the gain or loss on settlement is included in our earnings and offsets the lower or higher translation of earnings from our investments denominated in currencies other than the U.S. dollar. Although the impact to net earnings is mitigated through higher translated U.S. dollar earnings from these currencies, a weakening of the U.S. dollar against these currencies by 10% could result in a $140 million cash payment on settlement of these contracts.
Interest Rate Risk
We are also exposed to the impact of interest rate changes on future earnings and cash flows. To mitigate that risk, we generally borrow with fixed rate debt, and we may use derivative instruments to fix the interest rate on our variable rate debt. At December 31, 2025, $34.5 billion of our debt bore interest at fixed rates and therefore the fair value of these instruments was affected by changes in market interest rates. At December 31, 2025, $1.1 billion of our debt bore interest at variable rates. The following table summarizes the future repayment of debt and scheduled principal payments at December 31, 2025 (dollars in millions):
|
|
|
|
|
|
|
|
|
|
|
|
|
|
|
|
|
|
|
|
|
|
|
|
|
|
|
|
|
2026 |
|
|
2027 |
|
|
2028 |
|
|
2029 |
|
|
Thereafter |
|
|
Total |
|
|
Fair Value |
|
Fixed rate debt |
$ |
1,177 |
|
|
$ |
2,034 |
|
|
$ |
2,628 |
|
|
$ |
3,430 |
|
|
$ |
25,225 |
|
|
$ |
34,494 |
|
|
$ |
31,959 |
|
Weighted average interest rate (1) |
|
2.9 |
% |
|
|
2.2 |
% |
|
|
3.2 |
% |
|
|
2.7 |
% |
|
|
3.4 |
% |
|
|
3.2 |
% |
|
|
|
|
|
|
|
|
|
|
|
|
|
|
|
|
|
|
|
|
|
|
|
|
Variable rate debt |
|
|
|
|
|
|
|
|
|
|
|
|
|
|
|
|
|
|
|
|
Credit facilities |
$ |
- |
|
|
$ |
45 |
|
|
$ |
- |
|
|
$ |
- |
|
|
$ |
- |
|
|
$ |
45 |
|
|
$ |
45 |
|
Secured mortgage debt |
|
49 |
|
|
|
- |
|
|
|
- |
|
|
|
- |
|
|
|
- |
|
|
|
49 |
|
|
|
49 |
|
Term loans |
|
689 |
|
|
|
8 |
|
|
|
80 |
|
|
|
- |
|
|
|
213 |
|
|
|
990 |
|
|
|
990 |
|
Total variable rate debt |
$ |
738 |
|
|
$ |
53 |
|
|
$ |
80 |
|
|
$ |
- |
|
|
$ |
213 |
|
|
$ |
1,084 |
|
|
$ |
1,084 |
|
(1)The weighted average interest rates represent the effective interest rates (including amortization of debt issuance costs and noncash premiums and discounts) at December 31, 2025 for the debt outstanding and include the impact of designated interest rate contracts, which effectively fix the interest rate on certain variable rate debt.
At December 31, 2025, the weighted average effective interest rate on our variable rate debt was 3.0%, which was calculated using an average balance on our credit facilities throughout the year and our other variable rate debt balances at December 31, 2025. Changes in interest rates can cause interest expense to fluctuate on our variable rate debt. On the basis of our sensitivity analysis, a 10% increase in interest rates on our average outstanding variable rate debt balances would result in additional annual interest expense of $4 million for the year ended December 31, 2025, which equates to a change in interest rates of 30 basis points on our average outstanding variable rate debt balances and 1 basis point on our average total debt balances.
ITEM 8. Financial Statements and Supplementary Data
The Consolidated Balance Sheets of Prologis, Inc. and Prologis, L.P. at December 31, 2025 and 2024, the Consolidated Statements of Income of Prologis, Inc. and Prologis, L.P., the Consolidated Statements of Comprehensive Income of Prologis, Inc. and Prologis, L.P., the Consolidated Statements of Equity of Prologis, Inc., the Consolidated Statements of Capital of Prologis, L.P. and the Consolidated Statements of Cash Flows of Prologis, Inc. and Prologis, L.P. for each of the years in the three-year period ended December 31, 2025, Notes to Consolidated Financial Statements and Schedule III — Real Estate and Accumulated Depreciation, together with the reports of KPMG LLP, independent registered public accounting firm, are included under Item 15 of this report and are incorporated herein by reference. Selected unaudited quarterly financial data are voluntarily presented in Note 18 of the Consolidated Financial Statements.
ITEM 9. Changes in and Disagreements with Accountants on Accounting and Financial Disclosure
None.
ITEM 9A. Controls and Procedures
Controls and Procedures (Prologis, Inc.)
Prologis, Inc. carried out an evaluation under the supervision and with the participation of management, including the Chief Executive Officer and Chief Financial Officer, of the effectiveness of the disclosure controls and procedures (as defined in Rule 13a-15(e) under the Securities and Exchange Act of 1934 (the “Exchange Act”)) at December 31, 2025. Based on this evaluation, the Chief Executive Officer and the Chief Financial Officer have concluded that the disclosure controls and procedures are effective to ensure that information required to be disclosed by us in reports that we file or submit under the Exchange Act is recorded, processed, summarized and reported within the time periods specified in the SEC rules and forms. Subsequent to December 31, 2025, there were no significant changes in the internal controls or in other factors that could significantly affect these controls, including any corrective actions with regard to significant deficiencies and material weaknesses.
Changes in Internal Control over Financial Reporting
There have not been any changes in Prologis, Inc.’s internal control over financial reporting (as defined in Rules 13a-15(f) and 15(d)-15(f) under the Exchange Act) that occurred during the quarter ended December 31, 2025, that have materially affected, or are reasonably likely to materially affect, Prologis, Inc.’s internal control over financial reporting.
Management’s Annual Report on Internal Control over Financial Reporting
We are responsible for establishing and maintaining adequate internal control over financial reporting as defined in Rules 13a-15(f) and 15d-15(f) under the Exchange Act.
Under the supervision and with the participation of management, including the Chief Executive Officer and Chief Financial Officer, an evaluation of the effectiveness of the internal control over financial reporting was conducted at December 31, 2025, based on the criteria described in “Internal Control — Integrated Framework” (2013) issued by the Committee of Sponsoring Organizations of the Treadway Commission. Based on this assessment, management determined that, at December 31, 2025, the internal control over financial reporting was effective.
Our internal control over financial reporting at December 31, 2025, has been audited by KPMG LLP, an independent registered public accounting firm, as stated in their attestation report, which is included herein.
Limitations of the Effectiveness of Controls
Management’s assessment included an evaluation of the design of the internal control over financial reporting and testing of the operational effectiveness of the internal control over financial reporting. The internal control over financial reporting is a process designed to provide reasonable assurance regarding the reliability of financial reporting and the preparation of financial statements for external purposes in accordance with GAAP. Because of its inherent limitations, internal control over financial reporting may not prevent or detect misstatements. Also, projections of any evaluation of effectiveness to future periods are subject to the risk that controls may become inadequate because of changes in conditions, or that the degree of compliance with the policies or procedures may deteriorate.
Controls and Procedures (Prologis, L.P.)
Prologis, L.P. carried out an evaluation under the supervision and with the participation of management, including the Chief Executive Officer and Chief Financial Officer, of the effectiveness of the disclosure controls and procedures (as defined in Rule 13a-15(e) under the Exchange Act) at December 31, 2025. Based on this evaluation, the Chief Executive Officer and the Chief Financial Officer have concluded that the disclosure controls and procedures are effective to ensure that information required to be disclosed by us in reports that we file or submit under the Exchange Act is recorded, processed, summarized and reported within the time periods specified in the
SEC rules and forms. Subsequent to December 31, 2025, there were no significant changes in the internal controls or in other factors that could significantly affect these controls, including any corrective actions with regard to significant deficiencies and material weaknesses.
Changes in Internal Control over Financial Reporting
There have not been any changes in Prologis, L.P.’s internal control over financial reporting (as defined in Rules 13a-15(f) and 15(d)-15(f) under the Exchange Act) that occurred during the quarter ended December 31, 2025, that have materially affected, or are reasonably likely to materially affect, Prologis, L.P.’s internal control over financial reporting.
Management’s Annual Report on Internal Control over Financial Reporting
We are responsible for establishing and maintaining adequate internal control over financial reporting as defined in Rules 13a-15(f) and 15d-15(f) under the Exchange Act.
Under the supervision and with the participation of management, including the Chief Executive Officer and Chief Financial Officer, an evaluation of the effectiveness of the internal control over financial reporting was conducted at December 31, 2025 based on the criteria described in “Internal Control — Integrated Framework” (2013) issued by the Committee of Sponsoring Organizations of the Treadway Commission. Based on this assessment, management determined that, at December 31, 2025, the internal control over financial reporting was effective.
Limitations of the Effectiveness of Controls
Management’s assessment included an evaluation of the design of the internal control over financial reporting and testing of the operational effectiveness of the internal control over financial reporting. The internal control over financial reporting is a process designed to provide reasonable assurance regarding the reliability of financial reporting and the preparation of financial statements for external purposes in accordance with GAAP. Because of its inherent limitations, internal control over financial reporting may not prevent or detect misstatements. Also, projections of any evaluation of effectiveness to future periods are subject to the risk that controls may become inadequate because of changes in conditions, or that the degree of compliance with the policies or procedures may deteriorate.
ITEM 9B. Other Information
On November 26, 2025, Timothy D. Arndt, our Chief Financial Officer, adopted a pre-arranged stock trading plan for the sale of up to 26,290 shares of Prologis, Inc. common stock through March 31, 2027. On December 30, 2025, Daniel S. Letter, our then President and current Chief Executive Officer, adopted a pre-arranged stock trading plan for the sale of up to 60,000 shares of Prologis, Inc. common stock through March 31, 2027. These trading plans were entered into during an open insider trading window and are intended to satisfy the affirmative defense of Rule 10b5-1(c) under the Exchange Act and the Company's policies regarding insider transactions. No other Rule 10b5-1 trading arrangements or non-Rule 10b5-1 trading arrangements (as such terms are defined in Item 408 of Regulation S-K under the Exchange Act) were entered into or terminated by our directors or officers (as defined in Rule 16a-1(f) under the Exchange Act) during the quarterly period ended December 31, 2025.
ITEM 9C. Disclosure Regarding Foreign Jurisdictions that Prevent Inspections
Not applicable.
PART III
ITEM 10. Directors, Executive Officers and Corporate Governance
The information required by this item is incorporated herein by reference to, including relevant sections in our 2026 Proxy Statement, under the captions entitled Board of Directors and Corporate Governance; Executive Officers; Executive Compensation; Director
Compensation; Security Ownership; Equity Compensation Plans and Additional Information or will be provided in an amendment filed on Form 10-K/A.
ITEM 11. Executive Compensation
The information required by this item is incorporated herein by reference to the relevant sections in our 2026 Proxy Statement, under the captions entitled Board of Directors and Corporate Governance; Executive Officers; Executive Compensation and Director Compensation or will be provided in an amendment filed on Form 10-K/A.
ITEM 12. Security Ownership of Certain Beneficial Owners and Management and Related Stockholder Matters
The information required by this item is incorporated herein by reference to the relevant sections in our 2026 Proxy Statement, under the captions entitled Security Ownership and Equity Compensation Plans or will be provided in an amendment filed on Form 10-K/A.
ITEM 13. Certain Relationships and Related Transactions, and Director Independence
The information required by this item is incorporated herein by reference to the relevant sections in our 2026 Proxy Statement, under the caption entitled Board of Directors and Corporate Governance or will be provided in an amendment filed on Form 10-K/A.
ITEM 14. Principal Accounting Fees and Services
The information required by this item is incorporated herein by reference to the relevant sections in our 2026 Proxy Statement, under the caption entitled Audit Matters or will be provided in an amendment filed on Form 10-K/A.
PART IV
ITEM 15. Exhibits, Financial Statements and Schedules
The following documents are filed as a part of this report:
(a) Financial Statements and Schedules:
1. Financial Statements:
See Index to the Consolidated Financial Statements and Schedule III on page 50 of this report, which is incorporated herein by reference.
2. Financial Statement Schedules:
Schedule III — Real Estate and Accumulated Depreciation
All other schedules have been omitted since the required information is presented in the Consolidated Financial Statements and the related notes or is not applicable.
(b) Exhibits: The Exhibits required by Item 601 of Regulation S-K are listed in the Index to the Exhibits on pages 101 to 113 of this report, which is incorporated herein by reference.
(c) Financial Statements: See Index to the Consolidated Financial Statements and Schedule III on page 50 of this report, which is incorporated by reference.
ITEM 16. Form 10-K Summary
Not Applicable.
INDEX TO THE CONSOLIDATED FINANCIAL STATEMENTS AND SCHEDULE III
REPORT OF INDEPENDENT REGISTERED PUBLIC ACCOUNTING FIRM
To the Stockholders and Board of Directors
Prologis, Inc.:
Opinion on the Consolidated Financial Statements
We have audited the accompanying consolidated balance sheets of Prologis, Inc. and subsidiaries (the Company) as of December 31, 2025 and 2024, the related consolidated statements of income, comprehensive income, equity, and cash flows for each of the years in the three-year period ended December 31, 2025, and the related notes and financial statement schedule III (collectively, the consolidated financial statements). In our opinion, the consolidated financial statements present fairly, in all material respects, the financial position of the Company as of December 31, 2025 and 2024, and the results of its operations and its cash flows for each of the years in the three-year period ended December 31, 2025, in conformity with U.S. generally accepted accounting principles.
We also have audited, in accordance with the standards of the Public Company Accounting Oversight Board (United States) (PCAOB), the Company’s internal control over financial reporting as of December 31, 2025, based on criteria established in Internal Control – Integrated Framework (2013) issued by the Committee of Sponsoring Organizations of the Treadway Commission, and our report dated February 13, 2026 expressed an unqualified opinion on the effectiveness of the Company’s internal control over financial reporting.
Basis for Opinion
These consolidated financial statements are the responsibility of the Company’s management. Our responsibility is to express an opinion on these consolidated financial statements based on our audits. We are a public accounting firm registered with the PCAOB and are required to be independent with respect to the Company in accordance with the U.S. federal securities laws and the applicable rules and regulations of the Securities and Exchange Commission and the PCAOB.
We conducted our audits in accordance with the standards of the PCAOB. Those standards require that we plan and perform the audit to obtain reasonable assurance about whether the consolidated financial statements are free of material misstatement, whether due to error or fraud. Our audits included performing procedures to assess the risks of material misstatement of the consolidated financial statements, whether due to error or fraud, and performing procedures that respond to those risks. Such procedures included examining, on a test basis, evidence regarding the amounts and disclosures in the consolidated financial statements. Our audits also included evaluating the accounting principles used and significant estimates made by management, as well as evaluating the overall presentation of the consolidated financial statements. We believe that our audits provide a reasonable basis for our opinion.
Critical Audit Matter
The critical audit matter communicated below is a matter arising from the current period audit of the consolidated financial statements that was communicated or required to be communicated to the audit committee and that: (1) relates to accounts or disclosures that are material to the consolidated financial statements and (2) involved our especially challenging, subjective, or complex judgments. The communication of a critical audit matter does not alter in any way our opinion on the consolidated financial statements, taken as a whole, and we are not, by communicating the critical audit matter below, providing a separate opinion on the critical audit matter or on the accounts or disclosures to which it relates.
Assessment of the Company’s evaluation of the expected holding period for operating properties
As discussed in Notes 2 and 3 to the consolidated financial statements, the Company had $80,561 million of operating properties as of December 31, 2025. The Company tests the recoverability of operating properties whenever events or changes in circumstances, including shortening the expected holding period of such assets, indicate that the carrying amount of these assets may not be recoverable.
We identified the assessment of the Company’s evaluation of the expected holding period for certain operating properties as a critical audit matter. Subjective auditor judgment was required to assess the relevant events or changes in circumstances that the Company used to evaluate its expected holding period. A shortening of the expected holding period could indicate a potential impairment.
The following are the primary procedures we performed to address this critical audit matter. We evaluated the design and tested the operating effectiveness of certain internal controls related to determining the expected holding period of operating properties and any related changes. We evaluated the Company’s expected holding period by inquiring of the Company regarding changes to the expected holding period, considering certain factors related to the current economic environment, reading minutes of the meetings of the Company’s Board of Directors, reading external communications with investors and analysts, and analyzing documents prepared by the Company regarding proposed real estate transactions and potential changes to the expected holding period.
/s/ KPMG LLP
We have served as the Company’s auditor since 2002.
Denver, Colorado
February 13, 2026
REPORT OF INDEPENDENT REGISTERED PUBLIC ACCOUNTING FIRM
To the Partners of Prologis, L.P. and the Board of Directors of Prologis, Inc.:
Prologis, L.P.:
Opinion on the Consolidated Financial Statements
We have audited the accompanying consolidated balance sheets of Prologis, L.P. and subsidiaries (the Operating Partnership) as of December 31, 2025 and 2024, the related consolidated statements of income, comprehensive income, capital, and cash flows for each of the years in the three-year period ended December 31, 2025, and the related notes and financial statement schedule III (collectively, the consolidated financial statements). In our opinion, the consolidated financial statements present fairly, in all material respects, the financial position of the Operating Partnership as of December 31, 2025 and 2024, and the results of its operations and its cash flows for each of the years in the three-year period ended December 31, 2025, in conformity with U.S. generally accepted accounting principles.
Basis for Opinion
These consolidated financial statements are the responsibility of the Operating Partnership’s management. Our responsibility is to express an opinion on these consolidated financial statements based on our audits. We are a public accounting firm registered with the Public Company Accounting Oversight Board (United States) (PCAOB) and are required to be independent with respect to the Operating Partnership in accordance with the U.S. federal securities laws and the applicable rules and regulations of the Securities and Exchange Commission and the PCAOB.
We conducted our audits in accordance with the standards of the PCAOB. Those standards require that we plan and perform the audit to obtain reasonable assurance about whether the consolidated financial statements are free of material misstatement, whether due to error or fraud. The Operating Partnership is not required to have, nor were we engaged to perform, an audit of its internal control over financial reporting. As part of our audits, we are required to obtain an understanding of internal control over financial reporting but not for the purpose of expressing an opinion on the effectiveness of the Operating Partnership’s internal control over financial reporting. Accordingly, we express no such opinion.
Our audits included performing procedures to assess the risks of material misstatement of the consolidated financial statements, whether due to error or fraud, and performing procedures that respond to those risks. Such procedures included examining, on a test basis, evidence regarding the amounts and disclosures in the consolidated financial statements. Our audits also included evaluating the accounting principles used and significant estimates made by management, as well as evaluating the overall presentation of the consolidated financial statements. We believe that our audits provide a reasonable basis for our opinion.
Critical Audit Matter
The critical audit matter communicated below is a matter arising from the current period audit of the consolidated financial statements that was communicated or required to be communicated to the audit committee and that: (1) relates to accounts or disclosures that are material to the consolidated financial statements and (2) involved our especially challenging, subjective, or complex judgments. The communication of a critical audit matter does not alter in any way our opinion on the consolidated financial statements, taken as a whole, and we are not, by communicating the critical audit matter below, providing a separate opinion on the critical audit matter or on the accounts or disclosures to which it relates.
Assessment of the Operating Partnership’s evaluation of the expected holding period for operating properties
As discussed in Notes 2 and 3 to the consolidated financial statements, the Operating Partnership had $80,561 million of operating properties as of December 31, 2025. The Operating Partnership tests the recoverability of operating properties whenever events or changes in circumstances, including shortening the expected holding period of such assets, indicate that the carrying amount of these assets may not be recoverable.
We identified the assessment of the Operating Partnership’s evaluation of the expected holding period for certain operating properties as a critical audit matter. Subjective auditor judgment was required to assess the relevant events or changes in circumstances that the Operating Partnership used to evaluate its expected holding period. A shortening of the expected holding period could indicate a potential impairment.
The following are the primary procedures we performed to address this critical audit matter. We evaluated the design and tested the operating effectiveness of certain internal controls related to determining the expected holding period of operating properties and any related changes. We evaluated the Operating Partnership’s expected holding period by inquiring of the Operating Partnership regarding changes to the expected holding period, considering certain factors related to the current economic environment, reading minutes of the meetings of the Board of Directors of Prologis, Inc., reading external communications with investors and analysts, and analyzing documents prepared by the Operating Partnership regarding proposed real estate transactions and potential changes to the expected holding period.
/s/ KPMG LLP
We have served as the Operating Partnership’s auditor since 2002.
Denver, Colorado
February 13, 2026
REPORT OF INDEPENDENT REGISTERED PUBLIC ACCOUNTING FIRM
To the Stockholders and Board of Directors
Prologis, Inc.:
Opinion on Internal Control Over Financial Reporting
We have audited Prologis, Inc. and subsidiaries' (the Company) internal control over financial reporting as of December 31, 2025, based on criteria established in Internal Control – Integrated Framework (2013) issued by the Committee of Sponsoring Organizations of the Treadway Commission. In our opinion, the Company maintained, in all material respects, effective internal control over financial reporting as of December 31, 2025, based on criteria established in Internal Control – Integrated Framework (2013) issued by the Committee of Sponsoring Organizations of the Treadway Commission.
We also have audited, in accordance with the standards of the Public Company Accounting Oversight Board (United States) (PCAOB), the consolidated balance sheets of the Company as of December 31, 2025 and 2024, the related consolidated statements of income, comprehensive income, equity, and cash flows for each of the years in the three-year period ended December 31, 2025, and the related notes and financial statement schedule III (collectively, the consolidated financial statements), and our report dated February 13, 2026 expressed an unqualified opinion on those consolidated financial statements.
Basis for Opinion
The Company’s management is responsible for maintaining effective internal control over financial reporting and for its assessment of the effectiveness of internal control over financial reporting, included in the accompanying Management's Annual Report on Internal Control over Financial Reporting. Our responsibility is to express an opinion on the Company’s internal control over financial reporting based on our audit. We are a public accounting firm registered with the PCAOB and are required to be independent with respect to the Company in accordance with the U.S. federal securities laws and the applicable rules and regulations of the Securities and Exchange Commission and the PCAOB.
We conducted our audit in accordance with the standards of the PCAOB. Those standards require that we plan and perform the audit to obtain reasonable assurance about whether effective internal control over financial reporting was maintained in all material respects. Our audit of internal control over financial reporting included obtaining an understanding of internal control over financial reporting, assessing the risk that a material weakness exists, and testing and evaluating the design and operating effectiveness of internal control based on the assessed risk. Our audit also included performing such other procedures as we considered necessary in the circumstances. We believe that our audit provides a reasonable basis for our opinion.
Definition and Limitations of Internal Control Over Financial Reporting
A company’s internal control over financial reporting is a process designed to provide reasonable assurance regarding the reliability of financial reporting and the preparation of financial statements for external purposes in accordance with generally accepted accounting principles. A company’s internal control over financial reporting includes those policies and procedures that (1) pertain to the maintenance of records that, in reasonable detail, accurately and fairly reflect the transactions and dispositions of the assets of the company; (2) provide reasonable assurance that transactions are recorded as necessary to permit preparation of financial statements in accordance with generally accepted accounting principles, and that receipts and expenditures of the company are being made only in accordance with authorizations of management and directors of the company; and (3) provide reasonable assurance regarding prevention or timely detection of unauthorized acquisition, use, or disposition of the company’s assets that could have a material effect on the financial statements.
Because of its inherent limitations, internal control over financial reporting may not prevent or detect misstatements. Also, projections of any evaluation of effectiveness to future periods are subject to the risk that controls may become inadequate because of changes in conditions, or that the degree of compliance with the policies or procedures may deteriorate.
/s/ KPMG LLP
Denver, Colorado
February 13, 2026
PROLOGIS, INC.
CONSOLIDATED BALANCE SHEETS
(In thousands, except per share amounts)
|
|
|
|
|
|
|
|
|
December 31, |
|
|
2025 |
|
|
2024 |
|
ASSETS |
|
|
|
|
|
Investments in real estate properties |
$ |
95,129,356 |
|
|
$ |
91,246,176 |
|
Less accumulated depreciation |
|
14,729,149 |
|
|
|
12,758,159 |
|
Net investments in real estate properties |
|
80,400,207 |
|
|
|
78,488,017 |
|
Investments in and advances to unconsolidated entities |
|
11,093,936 |
|
|
|
10,079,448 |
|
Assets held for sale or contribution |
|
203,344 |
|
|
|
248,511 |
|
Net investments in real estate |
|
91,697,487 |
|
|
|
88,815,976 |
|
|
|
|
|
|
|
Cash and cash equivalents |
|
1,145,647 |
|
|
|
1,318,591 |
|
Other assets |
|
5,881,122 |
|
|
|
5,194,342 |
|
Total assets |
$ |
98,724,256 |
|
|
$ |
95,328,909 |
|
|
|
|
|
|
|
LIABILITIES AND EQUITY |
|
|
|
|
|
Liabilities: |
|
|
|
|
|
Debt |
$ |
35,037,073 |
|
|
$ |
30,879,263 |
|
Accounts payable and accrued expenses |
|
1,963,645 |
|
|
|
1,769,327 |
|
Other liabilities |
|
3,969,530 |
|
|
|
4,063,549 |
|
Total liabilities |
|
40,970,248 |
|
|
|
36,712,139 |
|
|
|
|
|
|
|
Equity: |
|
|
|
|
|
Prologis, Inc. stockholders’ equity: |
|
|
|
|
|
Series Q preferred stock at stated liquidation preference of $50 per share; $0.01 par value;
1,279 shares issued and outstanding and 100,000 preferred shares authorized at
December 31, 2025 and 2024 |
|
63,948 |
|
|
|
63,948 |
|
Common stock; $0.01 par value; 929,153 and 926,283 shares issued and outstanding at
December 31, 2025 and 2024, respectively |
|
9,292 |
|
|
|
9,263 |
|
Additional paid-in capital |
|
54,698,641 |
|
|
|
54,464,055 |
|
Accumulated other comprehensive loss |
|
(676,276 |
) |
|
|
(120,215 |
) |
Distributions in excess of net earnings |
|
(902,427 |
) |
|
|
(465,913 |
) |
Total Prologis, Inc. stockholders’ equity |
|
53,193,178 |
|
|
|
53,951,138 |
|
Noncontrolling interests |
|
4,560,830 |
|
|
|
4,665,632 |
|
Total equity |
|
57,754,008 |
|
|
|
58,616,770 |
|
Total liabilities and equity |
$ |
98,724,256 |
|
|
$ |
95,328,909 |
|
The accompanying notes are an integral part of these Consolidated Financial Statements.
PROLOGIS, INC.
CONSOLIDATED STATEMENTS OF INCOME
(In thousands, except per share amounts)
|
|
|
|
|
|
|
|
|
|
|
|
|
|
|
Years Ended December 31, |
|
|
|
2025 |
|
|
2024 |
|
|
2023 |
|
Revenues: |
|
|
|
|
|
|
|
|
|
Rental |
|
$ |
8,158,904 |
|
|
$ |
7,514,705 |
|
|
$ |
6,818,542 |
|
Strategic capital |
|
|
592,353 |
|
|
|
671,907 |
|
|
|
1,200,232 |
|
Development management and other |
|
|
38,870 |
|
|
|
14,998 |
|
|
|
4,695 |
|
Total revenues |
|
|
8,790,127 |
|
|
|
8,201,610 |
|
|
|
8,023,469 |
|
Expenses: |
|
|
|
|
|
|
|
|
|
Rental |
|
|
1,964,137 |
|
|
|
1,765,385 |
|
|
|
1,624,793 |
|
Strategic capital |
|
|
270,517 |
|
|
|
291,856 |
|
|
|
385,542 |
|
General and administrative |
|
|
469,114 |
|
|
|
418,765 |
|
|
|
390,406 |
|
Depreciation and amortization |
|
|
2,626,028 |
|
|
|
2,580,519 |
|
|
|
2,484,891 |
|
Other |
|
|
46,029 |
|
|
|
47,044 |
|
|
|
53,354 |
|
Total expenses |
|
|
5,375,825 |
|
|
|
5,103,569 |
|
|
|
4,938,986 |
|
|
|
|
|
|
|
|
|
|
|
Operating income before gains on real estate transactions, net |
|
|
3,414,302 |
|
|
|
3,098,041 |
|
|
|
3,084,483 |
|
Gains on dispositions of development properties and land, net |
|
|
257,731 |
|
|
|
413,743 |
|
|
|
462,270 |
|
Gains on other dispositions of investments in real estate, net |
|
|
685,831 |
|
|
|
904,136 |
|
|
|
161,039 |
|
Operating income |
|
|
4,357,864 |
|
|
|
4,415,920 |
|
|
|
3,707,792 |
|
|
|
|
|
|
|
|
|
|
|
Other income (expense): |
|
|
|
|
|
|
|
|
|
Earnings from unconsolidated entities, net |
|
|
402,531 |
|
|
|
353,623 |
|
|
|
307,227 |
|
Interest expense |
|
|
(1,002,344 |
) |
|
|
(863,932 |
) |
|
|
(641,332 |
) |
Foreign currency, derivative and other gains (losses) and other income
(expense), net |
|
|
14,763 |
|
|
|
208,731 |
|
|
|
87,221 |
|
Gains (losses) on early extinguishment of debt, net |
|
|
(3,498 |
) |
|
|
536 |
|
|
|
3,275 |
|
Total other income (expense) |
|
|
(588,548 |
) |
|
|
(301,042 |
) |
|
|
(243,609 |
) |
Earnings before income taxes |
|
|
3,769,316 |
|
|
|
4,114,878 |
|
|
|
3,464,183 |
|
Income tax expense |
|
|
(204,017 |
) |
|
|
(166,943 |
) |
|
|
(211,038 |
) |
Consolidated net earnings |
|
|
3,565,299 |
|
|
|
3,947,935 |
|
|
|
3,253,145 |
|
Less net earnings attributable to noncontrolling interests |
|
|
237,068 |
|
|
|
216,300 |
|
|
|
193,931 |
|
Net earnings attributable to controlling interests |
|
|
3,328,231 |
|
|
|
3,731,635 |
|
|
|
3,059,214 |
|
Less preferred stock dividends |
|
|
5,882 |
|
|
|
5,881 |
|
|
|
5,841 |
|
Net earnings attributable to common stockholders |
|
$ |
3,322,349 |
|
|
$ |
3,725,754 |
|
|
$ |
3,053,373 |
|
|
|
|
|
|
|
|
|
|
|
Weighted average common shares outstanding – Basic |
|
|
928,473 |
|
|
|
926,172 |
|
|
|
924,351 |
|
Weighted average common shares outstanding – Diluted |
|
|
956,832 |
|
|
|
953,590 |
|
|
|
951,791 |
|
|
|
|
|
|
|
|
|
|
|
Net earnings per share attributable to common stockholders – Basic |
|
$ |
3.58 |
|
|
$ |
4.02 |
|
|
$ |
3.30 |
|
|
|
|
|
|
|
|
|
|
|
Net earnings per share attributable to common stockholders – Diluted |
|
$ |
3.56 |
|
|
$ |
4.01 |
|
|
$ |
3.29 |
|
The accompanying notes are an integral part of these Consolidated Financial Statements.
PROLOGIS, INC.
CONSOLIDATED STATEMENTS OF COMPREHENSIVE INCOME
(In thousands)
|
|
|
|
|
|
|
|
|
|
|
|
|
|
|
Years Ended December 31, |
|
|
|
2025 |
|
|
2024 |
|
|
2023 |
|
Consolidated net earnings |
|
$ |
3,565,299 |
|
|
$ |
3,947,935 |
|
|
$ |
3,253,145 |
|
Other comprehensive income: |
|
|
|
|
|
|
|
|
|
Foreign currency translation gains (losses), net |
|
|
(575,862 |
) |
|
|
360,874 |
|
|
|
20,763 |
|
Unrealized gains (losses) on derivative contracts, net |
|
|
8,400 |
|
|
|
39,279 |
|
|
|
(92,703 |
) |
Comprehensive income |
|
|
2,997,837 |
|
|
|
4,348,088 |
|
|
|
3,181,205 |
|
Net earnings attributable to noncontrolling interests |
|
|
(237,068 |
) |
|
|
(216,300 |
) |
|
|
(193,931 |
) |
Other comprehensive loss (income) attributable to noncontrolling interests |
|
|
11,401 |
|
|
|
(6,167 |
) |
|
|
1,348 |
|
Comprehensive income attributable to common stockholders |
|
$ |
2,772,170 |
|
|
$ |
4,125,621 |
|
|
$ |
2,988,622 |
|
The accompanying notes are an integral part of these Consolidated Financial Statements.
PROLOGIS, INC.
CONSOLIDATED STATEMENTS OF EQUITY
(In thousands, except per share amounts)
|
|
|
|
|
|
|
|
|
|
|
|
|
|
|
|
|
|
|
|
|
|
|
|
|
|
|
|
|
|
|
|
|
|
|
|
Common Stock |
|
|
|
|
|
Accumulated |
|
|
Distributions |
|
|
|
|
|
|
|
|
|
|
|
Number |
|
|
|
|
|
Additional |
|
|
Other |
|
|
in Excess of |
|
|
Non- |
|
|
|
|
|
Preferred |
|
|
of |
|
|
Par |
|
|
Paid-in |
|
|
Comprehensive |
|
|
Net |
|
|
controlling |
|
|
Total |
|
|
Stock |
|
|
Shares |
|
|
Value |
|
|
Capital |
|
|
Income (Loss) |
|
|
Earnings |
|
|
Interests |
|
|
Equity |
|
Balance at January 1, 2023 |
$ |
63,948 |
|
|
|
923,142 |
|
|
$ |
9,231 |
|
|
$ |
54,065,407 |
|
|
$ |
(443,609 |
) |
|
$ |
(457,695 |
) |
|
$ |
4,625,811 |
|
|
$ |
57,863,093 |
|
Consolidated net earnings |
|
- |
|
|
|
- |
|
|
|
- |
|
|
|
- |
|
|
|
- |
|
|
|
3,059,214 |
|
|
|
193,931 |
|
|
|
3,253,145 |
|
Effect of equity compensation plans |
|
- |
|
|
|
410 |
|
|
|
5 |
|
|
|
84,719 |
|
|
|
- |
|
|
|
- |
|
|
|
195,987 |
|
|
|
280,711 |
|
Capital contributions |
|
- |
|
|
|
- |
|
|
|
- |
|
|
|
- |
|
|
|
- |
|
|
|
- |
|
|
|
32,157 |
|
|
|
32,157 |
|
Redemption of noncontrolling interests |
|
- |
|
|
|
839 |
|
|
|
8 |
|
|
|
48,349 |
|
|
|
- |
|
|
|
- |
|
|
|
(118,164 |
) |
|
|
(69,807 |
) |
Foreign currency translation gains
(losses), net |
|
- |
|
|
|
- |
|
|
|
- |
|
|
|
- |
|
|
|
19,867 |
|
|
|
- |
|
|
|
896 |
|
|
|
20,763 |
|
Unrealized gains (losses) on
derivative contracts, net |
|
- |
|
|
|
- |
|
|
|
- |
|
|
|
- |
|
|
|
(90,459 |
) |
|
|
- |
|
|
|
(2,244 |
) |
|
|
(92,703 |
) |
Reallocation of equity |
|
- |
|
|
|
- |
|
|
|
- |
|
|
|
51,328 |
|
|
|
- |
|
|
|
- |
|
|
|
(51,328 |
) |
|
|
- |
|
Dividends ($3.48 per common share)
and other distributions |
|
- |
|
|
|
- |
|
|
|
- |
|
|
|
(2 |
) |
|
|
- |
|
|
|
(3,228,587 |
) |
|
|
(235,050 |
) |
|
|
(3,463,639 |
) |
Balance at December 31, 2023 |
$ |
63,948 |
|
|
|
924,391 |
|
|
$ |
9,244 |
|
|
$ |
54,249,801 |
|
|
$ |
(514,201 |
) |
|
$ |
(627,068 |
) |
|
$ |
4,641,996 |
|
|
$ |
57,823,720 |
|
Consolidated net earnings |
|
- |
|
|
|
- |
|
|
|
- |
|
|
|
- |
|
|
|
- |
|
|
|
3,731,635 |
|
|
|
216,300 |
|
|
|
3,947,935 |
|
Effect of equity compensation plans |
|
- |
|
|
|
487 |
|
|
|
5 |
|
|
|
69,239 |
|
|
|
- |
|
|
|
- |
|
|
|
170,187 |
|
|
|
239,431 |
|
Capital contributions |
|
- |
|
|
|
- |
|
|
|
- |
|
|
|
- |
|
|
|
- |
|
|
|
- |
|
|
|
73,094 |
|
|
|
73,094 |
|
Redemption of noncontrolling interests |
|
- |
|
|
|
1,405 |
|
|
|
14 |
|
|
|
80,677 |
|
|
|
- |
|
|
|
- |
|
|
|
(82,341 |
) |
|
|
(1,650 |
) |
Foreign currency translation gains
(losses), net |
|
- |
|
|
|
- |
|
|
|
- |
|
|
|
- |
|
|
|
355,663 |
|
|
|
- |
|
|
|
5,211 |
|
|
|
360,874 |
|
Unrealized gains (losses) on
derivative contracts, net |
|
- |
|
|
|
- |
|
|
|
- |
|
|
|
- |
|
|
|
38,323 |
|
|
|
- |
|
|
|
956 |
|
|
|
39,279 |
|
Reallocation of equity |
|
- |
|
|
|
- |
|
|
|
- |
|
|
|
64,070 |
|
|
|
- |
|
|
|
- |
|
|
|
(64,070 |
) |
|
|
- |
|
Dividends ($3.84 per common share)
and other distributions |
|
- |
|
|
|
- |
|
|
|
- |
|
|
|
268 |
|
|
|
- |
|
|
|
(3,570,480 |
) |
|
|
(295,701 |
) |
|
|
(3,865,913 |
) |
Balance at December 31, 2024 |
$ |
63,948 |
|
|
|
926,283 |
|
|
$ |
9,263 |
|
|
$ |
54,464,055 |
|
|
$ |
(120,215 |
) |
|
$ |
(465,913 |
) |
|
$ |
4,665,632 |
|
|
$ |
58,616,770 |
|
Consolidated net earnings |
|
- |
|
|
|
- |
|
|
|
- |
|
|
|
- |
|
|
|
- |
|
|
|
3,328,231 |
|
|
|
237,068 |
|
|
|
3,565,299 |
|
Effect of equity compensation plans |
|
- |
|
|
|
486 |
|
|
|
5 |
|
|
|
79,284 |
|
|
|
- |
|
|
|
- |
|
|
|
116,771 |
|
|
|
196,060 |
|
Capital contributions |
|
- |
|
|
|
- |
|
|
|
- |
|
|
|
- |
|
|
|
- |
|
|
|
- |
|
|
|
70,612 |
|
|
|
70,612 |
|
Purchase of noncontrolling interests |
|
- |
|
|
|
- |
|
|
|
- |
|
|
|
(1,677 |
) |
|
|
- |
|
|
|
- |
|
|
|
(11,984 |
) |
|
|
(13,661 |
) |
Redemption of noncontrolling interests |
|
- |
|
|
|
2,384 |
|
|
|
24 |
|
|
|
137,236 |
|
|
|
- |
|
|
|
- |
|
|
|
(157,207 |
) |
|
|
(19,947 |
) |
Foreign currency translation gains
(losses), net |
|
- |
|
|
|
- |
|
|
|
- |
|
|
|
- |
|
|
|
(564,268 |
) |
|
|
- |
|
|
|
(11,594 |
) |
|
|
(575,862 |
) |
Unrealized gains (losses) on
derivative contracts, net |
|
- |
|
|
|
- |
|
|
|
- |
|
|
|
- |
|
|
|
8,207 |
|
|
|
- |
|
|
|
193 |
|
|
|
8,400 |
|
Reallocation of equity |
|
- |
|
|
|
- |
|
|
|
- |
|
|
|
19,772 |
|
|
|
- |
|
|
|
- |
|
|
|
(19,772 |
) |
|
|
- |
|
Dividends ($4.04 per common share)
and other distributions |
|
- |
|
|
|
- |
|
|
|
- |
|
|
|
(29 |
) |
|
|
- |
|
|
|
(3,764,745 |
) |
|
|
(328,889 |
) |
|
|
(4,093,663 |
) |
Balance at December 31, 2025 |
$ |
63,948 |
|
|
|
929,153 |
|
|
$ |
9,292 |
|
|
$ |
54,698,641 |
|
|
$ |
(676,276 |
) |
|
$ |
(902,427 |
) |
|
$ |
4,560,830 |
|
|
$ |
57,754,008 |
|
The accompanying notes are an integral part of these Consolidated Financial Statements.
PROLOGIS, INC.
CONSOLIDATED STATEMENTS OF CASH FLOWS
(In thousands)
|
|
|
|
|
|
|
|
|
|
|
|
|
|
|
Years Ended December 31, |
|
|
|
2025 |
|
|
2024 |
|
|
2023 |
|
Operating activities: |
|
|
|
|
|
|
|
|
|
Consolidated net earnings |
|
$ |
3,565,299 |
|
|
$ |
3,947,935 |
|
|
$ |
3,253,145 |
|
Adjustments to reconcile net earnings to net cash provided by (used in) operating activities: |
|
|
|
|
|
|
|
|
|
Straight-lined rents and amortization of above and below market leases |
|
|
(691,090 |
) |
|
|
(644,606 |
) |
|
|
(613,005 |
) |
Equity-based compensation awards |
|
|
185,466 |
|
|
|
231,747 |
|
|
|
267,648 |
|
Depreciation and amortization |
|
|
2,626,028 |
|
|
|
2,580,519 |
|
|
|
2,484,891 |
|
Earnings from unconsolidated entities, net |
|
|
(402,531 |
) |
|
|
(353,623 |
) |
|
|
(307,227 |
) |
Operating distributions from unconsolidated entities |
|
|
644,936 |
|
|
|
562,475 |
|
|
|
680,192 |
|
Decrease (increase) in operating receivables from unconsolidated entities |
|
|
1,272 |
|
|
|
20,532 |
|
|
|
(82,375 |
) |
Amortization of debt discounts and debt issuance costs, net |
|
|
85,647 |
|
|
|
78,885 |
|
|
|
74,589 |
|
Gains on dispositions of development properties and land, net |
|
|
(257,731 |
) |
|
|
(413,743 |
) |
|
|
(462,270 |
) |
Gains on other dispositions of investments in real estate, net |
|
|
(685,831 |
) |
|
|
(904,136 |
) |
|
|
(161,039 |
) |
Unrealized foreign currency and derivative losses (gains), net |
|
|
125,656 |
|
|
|
(67,335 |
) |
|
|
71,627 |
|
Losses (gains) on early extinguishment of debt, net |
|
|
3,498 |
|
|
|
(536 |
) |
|
|
(3,275 |
) |
Deferred income tax expense (benefit) |
|
|
4,309 |
|
|
|
21,161 |
|
|
|
17,708 |
|
Decrease (increase) in other assets |
|
|
(422,101 |
) |
|
|
(341,614 |
) |
|
|
(102,610 |
) |
Increase (decrease) in accounts payable and accrued expenses and other liabilities |
|
|
225,607 |
|
|
|
194,548 |
|
|
|
255,059 |
|
Net cash provided by (used in) operating activities |
|
|
5,008,434 |
|
|
|
4,912,209 |
|
|
|
5,373,058 |
|
Investing activities: |
|
|
|
|
|
|
|
|
|
Real estate development |
|
|
(2,781,260 |
) |
|
|
(3,206,231 |
) |
|
|
(3,399,114 |
) |
Real estate acquisitions |
|
|
(1,800,527 |
) |
|
|
(2,327,605 |
) |
|
|
(4,195,714 |
) |
Duke Transaction, net of cash acquired |
|
|
- |
|
|
|
- |
|
|
|
(33,009 |
) |
Tenant improvements and lease commissions on previously leased space |
|
|
(562,197 |
) |
|
|
(499,927 |
) |
|
|
(388,814 |
) |
Property improvements |
|
|
(327,355 |
) |
|
|
(386,481 |
) |
|
|
(303,042 |
) |
Proceeds from dispositions and contributions of real estate |
|
|
2,246,186 |
|
|
|
3,790,388 |
|
|
|
1,764,322 |
|
Investments in and advances to unconsolidated entities |
|
|
(312,214 |
) |
|
|
(540,559 |
) |
|
|
(284,185 |
) |
Return of investment from unconsolidated entities |
|
|
104,431 |
|
|
|
58,339 |
|
|
|
348,276 |
|
Proceeds from the settlement of net investment hedges |
|
|
4,852 |
|
|
|
16,021 |
|
|
|
37,113 |
|
Payments on the settlement of net investment hedges |
|
|
(25,648 |
) |
|
|
(3,002 |
) |
|
|
(2,230 |
) |
Proceeds from repayment of notes receivable backed by real estate |
|
|
- |
|
|
|
- |
|
|
|
37,000 |
|
Purchase of short-term investments |
|
|
(176,715 |
) |
|
|
- |
|
|
|
- |
|
Net cash provided by (used in) investing activities |
|
|
(3,630,447 |
) |
|
|
(3,099,057 |
) |
|
|
(6,419,397 |
) |
Financing activities: |
|
|
|
|
|
|
|
|
|
Dividends paid on common and preferred stock |
|
|
(3,764,745 |
) |
|
|
(3,570,480 |
) |
|
|
(3,228,589 |
) |
Noncontrolling interests contributions |
|
|
70,612 |
|
|
|
73,094 |
|
|
|
21,107 |
|
Noncontrolling interests distributions |
|
|
(327,014 |
) |
|
|
(295,701 |
) |
|
|
(235,050 |
) |
Settlement of noncontrolling interests |
|
|
(33,608 |
) |
|
|
(1,650 |
) |
|
|
(69,807 |
) |
Tax paid with shares withheld |
|
|
(23,947 |
) |
|
|
(30,526 |
) |
|
|
(24,536 |
) |
Debt and equity issuance costs paid |
|
|
(40,043 |
) |
|
|
(30,966 |
) |
|
|
(58,660 |
) |
Net proceeds from (payments on) credit facilities and commercial paper |
|
|
(203,917 |
) |
|
|
(730,077 |
) |
|
|
(567,076 |
) |
Repurchase of and payments on debt |
|
|
(701,861 |
) |
|
|
(919,481 |
) |
|
|
(272,203 |
) |
Proceeds from the issuance of debt |
|
|
3,460,904 |
|
|
|
4,505,830 |
|
|
|
5,755,096 |
|
Net cash provided by (used in) financing activities |
|
|
(1,563,619 |
) |
|
|
(999,957 |
) |
|
|
1,320,282 |
|
|
|
|
|
|
|
|
|
|
|
Effect of foreign currency exchange rate changes on cash |
|
|
12,688 |
|
|
|
(24,992 |
) |
|
|
(22,038 |
) |
Net increase (decrease) in cash and cash equivalents |
|
|
(172,944 |
) |
|
|
788,203 |
|
|
|
251,905 |
|
Cash and cash equivalents, beginning of year |
|
|
1,318,591 |
|
|
|
530,388 |
|
|
|
278,483 |
|
Cash and cash equivalents, end of year |
|
$ |
1,145,647 |
|
|
$ |
1,318,591 |
|
|
$ |
530,388 |
|
See Note 17 for information on noncash investing and financing activities and other information.
The accompanying notes are an integral part of these Consolidated Financial Statements.
PROLOGIS, L.P.
CONSOLIDATED BALANCE SHEETS
(In thousands)
|
|
|
|
|
|
|
|
|
December 31, |
|
|
2025 |
|
|
2024 |
|
ASSETS |
|
|
|
|
|
Investments in real estate properties |
$ |
95,129,356 |
|
|
$ |
91,246,176 |
|
Less accumulated depreciation |
|
14,729,149 |
|
|
|
12,758,159 |
|
Net investments in real estate properties |
|
80,400,207 |
|
|
|
78,488,017 |
|
Investments in and advances to unconsolidated entities |
|
11,093,936 |
|
|
|
10,079,448 |
|
Assets held for sale or contribution |
|
203,344 |
|
|
|
248,511 |
|
Net investments in real estate |
|
91,697,487 |
|
|
|
88,815,976 |
|
|
|
|
|
|
|
Cash and cash equivalents |
|
1,145,647 |
|
|
|
1,318,591 |
|
Other assets |
|
5,881,122 |
|
|
|
5,194,342 |
|
Total assets |
$ |
98,724,256 |
|
|
$ |
95,328,909 |
|
|
|
|
|
|
|
LIABILITIES AND CAPITAL |
|
|
|
|
|
Liabilities: |
|
|
|
|
|
Debt |
$ |
35,037,073 |
|
|
$ |
30,879,263 |
|
Accounts payable and accrued expenses |
|
1,963,645 |
|
|
|
1,769,327 |
|
Other liabilities |
|
3,969,530 |
|
|
|
4,063,549 |
|
Total liabilities |
|
40,970,248 |
|
|
|
36,712,139 |
|
|
|
|
|
|
|
Capital: |
|
|
|
|
|
Partners’ capital: |
|
|
|
|
|
General partner – preferred |
|
63,948 |
|
|
|
63,948 |
|
General partner – common |
|
53,129,230 |
|
|
|
53,887,190 |
|
Limited partners – common |
|
1,244,117 |
|
|
|
913,227 |
|
Limited partners – Class A common |
|
- |
|
|
|
429,358 |
|
Total partners’ capital |
|
54,437,295 |
|
|
|
55,293,723 |
|
Noncontrolling interests |
|
3,316,713 |
|
|
|
3,323,047 |
|
Total capital |
|
57,754,008 |
|
|
|
58,616,770 |
|
Total liabilities and capital |
$ |
98,724,256 |
|
|
$ |
95,328,909 |
|
The accompanying notes are an integral part of these Consolidated Financial Statements.
PROLOGIS, L.P.
CONSOLIDATED STATEMENTS OF INCOME
(In thousands, except per unit amounts)
|
|
|
|
|
|
|
|
|
|
|
|
|
|
|
Years Ended December 31, |
|
|
|
2025 |
|
|
2024 |
|
|
2023 |
|
Revenues: |
|
|
|
|
|
|
|
|
|
Rental |
|
$ |
8,158,904 |
|
|
$ |
7,514,705 |
|
|
$ |
6,818,542 |
|
Strategic capital |
|
|
592,353 |
|
|
|
671,907 |
|
|
|
1,200,232 |
|
Development management and other |
|
|
38,870 |
|
|
|
14,998 |
|
|
|
4,695 |
|
Total revenues |
|
|
8,790,127 |
|
|
|
8,201,610 |
|
|
|
8,023,469 |
|
Expenses: |
|
|
|
|
|
|
|
|
|
Rental |
|
|
1,964,137 |
|
|
|
1,765,385 |
|
|
|
1,624,793 |
|
Strategic capital |
|
|
270,517 |
|
|
|
291,856 |
|
|
|
385,542 |
|
General and administrative |
|
|
469,114 |
|
|
|
418,765 |
|
|
|
390,406 |
|
Depreciation and amortization |
|
|
2,626,028 |
|
|
|
2,580,519 |
|
|
|
2,484,891 |
|
Other |
|
|
46,029 |
|
|
|
47,044 |
|
|
|
53,354 |
|
Total expenses |
|
|
5,375,825 |
|
|
|
5,103,569 |
|
|
|
4,938,986 |
|
|
|
|
|
|
|
|
|
|
|
Operating income before gains on real estate transactions, net |
|
|
3,414,302 |
|
|
|
3,098,041 |
|
|
|
3,084,483 |
|
Gains on dispositions of development properties and land, net |
|
|
257,731 |
|
|
|
413,743 |
|
|
|
462,270 |
|
Gains on other dispositions of investments in real estate, net |
|
|
685,831 |
|
|
|
904,136 |
|
|
|
161,039 |
|
Operating income |
|
|
4,357,864 |
|
|
|
4,415,920 |
|
|
|
3,707,792 |
|
|
|
|
|
|
|
|
|
|
|
Other income (expense): |
|
|
|
|
|
|
|
|
|
Earnings from unconsolidated entities, net |
|
|
402,531 |
|
|
|
353,623 |
|
|
|
307,227 |
|
Interest expense |
|
|
(1,002,344 |
) |
|
|
(863,932 |
) |
|
|
(641,332 |
) |
Foreign currency, derivative and other gains (losses) and other income
(expense), net |
|
|
14,763 |
|
|
|
208,731 |
|
|
|
87,221 |
|
Gains (losses) on early extinguishment of debt, net |
|
|
(3,498 |
) |
|
|
536 |
|
|
|
3,275 |
|
Total other income (expense) |
|
|
(588,548 |
) |
|
|
(301,042 |
) |
|
|
(243,609 |
) |
Earnings before income taxes |
|
|
3,769,316 |
|
|
|
4,114,878 |
|
|
|
3,464,183 |
|
Income tax expense |
|
|
(204,017 |
) |
|
|
(166,943 |
) |
|
|
(211,038 |
) |
Consolidated net earnings |
|
|
3,565,299 |
|
|
|
3,947,935 |
|
|
|
3,253,145 |
|
Less net earnings attributable to noncontrolling interests |
|
|
156,064 |
|
|
|
123,192 |
|
|
|
116,657 |
|
Net earnings attributable to controlling interests |
|
|
3,409,235 |
|
|
|
3,824,743 |
|
|
|
3,136,488 |
|
Less preferred unit distributions |
|
|
5,882 |
|
|
|
5,881 |
|
|
|
5,841 |
|
Net earnings attributable to common unitholders |
|
$ |
3,403,353 |
|
|
$ |
3,818,862 |
|
|
$ |
3,130,647 |
|
|
|
|
|
|
|
|
|
|
|
Weighted average common units outstanding – Basic |
|
|
947,938 |
|
|
|
941,782 |
|
|
|
939,635 |
|
Weighted average common units outstanding – Diluted |
|
|
956,832 |
|
|
|
953,590 |
|
|
|
951,791 |
|
|
|
|
|
|
|
|
|
|
|
Net earnings per unit attributable to common unitholders – Basic |
|
$ |
3.58 |
|
|
$ |
4.02 |
|
|
$ |
3.30 |
|
|
|
|
|
|
|
|
|
|
|
Net earnings per unit attributable to common unitholders – Diluted |
|
$ |
3.56 |
|
|
$ |
4.01 |
|
|
$ |
3.29 |
|
The accompanying notes are an integral part of these Consolidated Financial Statements.
PROLOGIS, L.P.
CONSOLIDATED STATEMENTS OF COMPREHENSIVE INCOME
(In thousands)
|
|
|
|
|
|
|
|
|
|
|
|
|
|
|
Years Ended December 31, |
|
|
|
2025 |
|
|
2024 |
|
|
2023 |
|
Consolidated net earnings |
|
$ |
3,565,299 |
|
|
$ |
3,947,935 |
|
|
$ |
3,253,145 |
|
Other comprehensive income: |
|
|
|
|
|
|
|
|
|
Foreign currency translation gains (losses), net |
|
|
(575,862 |
) |
|
|
360,874 |
|
|
|
20,763 |
|
Unrealized gains (losses) on derivative contracts, net |
|
|
8,400 |
|
|
|
39,279 |
|
|
|
(92,703 |
) |
Comprehensive income |
|
|
2,997,837 |
|
|
|
4,348,088 |
|
|
|
3,181,205 |
|
Net earnings attributable to noncontrolling interests |
|
|
(156,064 |
) |
|
|
(123,192 |
) |
|
|
(116,657 |
) |
Other comprehensive loss (income) attributable to noncontrolling interests |
|
|
(1,826 |
) |
|
|
3,651 |
|
|
|
(404 |
) |
Comprehensive income attributable to common unitholders |
|
$ |
2,839,947 |
|
|
$ |
4,228,547 |
|
|
$ |
3,064,144 |
|
The accompanying notes are an integral part of these Consolidated Financial Statements.
PROLOGIS, L.P.
CONSOLIDATED STATEMENTS OF CAPITAL
(In thousands, except per unit amounts)
|
|
|
|
|
|
|
|
|
|
|
|
|
|
|
|
|
|
|
|
|
|
|
|
|
|
|
|
|
|
|
|
General Partner |
|
Limited Partners |
|
Non- |
|
|
|
|
Preferred |
|
Common |
|
Common |
|
Class A Common |
|
controlling |
|
|
|
|
Units |
|
Amount |
|
Units |
|
Amount |
|
Units |
|
Amount |
|
Units |
|
Amount |
|
Interests |
|
Total |
|
Balance at January 1, 2023 |
|
1,279 |
|
$ |
63,948 |
|
|
923,142 |
|
$ |
53,173,334 |
|
|
14,640 |
|
$ |
843,263 |
|
|
8,595 |
|
$ |
464,781 |
|
$ |
3,317,767 |
|
$ |
57,863,093 |
|
Consolidated net earnings |
|
- |
|
|
- |
|
|
- |
|
|
3,059,214 |
|
|
- |
|
|
50,490 |
|
|
- |
|
|
26,784 |
|
|
116,657 |
|
|
3,253,145 |
|
Effect of equity compensation plans |
|
- |
|
|
- |
|
|
410 |
|
|
84,724 |
|
|
1,536 |
|
|
195,987 |
|
|
- |
|
|
- |
|
|
- |
|
|
280,711 |
|
Capital contributions |
|
- |
|
|
- |
|
|
- |
|
|
- |
|
|
- |
|
|
- |
|
|
- |
|
|
- |
|
|
32,157 |
|
|
32,157 |
|
Redemption of limited partnership
units |
|
- |
|
|
- |
|
|
839 |
|
|
48,357 |
|
|
(1,416 |
) |
|
(118,164 |
) |
|
- |
|
|
- |
|
|
- |
|
|
(69,807 |
) |
Foreign currency translation gains
(losses), net |
|
- |
|
|
- |
|
|
- |
|
|
19,867 |
|
|
- |
|
|
316 |
|
|
- |
|
|
176 |
|
|
404 |
|
|
20,763 |
|
Unrealized gains (losses) on
derivative contracts, net |
|
- |
|
|
- |
|
|
- |
|
|
(90,459 |
) |
|
- |
|
|
(1,444 |
) |
|
- |
|
|
(800 |
) |
|
- |
|
|
(92,703 |
) |
Reallocation of capital |
|
- |
|
|
- |
|
|
- |
|
|
51,328 |
|
|
- |
|
|
(52,180 |
) |
|
- |
|
|
852 |
|
|
- |
|
|
- |
|
Distributions ($3.48 per common
unit) and other |
|
- |
|
|
- |
|
|
- |
|
|
(3,228,589 |
) |
|
- |
|
|
(70,108 |
) |
|
- |
|
|
(22,232 |
) |
|
(142,710 |
) |
|
(3,463,639 |
) |
Balance at December 31, 2023 |
|
1,279 |
|
$ |
63,948 |
|
|
924,391 |
|
$ |
53,117,776 |
|
|
14,760 |
|
$ |
848,160 |
|
|
8,595 |
|
$ |
469,561 |
|
$ |
3,324,275 |
|
$ |
57,823,720 |
|
Consolidated net earnings |
|
- |
|
|
- |
|
|
- |
|
|
3,731,635 |
|
|
- |
|
|
62,800 |
|
|
- |
|
|
30,308 |
|
|
123,192 |
|
|
3,947,935 |
|
Effect of equity compensation plans |
|
- |
|
|
- |
|
|
487 |
|
|
69,244 |
|
|
1,465 |
|
|
170,187 |
|
|
- |
|
|
- |
|
|
- |
|
|
239,431 |
|
Capital contributions |
|
- |
|
|
- |
|
|
- |
|
|
- |
|
|
- |
|
|
- |
|
|
- |
|
|
- |
|
|
73,094 |
|
|
73,094 |
|
Redemption of limited partnership
units |
|
- |
|
|
- |
|
|
1,405 |
|
|
80,691 |
|
|
(526 |
) |
|
(30,503 |
) |
|
(945 |
) |
|
(51,838 |
) |
|
- |
|
|
(1,650 |
) |
Foreign currency translation gains
(losses), net |
|
- |
|
|
- |
|
|
- |
|
|
355,663 |
|
|
- |
|
|
6,028 |
|
|
- |
|
|
2,834 |
|
|
(3,651 |
) |
|
360,874 |
|
Unrealized gains (losses) on
derivative contracts, net |
|
- |
|
|
- |
|
|
- |
|
|
38,323 |
|
|
- |
|
|
650 |
|
|
- |
|
|
306 |
|
|
- |
|
|
39,279 |
|
Reallocation of capital |
|
- |
|
|
- |
|
|
- |
|
|
64,070 |
|
|
- |
|
|
(62,654 |
) |
|
- |
|
|
(1,416 |
) |
|
- |
|
|
- |
|
Distributions ($3.84 per common
unit) and other |
|
- |
|
|
- |
|
|
- |
|
|
(3,570,212 |
) |
|
- |
|
|
(81,441 |
) |
|
- |
|
|
(20,397 |
) |
|
(193,863 |
) |
|
(3,865,913 |
) |
Balance at December 31, 2024 |
|
1,279 |
|
$ |
63,948 |
|
|
926,283 |
|
$ |
53,887,190 |
|
|
15,699 |
|
$ |
913,227 |
|
|
7,650 |
|
$ |
429,358 |
|
$ |
3,323,047 |
|
$ |
58,616,770 |
|
Consolidated net earnings |
|
- |
|
|
- |
|
|
- |
|
|
3,328,231 |
|
|
- |
|
|
71,846 |
|
|
- |
|
|
9,158 |
|
|
156,064 |
|
|
3,565,299 |
|
Effect of equity compensation plans |
|
- |
|
|
- |
|
|
486 |
|
|
79,289 |
|
|
1,115 |
|
|
116,771 |
|
|
- |
|
|
- |
|
|
- |
|
|
196,060 |
|
Capital contributions |
|
- |
|
|
- |
|
|
- |
|
|
- |
|
|
- |
|
|
- |
|
|
- |
|
|
- |
|
|
70,612 |
|
|
70,612 |
|
Purchase of noncontrolling interests |
|
- |
|
|
- |
|
|
- |
|
|
(1,677 |
) |
|
- |
|
|
- |
|
|
- |
|
|
- |
|
|
(11,984 |
) |
|
(13,661 |
) |
Redemption of noncontrolling
interests |
|
- |
|
|
- |
|
|
- |
|
|
757 |
|
|
- |
|
|
- |
|
|
- |
|
|
- |
|
|
(757 |
) |
|
- |
|
Redemption of limited partnership
units |
|
- |
|
|
- |
|
|
2,384 |
|
|
136,503 |
|
|
4,944 |
|
|
266,900 |
|
|
(7,650 |
) |
|
(423,350 |
) |
|
- |
|
|
(19,947 |
) |
Foreign currency translation gains
(losses), net |
|
- |
|
|
- |
|
|
- |
|
|
(564,268 |
) |
|
- |
|
|
(13,408 |
) |
|
- |
|
|
(12 |
) |
|
1,826 |
|
|
(575,862 |
) |
Unrealized gains (losses) on
derivative contracts, net |
|
- |
|
|
- |
|
|
- |
|
|
8,207 |
|
|
- |
|
|
193 |
|
|
- |
|
|
- |
|
|
- |
|
|
8,400 |
|
Reallocation of capital |
|
- |
|
|
- |
|
|
- |
|
|
19,772 |
|
|
- |
|
|
(13,417 |
) |
|
- |
|
|
(6,355 |
) |
|
- |
|
|
- |
|
Distributions ($4.04 per common
unit) and other |
|
- |
|
|
- |
|
|
- |
|
|
(3,764,774 |
) |
|
- |
|
|
(97,995 |
) |
|
- |
|
|
(8,799 |
) |
|
(222,095 |
) |
|
(4,093,663 |
) |
Balance at December 31, 2025 |
|
1,279 |
|
$ |
63,948 |
|
|
929,153 |
|
$ |
53,129,230 |
|
|
21,758 |
|
$ |
1,244,117 |
|
|
- |
|
$ |
- |
|
$ |
3,316,713 |
|
$ |
57,754,008 |
|
The accompanying notes are an integral part of these Consolidated Financial Statements.
PROLOGIS, L.P
CONSOLIDATED STATEMENTS OF CASH FLOWS
(In thousands)
|
|
|
|
|
|
|
|
|
|
|
|
|
|
|
Years Ended December 31, |
|
|
|
2025 |
|
|
2024 |
|
|
2023 |
|
Operating activities: |
|
|
|
|
|
|
|
|
|
Consolidated net earnings |
|
$ |
3,565,299 |
|
|
$ |
3,947,935 |
|
|
$ |
3,253,145 |
|
Adjustments to reconcile net earnings to net cash provided by (used in) operating activities: |
|
|
|
|
|
|
|
|
|
Straight-lined rents and amortization of above and below market leases |
|
|
(691,090 |
) |
|
|
(644,606 |
) |
|
|
(613,005 |
) |
Equity-based compensation awards |
|
|
185,466 |
|
|
|
231,747 |
|
|
|
267,648 |
|
Depreciation and amortization |
|
|
2,626,028 |
|
|
|
2,580,519 |
|
|
|
2,484,891 |
|
Earnings from unconsolidated entities, net |
|
|
(402,531 |
) |
|
|
(353,623 |
) |
|
|
(307,227 |
) |
Operating distributions from unconsolidated entities |
|
|
644,936 |
|
|
|
562,475 |
|
|
|
680,192 |
|
Decrease (increase) in operating receivables from unconsolidated entities |
|
|
1,272 |
|
|
|
20,532 |
|
|
|
(82,375 |
) |
Amortization of debt discounts and debt issuance costs, net |
|
|
85,647 |
|
|
|
78,885 |
|
|
|
74,589 |
|
Gains on dispositions of development properties and land, net |
|
|
(257,731 |
) |
|
|
(413,743 |
) |
|
|
(462,270 |
) |
Gains on other dispositions of investments in real estate, net |
|
|
(685,831 |
) |
|
|
(904,136 |
) |
|
|
(161,039 |
) |
Unrealized foreign currency and derivative losses (gains), net |
|
|
125,656 |
|
|
|
(67,335 |
) |
|
|
71,627 |
|
Losses (gains) on early extinguishment of debt, net |
|
|
3,498 |
|
|
|
(536 |
) |
|
|
(3,275 |
) |
Deferred income tax expense (benefit) |
|
|
4,309 |
|
|
|
21,161 |
|
|
|
17,708 |
|
Decrease (increase) in other assets |
|
|
(422,101 |
) |
|
|
(341,614 |
) |
|
|
(102,610 |
) |
Increase (decrease) in accounts payable and accrued expenses and other liabilities |
|
|
225,607 |
|
|
|
194,548 |
|
|
|
255,059 |
|
Net cash provided by (used in) operating activities |
|
|
5,008,434 |
|
|
|
4,912,209 |
|
|
|
5,373,058 |
|
Investing activities: |
|
|
|
|
|
|
|
|
|
Real estate development |
|
|
(2,781,260 |
) |
|
|
(3,206,231 |
) |
|
|
(3,399,114 |
) |
Real estate acquisitions |
|
|
(1,800,527 |
) |
|
|
(2,327,605 |
) |
|
|
(4,195,714 |
) |
Duke Transaction, net of cash acquired |
|
|
- |
|
|
|
- |
|
|
|
(33,009 |
) |
Tenant improvements and lease commissions on previously leased space |
|
|
(562,197 |
) |
|
|
(499,927 |
) |
|
|
(388,814 |
) |
Property improvements |
|
|
(327,355 |
) |
|
|
(386,481 |
) |
|
|
(303,042 |
) |
Proceeds from dispositions and contributions of real estate |
|
|
2,246,186 |
|
|
|
3,790,388 |
|
|
|
1,764,322 |
|
Investments in and advances to unconsolidated entities |
|
|
(312,214 |
) |
|
|
(540,559 |
) |
|
|
(284,185 |
) |
Return of investment from unconsolidated entities |
|
|
104,431 |
|
|
|
58,339 |
|
|
|
348,276 |
|
Proceeds from the settlement of net investment hedges |
|
|
4,852 |
|
|
|
16,021 |
|
|
|
37,113 |
|
Payments on the settlement of net investment hedges |
|
|
(25,648 |
) |
|
|
(3,002 |
) |
|
|
(2,230 |
) |
Proceeds from repayment of notes receivable backed by real estate |
|
|
- |
|
|
|
- |
|
|
|
37,000 |
|
Purchase of short-term investments |
|
|
(176,715 |
) |
|
|
- |
|
|
|
- |
|
Net cash provided by (used in) investing activities |
|
|
(3,630,447 |
) |
|
|
(3,099,057 |
) |
|
|
(6,419,397 |
) |
Financing activities: |
|
|
|
|
|
|
|
|
|
Distributions paid on common and preferred units |
|
|
(3,871,539 |
) |
|
|
(3,672,318 |
) |
|
|
(3,320,929 |
) |
Noncontrolling interests contributions |
|
|
70,612 |
|
|
|
73,094 |
|
|
|
21,107 |
|
Noncontrolling interests distributions |
|
|
(220,220 |
) |
|
|
(193,863 |
) |
|
|
(142,710 |
) |
Settlement of noncontrolling interests |
|
|
(13,661 |
) |
|
|
- |
|
|
|
- |
|
Redemption of common limited partnership units |
|
|
(19,947 |
) |
|
|
(1,650 |
) |
|
|
(69,807 |
) |
Tax paid with shares of the Parent withheld |
|
|
(23,947 |
) |
|
|
(30,526 |
) |
|
|
(24,536 |
) |
Debt and equity issuance costs paid |
|
|
(40,043 |
) |
|
|
(30,966 |
) |
|
|
(58,660 |
) |
Net proceeds from (payments on) credit facilities and commercial paper |
|
|
(203,917 |
) |
|
|
(730,077 |
) |
|
|
(567,076 |
) |
Repurchase of and payments on debt |
|
|
(701,861 |
) |
|
|
(919,481 |
) |
|
|
(272,203 |
) |
Proceeds from the issuance of debt |
|
|
3,460,904 |
|
|
|
4,505,830 |
|
|
|
5,755,096 |
|
Net cash provided by (used in) financing activities |
|
|
(1,563,619 |
) |
|
|
(999,957 |
) |
|
|
1,320,282 |
|
|
|
|
|
|
|
|
|
|
|
Effect of foreign currency exchange rate changes on cash |
|
|
12,688 |
|
|
|
(24,992 |
) |
|
|
(22,038 |
) |
Net increase (decrease) in cash and cash equivalents |
|
|
(172,944 |
) |
|
|
788,203 |
|
|
|
251,905 |
|
Cash and cash equivalents, beginning of year |
|
|
1,318,591 |
|
|
|
530,388 |
|
|
|
278,483 |
|
Cash and cash equivalents, end of year |
|
$ |
1,145,647 |
|
|
$ |
1,318,591 |
|
|
$ |
530,388 |
|
See Note 17 for information on noncash investing and financing activities and other information.
The accompanying notes are an integral part of these Consolidated Financial Statements.
PROLOGIS, INC. AND PROLOGIS, L.P.
NOTES TO THE CONSOLIDATED FINANCIAL STATEMENTS
NOTE 1. DESCRIPTION OF THE BUSINESS
Prologis, Inc. (or the “Parent”) commenced operations as a fully integrated real estate company in 1997, elected to be taxed as a real estate investment trust (“REIT”) under the Internal Revenue Code of 1986, as amended (the “Internal Revenue Code” or “IRC”), and believes the current organization and method of operation will enable it to maintain its status as a REIT. The Parent is the general partner of Prologis, L.P. (or the “Operating Partnership” or “OP”). Through the OP, we are engaged in the ownership, acquisition, development and management of logistics facilities with a focus on key markets in 20 countries on four continents. We invest in real estate through wholly owned subsidiaries and other entities through which we co-invest with partners and investors. We maintain a significant level of ownership in these co-investment ventures, which may be consolidated or unconsolidated based on our level of control of the entity. Our current business strategy consists of two reportable segments: Real Estate (Rental Operations and Development) and Strategic Capital. Our Real Estate Segment represents the ownership, leasing and development of logistics properties. Our Strategic Capital Segment represents the management of properties owned by our unconsolidated co-investment ventures and other ventures. See Note 16 for further discussion of our reportable segments. Unless otherwise indicated, the Notes to the Consolidated Financial Statements apply to both the Parent and the OP. The terms “the Company,” “Prologis,” “we,” “our” or “us” means the Parent and OP collectively.
For each share of preferred or common stock the Parent issues, the OP issues a corresponding preferred or common partnership unit, as applicable, to the Parent in exchange for the contribution of the proceeds from the stock issuance. At December 31, 2025, the Parent owned a 97.71% common general partnership interest in the OP and substantially all of the preferred units in the OP. The remaining 2.29% common limited partnership interests are owned by unaffiliated investors and certain current and former directors and officers of the Parent. Each partner’s percentage interest in the OP is determined based on the number of OP units held compared to total OP units outstanding at each period end and is used as the basis for the allocation of net income or loss to each partner. At the end of each reporting period, a capital adjustment is made in the OP to reflect the appropriate ownership interest for each of the common unitholders. These adjustments are reflected in the line items Reallocation of Equity in the Consolidated Statements of Equity of the Parent and Reallocation of Capital in the Consolidated Statements of Capital of the OP.
As the sole general partner of the OP, the Parent has complete responsibility and discretion in the day-to-day management and control of the OP, and we operate the Parent and the OP as one enterprise. The management of the Parent consists of the same members as the management of the OP. These members are officers of the Parent and employees of the OP or one of its subsidiaries. As general partner with control of the OP, the Parent is the primary beneficiary and therefore consolidates the OP. Because the Parent’s only significant asset is its investment in the OP, the assets and liabilities of the Parent and the OP are the same on their respective financial statements.
Information with respect to the square footage, number of buildings and acres of land is unaudited.
NOTE 2. SUMMARY OF SIGNIFICANT ACCOUNTING POLICIES
Basis of Presentation. The accompanying Consolidated Financial Statements are prepared in accordance with United States (“U.S.”) generally accepted accounting principles (“GAAP”) and are presented in our reporting currency, the U.S. dollar. Intercompany transactions with consolidated entities have been eliminated.
Consolidation. We consolidate all entities that are wholly owned and those in which we own less than 100% of the equity but control the entity, as well as any variable interest entities (“VIEs”) in which we are the primary beneficiary. We evaluate our ability to control an entity and whether the entity is a VIE and we are the primary beneficiary through consideration of substantive terms of the arrangement to identify which enterprise has the power to direct the activities of the entity that most significantly impact the entity’s economic performance and the obligation to absorb losses and the right to receive benefits from the entity.
For entities that are not defined as VIEs, we first consider whether we are the general partner or the limited partner (or the equivalent in such investments that are not structured as partnerships). We consolidate entities in which we are the general partner and the limited partners in such entities do not have rights that would preclude control. For entities in which we are the general partner but do not control the entity as the other partners hold substantive participating or kick-out rights, we apply the equity method of accounting since, as the general partner, we have the ability to exercise significant influence over the operating and financial policies of the venture. For ventures for which we are a limited partner, or our investment is in an entity that is not structured similar to a partnership, we consider factors such as ownership interest, voting control, authority to make decisions and contractual and substantive participating rights of the partners. In instances where the factors indicate that we have a controlling financial interest in the venture, we consolidate the entity. In instances where we do not have a controlling interest in the venture, we apply the equity method of accounting when the factors indicate we have the ability to exercise significant influence over the venture.
Use of Estimates. GAAP requires us to make estimates and assumptions that affect the reported amounts of assets and liabilities, disclosure of contingent assets and liabilities at the date of the financial statements, and revenues and expenses during the reporting period. Although we believe the assumptions and estimates we made are reasonable and appropriate, as discussed in the applicable
sections throughout the Consolidated Financial Statements, different assumptions and estimates could materially impact our reported results.
Foreign Operations. The U.S. dollar is the functional currency for our consolidated subsidiaries and unconsolidated entities operating in the U.S. and Mexico. The functional currency for our consolidated subsidiaries and unconsolidated entities operating in other countries is the principal currency in which the entity’s assets, liabilities, income and expenses are denominated, which may be different from the local currency of the country of incorporation or where the entity conducts its operations. The functional currencies of entities outside of the U.S. and Mexico generally include the Brazilian real, British pound sterling, Canadian dollar, Chinese renminbi, euro, Indian rupee, Japanese yen, Singapore dollar and Swedish krona. We take part in business transactions denominated in these and other local currencies where we operate.
For our consolidated subsidiaries whose functional currency is not the U.S. dollar, we translate their financial statements into U.S. dollars at the time we consolidate those subsidiaries’ financial statements. Generally, assets and liabilities are translated at the exchange rate in effect at the balance sheet date. The resulting translation adjustments are included in Accumulated Other Comprehensive Income (Loss) (“AOCI/L”) in the Consolidated Balance Sheets. Certain balance sheet items, principally equity and capital-related accounts, are reflected at the historical exchange rate. Income statement accounts are translated using the average exchange rate for the period; income statement accounts that represent significant nonrecurring transactions are translated at the rate in effect at the date of the transaction. We translate our share of the net income or loss of our unconsolidated entities at the average exchange rate for the period other than significant nonrecurring transactions of the unconsolidated entities which are translated at the rate in effect at the date of the transaction.
We and certain of our consolidated subsidiaries have intercompany and third-party debt that is not denominated in the entity’s functional currency. When the debt is remeasured against the functional currency of the entity, a gain or loss can result. The resulting adjustment is reflected in Foreign Currency, Derivative and Other Gains (Losses) and Other Income (Expense), Net in the Consolidated Statements of Income, unless it is intercompany debt that is deemed to be long-term in nature or third-party debt that has been designated as a nonderivative net investment hedge and then the adjustment is recorded as a cumulative translation adjustment in AOCI/L.
Acquisitions. We apply a screen test to evaluate if substantially all the fair value of the acquired property or properties is concentrated in a single identifiable asset or group of similar identifiable assets to determine whether a transaction is accounted for as an asset acquisition or business combination. As the fair value of most of our real estate acquisitions is concentrated in either a single identifiable asset or a group of similar identifiable assets, our real estate transactions are generally accounted for as asset acquisitions, which permits the capitalization of transaction costs to the basis of the acquired property. We measure the real estate assets acquired through an asset acquisition based on their cost or total consideration exchanged. The difference between the cost and the estimated fair value (excess or bargain consideration) is allocated to the real estate properties and certain related lease intangibles on a relative fair value basis. All other assets and liabilities assumed, including debt, and real estate assets that we intend to sell in the next twelve months are recorded at fair value. At a property level, we allocate the fair value to the components which include building, land, improvements and intangible assets or liabilities related to acquired leases. Purchase price allocations for a business combination are recorded at fair value.
When we obtain control of an unconsolidated entity and the acquisition qualifies as a business combination, we account for the acquisition in accordance with the guidance for a business combination achieved in stages. We remeasure our previously held interest in the unconsolidated entity at its acquisition-date fair value and recognize any resulting gain or loss in earnings.
We allocate the purchase price using principally Level 2 and Level 3 inputs (further defined in Fair Value Measurements below) as follows:
Investments in Real Estate Properties. We value operating properties as if vacant. We estimate fair value by applying an income approach methodology using either a discounted cash flow analysis or applying a capitalization rate to the estimated net operating income, defined as rental revenues less rental expenses, of a property. Key assumptions include market rents and rent growth, and discount and capitalization rates. Estimates of future cash flows are based on a number of factors including historical operating results, known trends and market and economic conditions. We determine the discount or capitalization rate by market, based on recent transactions and other market data, and adjust if necessary based on the property characteristics. The fair value of land is generally based on relevant market data, such as a comparison of the subject site to similar parcels that have recently been sold or are currently being offered on the market for sale. At a property level, we allocate the fair value to building, land and improvements.
Lease Intangibles. We determine the portion of the purchase price related to acquired in-place leases as intangible assets and liabilities as follows:
•Above and Below Market Leases. We recognize an asset or liability for acquired leases with in-place rents that are higher or lower than our estimate of current market rents in each of the applicable markets. The above or below market lease intangibles are valued using a discounted cash flow approach through which we recognize the present value of the difference in cash flows between in-place and market rents. The value is recorded in either Other Assets or Other Liabilities, as appropriate, and is amortized over the remaining term of the respective leases, including any bargain renewal options, to rental revenues.
•Foregone Rent. We calculate the value of the revenue and recovery of costs which would be foregone during a reasonable lease-up period, if the space was vacant, in each of the applicable markets. The values are recorded in Other Assets and amortized over the remaining life of the respective leases to amortization expense.
•Leasing Commissions. We recognize an asset for leasing commissions based on our estimate of the cost to lease space in the applicable markets. The value is recorded in Other Assets and amortized over the remaining life of the respective leases to amortization expense.
Investments in Unconsolidated Entities. We estimate the fair value of the entity by using similar valuation methods as those used for the consolidated real estate properties and debt. We apply our ownership percentage to the estimated net asset value of the entity to determine the fair value of our investment.
Debt. We estimate the fair value of debt based on contractual future cash flows discounted using borrowing spreads and market interest rates that would be available to us for the issuance of debt with similar terms and remaining maturities. In the case of publicly traded debt, we estimate the fair value based on available market data. Any discount or premium to the principal amount is included in the carrying value and amortized to interest expense over the remaining term of the related debt using the effective interest method.
Noncontrolling Interests. We estimate the portion of the fair value of the net assets owned by third parties based on the fair value of the consolidated net assets, principally real estate properties and debt.
Working Capital. We estimate the fair value of other acquired assets and assumed liabilities using the best information available.
Fair Value Measurements. The objective of fair value is to determine the price that would be received on the sale of an asset or paid to transfer a liability in an orderly transaction between market participants at the measurement date (the exit price). We estimate fair value using available market information and valuation methodologies we believe to be appropriate for these purposes. Considerable judgment and a high degree of subjectivity are involved in developing these estimates and, accordingly, they are not necessarily indicative of amounts that we would realize on disposition. The fair value hierarchy consists of three broad levels:
•Level 1 — Quoted prices (unadjusted) in active markets for identical assets or liabilities that the entity can access at the measurement date.
•Level 2 — Inputs other than quoted prices included within Level 1 that are observable for the asset or liability, either directly or indirectly.
•Level 3 — Unobservable inputs for the asset or liability.
Fair Value Measurements on a Recurring Basis. We estimate the fair value of our financial instruments using available market information and valuation methodologies we believe to be appropriate for these purposes. We determine the fair value of our derivative financial instruments using widely accepted valuation techniques. The technique utilized depends on the type of derivative financial instrument being valued, principally foreign currency contracts and interest rate contracts, and involves the contractual term of the derivative, observable market-based inputs and implied volatilities.
We determine the fair values of our interest rate contracts using a market standard methodology of netting the discounted future fixed cash receipts and the discounted expected variable cash payments through a discounted cash flow analysis. We base the variable cash payments on an expectation of future interest rates, or forward curves, derived from observable market interest rate curves through the contractual term of the debt. We determine the fair values of our foreign currency contracts by comparing the contracted forward exchange rate to the current market exchange rate. We build a foreign exchange forward curve to determine the foreign exchange forward rate that pertains to the specific maturity date. Using this foreign exchange forward rate, spot rates and the interest rate curve of the domestic currency as inputs, we calculate the mark-to-market value of the foreign currency contract.
We incorporate credit valuation adjustments to appropriately reflect nonperformance risk for us and the respective counterparty in the fair value measurements. In adjusting the fair value of our derivative contracts for the effect of nonperformance risk, we consider the impact of netting and any applicable credit enhancements, such as collateral postings, thresholds, mutual puts and guarantees.
We have determined that the majority of the inputs used to value our derivatives fall within Level 2 of the fair value hierarchy. Although the credit valuation adjustments associated with our derivatives utilize Level 3 inputs, such as estimates of current credit spreads to evaluate the likelihood of default by us and our counterparties, we assess the significance of the impact of the credit valuation adjustments on the overall valuation of our derivative positions and have determined that the credit valuation adjustments are not significant to the overall valuation of our derivatives.
Fair Value Measurements on a Nonrecurring Basis. Assets measured at fair value on a nonrecurring basis generally consist of real estate assets and investments in unconsolidated entities that were subject to impairment charges due to our evaluation of recoverability whenever events or changes in circumstances indicate the carrying amount may not be recoverable. As discussed below, our analysis of recoverability is primarily triggered based on the shortening of the expected hold period due to our change in intent to sell a property in the near term. We estimate the fair value of our investments based on expected sales prices in the market (Level 2) or by applying an income approach methodology using a discounted cash flow analysis (Level 3).
Fair Value of Financial Instruments. We estimate the fair value of our senior notes for disclosure purposes based on quoted market prices for the same (Level 1) or similar (Level 2) issuances when current quoted market prices are available. We estimate the fair value of our credit facilities, term loans, secured mortgage debt and other debt by discounting the future cash flows using rates and borrowing spreads currently available to us (Level 3).
Real Estate Assets. Real estate assets are carried at depreciated cost. We capitalize costs incurred in developing, redeveloping and improving real estate assets as part of the investment basis. We expense costs for repairs and maintenance as incurred.
Depreciation and Amortization. We charge the depreciable portions of real estate assets to depreciation expense on a straight-line basis over the respective estimated useful lives. Depreciation on development buildings commences when the asset is ready for its intended use, which we define as the earlier of when a property that was developed has been completed for one year, or is 90% occupied. We generally use the following useful lives: 5 to 7 years for capital improvements, 10 years for standard tenant improvements, 15 to 25 years for depreciable land improvements, 25 to 40 years for operating properties acquired based on the age of the building and 40 years for operating properties we develop. We depreciate building improvements on land parcels subject to land leases over the shorter of the estimated life of the building improvement or the contractual term of the underlying land lease. Capitalized leasing costs are amortized over the estimated remaining lease term. The weighted average lease term for leases that commenced during 2025, including new leases and renewals, was 70 months based on square feet.
Capitalization of Costs. During the land development and construction periods of qualifying projects, we capitalize interest costs, insurance, real estate taxes and general and administrative costs of the personnel performing the development; if such costs are incremental and identifiable to a specific activity to ready the asset for its intended use. We capitalize transaction costs related to the acquisition of land for future development and operating properties that qualify as asset acquisitions. We capitalize incremental, third-party costs incurred to successfully originate a lease that result directly from obtaining a lease and would not have been incurred if the lease had not been obtained. Leasing costs that meet the requirements for capitalization are presented as a component of Other Assets and all other capitalized costs are included in the investment basis of the real estate assets.
Recoverability of Real Estate Assets. We assess the carrying values of our respective long-lived assets whenever events or changes in circumstances indicate that the carrying amounts of these assets may not be fully recoverable. This assessment is primarily triggered based on the shortening of the expected hold period due to a change in our intent to sell a property in the near term. We have processes to monitor our intent with regard to our investments and the estimated disposition value in comparison to the current carrying value. If our assessment of potential triggering events indicates that the carrying value of a property that we expect to sell in the near term is not recoverable, we recognize an impairment charge for the amount by which the carrying value exceeds the current estimated fair value of the property. We determine the fair value of the property based on the estimated proceeds from disposition that are based on quoted market values, third-party appraisals or discounted cash flow models that utilize the future net operating income from the property and expected market capitalization rates. Changes in economic and operating conditions could impact our intent and the assumptions used in determining the fair value that could result in future impairment.
At least annually or more frequently given the presence of a triggering event, we assess the recoverability of our assets based on our intent as follows:
•for real estate properties that we intend to hold long-term; including land held for development, properties currently under development and operating properties; recoverability is assessed based on the estimated undiscounted future net operating income from the property, the terminal value and anticipated costs to develop;
•for real estate properties we intend to sell, including properties currently under development and operating properties; recoverability is assessed based on estimated proceeds from disposition that are based on the future net operating income from the property, expected market capitalization rates and anticipated costs to develop;
•for land parcels we intend to sell, recoverability is assessed based on the estimated proceeds from disposition; and
•for costs incurred related to the potential acquisition of land and operating properties and future development projects, recoverability is assessed based on the probability that the acquisition or development is likely to occur at the measurement date.
Assets Held for Sale or Contribution. We classify a property as held for sale or contribution when certain criteria are met in accordance with GAAP. Assets classified as held for sale are expected to be sold to a third party and assets classified as held for contribution are generally newly developed assets we intend to contribute to an unconsolidated co-investment venture within twelve months. When the criteria are met, the respective assets and liabilities are presented separately in the Consolidated Balance Sheets and depreciation is not recognized. Assets held for sale or contribution are reported at the lower of carrying amount or estimated fair value less costs to sell.
Investments in Unconsolidated Entities. We present our investments in certain entities generally under the equity method. We use the equity method when we have the ability to exercise significant influence over operating and financial policies of the venture but do not have control of the entity. Under the equity method, we initially recognize these investments (including advances) in the balance sheet at our cost. We subsequently adjust the accounts to reflect our proportionate share of net earnings or losses recognized and accumulated other comprehensive income or loss, distributions received, contributions made, sales and redemptions of our
investments and certain other adjustments, as appropriate. When circumstances indicate there may have been a reduction in the value of an equity investment, we evaluate whether the loss in value is other than temporary. If we conclude it is other than temporary, we recognize an impairment charge to reflect the equity investment at fair value.
With regard to distributions from unconsolidated entities, we have elected the nature of distribution approach as the information is available to us to determine the nature of the underlying activity that generated the distributions. In accordance with the nature of distribution approach, cash flows generated from the operations of an unconsolidated entity are classified as a return on investment (cash inflow from operating activities) and cash flows that are generated from property sales, debt refinancing or sales and redemptions of our investments are classified as a return of investment (cash inflow from investing activities).
Cash and Cash Equivalents. We consider all cash on hand, demand deposits with financial institutions and short-term highly liquid investments with original maturities of three months or less to be cash equivalents. Our cash and cash equivalents are financial instruments that are exposed to concentrations of credit risk. We invest our cash with high-credit quality institutions both domestically and internationally. Cash balances may be invested in money market accounts that are not insured. We have not realized any losses of such cash investments or accounts and believe that we are not exposed to any significant credit risk.
Derivative Financial Instruments. We primarily hedge our foreign currency risk by borrowing in the currencies in which we invest. We may use derivative financial instruments, primarily foreign currency contracts to manage foreign currency exchange rate risk related to both our foreign investments and the related earnings. In addition, we occasionally use interest rate contracts to manage interest rate risk and limit the impact of future interest rate changes on earnings and cash flows, principally related to variable-rate debt and in anticipation of fixed-rate debt issuances.
We do not use derivative financial instruments for trading or speculative purposes. Each derivative transaction is customized and not exchange-traded. We recognize all derivatives at fair value within the line items Other Assets or Other Liabilities. We do not net our derivative position by counterparty for purposes of balance sheet presentation and disclosure. Management reviews our derivative positions, overall risk management strategy and hedging program, on a regular basis. We only enter into transactions that we believe will be highly effective at offsetting the underlying risk. Our use of derivatives involves the risk that counterparties may default on a derivative contract; therefore we: (i) establish exposure limits for each counterparty to minimize this risk and provide counterparty diversification; (ii) contract with counterparties that have long-term credit ratings of single-A or better; (iii) enter into master agreements that generally allow for netting of certain exposures; thereby significantly reducing the actual loss that would be incurred should a counterparty fail to perform its contractual obligations; and (iv) set minimum credit standards that become more stringent as the duration of the derivative financial instrument increases. Based on these factors, we consider the risk of counterparty default to be minimal.
Designated Derivatives. We may choose to designate our derivative financial instruments, generally foreign currency contracts to hedge our net investment in foreign operations or generally interest rate contracts to hedge future interest payments on variable debt and anticipated fixed-rate debt issuances. At inception of the transaction, we formally designate and document the derivative financial instrument as a hedge of a specific underlying exposure, the risk management objective and the strategy for undertaking the hedge transaction. We formally assess both at inception and at least quarterly thereafter, the effectiveness of our hedging transactions. Due to the high degree of effectiveness between the hedging instruments and the underlying exposures hedged, fluctuations in the value of the derivative financial instruments will generally be offset by changes in the cash flows or fair values of the underlying exposures being hedged.
Changes in the fair value of derivatives that are designated and qualify as net investment hedges of our foreign operations or cash flow hedges are recorded in AOCI/L. For net investment hedges, these amounts offset the translation adjustments on the underlying net assets of our foreign investments and are recorded in AOCI/L. This includes debt issued in a currency that is not the same functional currency of the borrowing entity that we may designate as a nonderivative net investment hedge. We compare the net equity available from our foreign investments first to the derivative financial instruments designated as net investment hedges followed by any nonderivative net investment hedges. If the total notional amount of the derivative and nonderivative financial instruments exceeds the net equity available, that excess portion is considered unhedged and the translation of that excess portion is recognized in Foreign Currency, Derivative and Other Gains (Losses) and Other Income (Expense), Net.
For cash flow hedges, we hedge exposure to the variability of existing cash flows and future cash flows related to variable-rate debt and anticipated fixed-rate debt issuances, respectively, typically over a period of 10 years, with a range of 5 to 30 years. We report the effective portion of the gain or loss as a component of AOCI/L and reclassify it to the applicable line item in the Consolidated Statements of Income, generally Interest Expense, over the corresponding period of the underlying hedged item. The ineffective portion of the change in fair value of a derivative financial instrument is recognized in earnings, generally Interest Expense, at the time the ineffectiveness occurred. To the extent the hedged forecasted interest payments on debt related to our interest rate contracts are paid off, the remaining balance in AOCI/L is recognized in Interest Expense in the Consolidated Statements of Income.
Undesignated Derivatives. We also use derivatives, such as foreign currency forwards and option contracts, that are not designated as hedges to manage foreign currency exchange rate risk related to the translation of our results of operations. The changes in fair values of these derivatives that were not designated as hedging instruments are immediately recognized in earnings within Foreign Currency, Derivative and Other Gains (Losses) and Other Income (Expense), Net. These gains or losses are generally offset by lower or higher earnings due to the translation at exchange rates that were different than our expectations. In addition, we may choose to not designate
our interest rate contracts. If an interest rate contract is not designated as a hedge, the change in fair value of this contract is immediately recognized in earnings within Interest Expense in the Consolidated Statements of Income.
Noncontrolling Interests. Noncontrolling interests represent the share of consolidated entities owned by third parties. We recognize each noncontrolling holder’s respective share of the estimated fair value of the net assets at the date of formation or acquisition. Noncontrolling interests are subsequently adjusted for the noncontrolling holder’s share of additional contributions, distributions and their share of the net earnings or losses of each respective consolidated entity. We allocate net income to noncontrolling interests based on the weighted average ownership interest during the period. The net income that is not attributable to us is reflected in Net Earnings Attributable to Noncontrolling Interests. We do not recognize a gain or loss on ownership transactions with a consolidated entity that do not result in a change in control and recognize the difference between the carrying amount of the noncontrolling interest and the consideration paid or received as additional paid-in-capital.
Certain limited partnership interests, including OP units, are exchangeable into our common stock. Common stock issued upon exchange of a holder’s noncontrolling interest is accounted for at the carrying value of the surrendered limited partnership interest and the difference between the carrying value and the fair value of the common stock issued is recorded to additional paid-in-capital.
Revenue Recognition.
Rental Revenues and Recoveries. We lease our operating properties to customers under agreements that are generally classified as operating leases. We recognize the total minimum lease payments provided for under the leases on a straight-line basis over the lease term. Generally, under the terms of our leases, the majority of our rental expenses are recovered from our customers, including common area maintenance, real estate taxes and insurance. Rental expenses recovered through reimbursements received from customers are recognized in Rental Revenues in the Consolidated Statements of Income. We generally record amounts reimbursed by our customers (“rental recoveries”) as revenues in the period that the applicable expenses are incurred. We account for and present rental revenue and rental recoveries as a single component under Rental Revenues as the timing of recognition is the same, the pattern with which we transfer the right of use of the property and related services to the lessee are both on a straight-line basis and our leases qualify as operating leases. We perform credit analyses of our customers prior to the execution of our leases and continue these analyses for each individual lease on an ongoing basis in order to ensure the collectability of rental revenue. We recognize revenue to the extent that amounts are determined to be collectible.
Strategic Capital Revenues. Strategic capital revenues include revenues or fees we earn from the management services we provide to unconsolidated entities. These fees are determined in accordance with the terms specific to each arrangement and may include recurring fees such as asset management and property management fees and transactional fees for leasing, acquisition, development, construction, financing and tax services provided. We recognize these fees as we provide the services or on a cost basis for development fees.
We may also earn incentive returns (“promotes” or “promote revenues”) directly from third-party investors in the co-investment ventures based on the cumulative returns of the venture over a three-year period or the stabilization of individual development projects owned by the venture. The returns are determined by both the operating performance and real estate valuation of the venture, including highly variable inputs such as capitalization rates, market rents, interest rates and foreign currency exchange rates. As these key inputs are highly volatile and out of our control, and such volatility can materially impact our promotes period over period, we recognize promote revenues at the end of the performance period. We include the third-party investors’ share of promotes in Strategic Capital Revenues.
We also earn fees from ventures that we consolidate. Upon consolidation, these fees are eliminated from our earnings and the third-party investors’ share of these fees are recognized as a reduction of Net Earnings Attributable to Noncontrolling Interests.
Development Management and Other Revenues. Development management and other revenues principally include development and construction management fees from third parties and are recognized as we provide the services or on a cost basis.
Gains on Real Estate Transactions, Net. Throughout the Notes to the Consolidated Financial Statements, Gains on Real Estate Transactions, Net collectively refers to Gains on Dispositions of Development Properties and Land, Net and Gains on Other Dispositions of Investments in Real Estate, Net.
We recognize gains on the disposition of real estate when control transfers to the buyer, generally when consideration and title are exchanged and the risks and rewards of ownership transfer. We recognize losses from the disposition of real estate when known.
We recognize the entire gain attributed to contributions of real estate properties to unconsolidated entities. Prior to January 1, 2018, we recognized a gain only to the extent of third-party ownership and deferred the portion related to our ownership. Deferred gains recorded prior to adoption continue to be recognized: (i) over the useful lives of the contributed properties, aligning with the entities' recorded depreciation expense as if based on our lower carrying value; (ii) upon disposition to a third party; or (iii) if our ownership interest in an unconsolidated entity permanently decreases.
Gains on Dispositions of Development Properties and Land, Net. We present gains separately based on the type of real estate sold or contributed. We present gains on sales to third parties or contributions to our unconsolidated co-investment ventures as Gains on Dispositions of Development Properties and Land, Net when the property was included in our land portfolio or when we developed the property with the intent to sell or contribute.
Gains on Other Dispositions of Investments in Real Estate, Net. We present all other gains on sales to third parties or contributions to our unconsolidated entities of primarily operating properties and other real estate transactions as Gains on Other Dispositions of Investments in Real Estate, Net. We also include gains or losses on the remeasurement of equity investments to fair value upon acquisition of a controlling interest if the transaction is considered the acquisition of a business and gains or losses upon the partial redemption or sale of our investment in an unconsolidated entity.
Rental Expenses. Rental expenses principally include the cost of our property management and leasing personnel, utilities, repairs and maintenance, property insurance, real estate taxes and the other costs of managing our properties. We are also a lessee of land under leases which generally meet the criteria to be accounted for as operating leases.
Strategic Capital Expenses. Strategic capital expenses generally include the direct expenses associated with the asset management of the co-investment ventures provided by our employees who are assigned to our Strategic Capital Segment and the costs of our Prologis Promote Plan (“PPP”) based on earned promotes. For further discussion on the PPP, see Note 11. In addition, in order to achieve efficiencies and economies of scale, all of our property management and leasing functions are provided by property management and leasing personnel who are assigned to our Real Estate Segment. These individuals perform the property-level management and leasing of the properties in our owned and managed portfolio, which includes properties we consolidate and those we manage that are owned by the unconsolidated co-investment ventures. We allocate the costs of our property management and leasing teams to the properties we consolidate (included in Rental Expenses) and the properties owned by the unconsolidated co-investment ventures (included in Strategic Capital Expenses) by using the square feet owned by the respective portfolios.
Equity-Based Compensation. We account for equity-based compensation by measuring the cost of employee services received in exchange for an award of an equity instrument based on the fair value of the award on the grant date. We recognize the cost of the award on a straight-line basis over the period during which an employee is required to provide service in exchange for the award, generally the vesting period.
Income Taxes. Under the IRC, to qualify as a REIT, we are required to distribute at least 90% of our taxable income, and meet certain income, asset and stockholder tests. REITs which meet these certain income, asset and stockholder tests are generally not required to pay federal income taxes if they distribute 100% of their taxable income. If we fail to qualify as a REIT in any taxable year, we will be subject to federal income taxes at regular corporate rates and may not be able to qualify as a REIT for the four subsequent taxable years. Even as a REIT, we may be subject to certain foreign, state and local taxes on our own income and property, and to federal income and excise taxes on our undistributed taxable income.
We have elected taxable REIT subsidiary (“TRS”) status for some of our consolidated subsidiaries. This allows us to provide services that would otherwise be considered impermissible for REITs. Many of the foreign countries in which we have operations do not recognize REITs or do not accord REIT status under their respective tax laws to our entities that operate in their jurisdiction. In the U.S., the REIT and TRS entities are subject to taxes in certain states in which we operate. Accordingly, we recognize income tax expense for the: (i) federal and state income taxes incurred by our TRSs; (ii) taxes incurred by the REIT in certain states; (iii) taxes incurred in foreign jurisdictions; and (iv) unrecognized tax benefit liabilities, including related interest and penalties.
We evaluate tax positions taken in the Consolidated Financial Statements under the interpretation for accounting for uncertainty in income taxes. As a result of this evaluation, we may recognize a tax benefit from an uncertain tax position only if it is more likely than not that the tax position will be sustained on examination by taxing authorities.
We recognize deferred income taxes in certain taxable entities. For federal income tax purposes, certain acquisitions have been treated as tax-free transactions resulting in a carry-over tax basis in assets and liabilities. For financial reporting purposes and in accordance with purchase accounting, we record all of the acquired assets and assumed liabilities based on their relative fair value at date of acquisition, as discussed above. For our taxable subsidiaries, including certain international jurisdictions, we recognize the deferred income tax liabilities that represent the tax effect of the difference between the tax basis carried over and the relative fair value of the tangible and intangible assets at date of acquisition. Any subsequent increases or decreases to the deferred income tax liability recorded in connection with these acquisitions, are reflected in earnings.
If taxable income is generated in these subsidiaries, we recognize a benefit in earnings as a result of the reversal of the deferred income tax liability previously recorded at the acquisition date and we record current income tax expense representing the entire current income tax liability. If the reversal of the deferred income tax liability results from a sale or contribution of assets, the classification of the reversal to the Consolidated Statements of Income is based on the taxability of the transaction. If the sale or contribution is of the real estate asset and results in a taxable transaction, the reversal is recorded to deferred income tax benefit. If the sale or contribution is the disposition of the entity that owns the asset, the reversal is recorded through gains.
Deferred income tax expense is generally a function of the period’s temporary differences (items that are treated differently for tax purposes than for financial reporting purposes) and the utilization of tax net operating losses (“NOL”) generated in prior years that had been previously recognized as deferred income tax assets. We provide for a valuation allowance for deferred income tax assets if we believe all or some portion of the deferred income tax asset may not be realized. Any increase or decrease in the valuation allowance that results from a change in circumstances that causes a change in the estimated ability to realize the related deferred income tax asset is included in deferred tax expense.
Environmental Costs. We incur certain environmental remediation costs, including cleanup costs, consulting fees for environmental studies and investigations, monitoring costs, and legal costs relating to cleanup, litigation defense, and the pursuit of responsible third parties. We expense costs incurred in connection with operating properties and properties previously sold. We capitalize costs related to undeveloped land as development costs and record any expected future environmental liabilities at the time of acquisition. We maintain a liability for the estimated costs of environmental remediation expected to be incurred in connection with undeveloped land, acquired operating properties and properties previously sold that we adjust as appropriate as information becomes available.
Accounting Pronouncements.
New Accounting Standards Adopted
Income Taxes. In December 2023, the Financial Accounting Standards Board ("FASB") issued an Accounting Standard Update ("ASU") to enhance the transparency and decision usefulness of income tax disclosures on an annual basis. The ASU requires additional disclosures around income tax categories and further disaggregation of federal, state and foreign tax information and eliminates certain existing requirements. We adopted the standard as of the fiscal year ended December 31, 2025 and it did not have a material impact on our Consolidated Financial Statements.
New Accounting Standards Issued but not yet Adopted
Disaggregation of Income Statement Expenses. In November 2024, the FASB issued an ASU to enhance disclosures about certain expense types in commonly presented expense captions on the Consolidated Statements of Income. The ASU requires additional disclosures that disaggregate expense captions into specific components with qualitative descriptions. This standard is effective for the fiscal year ended December 31, 2027, and interim periods thereafter, on a prospective or retrospective basis. We do not expect the standard to have a material impact on our Consolidated Financial Statements as we anticipate the primary change will be additional disclosure.
Hedge Accounting Improvements. In December 2025, the FASB issued an ASU to clarify certain aspects of hedge accounting and address incremental hedge accounting issues arising from global reference rate reform. The ASU targets more closely aligning hedge accounting with the economics of an entity’s risk management activities and clarifies strategies in financial reporting that can be utilized to enable entities to achieve and maintain hedge accounting for highly effective economic hedges of forecasted transactions. This standard is effective for the interim period ended March 31, 2027, and interim and annual periods thereafter, on a prospective basis. We do not expect the standard to have a material impact on our Consolidated Financial Statements.
NOTE 3. REAL ESTATE
Investments in real estate properties consisted of the following at December 31 (dollars and square feet in thousands):
|
|
|
|
|
|
|
|
|
|
|
|
|
|
|
|
|
|
|
|
|
|
|
|
|
Square Feet |
|
|
Number of Buildings |
|
|
|
|
|
2025 |
|
|
2024 |
|
|
2025 |
|
|
2024 |
|
|
2025 |
|
|
2024 |
|
Operating properties: |
|
|
|
|
|
|
|
|
|
|
|
|
|
|
|
|
|
Buildings and improvements |
|
647,904 |
|
|
|
643,929 |
|
|
|
2,979 |
|
|
|
2,987 |
|
|
$ |
56,365,572 |
|
|
$ |
54,840,666 |
|
Improved land |
|
|
|
|
|
|
|
|
|
|
|
|
|
24,195,448 |
|
|
|
23,438,687 |
|
Development portfolio, including land costs: |
|
|
|
|
|
|
|
|
|
|
|
|
|
|
|
|
|
Prestabilized |
|
6,749 |
|
|
|
5,387 |
|
|
|
27 |
|
|
|
19 |
|
|
|
1,026,688 |
|
|
|
813,029 |
|
Properties under development |
|
17,297 |
|
|
|
18,306 |
|
|
|
50 |
|
|
|
66 |
|
|
|
1,992,321 |
|
|
|
2,016,584 |
|
Land (1) |
|
|
|
|
|
|
|
|
|
|
|
|
|
4,888,153 |
|
|
|
4,453,522 |
|
Other real estate investments (2) |
|
|
|
|
|
|
|
|
|
|
|
|
|
6,661,174 |
|
|
|
5,683,688 |
|
Total investments in real estate properties |
|
|
|
|
|
|
|
|
|
|
|
|
|
95,129,356 |
|
|
|
91,246,176 |
|
Less accumulated depreciation |
|
|
|
|
|
|
|
|
|
|
|
|
|
14,729,149 |
|
|
|
12,758,159 |
|
Net investments in real estate properties |
|
|
|
|
|
|
|
|
|
|
|
|
$ |
80,400,207 |
|
|
$ |
78,488,017 |
|
(1)At December 31, 2025, and 2024, our land was comprised of 8,815 and 8,708 acres, respectively.
(2)Included in other real estate investments were principally: (i) land parcels we own and lease to third parties; (ii) renewable energy assets, including solar, electric vehicle charging and energy storage; (iii) non-strategic real estate assets that we do not intend to operate long term; (iv) newly developed and stabilized data centers; and (v) non-industrial real estate assets that we intend to redevelop as industrial properties or data centers.
At December 31, 2025, we had investments in real estate assets in the U.S. and other Americas (Brazil, Canada and Mexico), Europe (Belgium, the Czech Republic, France, Germany, Hungary, Italy, the Netherlands, Poland, Slovakia, Spain, Sweden and the United Kingdom (“U.K.”)) and Asia (China, India, Japan and Singapore).
Acquisitions
The following table summarizes our real estate acquisition activity for the years ended December 31 (dollars and square feet in thousands):
|
|
|
|
|
|
|
|
|
|
|
|
|
|
|
2025 |
|
|
2024 (1) |
|
|
2023 (2) |
|
Number of operating properties |
|
|
23 |
|
|
|
54 |
|
|
|
85 |
|
Square feet |
|
|
5,416 |
|
|
|
11,047 |
|
|
|
17,503 |
|
Acres of land |
|
|
909 |
|
|
|
889 |
|
|
|
1,620 |
|
Acquisition cost of net investments in real estate, excluding other real estate
investments |
|
$ |
1,471,575 |
|
|
$ |
2,144,303 |
|
|
$ |
4,194,468 |
|
|
|
|
|
|
|
|
|
|
|
Acquisition cost of other real estate investments |
|
$ |
376,441 |
|
|
$ |
596,607 |
|
|
$ |
101,382 |
|
(1)In 2024, we acquired our partners' interest in an unconsolidated venture and began consolidating the properties, including 30 operating properties aggregating 6.0 million square feet. In addition, we entered a new market in India and acquired 225 acres of land.
(2)In 2023, we acquired a real estate portfolio comprised of 70 operating properties in the U.S., aggregating 13.8 million square feet, for cash consideration of $3.1 billion.
Dispositions
The following table summarizes our dispositions of net investments in real estate which include contributions to unconsolidated co-investment ventures and dispositions to third parties for the years ended December 31 (dollars and square feet in thousands):
|
|
|
|
|
|
|
|
|
|
|
|
|
2025 |
|
|
2024 |
|
|
2023 |
|
Dispositions of development properties and land, net (1) |
|
|
|
|
|
|
|
|
Number of properties |
|
19 |
|
|
|
29 |
|
|
|
22 |
|
Square feet |
|
4,295 |
|
|
|
8,243 |
|
|
|
8,437 |
|
Net proceeds |
$ |
1,147,205 |
|
|
$ |
1,479,217 |
|
|
$ |
1,449,644 |
|
Gains on dispositions of development properties and land, net |
$ |
257,731 |
|
|
$ |
413,743 |
|
|
$ |
462,270 |
|
|
|
|
|
|
|
|
|
|
Other dispositions of investments in real estate, net (2) |
|
|
|
|
|
|
|
|
Number of properties |
|
56 |
|
|
|
104 |
|
|
|
25 |
|
Square feet |
|
8,606 |
|
|
|
22,799 |
|
|
|
2,794 |
|
Net proceeds |
$ |
1,538,560 |
|
|
$ |
3,326,124 |
|
|
$ |
641,214 |
|
Gains on other dispositions of investments in real estate, net |
$ |
685,831 |
|
|
$ |
904,136 |
|
|
$ |
161,039 |
|
(1)The gains we recognize in Gains on Dispositions of Development Properties and Land, Net in the Consolidated Statements of Income are principally driven by the contribution of newly developed properties to our unconsolidated co-investment ventures and occasionally sales to a third party.
(2)In 2024, we had a significant contribution of operating properties to our unconsolidated co-investment venture in the U.S.
Leases
As a Lessor
We lease our real estate properties to customers under agreements that are classified primarily as operating leases. We recognize the total minimum lease payments provided for under the leases on a straight-line basis over the lease term. Our weighted average lease term remaining was 50 months based on square feet for all leases in effect at December 31, 2025.
The following table summarizes the minimum lease payments due from our customers on leases for space in our operating properties, prestabilized and under development properties, other real estate investments and assets held for sale or contribution at December 31, 2025 (in thousands):
|
|
|
|
|
2026 |
|
$ |
5,771,407 |
|
2027 |
|
|
5,360,891 |
|
2028 |
|
|
4,590,099 |
|
2029 |
|
|
3,769,097 |
|
2030 |
|
|
3,005,533 |
|
Thereafter |
|
|
11,498,060 |
|
Total |
|
$ |
33,995,087 |
|
These amounts do not reflect future rental revenue from the renewal or replacement of existing leases and exclude reimbursements of rental expenses. These amounts also exclude rental increases that are not fixed.
As a Lessee
We had approximately 190 leases, principally land and office space leases, in which we were the lessee at both December 31, 2025 and 2024, which primarily qualify as operating leases with remaining lease terms of 1 to 78 years at December 31, 2025. Our lease liabilities were $643.5 million and $615.3 million at December 31, 2025, and 2024, respectively.
The following table summarizes the fixed, future minimum rental payments, excluding variable costs, for leases that had commenced at December 31, 2025, with amounts discounted at lease commencement by our incremental borrowing rates to calculate the lease liabilities of our leases (in thousands):
|
|
|
|
|
2026 |
|
$ |
68,479 |
|
2027 |
|
|
63,857 |
|
2028 |
|
|
61,360 |
|
2029 |
|
|
56,550 |
|
2030 |
|
|
43,698 |
|
Thereafter |
|
|
1,231,533 |
|
Total undiscounted rental payments |
|
|
1,525,477 |
|
Less imputed interest |
|
|
882,016 |
|
Total lease liabilities |
|
$ |
643,461 |
|
The weighted average remaining lease term for these leases was 31 years and 32 years at December 31, 2025, and 2024, respectively. We do not include renewal options in the lease term for calculating the lease liability unless we are reasonably certain we will exercise the option or the lessor has the sole ability to exercise the option. We assigned a collateralized interest rate to each lease based on the term of the lease and the currency in which the lease was denominated. The weighted average discount rate was 3.9% at both December 31, 2025 and 2024.
NOTE 4. UNCONSOLIDATED ENTITIES
Summary of Investments
We have investments in entities through a variety of ventures. We co-invest in entities that own multiple properties with partners and investors and we provide asset management and property management services to these entities, which we refer to as co-investment ventures. These entities may be consolidated or unconsolidated depending on the structure, our partner’s participation and other rights and our level of control of the entity. This note details our investments in unconsolidated co-investment ventures, which are related parties and accounted for using the equity method of accounting. See Note 10 for more detail regarding our consolidated investments that are not wholly owned.
We also have investments in other ventures, generally with one partner, which we primarily account for using the equity method. We refer to our investments in both unconsolidated co-investment ventures and other ventures, collectively, as unconsolidated entities.
The following table summarizes our investments in and advances to unconsolidated entities at December 31 (in thousands):
|
|
|
|
|
|
|
|
|
|
|
2025 |
|
|
2024 |
|
Unconsolidated co-investment ventures |
|
$ |
10,263,233 |
|
|
$ |
9,274,762 |
|
Other ventures |
|
|
830,703 |
|
|
|
804,686 |
|
Total |
|
$ |
11,093,936 |
|
|
$ |
10,079,448 |
|
Unconsolidated Co-Investment Ventures
The following table summarizes our investments in the individual co-investment ventures at December 31 (dollars in thousands):
|
|
|
|
|
|
|
|
|
|
|
|
|
|
|
Ownership
Percentage |
|
Investment in
and Advances to |
|
Co-Investment Venture |
|
2025 |
|
2024 |
|
2025 |
|
|
2024 |
|
Prologis Targeted U.S. Logistics Fund, L.P. (“USLF”) |
|
31.9% |
|
30.5% |
|
$ |
3,282,742 |
|
|
$ |
3,022,568 |
|
FIBRA Prologis (1) |
|
34.6% |
|
34.6% |
|
|
982,538 |
|
|
|
1,009,357 |
|
Prologis Brazil Logistics Venture (“PBLV”) and other joint ventures (2) |
|
20.0% |
|
20.0% |
|
|
198,516 |
|
|
|
158,676 |
|
Prologis European Logistics Fund (“PELF”) |
|
26.4% |
|
26.3% |
|
|
2,484,995 |
|
|
|
2,196,180 |
|
Prologis European Logistics Partners (“PELP”) (2) |
|
50.0% |
|
50.0% |
|
|
2,525,562 |
|
|
|
2,174,590 |
|
Nippon Prologis REIT, Inc. (“NPR”) (3) (4) |
|
15.3% |
|
15.1% |
|
|
540,408 |
|
|
|
523,204 |
|
Prologis Japan Core Logistics Fund ("PJLF") (4) |
|
16.3% |
|
16.3% |
|
|
50,262 |
|
|
|
45,976 |
|
Prologis China Core Logistics Fund, LP (“PCCLF”) |
|
15.5% |
|
15.5% |
|
|
56,978 |
|
|
|
89,551 |
|
China AMC Prologis Logistics REIT ("Prologis C-REIT") (5) |
|
20.7% |
|
- |
|
|
72,314 |
|
|
|
- |
|
Prologis China Logistics Venture I, LP, II, LP and III, LP
(“Prologis China Logistics Venture”) (2) |
|
15.0% |
|
15.0% |
|
|
68,918 |
|
|
|
54,660 |
|
Total |
|
|
|
|
|
$ |
10,263,233 |
|
|
$ |
9,274,762 |
|
(1)At December 31, 2025, we owned 567.4 million units of FIBRA Prologis that had a closing price of Ps 75.44 ($4.20) per unit on the Mexican Stock Exchange. We have granted FIBRA Prologis a right of first refusal with respect to stabilized properties that we plan to sell in Mexico.
(2)We have one partner in each of these co-investment ventures.
(3)At December 31, 2025, we owned 1.3 million units of NPR that had a closing price of ¥92,900.00 ($592.96) per share on the Tokyo Stock Exchange. For any properties we develop and plan to sell in Japan, we have committed to offer those properties to NPR if we determine the properties meet NPR’s investment objectives.
(4)At December 31, 2025, and 2024, we had receivables from NPR and PJLF of $152.7 million and $146.1 million, respectively, related to customer security deposits that originated through a leasing company owned by us that pertain to properties we owned previously and contributed to NPR and PJLF. We have a corresponding payable to NPR’s and PJLF's customers in Other Liabilities. These amounts are repaid to us as the leases turn over.
(5)In December 2025, we listed China AMC Logistics REIT ("Prologis C-REIT") on the Shenzhen Stock Exchange. The Prologis C-REIT purchased properties from our open-ended venture in China. At December 31, 2025, we owned 83.0 million units of Prologis C-REIT that had a closing price of CN¥5.78 ($0.82) per share on the Shenzhen Stock Exchange.
The amounts recognized in Strategic Capital Revenues and Earnings from Unconsolidated Entities, Net depend on the size, real estate valuations, operations and transactions of the unconsolidated co-investment ventures, the timing of revenues earned through promotes and transactional fees, as well as fluctuations in foreign currency exchange rates and our ownership interest. We recognized Strategic Capital Expenses for direct costs associated with the asset management of these ventures, allocated property-level management and leasing costs for the properties owned by the ventures and compensation expenses under the PPP. For additional discussion on the PPP, see Note 11.
The following table summarizes the Strategic Capital Revenues we recognized in the Consolidated Statements of Income related to our unconsolidated co-investment ventures for the years ended December 31 (in thousands):
|
|
|
|
|
|
|
|
|
|
|
|
|
|
|
2025 |
|
|
2024 |
|
|
2023 |
|
Recurring fees |
|
$ |
515,595 |
|
|
$ |
464,292 |
|
|
$ |
450,682 |
|
Transactional fees |
|
|
66,360 |
|
|
|
58,511 |
|
|
|
60,467 |
|
Promote revenue (1) |
|
|
2,105 |
|
|
|
139,329 |
|
|
|
674,629 |
|
Total strategic capital revenues from unconsolidated co-investment ventures (2) |
|
$ |
584,060 |
|
|
$ |
662,132 |
|
|
$ |
1,185,778 |
|
(1)Includes promote revenue earned from unconsolidated co-investment ventures in the U.S. in 2024 and 2023.
(2)These amounts exclude strategic capital revenues from other ventures.
The following table summarizes the key property information, financial position and operating information of our unconsolidated co-investment ventures on a U.S. GAAP basis (not our proportionate share) and the amounts we recognized in the Consolidated Financial Statements related to these ventures at and for the years ended December 31 (dollars and square feet in millions):
|
|
|
|
|
|
|
|
|
|
|
|
|
|
|
|
|
|
|
|
|
|
|
|
|
|
|
|
|
|
|
|
|
|
|
|
|
|
|
|
|
U.S. |
Other Americas (1) |
Europe |
Asia |
Total |
|
At: |
2025 |
|
|
2024 |
|
|
2025 |
|
|
2024 |
|
|
2025 |
|
|
2024 |
|
|
2025 |
|
|
2024 |
|
|
2025 |
|
|
2024 |
|
Key property information: |
|
|
|
|
|
|
|
|
|
|
|
|
|
|
|
|
|
|
|
|
|
|
|
|
|
|
|
|
|
Ventures |
|
1 |
|
|
|
1 |
|
|
|
2 |
|
|
|
2 |
|
|
|
2 |
|
|
|
2 |
|
|
|
5 |
|
|
|
4 |
|
|
|
10 |
|
|
|
9 |
|
Operating properties |
|
784 |
|
|
|
767 |
|
|
|
393 |
|
|
|
391 |
|
|
|
1,058 |
|
|
|
1,037 |
|
|
|
245 |
|
|
|
241 |
|
|
|
2,480 |
|
|
|
2,436 |
|
Square feet |
|
139 |
|
|
|
134 |
|
|
|
86 |
|
|
|
85 |
|
|
|
238 |
|
|
|
232 |
|
|
|
101 |
|
|
|
100 |
|
|
|
564 |
|
|
|
551 |
|
|
|
|
|
|
|
|
|
|
|
|
|
|
|
|
|
|
|
|
|
|
|
|
|
|
|
|
|
|
|
Financial position: |
|
|
|
|
|
|
|
|
|
|
|
|
|
|
|
|
|
|
|
|
|
|
|
|
|
|
|
|
|
Total assets ($) |
|
14,711 |
|
|
|
13,903 |
|
|
|
7,308 |
|
|
|
7,112 |
|
|
|
26,764 |
|
|
|
23,873 |
|
|
|
9,470 |
|
|
|
9,404 |
|
|
|
58,253 |
|
|
|
54,292 |
|
Third-party debt ($) |
|
6,386 |
|
|
|
5,399 |
|
|
|
2,429 |
|
|
|
2,242 |
|
|
|
7,101 |
|
|
|
6,343 |
|
|
|
3,758 |
|
|
|
3,942 |
|
|
|
19,674 |
|
|
|
17,926 |
|
Total liabilities ($) |
|
7,383 |
|
|
|
6,466 |
|
|
|
2,753 |
|
|
|
2,422 |
|
|
|
9,310 |
|
|
|
8,375 |
|
|
|
4,192 |
|
|
|
4,362 |
|
|
|
23,638 |
|
|
|
21,625 |
|
|
|
|
|
|
|
|
|
|
|
|
|
|
|
|
|
|
|
|
|
|
|
|
|
|
|
|
|
|
|
Our investment balance ($) (2) |
|
3,283 |
|
|
|
3,023 |
|
|
|
1,181 |
|
|
|
1,168 |
|
|
|
5,010 |
|
|
|
4,371 |
|
|
|
789 |
|
|
|
713 |
|
|
|
10,263 |
|
|
|
9,275 |
|
Our weighted average ownership (4) |
|
31.9 |
% |
|
|
30.5 |
% |
|
|
32.3 |
% |
|
|
30.9 |
% |
|
|
33.1 |
% |
|
|
33.0 |
% |
|
|
15.6 |
% |
|
|
15.2 |
% |
|
|
29.9 |
% |
|
|
29.0 |
% |
|
|
|
|
|
|
|
|
|
|
|
|
|
|
|
|
|
|
|
|
|
|
|
|
|
|
|
|
|
|
|
|
|
|
|
|
|
|
|
|
|
|
|
|
|
|
|
|
|
|
|
|
|
|
|
|
|
|
|
|
|
U.S. |
|
|
Other Americas (1) |
|
|
Europe |
|
|
Asia |
|
|
Total |
|
Operating Information: |
2025 |
|
|
2024 |
|
|
2023 |
|
|
2025 |
|
|
2024 |
|
|
2023 |
|
|
2025 |
|
|
2024 |
|
|
2023 |
|
|
2025 |
|
|
2024 |
|
|
2023 |
|
|
2025 |
|
|
2024 |
|
|
2023 |
|
For the years ended: |
|
|
|
|
|
|
|
|
|
|
|
|
|
|
|
|
|
|
|
|
|
|
|
|
|
|
|
|
|
|
|
|
|
|
|
|
|
|
|
|
|
|
|
|
Total revenues ($) |
|
1,646 |
|
|
|
1,452 |
|
|
|
1,315 |
|
|
|
831 |
|
|
|
525 |
|
|
|
427 |
|
|
|
2,051 |
|
|
|
1,817 |
|
|
|
1,695 |
|
|
|
650 |
|
|
|
638 |
|
|
|
654 |
|
|
|
5,178 |
|
|
|
4,432 |
|
|
|
4,091 |
|
Net earnings ($) (3) |
|
435 |
|
|
|
665 |
|
|
|
344 |
|
|
|
240 |
|
|
|
217 |
|
|
|
191 |
|
|
|
427 |
|
|
|
352 |
|
|
|
341 |
|
|
|
146 |
|
|
|
(355 |
) |
|
|
74 |
|
|
|
1,248 |
|
|
|
879 |
|
|
|
950 |
|
|
|
|
|
|
|
|
|
|
|
|
|
|
|
|
|
|
|
|
|
|
|
|
|
|
|
|
|
|
|
|
|
|
|
|
|
|
|
|
|
|
|
|
|
|
Our earnings from
unconsolidated
co-investment
ventures, net ($) (3) |
|
138 |
|
|
|
201 |
|
|
|
95 |
|
|
|
73 |
|
|
|
68 |
|
|
|
67 |
|
|
|
147 |
|
|
|
125 |
|
|
|
112 |
|
|
|
25 |
|
|
|
(57 |
) |
|
|
13 |
|
|
|
383 |
|
|
|
337 |
|
|
|
287 |
|
(1)PBLV and our other Brazilian joint ventures are combined as one venture for the purpose of this table.
(2)Prologis’ investment balance is presented at our adjusted basis. The difference between our ownership interest of a venture’s equity and our investment balance at December 31, 2025, and 2024, results principally from four types of transactions: (i) deferred gains from the contribution of property to a venture prior to January 1, 2018 ($505.5 million and $520.0 million, respectively); (ii) recording additional costs associated with our investment in the venture ($88.2 million and $80.2 million, respectively); (iii) receivables, principally for fees and promotes ($188.4 million and $186.2 million, respectively); and (iv) customer security deposits retained subsequent to property contributions to NPR and PJLF, as discussed above.
(3)In 2024, we recognized an impairment charge against our investment balance in Prologis China Logistics Venture.
(4)Represents our weighted average ownership interest in all unconsolidated co-investment ventures based on each entity’s contribution of total assets before depreciation, net of other liabilities.
Equity Commitments Related to Certain Unconsolidated Co-Investment Ventures
Certain unconsolidated co-investment ventures have equity commitments from us and our venture partners. Our venture partners fulfill their equity commitment with cash. We may fulfill our equity commitment through contributions of properties or cash. The commitments are generally used for the acquisition or development of properties but may be used for the repayment of debt or other general uses. The venture may obtain financing for the acquisition of properties and therefore the acquisition price of additional investments that the venture could make may be more than the equity commitment. Depending on market conditions, the investment objectives of the ventures, our liquidity needs and other factors, we may make additional contributions of properties or additional cash investments in these ventures.
At December 31, 2025, our outstanding equity commitments were $160.2 million, principally for Prologis Japan Core Logistics Fund and Prologis China Logistics Venture. The equity commitments expire from 2027 to 2033 if they have not been previously called.
NOTE 5. ASSETS HELD FOR SALE OR CONTRIBUTION
We had investments in certain real estate properties that met the criteria to be classified as held for sale or contribution at December 31, 2025, and 2024. At the time of classification, these properties were expected to be sold to third parties or were recently stabilized and expected to be contributed to unconsolidated co-investment ventures within twelve months. The amounts included in Assets Held for Sale or Contribution in the Consolidated Balance Sheets represented real estate investment balances and the related assets and liabilities.
Assets held for sale or contribution consisted of the following at December 31 (dollars and square feet in thousands):
|
|
|
|
|
|
|
|
|
|
|
2025 |
|
|
2024 |
|
Number of operating properties |
|
|
10 |
|
|
|
8 |
|
Square feet |
|
|
1,914 |
|
|
|
2,229 |
|
Total assets held for sale or contribution |
|
$ |
203,344 |
|
|
$ |
248,511 |
|
Total liabilities associated with assets held for sale or contribution – included in Other Liabilities |
|
$ |
689 |
|
|
$ |
1,951 |
|
NOTE 6. OTHER ASSETS AND OTHER LIABILITIES
The following table summarizes our other assets and liabilities, net of amortization and depreciation, if applicable, at December 31 (in thousands):
|
|
|
|
|
|
|
|
|
|
|
2025 |
|
|
2024 |
|
Rent leveling |
|
$ |
1,620,362 |
|
|
$ |
1,218,483 |
|
Leasing commissions, net of $1.3 billion and $1.1 billion of accumulated amortization |
|
|
957,029 |
|
|
|
860,556 |
|
Lease right-of-use assets (1) |
|
|
671,663 |
|
|
|
707,814 |
|
Accounts receivable |
|
|
601,344 |
|
|
|
407,464 |
|
Acquired lease intangibles, net of $1.8 billion and $1.6 billion of accumulated amortization |
|
|
588,427 |
|
|
|
764,546 |
|
Prepaid assets |
|
|
248,411 |
|
|
|
231,299 |
|
Fixed assets |
|
|
221,704 |
|
|
|
212,318 |
|
Value added taxes receivable |
|
|
179,911 |
|
|
|
142,420 |
|
Derivative assets |
|
|
80,769 |
|
|
|
137,429 |
|
Other notes receivable |
|
|
57,244 |
|
|
|
74,594 |
|
Deferred income taxes |
|
|
7,686 |
|
|
|
3,257 |
|
Management contracts |
|
|
7,200 |
|
|
|
10,666 |
|
Other |
|
|
639,372 |
|
|
|
423,496 |
|
Total other assets |
|
$ |
5,881,122 |
|
|
$ |
5,194,342 |
|
|
|
|
|
|
|
|
Acquired lease intangibles, net of $1.5 billion and $1.1 billion of accumulated amortization |
|
$ |
1,437,612 |
|
|
$ |
1,778,832 |
|
Lease liabilities (1) |
|
|
643,461 |
|
|
|
615,305 |
|
Tenant security deposits |
|
|
429,939 |
|
|
|
403,707 |
|
Unearned rents |
|
|
417,796 |
|
|
|
400,538 |
|
Environmental liabilities |
|
|
207,972 |
|
|
|
176,154 |
|
Deferred income taxes |
|
|
156,024 |
|
|
|
141,126 |
|
Deferred revenue and fees |
|
|
82,325 |
|
|
|
74,754 |
|
Derivative liabilities |
|
|
40,488 |
|
|
|
638 |
|
Value added taxes payable |
|
|
15,897 |
|
|
|
29,636 |
|
Liabilities associated with assets held for sale or contribution |
|
|
689 |
|
|
|
1,951 |
|
Other |
|
|
537,327 |
|
|
|
440,908 |
|
Total other liabilities |
|
$ |
3,969,530 |
|
|
$ |
4,063,549 |
|
(1)For the amortization of the future minimum rental payments into rental expense and G&A expense on our land and office leases, respectively, refer to Note 3.
The following table summarizes the expected future amortization of leasing commissions and forgone rent (included in acquired lease intangibles above) into amortization expense and above and below market leases (included in acquired lease intangibles above) and rent leveling net assets into rental revenues, all based on the balances at December 31, 2025 (in thousands):
|
|
|
|
|
|
|
|
|
|
|
Amortization Expense |
|
|
Net Increase (Decrease)
to Rental Revenues |
|
2026 |
|
$ |
348,791 |
|
|
$ |
398,221 |
|
2027 |
|
|
286,021 |
|
|
|
133,410 |
|
2028 |
|
|
225,976 |
|
|
|
6,889 |
|
2029 |
|
|
174,031 |
|
|
|
(56,950 |
) |
2030 |
|
|
130,095 |
|
|
|
(75,080 |
) |
Thereafter |
|
|
330,596 |
|
|
|
(639,186 |
) |
Total |
|
$ |
1,495,510 |
|
|
$ |
(232,696 |
) |
NOTE 7. DEBT
All debt is incurred by the OP or its consolidated subsidiaries. The following table summarizes our debt at December 31 (dollars in thousands):
|
|
|
|
|
|
|
|
|
|
|
|
|
|
|
|
|
|
|
|
|
|
|
|
|
2025 |
|
|
2024 |
|
|
|
Weighted Average |
|
Amount |
|
|
Weighted Average |
|
Amount |
|
|
|
Interest Rate (1) |
|
Term (Years) (2) |
|
Outstanding (3) |
|
|
Interest Rate (1) |
|
Term (Years) (2) |
|
Outstanding (3) |
|
Credit facilities and
commercial paper |
|
0.9% |
|
|
1.6 |
|
|
|
$ |
44,679 |
|
|
4.1% |
|
|
1.8 |
|
|
|
$ |
224,966 |
|
Senior notes (4) |
|
3.2% |
|
|
8.8 |
|
|
|
|
32,887,971 |
|
|
3.2% |
|
|
9.8 |
|
|
|
|
28,322,163 |
|
Term loans and
unsecured other |
|
1.9% |
|
|
3.9 |
|
|
|
|
1,908,723 |
|
|
2.0% |
|
|
4.4 |
|
|
|
|
2,013,317 |
|
Secured mortgage (5) |
|
4.5% |
|
|
3.7 |
|
|
|
|
195,700 |
|
|
4.3% |
|
|
3.2 |
|
|
|
|
318,817 |
|
Total |
|
3.2% |
|
|
8.5 |
|
|
|
$ |
35,037,073 |
|
|
3.1% |
|
|
9.4 |
|
|
|
$ |
30,879,263 |
|
(1)The weighted average interest rates presented represent the effective interest rates (including amortization of debt issuance costs and noncash premiums or discounts) at the end of the period for the debt outstanding and include the impact of designated interest rate contracts, which effectively fix the interest rate on certain variable rate debt.
(2)The weighted average term represents the remaining maturity in years, based on debt agreements in place, at period end.
(3)We borrow in the functional currencies of the countries where we invest. Included in the outstanding balances at December 31 were borrowings denominated in the following currencies:
|
|
|
|
|
|
|
|
|
|
|
|
|
|
|
|
|
|
|
|
|
|
|
|
|
2025 |
|
|
2024 |
|
|
|
|
Weighted Average Interest Rate |
|
Amount Outstanding |
|
|
% of Total |
|
|
Weighted Average Interest Rate |
|
Amount Outstanding |
|
|
% of Total |
|
|
British pound sterling |
|
3.0% |
|
$ |
1,843,931 |
|
|
|
5.3 |
% |
|
3.1% |
|
$ |
1,714,653 |
|
|
|
5.6 |
% |
|
Canadian dollar |
|
4.4% |
|
|
2,004,638 |
|
|
|
5.7 |
% |
|
4.7% |
|
|
1,262,508 |
|
|
|
4.1 |
% |
|
Euro |
|
2.2% |
|
|
12,302,104 |
|
|
|
35.1 |
% |
|
2.1% |
|
|
9,900,602 |
|
|
|
32.1 |
% |
|
Japanese yen |
|
1.2% |
|
|
2,930,594 |
|
|
|
8.4 |
% |
|
1.1% |
|
|
2,910,755 |
|
|
|
9.4 |
% |
|
U.S. dollar |
|
4.1% |
|
|
15,385,826 |
|
|
|
43.9 |
% |
|
4.1% |
|
|
14,457,872 |
|
|
|
46.8 |
% |
|
Other |
|
3.8% |
|
|
569,980 |
|
|
|
1.6 |
% |
|
3.6% |
|
|
632,873 |
|
|
|
2.0 |
% |
|
Total |
|
3.2% |
|
$ |
35,037,073 |
|
|
|
100.0 |
% |
|
3.1% |
|
$ |
30,879,263 |
|
|
|
100.0 |
% |
(4)Senior notes are due from June 2026 to June 2061 with effective interest rates ranging from 0.3% to 5.7% at December 31, 2025.
(5)Secured mortgage debt is due from February 2026 to September 2033 with effective interest rates ranging from 3.3% to 6.7% at December 31, 2025. The debt was principally secured by 14 operating properties and 1 land parcel with an aggregate undepreciated cost of $477.1 million at December 31, 2025.
Credit Facilities
In May 2025, we amended and restated one of our global senior credit facilities (the "2022 Global Facility") as the 2025 Global Facility. Each of the global senior credit facilities, the 2023 Global Facility and the 2025 Global Facility, have a borrowing capacity of $3.0 billion (subject to currency fluctuations). We may draw on both facilities in British pounds sterling, Canadian dollars, euro, Japanese yen, Mexican pesos and U.S. dollars on a revolving basis. The 2023 Global Facility is scheduled to mature in June 2027 and the 2025
Global Facility in June 2029; however, we can extend the maturity date for each facility by six months on two occasions, subject to the payment of extension fees. We also have the ability to increase each credit facility to $4.0 billion, subject to currency fluctuations and obtaining additional lender commitments.
We also have a Japanese yen revolver (the "Yen Credit Facility") with a borrowing capacity of ¥58.5 billion ($373.4 million at December 31, 2025). We have the ability to increase the borrowing capacity of the Yen Credit Facility to ¥75.0 billion ($478.7 million at December 31, 2025), subject to obtaining additional lender commitments. The Yen Credit Facility is scheduled to mature in August 2027; however, we may extend the maturity date for one year, subject to the payment of extension fees.
We refer to the 2023 Global Facility, the 2025 Global Facility and the Yen Credit Facility, collectively, as our “Credit Facilities.” Pricing for the Credit Facilities, including the spread over the applicable benchmark and the rates applicable to facility fees and letter of credit fees, varies based on the public debt ratings of the OP.
Our Credit Facilities are utilized to support our cash needs for general corporate purposes on a short-term basis. The maturities of the borrowings under the Credit Facilities generally range from overnight to three months.
The following table summarizes information about our Credit Facility activity and available liquidity (dollars in millions):
|
|
|
|
|
|
|
|
|
|
|
|
|
|
|
2025 |
|
|
2024 |
|
|
2023 |
|
Credit Facility activity for the years ended December 31: |
|
|
|
|
|
|
|
|
|
Weighted average daily interest rate |
|
|
6.8 |
% |
|
|
4.4 |
% |
|
|
4.3 |
% |
Weighted average daily borrowings |
|
$ |
263 |
|
|
$ |
519 |
|
|
$ |
411 |
|
Maximum borrowings outstanding at any month-end |
|
$ |
532 |
|
|
$ |
1,031 |
|
|
$ |
1,587 |
|
|
|
|
|
|
|
|
|
|
|
Available liquidity at December 31: |
|
|
|
|
|
|
|
|
|
Aggregate lender commitments |
|
|
|
|
|
|
|
|
|
Credit Facilities |
|
$ |
6,503 |
|
|
$ |
6,313 |
|
|
$ |
6,477 |
|
Less: |
|
|
|
|
|
|
|
|
|
Credit facility borrowings outstanding |
|
|
45 |
|
|
|
225 |
|
|
|
979 |
|
Commercial paper borrowings outstanding (1) |
|
|
- |
|
|
|
- |
|
|
|
- |
|
Outstanding letters of credit |
|
|
27 |
|
|
|
25 |
|
|
|
24 |
|
Current availability |
|
$ |
6,431 |
|
|
$ |
6,063 |
|
|
$ |
5,474 |
|
Cash and cash equivalents |
|
|
1,146 |
|
|
|
1,319 |
|
|
|
530 |
|
Total liquidity |
|
$ |
7,577 |
|
|
$ |
7,382 |
|
|
$ |
6,004 |
|
(1)We are required to maintain available commitments under our Credit Facilities in an amount at least equal to the commercial paper borrowings outstanding.
Commercial Paper
We have commercial paper programs under which we may issue, repay and re-issue short-term unsecured commercial paper notes. Under our existing U.S. dollar-denominated program, the aggregate principal amount of notes outstanding at any time cannot exceed $1.0 billion. In June 2025, we established an additional multicurrency program under which we may issue notes denominated in British pound sterling, euros or U.S. dollars. The aggregate principal amount of notes outstanding under this program cannot exceed €1.0 billion (or its equivalent in other currencies) ($1.2 billion at December 31, 2025). The net proceeds from both programs are expected to be used for general corporate purposes. The maturities of the notes generally range from overnight to three months. Under customary terms in the commercial paper market, the notes are issued either at a discount to par or at par with fixed or floating interest rates. At any point in time, we are required to maintain available commitments under our Credit Facilities in an amount at least equal to the amount of notes outstanding under both programs.
Senior Notes
The senior notes are unsecured and our obligations are effectively subordinated in certain respects to any of our debt that is secured by a lien on real property, to the extent of the value of such real property. The senior notes require interest payments be made quarterly, semi-annually or annually. The majority of the senior notes are redeemable at any time at our option, subject to certain prepayment penalties. Such repurchase and other terms are governed by the provisions of indenture agreements, various note purchase agreements or trust deeds. The following table summarizes the issuances of senior notes during 2025 (principal in thousands):
|
|
|
|
|
|
|
|
|
|
|
|
|
|
|
|
|
|
|
|
|
Aggregate Principal |
|
|
Issuance Date Weighted Average |
|
|
Issuance Date |
|
Borrowing Currency |
|
|
USD (1) |
|
|
Interest Rate |
|
Term (Years) |
|
Maturity Dates |
February |
|
C$ |
|
750,000 |
|
|
$ |
520,428 |
|
|
4.2% |
|
|
8.0 |
|
|
|
February 2033 |
May |
|
$ |
|
1,250,000 |
|
|
$ |
1,250,000 |
|
|
5.1% |
|
|
8.3 |
|
|
|
January 2031 – May 2035 |
September |
|
€ |
|
1,000,000 |
|
|
$ |
1,178,100 |
|
|
3.6% |
|
|
9.5 |
|
|
|
September 2032 – 2037 |
October |
|
C$ |
|
700,000 |
|
|
$ |
500,614 |
|
|
3.6% |
|
|
6.3 |
|
|
|
February 2032 |
Total |
|
|
|
|
|
$ |
3,449,142 |
|
|
4.2% |
|
|
8.4 |
|
|
|
|
(1)The exchange rate used to calculate into U.S. dollars was the spot rate at the settlement date.
Term Loans
The following table summarizes our outstanding term loans at December 31 (dollars and borrowing currency in thousands):
|
|
|
|
|
|
|
|
|
|
|
|
|
|
|
|
|
|
|
|
|
|
|
Term Loan |
Borrowing Currency |
|
Issuance Date |
|
Lender Commitment at 2025 |
|
|
Amount Outstanding at 2025 |
|
|
Amount Outstanding at 2024 |
|
|
Interest Rate |
|
Maturity Date |
|
|
|
|
|
Borrowing Currency |
|
USD |
|
|
USD |
|
|
USD |
|
|
|
|
|
March 2017 Yen
Term Loan (1) |
JPY |
|
March 2017 |
¥ |
|
12,000,000 |
|
$ |
76,593 |
|
|
$ |
76,593 |
|
|
$ |
76,455 |
|
|
0.9% and 1.0% |
|
March 2027 – 2028 |
October 2017 Yen
Term Loan |
JPY |
|
October 2017 |
¥ |
|
10,000,000 |
|
$ |
63,827 |
|
|
|
63,827 |
|
|
|
63,713 |
|
|
0.9% |
|
October 2032 |
December 2018 Yen
Term Loan (1) |
JPY |
|
December 2018 |
¥ |
|
20,000,000 |
|
$ |
127,654 |
|
|
|
127,654 |
|
|
|
127,426 |
|
|
1.2% and TIBOR + 0.7% |
|
December 2031 – June 2033 |
January 2019 Yen
Term Loan (1) |
JPY |
|
January 2019 |
¥ |
|
15,000,000 |
|
$ |
95,741 |
|
|
|
95,741 |
|
|
|
95,569 |
|
|
TIBOR + 0.5% to 0.6% |
|
January 2028 – 2030 |
March 2019 Yen
Term Loan |
JPY |
|
March 2019 |
¥ |
|
85,000,000 |
|
$ |
542,534 |
|
|
|
542,534 |
|
|
|
541,558 |
|
|
TIBOR + 0.4% |
|
March 2026 |
June 2022 Yen
Term Loan (1) |
JPY |
|
June 2022 |
¥ |
|
25,000,000 |
|
$ |
159,569 |
|
|
|
159,569 |
|
|
|
159,281 |
|
|
1.1% and 1.2% |
|
June 2032 – 2034 |
2022 Canadian
Term Loan (2) |
CAD |
|
August 2022 |
C$ |
|
200,000 |
|
$ |
146,072 |
|
|
|
146,072 |
|
|
|
208,503 |
|
|
CORRA |
|
August 2026 |
December 2022 Yen
Term Loan |
JPY |
|
December 2022 |
¥ |
|
15,000,000 |
|
$ |
95,741 |
|
|
|
95,741 |
|
|
|
95,569 |
|
|
1.4% |
|
December 2033 |
2023 Yen
Term Loan |
JPY |
|
April 2023 |
¥ |
|
10,000,000 |
|
$ |
63,827 |
|
|
|
63,827 |
|
|
|
63,713 |
|
|
1.5% |
|
April 2031 |
2023 Chinese
Term Loan (1) |
CNH |
|
September 2023 |
CN¥ |
|
1,000,000 |
|
$ |
142,272 |
|
|
|
142,272 |
|
|
|
239,274 |
|
|
3.6% |
|
September 2026 |
2024 Yen
Term Loan |
JPY |
|
April 2024 |
¥ |
|
20,000,000 |
|
$ |
127,655 |
|
|
|
127,655 |
|
|
|
127,425 |
|
|
1.5% |
|
April 2034 |
2024 Euro
Term Loan (1) |
EUR |
|
November 2024 |
€ |
|
202,500 |
|
$ |
237,938 |
|
|
|
237,938 |
|
|
|
210,377 |
|
|
3.0% and Euribor + 0.7% |
|
November 2034 |
Subtotal |
|
|
|
|
|
|
|
|
|
|
1,879,423 |
|
|
|
2,008,863 |
|
|
|
|
|
Debt issuance costs, net |
|
|
|
|
|
|
|
|
|
(1,797 |
) |
|
|
(3,117 |
) |
|
|
|
|
Total term loans |
|
|
|
|
|
|
|
|
|
$ |
1,877,626 |
|
|
$ |
2,005,746 |
|
|
|
|
|
(1)This term loan includes more than one lender commitment each bearing a different interest rate and maturity date.
(2)In July 2025, we extended the maturity of a Canadian dollar term loan ("2022 Canadian Term Loan") by one year until August 2026. We may extend the maturity for one additional year, subject to the payment of an extension fee.
Long-Term Debt Maturities
Scheduled principal payments due on our debt for each year through the period ended December 31, 2030, and thereafter were as follows at December 31, 2025 (in thousands):
|
|
|
|
|
|
|
|
|
|
|
|
|
|
|
|
|
|
|
|
|
|
Unsecured |
|
|
|
|
|
|
|
|
Credit Facilities and |
|
|
Senior |
|
|
Term Loans |
|
|
Secured |
|
|
|
|
Maturity |
|
Commercial Paper |
|
|
Notes |
|
|
and Other |
|
|
Mortgage |
|
|
Total |
|
2026 (1) (2) |
|
$ |
- |
|
|
$ |
987,380 |
|
|
$ |
830,891 |
|
|
$ |
96,259 |
|
|
$ |
1,914,530 |
|
2027 (3) |
|
|
44,679 |
|
|
|
1,984,652 |
|
|
|
53,740 |
|
|
|
4,156 |
|
|
|
2,087,227 |
|
2028 |
|
|
- |
|
|
|
2,594,128 |
|
|
|
110,919 |
|
|
|
3,041 |
|
|
|
2,708,088 |
|
2029 |
|
|
- |
|
|
|
3,427,001 |
|
|
|
- |
|
|
|
3,191 |
|
|
|
3,430,192 |
|
2030 |
|
|
- |
|
|
|
2,847,961 |
|
|
|
31,914 |
|
|
|
3,345 |
|
|
|
2,883,220 |
|
Thereafter |
|
|
- |
|
|
|
21,592,195 |
|
|
|
883,056 |
|
|
|
79,538 |
|
|
|
22,554,789 |
|
Subtotal |
|
|
44,679 |
|
|
|
33,433,317 |
|
|
|
1,910,520 |
|
|
|
189,530 |
|
|
|
35,578,046 |
|
Unamortized premiums
(discounts), net |
|
|
- |
|
|
|
(410,322 |
) |
|
|
- |
|
|
|
6,368 |
|
|
|
(403,954 |
) |
Unamortized debt issuance
costs, net |
|
|
- |
|
|
|
(135,024 |
) |
|
|
(1,797 |
) |
|
|
(198 |
) |
|
|
(137,019 |
) |
Total |
|
$ |
44,679 |
|
|
$ |
32,887,971 |
|
|
$ |
1,908,723 |
|
|
$ |
195,700 |
|
|
$ |
35,037,073 |
|
(1)We expect to repay the amounts maturing in the next twelve months with cash generated from operations, proceeds from dispositions of real estate properties, or as necessary, with additional borrowings, including drawing on our available Credit Facilities.
(2)Included in the 2026 maturities was the 2022 Canadian Term Loan ($146.1 million at December 31, 2025), which can be extended until 2027, subject to the payment of extension fees.
(3)Included in the 2027 maturities were the amounts borrowed on the Yen Credit Facility ($44.7 million at December 31, 2025), which can be extended until 2028.
Interest Expense
The following table summarizes the components of interest expense for the years ended December 31 (in thousands):
|
|
|
|
|
|
|
|
|
|
|
|
|
|
|
2025 |
|
|
2024 |
|
|
2023 |
|
Gross interest expense |
|
$ |
1,023,805 |
|
|
$ |
892,612 |
|
|
$ |
683,363 |
|
Amortization of debt discounts (premiums), net |
|
|
55,562 |
|
|
|
52,249 |
|
|
|
51,980 |
|
Amortization of debt issuance costs, net |
|
|
30,085 |
|
|
|
26,636 |
|
|
|
22,609 |
|
Interest expense before capitalization |
|
$ |
1,109,452 |
|
|
$ |
971,497 |
|
|
$ |
757,952 |
|
Capitalized amounts |
|
|
(107,108 |
) |
|
|
(107,565 |
) |
|
|
(116,620 |
) |
Net interest expense |
|
$ |
1,002,344 |
|
|
$ |
863,932 |
|
|
$ |
641,332 |
|
Total cash paid for interest, net of amounts capitalized |
|
$ |
842,257 |
|
|
$ |
710,754 |
|
|
$ |
457,021 |
|
Financial Debt Covenants
Our Credit Facilities, senior notes and term loans outstanding at December 31, 2025 were subject to certain financial covenants under their related documents. At December 31, 2025, we were in compliance with all of our financial debt covenants.
Guarantee of Finance Subsidiary Debt
We have finance subsidiaries as part of our operations in Europe (Prologis Euro Finance LLC), Japan (Prologis Yen Finance LLC) and the U.K. (Prologis Sterling Finance LLC) in order to mitigate our foreign currency risk by borrowing in the currencies in which we invest. These entities are 100% indirectly owned by the OP and all unsecured debt issued or to be issued by each entity is or will be fully and unconditionally guaranteed by the OP. There are no restrictions or limits on the OP’s ability to obtain funds from its subsidiaries by dividend or loan. In reliance on Rule 13-01 of Regulation S-X, the separate financial statements of Prologis Euro Finance LLC, Prologis Yen Finance LLC and Prologis Sterling Finance LLC are not provided.
NOTE 8. STOCKHOLDERS’ EQUITY OF PROLOGIS, INC.
Shares Authorized
At December 31, 2025, 2.1 billion shares were authorized to be issued by the Parent, of which 2.0 billion shares represent common stock and 0.1 billion shares represent preferred stock. Our board of directors (the “Board”) may, without stockholder approval, classify or reclassify any unissued shares of our stock from time to time by setting or changing the preferences, conversion or other rights, voting powers, restrictions, limitations as to distributions, qualifications and terms or conditions of redemption of such shares.
Common Stock
Our at-the-market program allows us to sell up to $1.5 billion in aggregate gross sales proceeds of shares of common stock through twenty designated agents. These agents earn a fee of up to 2% of the gross sales price per share of common stock as agreed to on a transaction-by-transaction basis. We have not issued any shares of common stock under this program.
Under the 2020 Long-Term Incentive Plan, certain of our employees and outside directors are able to participate in equity-based compensation plans. See Note 11 for additional information on equity-based compensation plans.
We may also issue common stock upon redemption of common limited partnership units in the OP.
Share Purchase Program
We have a share purchase program for the repurchase of outstanding shares of our common stock on the open market or in privately negotiated transactions for an aggregate purchase price of up to $1.0 billion. During 2023, 2024 and 2025, we did not purchase any common stock of Prologis, Inc. in connection with our share purchase program.
Preferred Stock
At December 31, 2025 and 2024 our Series Q preferred stock outstanding had a dividend rate of 8.54% and will be redeemable at our option on or after November 13, 2026. Holders have, subject to certain conditions, limited voting rights and all holders are entitled to receive cumulative preferential dividends based on liquidation preference. The dividends are payable quarterly when, and if, they have been declared by the Board, out of funds legally available for the payment of dividends.
Ownership Restrictions
For us to qualify as a REIT, five or fewer individuals may not own more than 50% of the value of our outstanding stock at any time during the last half of our taxable year. Therefore, our charter restricts beneficial ownership (or ownership generally attributed to a person under the REIT rules), by a person, or persons acting as a group, of issued and outstanding common and preferred stock that would cause that person to own or be deemed to own more than 9.8% (by value or number of shares, whichever is more restrictive) of our issued and outstanding common stock. Furthermore, subject to certain exceptions, no person shall at any time directly or indirectly acquire ownership of more than 25% of any of the preferred stock. These provisions assist us in protecting and preserving our REIT status and protect the interests of stockholders in takeover transactions by preventing the acquisition of a substantial block of outstanding shares of stock.
Shares of stock owned by a person or group of people in excess of these limits are subject to redemption by us. The provision does not apply where a majority of the Board, in its sole and absolute discretion, waives such limit after determining that our status as a REIT for federal income tax purposes will not be jeopardized.
Dividends
To comply with the REIT requirements of the IRC, we are generally required to make common and preferred stock dividends (other than capital gain distributions) to our stockholders in amounts that together at least equal: (i) the sum of (a) 90% of our “REIT taxable income” computed without regard to the dividends paid deduction and net capital gains and (b) 90% of the net income (after tax), if any, from foreclosure property; minus (ii) certain excess noncash income. Our common stock distribution policy is to distribute a percentage of our cash flow that ensures that we will meet the distribution requirements of the IRC and that allows us to also retain cash to meet other needs, such as capital improvements and other investment activities.
The taxability of our dividends for the years ended December 31, 2025, 2024 and 2023 are presented below. The taxability of dividends paid in 2025 was based on management’s estimates as our tax return for the year ended December 31, 2025 has not been filed. As the statute of limitations is generally three years, our tax returns for certain years remain subject to examination and consequently the taxability of the dividends is subject to change.
In 2025, 2024 and 2023, we paid all of our dividends in cash.
The following summarizes the taxability of our common and preferred stock dividends for the years ended December 31:
|
|
|
|
|
|
|
|
|
|
|
|
|
|
|
2025 |
|
|
2024 |
|
|
2023 |
|
Common Stock: |
|
|
|
|
|
|
|
|
|
Ordinary income |
|
$ |
3.61 |
|
|
$ |
3.50 |
|
|
$ |
3.29 |
|
Qualified dividend |
|
|
0.03 |
|
|
|
0.01 |
|
|
|
0.00 |
|
Capital gains |
|
|
0.40 |
|
|
|
0.33 |
|
|
|
0.19 |
|
Total dividend |
|
$ |
4.04 |
|
|
$ |
3.84 |
|
|
$ |
3.48 |
|
Preferred Stock – Series Q: |
|
|
|
|
|
|
|
|
|
Ordinary income |
|
$ |
3.85 |
|
|
$ |
3.90 |
|
|
$ |
4.05 |
|
Qualified dividend |
|
|
0.02 |
|
|
|
0.02 |
|
|
|
0.00 |
|
Capital gains |
|
|
0.40 |
|
|
|
0.35 |
|
|
|
0.22 |
|
Total dividend |
|
$ |
4.27 |
|
|
$ |
4.27 |
|
|
$ |
4.27 |
|
Common stock dividends are characterized for federal income tax purposes as ordinary income, qualified dividend, capital gains, non-taxable return of capital or a combination of the four. Common stock dividends that exceed our current and accumulated earnings and profits (calculated for tax purposes) constitute a return of capital rather than a dividend and generally reduce the stockholder’s basis in the common stock. To the extent that a dividend exceeds both current and accumulated earnings and profits and the stockholder’s basis in the common stock, it will generally be treated as a gain from the sale or exchange of that stockholder’s common stock. At the beginning of each year, we notify our stockholders of the taxability of the common stock dividends paid during the preceding year.
Pursuant to the terms of our preferred stock, we are restricted from declaring or paying any dividend with respect to our common stock unless and until all cumulative dividends with respect to the preferred stock have been paid and sufficient funds have been set aside for dividends that have been declared for the relevant dividend period with respect to the preferred stock.
NOTE 9. PARTNERS’ CAPITAL OF PROLOGIS, L.P.
Distributions paid on the common limited partnership units, and the taxability of those distributions, are similar to dividends paid on the Parent’s common stock disclosed above.
We issued Class A Units in the OP through an acquisition of a portfolio of properties in 2015. The Class A Units generally had the same rights as the existing common limited partnership units of the OP, except that the Class A Units were entitled to a quarterly distribution equal to $0.64665 per unit so long as the common limited partnership units received a quarterly distribution of at least $0.40 per unit (in the event the common limited partnership units received a quarterly distribution of less than $0.40 per unit, the Class A Unit distribution would be reduced by a proportionate amount). Class A Units were convertible into common limited partnership units at an initial conversion rate of one-for-one. The conversion rate was increased or decreased to the extent that, at the time of conversion, the net present value of the distributions paid with respect to the Class A Units were less or more than the distributions paid on common limited partnership units from the time of issuance of the Class A Units until the time of conversion.
At December 31, 2024, Class A Units were convertible into 7.4 million common limited partnership units and during the year ended December 31, 2025, all Class A Units were converted into common limited partnership units, leaving none outstanding to be converted at December 31, 2025. Distributions paid to the Class A Units totaled $1.93995 per unit during the year ended December 31, 2025, and $2.58660 per unit annually during the years ended December 31, 2024 and 2023.
NOTE 10. NONCONTROLLING INTERESTS
Prologis, L.P.
We report noncontrolling interests related to several entities we consolidate but of which we do not own 100% of the equity. These entities include two real estate partnerships that have issued limited partnership units to third parties. Depending on the specific partnership agreements, these limited partnership units are redeemable for cash or, at our option, shares of the Parent’s common stock, generally at a rate of one share of common stock to one limited partnership unit. We also consolidate certain entities in which we do not own 100% of the equity but the equity of these entities is not exchangeable into our common stock.
As discussed in Note 1, the Parent has complete responsibility, power and discretion in the day-to-day management of the OP. The Parent, through its majority interest, has the right to receive benefits from and incur losses of the OP. In addition, the OP does not have either substantive liquidation rights or substantive kick-out rights without cause or substantive participating rights that could be exercised by a simple majority of noncontrolling interests. The absence of such rights renders the OP as a VIE. Accordingly, the Parent is the primary beneficiary and therefore consolidates the OP.
Prologis, Inc.
The noncontrolling interests of the Parent include the noncontrolling interests described above for the OP, as well as the limited partnership units in the OP that are not owned by the Parent. The outstanding limited partnership units receive quarterly cash distributions equal to the quarterly dividends paid on our common stock pursuant to the terms of the applicable partnership agreements.
The following table summarizes these entities at December 31 (dollars in thousands):
|
|
|
|
|
|
|
|
|
|
|
|
|
|
|
|
|
|
|
|
|
|
|
|
|
|
|
|
|
|
|
|
|
Our Ownership
Percentage |
|
|
Noncontrolling
Interests |
|
|
Total Assets |
|
|
Total Liabilities |
|
|
2025 |
|
|
2024 |
|
|
2025 |
|
|
2024 |
|
|
2025 |
|
|
2024 |
|
|
2025 |
|
|
2024 |
|
Prologis U.S. Logistics Venture |
|
55.0 |
% |
|
|
55.0 |
% |
|
$ |
3,071,053 |
|
|
$ |
3,091,941 |
|
|
$ |
6,885,453 |
|
|
$ |
7,014,774 |
|
|
$ |
156,368 |
|
|
$ |
149,823 |
|
Other consolidated entities (1) |
various |
|
|
various |
|
|
|
245,660 |
|
|
|
231,106 |
|
|
|
3,521,831 |
|
|
|
3,031,608 |
|
|
|
541,602 |
|
|
|
399,277 |
|
Prologis, L.P. |
|
|
|
|
|
|
|
3,316,713 |
|
|
|
3,323,047 |
|
|
|
10,407,284 |
|
|
|
10,046,382 |
|
|
|
697,970 |
|
|
|
549,100 |
|
Limited partners in Prologis, L.P. (2)(3) |
|
|
|
|
|
|
|
1,244,117 |
|
|
|
1,342,585 |
|
|
|
- |
|
|
|
- |
|
|
|
- |
|
|
|
- |
|
Prologis, Inc. |
|
|
|
|
|
|
$ |
4,560,830 |
|
|
$ |
4,665,632 |
|
|
$ |
10,407,284 |
|
|
$ |
10,046,382 |
|
|
$ |
697,970 |
|
|
$ |
549,100 |
|
(1)Includes two partnerships that have issued limited partnership units to third parties, as discussed above, along with various other consolidated entities. The limited partnership units outstanding at December 31, 2025 and 2024 were exchangeable into cash or, at our option, 0.3 million shares of the Parent’s common stock.
(2)At December 31, 2025, there were no Class A Units outstanding. At December 31, 2024, we had 7.7 million Class A Units that were convertible into 7.4 million limited partnership units of the OP. See Note 9 for further discussion of our Class A Units.
(3)There were limited partnership units in the OP, excluding the Class A Units, that were exchangeable into cash or, at our option, 14.9 million and 9.0 million shares of the Parent’s common stock, at December 31, 2025 and 2024, respectively. Also included are the vested OP Long-Term Incentive Plan Units (“LTIP Units”) associated with our long-term compensation plans of 6.9 million and 6.7 million shares of the Parent’s common stock at December 31, 2025 and 2024, respectively. See further discussion of LTIP Units in Note 11.
NOTE 11. LONG-TERM COMPENSATION
2020 Long-Term Incentive Plan
The 2020 Long-Term Incentive Plan ("2020 LTIP") provides for grants of awards to officers, directors, employees and consultants of the Parent or its subsidiaries. Awards can be in the form of: full value awards, stock appreciation rights and stock options (non-qualified options and incentive stock options). Full value awards generally consist of: (i) common stock; (ii) restricted stock units (“RSUs”); (iii) OP LTIP units (“LTIP Units”) and (iv) performance stock units ("PSUs”). Awards may be made under the 2020 LTIP until it is terminated by the Board or until the ten-year anniversary of the effective date of the plan.
The awards have been issued under the following components of our equity-based compensation programs at December 31, 2025: (i) Performance Stock Unit Program; (ii) Prologis Outperformance Plan ("POP"); (iii) Prologis Promote Plan (“PPP”); (iv) annual long-term incentive (“LTI”) equity award program (“Annual LTI Award”); and (v) annual bonus exchange program.
At December 31, 2025, we had 15.1 million shares of common stock remaining available for future issuance under equity compensation plans.
Equity-Based Compensation Programs
Performance Stock Unit ("PSU") Program
PSUs are granted under the Company's 2020 Long-Term Incentive Plan and are settled in equity at the end of a three-year performance period if applicable market-based performance hurdles are met. Such hurdles are based on a performance scale of Prologis’ percentile ranking in the Morgan Stanley Capital International US REIT Index (the “Index”) for a three-year performance period. Prologis must perform at the 55th percentile to earn a target award of 100.0%. The award is capped at 200.0% of the target for performance at or above the 85th percentile, and there is no payout in the event Prologis’ performance is below the 35th percentile. There is a proportional scaling between the 35th and the 85th percentiles, starting with 50.0% of the target being earned at the 35th percentile. If an award meets applicable market-based performance hurdles and is earned at the end of the initial three-year performance period, one-third of the award vests at the end of the performance period and the remaining award vests equally one and two years after the award is earned. The award is subject to an additional three-year holding requirement. Awards are in the form of common stock, restricted stock units ("RSUs") and LTIP Units.
The fair value of the awards is measured at the grant date using a Monte Carlo valuation model and amortized over the period from the grant date to the date at which the awards vest, regardless of whether the market condition has been satisfied, which ranges from three to five years. We granted PSUs for the 2025 – 2027 performance period in January 2025.
The following table details the assumptions used for each PSU grant based on the year it was granted (dollars in thousands):
|
|
|
|
|
|
|
|
|
|
|
|
2025 |
|
|
|
2024 |
|
Risk-free interest rate |
|
|
4.4 |
% |
|
|
4.2 |
% |
Prologis expected volatility |
|
|
29.0 |
% |
|
|
27.0 |
% |
Index expected volatility |
|
|
30.2 |
% |
|
|
30.5 |
% |
Grant date fair value |
|
$ |
83,900 |
|
|
$ |
31,500 |
|
Prologis Outperformance Plan ("POP")
In prior years, we allocated participation points or a percentage of the compensation pool to participants under our POP, corresponding to three-year performance periods beginning each January 1. POP awards were measured at the grant-date fair value and amortized over vesting periods ranging from three to ten years, with awards earned only if our three-year compound annualized total stockholder return (“TSR”) exceeded the applicable index by 100 basis points and the absolute TSR was positive. If earned, 20% of the award was payable after the initial three-year performance period (subject to a holding requirement), with the remaining 80% subject to additional long-term vesting. Awards were paid in the form of common stock, RSUs, POP LTIP Units or LTIP Units. Commencing in 2024 for named executive officers (“NEOs”) and in 2025 for other employees who previously received participation points, those individuals received the PSUs discussed above. No new awards will be granted under the POP.
The performance criteria was met for the performance period ended 2023. The absolute maximum cap was earned and awarded in January of the following year. The performance criteria was not met for the performance periods ended 2024 and 2025. The RSUs and LTIP Units tables below include POP awards that were earned but are unvested, while any vested awards are reflected within the Consolidated Statements of Equity and Capital.
The following table details the assumptions used for each POP grant based on the year it was granted, using a Monte Carlo model (dollars in thousands):
|
|
|
|
|
|
|
|
|
|
|
|
2024 |
|
|
|
2023 |
|
Risk-free interest rate |
|
|
4.2 |
% |
|
|
4.2 |
% |
Prologis expected volatility |
|
|
27.0 |
% |
|
|
35.0 |
% |
Index expected volatility |
|
|
20.0 |
% |
|
|
31.0 |
% |
Grant date fair value |
|
$ |
19,000 |
|
|
$ |
28,300 |
|
Total remaining compensation cost at December 31, 2025, was $39.9 million, prior to adjustments for capitalized amounts due to our development activities. The remaining compensation cost will be recognized through 2033, with a weighted average period of 2.6 years.
Prologis Promote Plan (“PPP”)
Under the PPP, for promotes earned after January 2024, we award up to 25% of the third-party portion of promotes earned by Prologis from co-investment ventures to employees through a compensation pool. The awards may be settled in some combination of cash and full value awards, at our election. For promotes earned prior to January 2024, up to 40% of the third-party portion of promotes was awarded to certain employees.
Annual LTI Equity Award Program (“Annual LTI Award”)
The Annual LTI Award provides for grants to certain employees related to the most recent performance period.
Annual Bonus Exchange Program
Under our bonus exchange program, generally all our employees may elect to receive all or a portion of their annual cash bonus in equity. Equity awards granted through the bonus exchange are valued at a premium to the cash bonus exchanged and vest over three years, excluding certain executive officers. As certain executive officers do not receive a bonus exchange premium for participating in the bonus exchange program, the equity they receive upon exchange for their cash bonuses does not have a vesting period.
Under the PPP, Annual LTI Award and Annual Bonus Exchange Program, awards may be issued in the form of RSUs or LTIP Units at the participants’ elections. RSUs and LTIP Units are valued based on the market price of the Parent’s common stock at the grant date, and the grant date fair value is recognized as compensation expense over the service period. The service period is generally four years, except for awards under the annual bonus exchange program. Dividends and distributions are paid with respect to both RSUs and LTIP Units during the vesting period, and therefore they are considered participating securities. We do not allocate undistributed earnings to participating securities as our net earnings per share or unit would not be materially different. The value of the dividend is
charged to retained earnings for RSUs and the distribution is charged to Net Earnings Attributable to Noncontrolling Interests in the OP for LTIP Units in the Consolidated Financial Statements of the Parent.
Summary of Award Activity
PSUs
The following table summarizes the activity for PSUs for the year ended December 31, 2025 (units in thousands):
|
|
|
|
|
|
|
|
|
|
|
Unearned |
|
|
Weighted Average Grant Date Fair Value |
|
Balance at January 1, 2025 |
|
|
244 |
|
|
$ |
129.10 |
|
Granted |
|
|
878 |
|
|
|
95.53 |
|
Earned |
|
|
- |
|
|
|
- |
|
Forfeited |
|
|
(17 |
) |
|
|
95.53 |
|
Balance at December 31, 2025 |
|
|
1,105 |
|
|
$ |
102.95 |
|
See the discussion of the fair value of PSUs above. Total remaining compensation cost related to the PSUs at December 31, 2025, was $65.5 million, prior to adjustments for capitalized amounts due to our development activities. The remaining compensation cost will be recognized through 2030, with a weighted average period of 1.4 years.
RSUs
Each RSU represents the right to receive one share of common stock of the Parent.
The following table summarizes the activity for RSUs for the year ended December 31, 2025 (units in thousands):
|
|
|
|
|
|
|
|
|
|
|
Unvested |
|
|
Weighted Average Grant Date Fair Value |
|
Balance at January 1, 2025 |
|
|
2,063 |
|
|
$ |
99.39 |
|
Granted |
|
|
481 |
|
|
|
109.70 |
|
Conversion of earned PSUs |
|
|
- |
|
|
|
- |
|
Vested |
|
|
(698 |
) |
|
|
120.44 |
|
Forfeited |
|
|
(90 |
) |
|
|
120.15 |
|
Balance at December 31, 2025 |
|
|
1,756 |
|
|
$ |
92.80 |
|
The fair value of stock awards granted and vested was $52.8 million and $84.0 million for 2025, $91.0 million and $81.7 million for 2024 and $122.1 million and $65.0 million for 2023, respectively, based on the weighted average grant date fair value per unit.
Total remaining compensation cost related to RSUs outstanding, excluding POP awards, at December 31, 2025, was $76.9 million, prior to adjustments for capitalized amounts due to our development activities. The remaining compensation cost will be recognized through 2029, with a weighted average period of 1.0 years.
LTIP Units
An LTIP Unit represents a partnership interest in the OP. After vesting and the satisfaction of certain conditions, an LTIP Unit may be exchangeable for a common limited partnership unit in the OP and then redeemable for a share of common stock or cash at our option. Once LTIP Units are vested and converted into common stock, they reduce the total share reserve under the equity compensation plan but do not count as available shares for future awards. At December 31, 2025, 6.9 million LTIP Units were vested but not yet converted, and therefore, they remain excluded from the available share pool but included in fully diluted share calculations.
The following table summarizes the activity for LTIP Units for the year ended December 31, 2025 (units in thousands):
|
|
|
|
|
|
|
|
|
|
|
Unvested |
|
|
Weighted Average Grant Date Fair Value |
|
Balance at January 1, 2025 |
|
|
5,250 |
|
|
$ |
72.15 |
|
Granted |
|
|
586 |
|
|
|
109.46 |
|
Conversion of earned PSUs |
|
|
- |
|
|
|
- |
|
Vested |
|
|
(1,115 |
) |
|
|
120.83 |
|
Forfeited |
|
|
(15 |
) |
|
|
120.54 |
|
Balance at December 31, 2025 |
|
|
4,706 |
|
|
$ |
65.11 |
|
The fair value of unit awards granted and vested was $64.2 million and $134.7 million for 2025, $125.1 million and $153.6 million for 2024 and $259.0 million and $151.1 million for 2023, respectively, based on the weighted average grant date fair value per unit.
Total remaining compensation cost related to LTIP Units, excluding POP awards, at December 31, 2025, was $119.0 million, prior to adjustments for capitalized amounts due to our development activities. The remaining compensation cost will be recognized through 2030, with a weighted average period of 1.0 years.
Other Plans
The Prologis 401(k) Plan (the “401(k) Plan”) includes a matching employer contribution of $0.50 for every dollar contributed by an employee, up to 12% of the employee’s annual compensation (within the statutory compensation limit). In the 401(k) Plan, vesting in the matching employer contributions is based on the employee's years of service, with 100% vesting at the completion of one year of service. Our contributions under the matching provisions were $11.1 million, $10.2 million and $8.9 million for the years ended December 31, 2025, 2024 and 2023, respectively.
We have a non-qualified savings plan that allows highly compensated employees the opportunity to defer the receipt and income taxation of a certain portion of their compensation in excess of the amount permitted under the 401(k) Plan. There has been no employer matching within this plan in the three-year period ended December 31, 2025.
NOTE 12. INCOME TAXES
Components of Earnings Before Income Taxes
The following table summarizes the components of earnings before income taxes for the years ended December 31 (in thousands):
|
|
|
|
|
|
|
|
|
|
|
|
|
|
|
2025 |
|
|
2024 |
|
|
2023 |
|
Domestic |
|
$ |
3,539,450 |
|
|
$ |
3,595,449 |
|
|
$ |
2,891,644 |
|
International |
|
|
229,866 |
|
|
|
519,429 |
|
|
|
572,539 |
|
Earnings before income taxes |
|
$ |
3,769,316 |
|
|
$ |
4,114,878 |
|
|
$ |
3,464,183 |
|
Summary of Current and Deferred Income Taxes
The following table summarizes the components of the provision for income taxes for the years ended December 31 (in thousands):
|
|
|
|
|
|
|
|
|
|
|
|
|
|
|
2025 |
|
|
2024 |
|
|
2023 |
|
Current income tax expense (benefit): |
|
|
|
|
|
|
|
|
|
U.S. federal |
|
$ |
36,003 |
|
|
$ |
(17,082 |
) |
|
$ |
(953 |
) |
International |
|
|
148,169 |
|
|
|
152,891 |
|
|
|
175,121 |
|
State and local |
|
|
15,536 |
|
|
|
9,973 |
|
|
|
19,162 |
|
Total current income tax expense |
|
|
199,708 |
|
|
|
145,782 |
|
|
|
193,330 |
|
|
|
|
|
|
|
|
|
|
|
Deferred income tax expense (benefit): |
|
|
|
|
|
|
|
|
|
U.S. federal |
|
|
(4,571 |
) |
|
|
18,222 |
|
|
|
12,936 |
|
International |
|
|
8,880 |
|
|
|
2,939 |
|
|
|
4,772 |
|
Total deferred income tax expense |
|
|
4,309 |
|
|
|
21,161 |
|
|
|
17,708 |
|
Total income tax expense |
|
$ |
204,017 |
|
|
$ |
166,943 |
|
|
$ |
211,038 |
|
Current Income Taxes
We recognize current income tax expense for the federal and state income taxes incurred by our TRSs and taxes incurred in certain states and foreign jurisdictions. Current income tax expense fluctuates from period to period based primarily on the timing of our taxable income. Taxable income incurred over the last three years was principally due to the following: (i) the contribution of real estate properties to our unconsolidated co-investment ventures and sales to third parties; (ii) recurring and transactional strategic capital fees earned; (iii) taxable earnings from unconsolidated co-investment ventures; and (iv) adjustments to acquired tax liabilities.
During the years ended December 31, 2025, 2024 and 2023, cash paid for income taxes, net of refunds, was $142.7 million, $129.9 million and $149.1 million, respectively. The composition of these payments is generally consistent with the components of current income tax expense (benefit) as presented above.
Deferred Income Taxes
The deferred income tax expense recognized in 2025, 2024 and 2023 was principally due to changes in temporary differences and utilization of NOLs.
The following table summarizes the deferred income tax assets and liabilities at December 31 (in thousands):
|
|
|
|
|
|
|
|
|
|
|
2025 |
|
|
2024 |
|
Gross deferred income tax assets: |
|
|
|
|
|
|
NOL carryforwards |
|
$ |
281,664 |
|
|
$ |
263,597 |
|
Basis difference – real estate properties |
|
|
53,824 |
|
|
|
43,226 |
|
Basis difference – equity investments |
|
|
20,594 |
|
|
|
18,434 |
|
Section 163(j) interest limitation |
|
|
2,250 |
|
|
|
2,105 |
|
Capital loss carryforward |
|
|
2,033 |
|
|
|
6,096 |
|
Other – temporary differences |
|
|
61,021 |
|
|
|
29,908 |
|
Total gross deferred income tax assets |
|
|
421,386 |
|
|
|
363,366 |
|
Valuation allowance |
|
|
(366,990 |
) |
|
|
(312,348 |
) |
Gross deferred income tax assets, net of valuation allowance |
|
|
54,396 |
|
|
|
51,018 |
|
Gross deferred income tax liabilities: |
|
|
|
|
|
|
Basis difference – real estate properties |
|
|
133,095 |
|
|
|
128,803 |
|
Basis difference – equity investments |
|
|
63,066 |
|
|
|
57,763 |
|
Other – temporary differences |
|
|
6,573 |
|
|
|
2,321 |
|
Total gross deferred income tax liabilities |
|
|
202,734 |
|
|
|
188,887 |
|
Net deferred income tax liabilities |
|
$ |
148,338 |
|
|
$ |
137,869 |
|
At December 31, 2025, we had NOL carryforwards as follows (in thousands):
|
|
|
|
|
|
|
|
|
|
|
|
|
|
|
|
|
|
|
|
|
U.S. |
|
|
Europe |
|
|
Mexico |
|
|
Japan |
|
|
Other |
|
Gross NOL carryforward |
$ |
78,175 |
|
|
$ |
683,143 |
|
|
$ |
216,909 |
|
|
$ |
67,119 |
|
|
$ |
33,789 |
|
Tax-effected NOL carryforward |
|
20,255 |
|
|
|
179,267 |
|
|
|
68,531 |
|
|
|
7,953 |
|
|
|
5,658 |
|
Valuation allowance |
|
(20,255 |
) |
|
|
(164,021 |
) |
|
|
(68,531 |
) |
|
|
(7,953 |
) |
|
|
(5,658 |
) |
Net deferred tax asset – NOL carryforward |
$ |
- |
|
|
$ |
15,246 |
|
|
$ |
- |
|
|
$ |
- |
|
|
$ |
- |
|
Expiration periods |
2026 – 2045 |
|
|
2026 – indefinite |
|
|
2026 – 2035 |
|
|
2026 – 2035 |
|
|
2026 – indefinite |
|
The deferred tax asset valuation allowance at December 31, 2025, was adequate to reduce the total deferred tax asset to an amount that we estimate will more likely than not be realized.
Liability for Uncertain Tax Positions
During the years ended December 31, 2025, 2024 and 2023, we believe that we complied with the REIT requirements of the IRC. The statute of limitations for our global tax returns is generally three to five years. As such, our tax returns that remain subject to examination would be primarily from 2020 and thereafter. During the year ended December 31, 2024, we recognized a $20.7 million liability for uncertain tax positions related to proposed settlements. Liabilities or any related settlements for uncertain tax positions for the years ended December 31, 2025 and 2023 were not material to our Consolidated Financial Statements.
NOTE 13. EARNINGS PER COMMON SHARE OR UNIT
We determine basic earnings per share or unit based on the weighted average number of shares of common stock or units outstanding during the period. We compute diluted earnings per share or unit based on the weighted average number of shares or units outstanding combined with the incremental weighted average effect from all outstanding potentially dilutive instruments. During the year ended December 31, 2025 all Class A Units in the OP were converted to limited partnership units in the OP.
The computation of our basic and diluted earnings per share and unit for the years ended December 31 was as follows (in thousands, except per share and unit amounts):
|
|
|
|
|
|
|
|
|
|
|
|
|
Prologis, Inc. |
|
2025 |
|
|
2024 |
|
|
2023 |
|
Net earnings attributable to common stockholders – Basic |
|
$ |
3,322,349 |
|
|
$ |
3,725,754 |
|
|
$ |
3,053,373 |
|
Net earnings attributable to exchangeable limited partnership units (1) |
|
|
81,773 |
|
|
|
94,052 |
|
|
|
77,806 |
|
Adjusted net earnings attributable to common stockholders – Diluted |
|
$ |
3,404,122 |
|
|
$ |
3,819,806 |
|
|
$ |
3,131,179 |
|
|
|
|
|
|
|
|
|
|
|
Weighted average common shares outstanding – Basic |
|
|
928,473 |
|
|
|
926,172 |
|
|
|
924,351 |
|
Incremental weighted average effect on exchange of limited partnership units (1) |
|
|
23,034 |
|
|
|
23,445 |
|
|
|
23,693 |
|
Incremental weighted average effect of equity awards |
|
|
5,325 |
|
|
|
3,973 |
|
|
|
3,747 |
|
Weighted average common shares outstanding – Diluted (2) |
|
|
956,832 |
|
|
|
953,590 |
|
|
|
951,791 |
|
|
|
|
|
|
|
|
|
|
|
Net earnings per share attributable to common stockholders: |
|
|
|
|
|
|
|
|
|
Basic |
|
$ |
3.58 |
|
|
$ |
4.02 |
|
|
$ |
3.30 |
|
Diluted |
|
$ |
3.56 |
|
|
$ |
4.01 |
|
|
$ |
3.29 |
|
|
|
|
|
|
|
|
|
|
|
|
|
|
Prologis, L.P. |
|
2025 |
|
|
2024 |
|
|
2023 |
|
Net earnings attributable to common unitholders |
|
$ |
3,403,353 |
|
|
$ |
3,818,862 |
|
|
$ |
3,130,647 |
|
Net earnings attributable to Class A Units |
|
|
(9,158 |
) |
|
|
(30,308 |
) |
|
|
(26,784 |
) |
Net earnings attributable to common unitholders – Basic |
|
|
3,394,195 |
|
|
|
3,788,554 |
|
|
|
3,103,863 |
|
Net earnings attributable to Class A Units |
|
|
9,158 |
|
|
|
30,308 |
|
|
|
26,784 |
|
Net earnings attributable to exchangeable other limited partnership units |
|
|
769 |
|
|
|
944 |
|
|
|
532 |
|
Adjusted net earnings attributable to common unitholders – Diluted |
|
$ |
3,404,122 |
|
|
$ |
3,819,806 |
|
|
$ |
3,131,179 |
|
|
|
|
|
|
|
|
|
|
|
Weighted average common partnership units outstanding – Basic |
|
|
947,938 |
|
|
|
941,782 |
|
|
|
939,635 |
|
Incremental weighted average effect on exchange of Class A Units |
|
|
3,305 |
|
|
|
7,536 |
|
|
|
8,110 |
|
Incremental weighted average effect on exchange of other limited partnership units |
|
|
264 |
|
|
|
299 |
|
|
|
299 |
|
Incremental weighted average effect of equity awards of Prologis, Inc. |
|
|
5,325 |
|
|
|
3,973 |
|
|
|
3,747 |
|
Weighted average common units outstanding – Diluted (2) |
|
|
956,832 |
|
|
|
953,590 |
|
|
|
951,791 |
|
|
|
|
|
|
|
|
|
|
|
Net earnings per unit attributable to common unitholders: |
|
|
|
|
|
|
|
|
|
Basic |
|
$ |
3.58 |
|
|
$ |
4.02 |
|
|
$ |
3.30 |
|
Diluted |
|
$ |
3.56 |
|
|
$ |
4.01 |
|
|
$ |
3.29 |
|
(1)Earnings allocated to the exchangeable OP units not held by the Parent have been included in the numerator and exchangeable common units have been included in the denominator for the purpose of computing diluted earnings per share for all periods as the per share and unit amount is the same.
(2)Our total weighted average potentially dilutive shares and units outstanding for the years ended December 31 consisted of the following:
|
|
|
|
|
|
|
|
|
|
|
|
|
|
|
2025 |
|
|
2024 |
|
|
2023 |
|
|
Class A Units |
|
3,305 |
|
|
|
7,536 |
|
|
|
8,110 |
|
|
Other limited partnership units |
|
264 |
|
|
|
299 |
|
|
|
299 |
|
|
Equity awards |
|
7,839 |
|
|
|
7,688 |
|
|
|
7,455 |
|
|
Prologis, L.P. |
|
11,408 |
|
|
|
15,523 |
|
|
|
15,864 |
|
|
Common limited partnership units |
|
19,465 |
|
|
|
15,610 |
|
|
|
15,284 |
|
|
Prologis, Inc. |
|
30,873 |
|
|
|
31,133 |
|
|
|
31,148 |
|
NOTE 14. FINANCIAL INSTRUMENTS AND FAIR VALUE MEASUREMENTS
Derivative Financial Instruments
In the normal course of business, our operations are exposed to market risks, including the effect of changes in foreign currency exchange rates and interest rates. We may enter into derivative financial instruments to offset these underlying market risks. See Note 2 for our derivative financial instruments policy.
The following table presents the fair value of our derivative financial instruments recognized within Other Assets and Other Liabilities in the Consolidated Balance Sheets at December 31 (in thousands):
|
|
|
|
|
|
|
|
|
|
|
|
|
|
|
|
|
|
|
2025 |
|
|
2024 |
|
|
|
Asset |
|
|
Liability |
|
|
Asset |
|
|
Liability |
|
Undesignated derivatives |
|
|
|
|
|
|
|
|
|
|
|
|
Foreign currency contracts |
|
|
|
|
|
|
|
|
|
|
|
|
Forwards |
|
|
|
|
|
|
|
|
|
|
|
|
Brazilian real |
|
$ |
- |
|
|
$ |
394 |
|
|
$ |
- |
|
|
$ |
- |
|
British pound sterling |
|
|
164 |
|
|
|
11,688 |
|
|
|
8,785 |
|
|
|
422 |
|
Canadian dollar |
|
|
5,680 |
|
|
|
214 |
|
|
|
15,503 |
|
|
|
- |
|
Euro |
|
|
1,660 |
|
|
|
17,571 |
|
|
|
32,989 |
|
|
|
- |
|
Japanese yen |
|
|
54,147 |
|
|
|
22 |
|
|
|
55,818 |
|
|
|
- |
|
Swedish krona |
|
|
198 |
|
|
|
5,352 |
|
|
|
4,642 |
|
|
|
108 |
|
Options |
|
|
|
|
|
|
|
|
|
|
|
|
Mexican peso |
|
|
14,733 |
|
|
|
- |
|
|
|
1,814 |
|
|
|
- |
|
|
|
|
|
|
|
|
|
|
|
|
|
|
Designated derivatives |
|
|
|
|
|
|
|
|
|
|
|
|
Foreign currency contracts |
|
|
|
|
|
|
|
|
|
|
|
|
Net investment hedges |
|
|
|
|
|
|
|
|
|
|
|
|
British pound sterling |
|
|
841 |
|
|
|
4,279 |
|
|
|
2,837 |
|
|
|
108 |
|
Canadian dollar |
|
|
1,866 |
|
|
|
968 |
|
|
|
5,454 |
|
|
|
- |
|
|
|
|
|
|
|
|
|
|
|
|
|
|
Interest rate contracts |
|
|
|
|
|
|
|
|
|
|
|
|
Cash flow hedges |
|
|
|
|
|
|
|
|
|
|
|
|
U.S. dollar |
|
|
1,480 |
|
|
|
- |
|
|
|
9,587 |
|
|
|
- |
|
Total fair value of derivatives |
|
$ |
80,769 |
|
|
$ |
40,488 |
|
|
$ |
137,429 |
|
|
$ |
638 |
|
Undesignated Derivative Financial Instruments
Foreign Currency Contracts
The following table summarizes the activity of our undesignated foreign currency contracts for the years ended December 31 (in millions, except for weighted average forward rates and number of active contracts):
|
|
|
|
|
|
|
|
|
|
|
|
|
|
|
|
|
|
|
|
|
|
2025 |
|
2024 |
|
2023 |
|
CAD |
EUR |
GBP |
JPY |
Other |
Total |
|
CAD |
EUR |
GBP |
JPY |
Other |
Total |
|
CAD |
EUR |
GBP |
JPY |
Other |
Total |
Notional amounts at January 1 ($) |
254 |
526 |
386 |
312 |
(27) |
1,451 |
|
213 |
524 |
442 |
384 |
56 |
1,619 |
|
283 |
601 |
349 |
331 |
81 |
1,645 |
New contracts ($) |
111 |
309 |
184 |
104 |
(145) |
563 |
|
102 |
165 |
334 |
107 |
(74) |
634 |
|
15 |
173 |
192 |
140 |
(10) |
510 |
Matured, expired or settled
contracts ($) |
(69) |
(248) |
(185) |
(81) |
(30) |
(613) |
|
(61) |
(163) |
(390) |
(179) |
(9) |
(802) |
|
(85) |
(250) |
(99) |
(87) |
(15) |
(536) |
Notional amounts at
December 31 ($) |
296 |
587 |
385 |
335 |
(202) |
1,401 |
|
254 |
526 |
386 |
312 |
(27) |
1,451 |
|
213 |
524 |
442 |
384 |
56 |
1,619 |
|
|
|
|
|
|
|
|
|
|
|
|
|
|
|
|
|
|
|
|
|
Weighted average forward rate at
December 31 |
1.33 |
1.17 |
1.30 |
125.82 |
|
|
|
1.31 |
1.15 |
1.28 |
120.37 |
|
|
|
1.30 |
1.16 |
1.27 |
115.40 |
|
|
Active contracts at December 31 |
112 |
128 |
100 |
99 |
|
|
|
101 |
86 |
82 |
77 |
|
|
|
74 |
72 |
96 |
96 |
|
|
The following table summarizes the undesignated derivative financial instruments exercised and associated realized and unrealized gains (losses), respectively, in Foreign Currency, Derivative and Other Gains (Losses) and Other Income (Expense), Net in the Consolidated Statements of Income for the years ended December 31 (in millions, except for number of exercised contracts):
|
|
|
|
|
|
|
|
|
|
|
|
|
|
|
2025 |
|
|
2024 |
|
|
2023 |
|
Exercised contracts |
|
|
160 |
|
|
|
254 |
|
|
|
218 |
|
Realized gains (losses) on the matured, expired or settled contracts |
|
$ |
11 |
|
|
$ |
53 |
|
|
$ |
60 |
|
Unrealized gains (losses) on the change in fair value of outstanding contracts |
|
$ |
(72 |
) |
|
$ |
53 |
|
|
$ |
(58 |
) |
Designated Derivative Financial Instruments
Changes in the fair value of derivatives that are designated as net investment hedges ("NIHs") of our foreign operations and cash flow hedges ("CFHs") are recorded in Accumulated Other Comprehensive Income (Loss) ("AOCI/L") in the Consolidated Balance Sheets and reflected within the AOCI/L table below.
Foreign Currency Contracts
The following table summarizes the activity of our foreign currency contracts designated as NIHs for the years ended December 31 (in millions, except for weighted average forward rates and number of active contracts):
|
|
|
|
|
|
|
|
|
|
|
|
|
|
|
|
|
|
|
|
|
|
|
|
|
|
|
|
|
|
|
|
|
|
2025 |
|
|
2024 |
|
|
2023 |
|
|
CAD |
|
GBP |
|
Total |
|
|
CAD |
|
GBP |
|
Total |
|
|
CAD |
|
CNH |
|
GBP |
|
Total |
|
Notional amounts at January 1 ($) |
|
163 |
|
|
432 |
|
|
595 |
|
|
|
516 |
|
|
432 |
|
|
948 |
|
|
|
534 |
|
|
- |
|
|
440 |
|
|
974 |
|
New contracts ($) |
|
200 |
|
|
683 |
|
|
883 |
|
|
|
163 |
|
|
523 |
|
|
686 |
|
|
|
467 |
|
|
100 |
|
|
343 |
|
|
910 |
|
Matured, expired or settled contracts ($) |
|
(163 |
) |
|
(432 |
) |
|
(595 |
) |
|
|
(516 |
) |
|
(523 |
) |
|
(1,039 |
) |
|
|
(485 |
) |
|
(100 |
) |
|
(351 |
) |
|
(936 |
) |
Notional amounts at December 31 ($) |
|
200 |
|
|
683 |
|
|
883 |
|
|
|
163 |
|
|
432 |
|
|
595 |
|
|
|
516 |
|
|
|
|
432 |
|
|
948 |
|
|
|
|
|
|
|
|
|
|
|
|
|
|
|
|
|
|
|
|
|
|
|
|
Weighted average forward rate at
December 31 |
|
1.36 |
|
|
1.34 |
|
|
|
|
|
1.37 |
|
|
1.26 |
|
|
|
|
|
1.33 |
|
|
- |
|
|
1.26 |
|
|
|
Active contracts at December 31 |
|
2 |
|
|
6 |
|
|
|
|
|
2 |
|
|
4 |
|
|
|
|
|
6 |
|
|
- |
|
|
4 |
|
|
|
Interest Rate Contracts
The following table summarizes the activity of our interest rate contracts designated as CFHs for the years ended December 31 (in millions):
|
|
|
|
|
|
|
|
|
|
|
|
|
|
|
|
|
|
|
|
|
|
|
|
|
|
|
|
|
|
|
|
|
|
|
|
|
2025 |
|
|
2024 |
|
|
2023 |
|
|
EUR |
|
USD |
|
CAD |
|
Total |
|
|
EUR |
|
USD |
|
GBP |
|
Total |
|
|
EUR |
|
USD |
|
Total |
|
Notional amounts at January 1 ($) |
|
- |
|
|
280 |
|
|
- |
|
|
280 |
|
|
|
700 |
|
|
550 |
|
|
- |
|
|
1,250 |
|
|
|
447 |
|
|
150 |
|
|
597 |
|
New contracts ($) |
|
543 |
|
|
1,725 |
|
|
352 |
|
|
2,620 |
|
|
|
- |
|
|
780 |
|
|
246 |
|
|
1,026 |
|
|
|
1,113 |
|
|
2,300 |
|
|
3,413 |
|
Matured, expired or settled
contracts ($) |
|
(543 |
) |
|
(1,580 |
) |
|
(352 |
) |
|
(2,475 |
) |
|
|
(700 |
) |
|
(1,050 |
) |
|
(246 |
) |
|
(1,996 |
) |
|
|
(860 |
) |
|
(1,900 |
) |
|
(2,760 |
) |
Notional amounts at
December 31 ($) |
|
- |
|
|
425 |
|
|
- |
|
|
425 |
|
|
|
- |
|
|
280 |
|
|
- |
|
|
280 |
|
|
|
700 |
|
|
550 |
|
|
1,250 |
|
Designated Nonderivative Financial Instruments
The following table summarizes our debt and accrued interest, designated as a hedge of our net investment in international subsidiaries at December 31 (in millions):
|
|
|
|
|
|
|
|
|
|
|
|
|
|
|
2025 |
|
|
2024 |
|
|
2023 |
|
British pound sterling |
|
$ |
1,837 |
|
|
$ |
1,763 |
|
|
$ |
1,305 |
|
Canadian dollar |
|
$ |
1,793 |
|
|
$ |
758 |
|
|
$ |
373 |
|
The following table summarizes the unrealized gains (losses) in Foreign Currency, Derivative and Other Gains (Losses) and Other Income (Expense), Net in the Consolidated Statements of Income on the remeasurement of the unhedged portion of our euro-denominated and Chinese renminbi-denominated debt and accrued interest, for the years ended December 31 (in millions):
|
|
|
|
|
|
|
|
|
|
|
|
|
|
|
2025 |
|
|
2024 |
|
|
2023 |
|
Unrealized gains (losses) on the unhedged portion |
|
$ |
(66 |
) |
|
$ |
34 |
|
|
$ |
(23 |
) |
Accumulated Other Comprehensive Income (Loss) ("AOCI/L")
The change in AOCI/L in the Consolidated Statements of Equity during the periods presented was due to the following: (i) the currency translation adjustments ("CTA") that we recognize due to the translation of the financial statements of our consolidated subsidiaries, whose functional currency is not the U.S. dollar, into U.S. dollars; and (ii) the change in the fair value of the effective portion of our derivative financial instruments that have been designated as NIHs and CFHs and the translation of the hedged portion of our debt.
The following table presents these changes in AOCI/L for the years ended December 31 (in thousands):
|
|
|
|
|
|
|
|
|
|
|
|
|
|
|
|
|
|
|
|
|
|
|
|
|
|
|
Unrealized gains (losses) on CFHs (1) |
|
|
Our share of derivatives from unconsolidated entities |
|
|
Derivative NIHs |
|
|
Debt designated as nonderivative NIHs (2) |
|
|
CTA |
|
|
Total AOCI/L |
|
Balance at
January 1, 2023 |
|
$ |
30,545 |
|
|
$ |
22,584 |
|
|
$ |
332,973 |
|
|
$ |
329,983 |
|
|
$ |
(1,159,694 |
) |
|
$ |
(443,609 |
) |
Other comprehensive
income (loss), net |
|
|
(76,289 |
) |
|
|
(14,170 |
) |
|
|
(22,447 |
) |
|
|
(75,881 |
) |
|
|
118,195 |
|
|
|
(70,592 |
) |
Balance at
December 31, 2023 |
|
$ |
(45,744 |
) |
|
$ |
8,414 |
|
|
$ |
310,526 |
|
|
$ |
254,102 |
|
|
$ |
(1,041,499 |
) |
|
$ |
(514,201 |
) |
Other comprehensive
income (loss), net |
|
|
34,085 |
|
|
|
4,238 |
|
|
|
31,326 |
|
|
|
73,795 |
|
|
|
250,542 |
|
|
|
393,986 |
|
Balance at
December 31, 2024 |
|
$ |
(11,659 |
) |
|
$ |
12,652 |
|
|
$ |
341,852 |
|
|
$ |
327,897 |
|
|
$ |
(790,957 |
) |
|
$ |
(120,215 |
) |
Other comprehensive
income (loss), net |
|
|
2,327 |
|
|
|
5,880 |
|
|
|
(31,532 |
) |
|
|
(221,063 |
) |
|
|
(311,673 |
) |
|
|
(556,061 |
) |
Balance at
December 31, 2025 |
|
$ |
(9,332 |
) |
|
$ |
18,532 |
|
|
$ |
310,320 |
|
|
$ |
106,834 |
|
|
$ |
(1,102,630 |
) |
|
$ |
(676,276 |
) |
(1)We estimate an additional expense of $1.9 million will be reclassified to Interest Expense in the Consolidated Statements of Income over the next 12 months from December 31, 2025, due to the amortization of settled derivatives designated as cash flow hedges.
(2)Reclassification of amounts out of AOCI/L due to the remeasurement of the unhedged portion of our euro denominated and Chinese renminbi-denominated debt and accrued interest is included within other comprehensive income (loss), net.
Fair Value Measurements
We have estimated the fair value of our financial instruments using available market information and valuation methodologies we believe to be appropriate for these purposes. Considerable judgment and a high degree of subjectivity are involved in developing these estimates and, accordingly, they are not necessarily indicative of amounts that we would realize on disposition. See Note 2 for more information on our fair value measurements policy.
Fair Value Measurements on a Recurring Basis
At December 31, 2025 and 2024, other than the derivatives discussed previously, we had no significant financial assets or financial liabilities that were measured at fair value on a recurring basis in the Consolidated Financial Statements. All of our derivatives held at December 31, 2025 and 2024 were classified as Level 2 of the fair value hierarchy.
Fair Value Measurements on Nonrecurring Basis
Acquired properties, assets we expect to sell or contribute and assets subject to impairment charges are significant nonfinancial assets that met the criteria to be measured at fair value on a nonrecurring basis, as detailed in our accounting policy in Note 2. At December 31, 2025 and 2024, we estimated the fair value of our properties using Level 2 or Level 3 inputs from the fair value hierarchy. See more information on our acquired properties in Note 3 and assets held for sale or contribution in Note 5.
Fair Value of Financial Instruments
At December 31, 2025 and 2024, the carrying amounts of certain financial instruments, including cash and cash equivalents, accounts and notes receivable, accounts payable and accrued expenses were representative of their fair values.
The differences in the fair value of our debt from the carrying value in the table below were the result of differences in interest rates or borrowing spreads that were available to us at December 31, 2025 and 2024, as compared with those in effect when the debt was issued or assumed, including lower borrowing spreads due to our credit ratings. See Note 7 for more information on our debt activity.
The following table reflects the carrying amounts and estimated fair values of our debt at December 31 (in thousands):
|
|
|
|
|
|
|
|
|
|
|
|
|
|
|
|
|
|
|
2025 |
|
|
2024 |
|
|
|
Carrying Value |
|
|
Fair Value |
|
|
Carrying Value |
|
|
Fair Value |
|
Credit facilities and commercial paper |
|
$ |
44,679 |
|
|
$ |
44,679 |
|
|
$ |
224,966 |
|
|
$ |
224,966 |
|
Senior notes |
|
|
32,887,971 |
|
|
|
30,950,062 |
|
|
|
28,322,163 |
|
|
|
26,095,901 |
|
Term loans and unsecured other |
|
|
1,908,723 |
|
|
|
1,862,065 |
|
|
|
2,013,317 |
|
|
|
1,991,934 |
|
Secured mortgage |
|
|
195,700 |
|
|
|
185,965 |
|
|
|
318,817 |
|
|
|
298,452 |
|
Total |
|
$ |
35,037,073 |
|
|
$ |
33,042,771 |
|
|
$ |
30,879,263 |
|
|
$ |
28,611,253 |
|
NOTE 15. COMMITMENTS AND CONTINGENCIES
Environmental Matters
A majority of the properties we acquire, including land, are subjected to environmental reviews either by us or the previous owners. In addition, we may incur environmental remediation costs associated with certain land parcels we acquire in connection with the development of the land. We have acquired certain properties that may have been leased to or previously owned by companies that discharged hazardous materials. We establish a liability at the time of acquisition to cover such costs and adjust the liabilities as appropriate when additional information becomes available. We record our environmental liabilities in Other Liabilities in the Consolidated Balance Sheets. We purchase various environmental insurance policies to mitigate our exposure to environmental liabilities. We are not aware of any environmental liabilities that would have a material adverse effect on our business, financial condition or results of operations.
Off-Balance Sheet Liabilities
We have entered into agreements, principally performance and surety bonds and standby letters of credit in connection with certain development and renewable energy projects. These agreements are commonly required by public agencies, including utilities, from real estate and renewable energy asset developers. They are renewable and expire on the completion of the improvements and infrastructure. We typically enter into performance and surety bonds that have terms of four years and standby letters of credit that have terms of a year to an indefinite period of time. At December 31, 2025 and 2024, we had $739.5 million and $684.1 million, respectively, outstanding under such arrangements.
We may be required under capital commitments or may choose to make additional capital contributions to certain of our unconsolidated entities, representing our proportionate ownership interest, if needed to fund development or acquisition costs, repayment of debt or operational shortfalls. At December 31, 2025, we did not guarantee any third-party debt of the unconsolidated co-investment ventures. See Note 4 for further discussion related to equity commitments to our unconsolidated co-investment ventures.
Litigation
From time to time, we are party to a variety of legal proceedings arising in the ordinary course of business. We believe that, with respect to any such matters that we are currently a party to, the ultimate disposition of any such matter will not have material adverse effect on our business, financial position or results of operations.
NOTE 16. REPORTABLE SEGMENTS
Our current business strategy includes two reportable segments: Real Estate (Rental Operations and Development) and Strategic Capital. We generate revenues, earnings, net operating income and cash flows through our segments, as follows:
•Real Estate Segment. This reportable segment represents the ownership and development of operating properties and is the largest component of our revenue and earnings. We collect rent from our customers through operating leases, including reimbursements for the majority of our property operating costs. The Real Estate Segment also includes development activities that lead to rental operations, including land held for development and properties currently under development, and other real estate investments, including renewable energy assets.
•Strategic Capital Segment. This reportable segment represents the management of unconsolidated co-investment ventures. We generate strategic capital revenues primarily from our unconsolidated co-investment ventures through asset management and property management services and we earn additional revenues by providing leasing, acquisition, construction, development, financing and disposition services. Depending on the structure of the venture and the returns provided to our partners, we also earn revenues through promotes periodically during the life of a venture or upon liquidation.
Our management Executive Committee (“EC”) is our Chief Operating Decision Maker (“CODM”) and regularly reviews operating results and makes strategic and operating decisions with regards to assessing performance and allocating resources based on our two reportable segments. At December 31, 2025, the EC consisted of the Chief Executive Officer; Chief Operating Officer; Chief Financial Officer; President; Chief Human Resources Officer; Chief Legal Officer; Chief Energy and Sustainability Officer and Managing Director, Global Strategic Capital. The operating results reviewed by the EC include net operating income (“NOI”), the measure most consistent with U.S. GAAP.
NOI from the Real Estate Segment is calculated directly from the Consolidated Statements of Income as Rental Revenues and Development Management and Other Revenues less Rental Expenses and Other Expenses.
NOI from the Strategic Capital Segment is calculated directly from the Consolidated Statements of Income as Strategic Capital Revenues less Strategic Capital Expenses.
Our EC analyzes the NOI of each reportable segment on a quarterly basis comparing actuals to prior period actuals, along with forecasted future amounts and utilizes operating metrics to understand and evaluate the performance of our operations and to allocate resources.
Below we present: (i) each reportable segment’s revenues from external customers to Total Revenues; (ii) each reportable segment’s expenses to Total Expenses; (iii) each reportable segment’s net operating income from external customers, calculated as each reportable segment's revenues less segment expenses, to Operating Income and Earnings Before Income Taxes; and (iv) each reportable segment’s assets to Total Assets.
The applicable components of Total Revenues, Total Expenses, Operating Income, Earnings Before Income Taxes and Total Assets in the Consolidated Financial Statements are allocated to each reportable segment’s revenues, expenses, net operating income and assets.
Items that are not directly assignable to a reportable segment, are not allocated but reflected as non-segment items (general and administrative expenses and real estate adjustments for depreciation and gains and losses on contributions and sales) due to how our CODM utilizes segment information for planning and execution of our business strategy.
The following reportable segment net operating income and assets are presented in thousands:
|
|
|
|
|
|
|
|
|
|
|
|
|
|
|
Years Ended December 31, |
|
|
|
2025 |
|
|
2024 |
|
|
2023 |
|
Revenues: |
|
|
|
|
|
|
|
|
|
Real estate segment: |
|
|
|
|
|
|
|
|
|
U.S. |
|
$ |
7,802,692 |
|
|
$ |
7,216,817 |
|
|
$ |
6,558,051 |
|
Other Americas |
|
|
192,653 |
|
|
|
137,893 |
|
|
|
110,305 |
|
Europe |
|
|
136,930 |
|
|
|
115,103 |
|
|
|
95,915 |
|
Asia |
|
|
65,499 |
|
|
|
59,890 |
|
|
|
58,966 |
|
Total real estate segment |
|
|
8,197,774 |
|
|
|
7,529,703 |
|
|
|
6,823,237 |
|
Strategic capital segment: |
|
|
|
|
|
|
|
|
|
U.S. |
|
|
198,986 |
|
|
|
296,995 |
|
|
|
833,402 |
|
Other Americas |
|
|
89,961 |
|
|
|
92,307 |
|
|
|
89,783 |
|
Europe |
|
|
218,818 |
|
|
|
194,530 |
|
|
|
181,651 |
|
Asia |
|
|
84,588 |
|
|
|
88,075 |
|
|
|
95,396 |
|
Total strategic capital segment |
|
|
592,353 |
|
|
|
671,907 |
|
|
|
1,200,232 |
|
|
|
|
|
|
|
|
|
|
|
Total revenues |
|
|
8,790,127 |
|
|
|
8,201,610 |
|
|
|
8,023,469 |
|
|
|
|
|
|
|
|
|
|
|
Expenses: |
|
|
|
|
|
|
|
|
|
Real estate segment: |
|
|
|
|
|
|
|
|
|
U.S. (1) |
|
|
(1,873,652 |
) |
|
|
(1,714,071 |
) |
|
|
(1,603,486 |
) |
Other Americas |
|
|
(38,556 |
) |
|
|
(28,953 |
) |
|
|
(25,383 |
) |
Europe |
|
|
(75,224 |
) |
|
|
(46,759 |
) |
|
|
(27,715 |
) |
Asia |
|
|
(22,734 |
) |
|
|
(22,646 |
) |
|
|
(21,563 |
) |
Total real estate segment |
|
|
(2,010,166 |
) |
|
|
(1,812,429 |
) |
|
|
(1,678,147 |
) |
Strategic capital segment: |
|
|
|
|
|
|
|
|
|
U.S. (1) |
|
|
(131,960 |
) |
|
|
(154,654 |
) |
|
|
(204,066 |
) |
Other Americas |
|
|
(21,575 |
) |
|
|
(21,833 |
) |
|
|
(27,018 |
) |
Europe |
|
|
(72,689 |
) |
|
|
(75,500 |
) |
|
|
(103,025 |
) |
Asia |
|
|
(44,293 |
) |
|
|
(39,869 |
) |
|
|
(51,433 |
) |
Total strategic capital segment |
|
|
(270,517 |
) |
|
|
(291,856 |
) |
|
|
(385,542 |
) |
|
|
|
|
|
|
|
|
|
|
Total expenses |
|
|
(2,280,683 |
) |
|
|
(2,104,285 |
) |
|
|
(2,063,689 |
) |
|
|
|
|
|
|
|
|
|
|
Segment net operating income: |
|
|
|
|
|
|
|
|
|
Real estate segment: |
|
|
|
|
|
|
|
|
|
U.S. (1) |
|
|
5,929,040 |
|
|
|
5,502,746 |
|
|
|
4,954,565 |
|
Other Americas |
|
|
154,097 |
|
|
|
108,940 |
|
|
|
84,922 |
|
Europe |
|
|
61,706 |
|
|
|
68,344 |
|
|
|
68,200 |
|
Asia |
|
|
42,765 |
|
|
|
37,244 |
|
|
|
37,403 |
|
Total real estate segment |
|
|
6,187,608 |
|
|
|
5,717,274 |
|
|
|
5,145,090 |
|
Strategic capital segment: |
|
|
|
|
|
|
|
|
|
U.S. (1) |
|
|
67,026 |
|
|
|
142,341 |
|
|
|
629,336 |
|
Other Americas |
|
|
68,386 |
|
|
|
70,474 |
|
|
|
62,765 |
|
Europe |
|
|
146,129 |
|
|
|
119,030 |
|
|
|
78,626 |
|
Asia |
|
|
40,295 |
|
|
|
48,206 |
|
|
|
43,963 |
|
Total strategic capital segment |
|
|
321,836 |
|
|
|
380,051 |
|
|
|
814,690 |
|
|
|
|
|
|
|
|
|
|
|
Total segment net operating income |
|
|
6,509,444 |
|
|
|
6,097,325 |
|
|
|
5,959,780 |
|
|
|
|
|
|
|
|
|
|
|
Non-segment items: |
|
|
|
|
|
|
|
|
|
General and administrative expenses |
|
|
(469,114 |
) |
|
|
(418,765 |
) |
|
|
(390,406 |
) |
Depreciation and amortization expenses |
|
|
(2,626,028 |
) |
|
|
(2,580,519 |
) |
|
|
(2,484,891 |
) |
Gains on dispositions of development properties and land, net |
|
|
257,731 |
|
|
|
413,743 |
|
|
|
462,270 |
|
Gains on other dispositions of investments in real estate, net |
|
|
685,831 |
|
|
|
904,136 |
|
|
|
161,039 |
|
Operating income |
|
|
4,357,864 |
|
|
|
4,415,920 |
|
|
|
3,707,792 |
|
|
|
|
|
|
|
|
|
|
|
Earnings from unconsolidated entities, net |
|
|
402,531 |
|
|
|
353,623 |
|
|
|
307,227 |
|
Interest expense |
|
|
(1,002,344 |
) |
|
|
(863,932 |
) |
|
|
(641,332 |
) |
Foreign currency, derivative and other gains (losses) and other
income (expense), net |
|
|
14,763 |
|
|
|
208,731 |
|
|
|
87,221 |
|
Gains (losses) on early extinguishment of debt, net |
|
|
(3,498 |
) |
|
|
536 |
|
|
|
3,275 |
|
Earnings before income taxes |
|
$ |
3,769,316 |
|
|
$ |
4,114,878 |
|
|
$ |
3,464,183 |
|
|
|
|
|
|
|
|
|
|
|
|
December 31, |
|
|
|
2025 |
|
|
2024 |
|
Segment assets: |
|
|
|
|
|
|
Real estate segment: |
|
|
|
|
|
|
U.S. |
|
$ |
77,986,597 |
|
|
$ |
76,857,293 |
|
Other Americas |
|
|
3,215,779 |
|
|
|
2,814,141 |
|
Europe |
|
|
3,218,384 |
|
|
|
2,554,514 |
|
Asia |
|
|
1,100,273 |
|
|
|
719,810 |
|
Total real estate segment |
|
|
85,521,033 |
|
|
|
82,945,758 |
|
Strategic capital segment: (2) |
|
|
|
|
|
|
U.S. |
|
|
6,893 |
|
|
|
10,499 |
|
Europe |
|
|
25,280 |
|
|
|
25,280 |
|
Asia |
|
|
307 |
|
|
|
167 |
|
Total strategic capital segment |
|
|
32,480 |
|
|
|
35,946 |
|
Total segment assets |
|
|
85,553,513 |
|
|
|
82,981,704 |
|
|
|
|
|
|
|
|
Non-segment items: |
|
|
|
|
|
|
Investments in and advances to unconsolidated entities |
|
|
11,093,936 |
|
|
|
10,079,448 |
|
Assets held for sale or contribution |
|
|
203,344 |
|
|
|
248,511 |
|
Cash and cash equivalents |
|
|
1,145,647 |
|
|
|
1,318,591 |
|
Other assets |
|
|
727,816 |
|
|
|
700,655 |
|
Total non-segment items |
|
|
13,170,743 |
|
|
|
12,347,205 |
|
Total assets |
|
$ |
98,724,256 |
|
|
$ |
95,328,909 |
|
(1)This includes compensation and personnel costs for employees who were located in the U.S. but also support other geographies.
(2)Represents management contracts and goodwill recorded in connection with business combinations associated with the Strategic Capital Segment. Goodwill was $25.3 million at December 31, 2025, and 2024.
NOTE 17. SUPPLEMENTAL CASH FLOW INFORMATION
Our significant noncash investing and financing activities for the years ended December 31, 2025, 2024 and 2023 included the following:
•We recognized lease right-of-use assets and lease liabilities related to leases in which we are the lessee within Other Assets and Other Liabilities on the Consolidated Balance Sheets, including any new leases, renewals and modifications of $80.4 million in 2025, $67.7 million in 2024 and $43.0 million in 2023 for both assets and liabilities.
•We capitalized $34.0 million, $42.9 million and $38.6 million in 2025, 2024 and 2023, respectively, of equity-based compensation expense.
•We received $453.7 million, $1.0 billion and $379.1 million of ownership interests in certain unconsolidated co-investment ventures, primarily as a portion of our proceeds from the contribution of properties to these entities during 2025, 2024 and 2023, respectively.
•We issued 2.4 million, 1.4 million and 0.8 million shares in 2025, 2024 and 2023, respectively, of the Parent’s common stock upon redemption of an equal number of common limited partnership units in the OP.
•We reinvested a distribution from an unconsolidated co-investment venture of $49.2 million and $51.1 million in 2025 and 2024, respectively.
•We recognized a $150.1 million liability for installment payments related to an acquisition of land in 2024. This liability was paid in full in March 2025.
•We acquired the ownership interest of our partner in an unconsolidated venture in 2024 and began consolidating the properties.
NOTE 18. SELECTED QUARTERLY FINANCIAL DATA (UNAUDITED)
The following table details our selected quarterly financial data (in thousands, except per share and unit data):
|
|
|
|
|
|
|
|
|
|
|
|
|
|
|
|
|
|
|
Three Months Ended |
|
Prologis, Inc. |
|
March 31, |
|
|
June 30, |
|
|
September 30, |
|
|
December 31, |
|
2025: |
|
|
|
|
|
|
|
|
|
|
|
|
Rental revenues |
|
$ |
1,987,265 |
|
|
$ |
2,025,332 |
|
|
$ |
2,054,200 |
|
|
$ |
2,092,107 |
|
Total revenues |
|
$ |
2,139,665 |
|
|
$ |
2,183,869 |
|
|
$ |
2,213,881 |
|
|
$ |
2,252,712 |
|
Rental expenses |
|
$ |
(488,317 |
) |
|
$ |
(487,963 |
) |
|
$ |
(484,635 |
) |
|
$ |
(503,222 |
) |
Gains on dispositions of development properties and land, net |
|
$ |
27,451 |
|
|
$ |
10,477 |
|
|
$ |
15,435 |
|
|
$ |
204,368 |
|
Gains on other dispositions of investments in real estate, net |
|
$ |
36,799 |
|
|
$ |
47,044 |
|
|
$ |
32,235 |
|
|
$ |
569,753 |
|
Operating income |
|
$ |
878,413 |
|
|
$ |
912,712 |
|
|
$ |
940,261 |
|
|
$ |
1,626,478 |
|
Consolidated net earnings |
|
$ |
639,520 |
|
|
$ |
622,304 |
|
|
$ |
821,260 |
|
|
$ |
1,482,215 |
|
Net earnings attributable to common stockholders |
|
$ |
591,501 |
|
|
$ |
569,724 |
|
|
$ |
762,897 |
|
|
$ |
1,398,227 |
|
Net earnings per share attributable to common
stockholders – Basic (1) |
|
$ |
0.64 |
|
|
$ |
0.61 |
|
|
$ |
0.82 |
|
|
$ |
1.50 |
|
Net earnings per share attributable to common
stockholders – Diluted (1)(2) |
|
$ |
0.63 |
|
|
$ |
0.61 |
|
|
$ |
0.82 |
|
|
$ |
1.49 |
|
2024: |
|
|
|
|
|
|
|
|
|
|
|
|
Rental revenues |
|
$ |
1,827,658 |
|
|
$ |
1,852,376 |
|
|
$ |
1,897,164 |
|
|
$ |
1,937,507 |
|
Total revenues |
|
$ |
1,956,621 |
|
|
$ |
2,007,954 |
|
|
$ |
2,036,389 |
|
|
$ |
2,200,646 |
|
Rental expenses |
|
$ |
(454,257 |
) |
|
$ |
(445,235 |
) |
|
$ |
(427,425 |
) |
|
$ |
(438,468 |
) |
Gains on dispositions of development properties and land, net |
|
$ |
40,308 |
|
|
$ |
87,174 |
|
|
$ |
32,005 |
|
|
$ |
254,256 |
|
Gains on other dispositions of investments in real estate, net |
|
$ |
17,534 |
|
|
$ |
199,326 |
|
|
$ |
434,446 |
|
|
$ |
252,830 |
|
Operating income |
|
$ |
720,355 |
|
|
$ |
1,023,338 |
|
|
$ |
1,250,971 |
|
|
$ |
1,421,256 |
|
Consolidated net earnings |
|
$ |
630,807 |
|
|
$ |
911,501 |
|
|
$ |
1,063,451 |
|
|
$ |
1,342,176 |
|
Net earnings attributable to common stockholders |
|
$ |
584,263 |
|
|
$ |
859,845 |
|
|
$ |
1,004,267 |
|
|
$ |
1,277,379 |
|
Net earnings per share attributable to common
stockholders – Basic (1) |
|
$ |
0.63 |
|
|
$ |
0.93 |
|
|
$ |
1.08 |
|
|
$ |
1.38 |
|
Net earnings per share attributable to common
stockholders – Diluted (1)(2) |
|
$ |
0.63 |
|
|
$ |
0.92 |
|
|
$ |
1.08 |
|
|
$ |
1.37 |
|
|
|
|
|
|
|
|
|
|
|
|
|
|
Prologis, L.P. |
|
|
|
|
|
|
|
|
|
|
|
|
2025: |
|
|
|
|
|
|
|
|
|
|
|
|
Rental revenues |
|
$ |
1,987,265 |
|
|
$ |
2,025,332 |
|
|
$ |
2,054,200 |
|
|
$ |
2,092,107 |
|
Total revenues |
|
$ |
2,139,665 |
|
|
$ |
2,183,869 |
|
|
$ |
2,213,881 |
|
|
$ |
2,252,712 |
|
Rental expenses |
|
$ |
(488,317 |
) |
|
$ |
(487,963 |
) |
|
$ |
(484,635 |
) |
|
$ |
(503,222 |
) |
Gains on dispositions of development properties and land, net |
|
$ |
27,451 |
|
|
$ |
10,477 |
|
|
$ |
15,435 |
|
|
$ |
204,368 |
|
Gains on other dispositions of investments in real estate, net |
|
$ |
36,799 |
|
|
$ |
47,044 |
|
|
$ |
32,235 |
|
|
$ |
569,753 |
|
Operating income |
|
$ |
878,413 |
|
|
$ |
912,712 |
|
|
$ |
940,261 |
|
|
$ |
1,626,478 |
|
Consolidated net earnings |
|
$ |
639,520 |
|
|
$ |
622,304 |
|
|
$ |
821,260 |
|
|
$ |
1,482,215 |
|
Net earnings attributable to common unitholders |
|
$ |
606,492 |
|
|
$ |
583,660 |
|
|
$ |
781,562 |
|
|
$ |
1,431,639 |
|
Net earnings per unit attributable to common unitholders –
Basic (1) |
|
$ |
0.64 |
|
|
$ |
0.61 |
|
|
$ |
0.82 |
|
|
$ |
1.50 |
|
Net earnings per unit attributable to common unitholders –
Diluted (1) |
|
$ |
0.63 |
|
|
$ |
0.61 |
|
|
$ |
0.82 |
|
|
$ |
1.49 |
|
2024: |
|
|
|
|
|
|
|
|
|
|
|
|
Rental revenues |
|
$ |
1,827,658 |
|
|
$ |
1,852,376 |
|
|
$ |
1,897,164 |
|
|
$ |
1,937,507 |
|
Total revenues |
|
$ |
1,956,621 |
|
|
$ |
2,007,954 |
|
|
$ |
2,036,389 |
|
|
$ |
2,200,646 |
|
Rental expenses |
|
$ |
(454,257 |
) |
|
$ |
(445,235 |
) |
|
$ |
(427,425 |
) |
|
$ |
(438,468 |
) |
Gains on dispositions of development properties and land, net |
|
$ |
40,308 |
|
|
$ |
87,174 |
|
|
$ |
32,005 |
|
|
$ |
254,256 |
|
Gains on other dispositions of investments in real estate, net |
|
$ |
17,534 |
|
|
$ |
199,326 |
|
|
$ |
434,446 |
|
|
$ |
252,830 |
|
Operating income |
|
$ |
720,355 |
|
|
$ |
1,023,338 |
|
|
$ |
1,250,971 |
|
|
$ |
1,421,256 |
|
Consolidated net earnings |
|
$ |
630,807 |
|
|
$ |
911,501 |
|
|
$ |
1,063,451 |
|
|
$ |
1,342,176 |
|
Net earnings attributable to common unitholders |
|
$ |
599,047 |
|
|
$ |
881,196 |
|
|
$ |
1,029,271 |
|
|
$ |
1,309,348 |
|
Net earnings per unit attributable to common unitholders –
Basic (1) |
|
$ |
0.63 |
|
|
$ |
0.93 |
|
|
$ |
1.08 |
|
|
$ |
1.38 |
|
Net earnings per unit attributable to common unitholders –
Diluted (1) |
|
$ |
0.63 |
|
|
$ |
0.92 |
|
|
$ |
1.08 |
|
|
$ |
1.37 |
|
(1)Quarterly earnings per common share or unit amounts may not total to the annual amounts due to rounding and the changes in the number of weighted average common shares or units outstanding included in the calculation of basic and diluted shares or units.
(2)Income allocated to the exchangeable OP units not held by the Parent has been included in the numerator and exchangeable OP units have been included in the denominator for the purpose of computing diluted earnings per share for all periods since the per share and unit is the same.
PROLOGIS, INC. AND PROLOGIS, L.P.
SCHEDULE III – REAL ESTATE AND ACCUMULATED DEPRECIATION
DECEMBER 31, 2025
(In thousands of U.S. dollars, as applicable)
|
|
|
|
|
|
|
|
|
|
|
|
|
|
|
|
|
|
|
|
|
|
|
|
|
|
|
|
|
|
|
Initial Cost to
Prologis |
|
Costs
Capitalized |
|
Gross Amounts at Which Carried
at December 31, 2025 |
|
|
|
|
Description |
No. of Bldgs. |
|
Encum-
brances |
Land |
|
Building &
Improvements |
|
Subsequent
to
Acquisition |
|
Land |
|
Building &
Improvements |
|
Total
(a,b) |
|
Accumulated
Depreciation
(c) |
|
Date of
Construction/
Acquisition |
Operating Properties |
|
|
|
|
|
|
|
|
|
|
|
|
|
|
|
|
|
|
|
|
|
|
|
|
|
|
|
|
|
|
|
|
|
|
|
|
|
U.S. Markets |
|
|
|
|
|
|
|
|
|
|
|
|
|
|
|
|
|
|
Atlanta |
|
179 |
|
|
|
818,772 |
|
|
2,332,278 |
|
|
690,610 |
|
|
844,653 |
|
|
2,997,007 |
|
|
3,841,660 |
|
|
(693,293 |
) |
1994-2025 |
Austin |
|
10 |
|
|
|
12,783 |
|
|
52,335 |
|
|
12,970 |
|
|
12,837 |
|
|
65,251 |
|
|
78,088 |
|
|
(35,427 |
) |
1994-2015 |
Baltimore/Washington |
|
100 |
|
|
|
579,978 |
|
|
1,124,537 |
|
|
371,412 |
|
|
597,835 |
|
|
1,478,092 |
|
|
2,075,927 |
|
|
(351,901 |
) |
1995-2025 |
Central PA |
|
34 |
|
|
|
301,047 |
|
|
1,003,135 |
|
|
271,710 |
|
|
318,813 |
|
|
1,257,079 |
|
|
1,575,892 |
|
|
(356,011 |
) |
2004-2025 |
Central Valley |
|
40 |
|
|
|
260,486 |
|
|
546,344 |
|
|
1,028,945 |
|
|
279,681 |
|
|
1,556,094 |
|
|
1,835,775 |
|
|
(420,938 |
) |
1999-2023 |
Charlotte |
|
39 |
|
|
|
110,021 |
|
|
285,551 |
|
|
130,599 |
|
|
121,092 |
|
|
405,079 |
|
|
526,171 |
|
|
(126,504 |
) |
1994-2023 |
Chicago |
|
229 |
|
|
|
1,136,438 |
|
|
3,057,225 |
|
|
866,849 |
|
|
1,162,027 |
|
|
3,898,485 |
|
|
5,060,512 |
|
|
(1,191,553 |
) |
1995-2025 |
Cincinnati |
|
59 |
|
|
|
154,451 |
|
|
832,424 |
|
|
185,443 |
|
|
162,096 |
|
|
1,010,222 |
|
|
1,172,318 |
|
|
(205,468 |
) |
1996-2023 |
Columbus |
|
34 |
|
|
|
78,965 |
|
|
429,338 |
|
|
113,029 |
|
|
82,215 |
|
|
539,117 |
|
|
621,332 |
|
|
(165,380 |
) |
1996-2022 |
Dallas/Ft. Worth |
|
222 |
|
|
|
1,031,385 |
|
|
2,873,762 |
|
|
843,139 |
|
|
1,052,417 |
|
|
3,695,869 |
|
|
4,748,286 |
|
|
(875,445 |
) |
1994-2024 |
Denver |
|
35 |
|
|
|
97,827 |
|
|
295,412 |
|
|
185,920 |
|
|
97,928 |
|
|
481,231 |
|
|
579,159 |
|
|
(199,120 |
) |
1993-2022 |
Houston |
|
186 |
|
|
|
511,918 |
|
|
2,177,410 |
|
|
561,595 |
|
|
558,351 |
|
|
2,692,572 |
|
|
3,250,923 |
|
|
(611,515 |
) |
1993-2024 |
Indianapolis |
|
45 |
|
|
|
121,482 |
|
|
744,088 |
|
|
204,302 |
|
|
123,372 |
|
|
946,500 |
|
|
1,069,872 |
|
|
(172,780 |
) |
1995-2023 |
Las Vegas |
|
61 |
|
|
|
208,380 |
|
|
422,687 |
|
|
355,686 |
|
|
203,090 |
|
|
783,663 |
|
|
986,753 |
|
|
(198,448 |
) |
1996-2025 |
Lehigh Valley |
|
67 |
|
|
|
1,254,531 |
|
|
2,279,491 |
|
|
572,399 |
|
|
1,332,169 |
|
|
2,774,252 |
|
|
4,106,421 |
|
|
(572,905 |
) |
2004-2023 |
Louisville |
|
14 |
|
|
|
67,408 |
|
|
262,646 |
|
|
106,586 |
|
|
69,670 |
|
|
366,970 |
|
|
436,640 |
|
|
(114,445 |
) |
2005-2025 |
Nashville |
|
48 |
|
|
|
255,215 |
|
|
747,459 |
|
|
267,525 |
|
|
260,082 |
|
|
1,010,117 |
|
|
1,270,199 |
|
|
(170,821 |
) |
1995-2025 |
New Jersey/New York City |
|
161 |
|
(d) |
|
3,045,151 |
|
|
4,044,825 |
|
|
1,069,440 |
|
|
3,170,787 |
|
|
4,988,629 |
|
|
8,159,416 |
|
|
(1,242,645 |
) |
1996-2025 |
Orlando |
|
101 |
|
(d) |
|
296,155 |
|
|
838,595 |
|
|
324,926 |
|
|
300,206 |
|
|
1,159,470 |
|
|
1,459,676 |
|
|
(279,992 |
) |
1994-2025 |
Phoenix |
|
55 |
|
|
|
247,697 |
|
|
584,251 |
|
|
696,646 |
|
|
284,013 |
|
|
1,244,581 |
|
|
1,528,594 |
|
|
(234,509 |
) |
1992-2025 |
Portland |
|
41 |
|
(e) |
|
129,602 |
|
|
302,981 |
|
|
228,067 |
|
|
186,050 |
|
|
474,600 |
|
|
660,650 |
|
|
(128,724 |
) |
2006-2023 |
Raleigh Durham |
|
40 |
|
|
|
125,129 |
|
|
469,010 |
|
|
64,194 |
|
|
129,869 |
|
|
528,464 |
|
|
658,333 |
|
|
(70,150 |
) |
2020-2024 |
Reno |
|
20 |
|
|
|
55,869 |
|
|
190,340 |
|
|
240,360 |
|
|
57,950 |
|
|
428,619 |
|
|
486,569 |
|
|
(131,010 |
) |
1994-2025 |
San Antonio |
|
14 |
|
|
|
17,991 |
|
|
61,528 |
|
|
47,623 |
|
|
18,214 |
|
|
108,928 |
|
|
127,142 |
|
|
(61,866 |
) |
1994-2016 |
San Francisco Bay Area |
|
251 |
|
(d) |
|
1,391,172 |
|
|
1,931,407 |
|
|
985,448 |
|
|
1,409,692 |
|
|
2,898,335 |
|
|
4,308,027 |
|
|
(1,168,559 |
) |
1993-2025 |
Savannah |
|
27 |
|
|
|
225,576 |
|
|
522,311 |
|
|
43,976 |
|
|
225,465 |
|
|
566,398 |
|
|
791,863 |
|
|
(73,797 |
) |
2022-2023 |
Seattle |
|
110 |
|
|
|
930,218 |
|
|
1,412,326 |
|
|
568,120 |
|
|
959,107 |
|
|
1,951,557 |
|
|
2,910,664 |
|
|
(494,794 |
) |
2008-2025 |
South Florida |
|
175 |
|
(d) |
|
1,396,011 |
|
|
2,127,771 |
|
|
552,430 |
|
|
1,414,891 |
|
|
2,661,321 |
|
|
4,076,212 |
|
|
(600,010 |
) |
1994-2025 |
Southern California |
|
443 |
|
(e) |
|
7,264,221 |
|
|
8,478,436 |
|
|
2,943,260 |
|
|
7,547,560 |
|
|
11,138,357 |
|
|
18,685,917 |
|
|
(2,940,526 |
) |
2005-2025 |
Tampa |
|
26 |
|
|
|
92,357 |
|
|
244,738 |
|
|
42,021 |
|
|
99,091 |
|
|
280,025 |
|
|
379,116 |
|
|
(47,341 |
) |
2020-2022 |
Subtotal U.S. Markets: |
|
2,866 |
|
|
|
22,218,236 |
|
|
40,674,641 |
|
|
14,575,230 |
|
|
23,081,223 |
|
|
54,386,884 |
|
|
77,468,107 |
|
|
(13,935,877 |
) |
|
|
|
|
|
|
|
|
|
|
|
|
|
|
|
|
|
|
|
|
Other Americas Markets |
|
|
|
|
|
|
|
|
|
|
|
|
|
|
|
|
|
|
Brazil |
|
6 |
|
|
|
51,475 |
|
|
25,247 |
|
|
467 |
|
|
51,475 |
|
|
25,714 |
|
|
77,189 |
|
|
(1,227 |
) |
2022-2025 |
Canada |
|
40 |
|
|
|
445,268 |
|
|
586,164 |
|
|
421,810 |
|
|
461,096 |
|
|
992,146 |
|
|
1,453,242 |
|
|
(231,361 |
) |
2008-2025 |
Mexico |
|
3 |
|
|
|
22,233 |
|
|
2,287 |
|
|
32,864 |
|
|
22,236 |
|
|
35,148 |
|
|
57,384 |
|
|
(2,821 |
) |
2011-2025 |
Subtotal Other Americas Markets: |
|
49 |
|
|
|
518,976 |
|
|
613,698 |
|
|
455,141 |
|
|
534,807 |
|
|
1,053,008 |
|
|
1,587,815 |
|
|
(235,409 |
) |
|
|
|
|
|
|
|
|
|
|
|
|
|
|
|
|
|
|
|
|
Europe Markets |
|
|
|
|
|
|
|
|
|
|
|
|
|
|
|
|
|
|
Belgium |
|
4 |
|
|
|
27,765 |
|
|
5,261 |
|
|
42,760 |
|
|
27,685 |
|
|
48,101 |
|
|
75,786 |
|
|
(2,034 |
) |
2022-2025 |
Czech Republic |
|
3 |
|
|
|
5,947 |
|
|
- |
|
|
40,916 |
|
|
5,947 |
|
|
40,916 |
|
|
46,863 |
|
|
(1,524 |
) |
2023-2025 |
France |
|
1 |
|
|
|
2,766 |
|
|
- |
|
|
36,690 |
|
|
2,550 |
|
|
36,906 |
|
|
39,456 |
|
|
(2,115 |
) |
2023 |
Germany |
|
3 |
|
|
|
39,713 |
|
|
7,787 |
|
|
2,212 |
|
|
39,708 |
|
|
10,004 |
|
|
49,712 |
|
|
(8,658 |
) |
2011-2022 |
Hungary |
|
3 |
|
|
|
8,320 |
|
|
- |
|
|
33,128 |
|
|
8,320 |
|
|
33,128 |
|
|
41,448 |
|
|
(1,834 |
) |
2022-2023 |
Italy |
|
1 |
|
|
|
3,245 |
|
|
- |
|
|
6,874 |
|
|
3,331 |
|
|
6,788 |
|
|
10,119 |
|
|
(99 |
) |
2025 |
Netherlands |
|
3 |
|
|
|
25,607 |
|
|
3,886 |
|
|
1,363 |
|
|
25,607 |
|
|
5,249 |
|
|
30,856 |
|
|
(1,565 |
) |
2023 |
Poland |
|
1 |
|
|
|
7,731 |
|
|
- |
|
|
34,942 |
|
|
7,847 |
|
|
34,826 |
|
|
42,673 |
|
|
(1,514 |
) |
2023 |
Slovakia |
|
3 |
|
|
|
6,161 |
|
|
- |
|
|
29,376 |
|
|
5,308 |
|
|
30,229 |
|
|
35,537 |
|
|
(1,711 |
) |
2021-2025 |
Spain |
|
6 |
|
|
|
18,252 |
|
|
38,011 |
|
|
48,789 |
|
|
17,389 |
|
|
87,663 |
|
|
105,052 |
|
|
(27,490 |
) |
2011-2023 |
Sweden |
|
2 |
|
|
|
38,913 |
|
|
- |
|
|
39,539 |
|
|
38,980 |
|
|
39,472 |
|
|
78,452 |
|
|
(1,668 |
) |
2023-2024 |
United Kingdom |
|
17 |
|
|
|
288,905 |
|
|
27,350 |
|
|
158,886 |
|
|
303,392 |
|
|
171,749 |
|
|
475,141 |
|
|
(11,990 |
) |
2019-2025 |
Subtotal Europe Markets: |
|
47 |
|
|
|
473,325 |
|
|
82,295 |
|
|
475,475 |
|
|
486,064 |
|
|
545,031 |
|
|
1,031,095 |
|
|
(62,202 |
) |
|
|
|
|
|
|
|
|
|
|
|
|
|
|
|
|
|
|
|
|
Asia Markets |
|
|
|
|
|
|
|
|
|
|
|
|
|
|
|
|
|
|
Japan |
|
10 |
|
|
|
78,415 |
|
|
11,522 |
|
|
215,284 |
|
|
79,500 |
|
|
225,721 |
|
|
305,221 |
|
|
(19,450 |
) |
2019-2025 |
Singapore |
|
5 |
|
|
|
- |
|
|
143,497 |
|
|
6,833 |
|
|
- |
|
|
150,330 |
|
|
150,330 |
|
|
(98,215 |
) |
2011 |
India |
|
2 |
|
|
|
13,855 |
|
|
3,297 |
|
|
1,300 |
|
|
13,854 |
|
|
4,598 |
|
|
18,452 |
|
|
(81 |
) |
2025 |
Subtotal Asia Markets: |
|
17 |
|
|
|
92,270 |
|
|
158,316 |
|
|
223,417 |
|
|
93,354 |
|
|
380,649 |
|
|
474,003 |
|
|
(117,746 |
) |
|
Total Operating Properties |
|
2,979 |
|
|
|
23,302,807 |
|
|
41,528,950 |
|
|
15,729,263 |
|
|
24,195,448 |
|
|
56,365,572 |
|
|
80,561,020 |
|
|
(14,351,234 |
) |
|
PROLOGIS, INC. AND PROLOGIS, L.P.
SCHEDULE III – REAL ESTATE AND ACCUMULATED DEPRECIATION
DECEMBER 31, 2025
(In thousands of U.S. dollars, as applicable)
|
|
|
|
|
|
|
|
|
|
|
|
|
|
|
|
|
|
|
|
|
|
|
|
|
|
|
|
|
|
|
Initial Cost to
Prologis |
|
Costs
Capitalized |
|
Gross Amounts at Which Carried
at December 31, 2025 |
|
|
|
Date of |
Description |
No. of Bldgs. |
|
Encum-
brances |
Land |
|
Building &
Improvements |
|
Subsequent
to
Acquisition |
|
Land |
|
Building &
Improvements |
|
Total
(a,b) |
|
Accumulated
Depreciation
(c) |
|
Construction/
Acquisition
(f) |
Development Portfolio |
|
|
|
|
|
|
|
|
|
|
|
|
|
|
|
|
|
|
|
|
|
|
|
|
|
|
|
|
|
|
|
|
|
|
|
|
|
U.S. Markets |
|
|
|
|
|
|
|
|
|
|
|
|
|
|
|
|
|
|
Atlanta |
|
3 |
|
|
|
64,890 |
|
|
- |
|
|
113,282 |
|
|
64,890 |
|
|
113,282 |
|
|
178,172 |
|
|
|
|
Austin |
|
2 |
|
|
|
118,447 |
|
|
- |
|
|
330,578 |
|
|
118,447 |
|
|
330,578 |
|
|
449,025 |
|
|
|
|
Baltimore/Washington |
|
4 |
|
|
|
12,756 |
|
|
- |
|
|
22,932 |
|
|
12,756 |
|
|
22,932 |
|
|
35,688 |
|
|
|
|
Central Valley |
|
4 |
|
|
|
55,632 |
|
|
- |
|
|
186,589 |
|
|
55,632 |
|
|
186,589 |
|
|
242,221 |
|
|
|
|
Cincinnati |
|
1 |
|
|
|
520 |
|
|
- |
|
|
5,623 |
|
|
520 |
|
|
5,623 |
|
|
6,143 |
|
|
|
|
Houston |
|
1 |
|
|
|
12,743 |
|
|
- |
|
|
21,088 |
|
|
12,743 |
|
|
21,088 |
|
|
33,831 |
|
|
|
|
Las Vegas |
|
1 |
|
|
|
3,299 |
|
|
- |
|
|
65,837 |
|
|
3,299 |
|
|
65,837 |
|
|
69,136 |
|
|
|
2025 |
Nashville |
|
3 |
|
|
|
34,671 |
|
|
- |
|
|
70,782 |
|
|
34,671 |
|
|
70,782 |
|
|
105,453 |
|
|
|
2025 |
New Jersey/New York City |
|
1 |
|
|
|
118,064 |
|
|
- |
|
|
47,521 |
|
|
118,064 |
|
|
47,521 |
|
|
165,585 |
|
|
|
|
Orlando |
|
2 |
|
|
|
8,763 |
|
|
- |
|
|
12,803 |
|
|
8,763 |
|
|
12,803 |
|
|
21,566 |
|
|
|
2025 |
Portland |
|
2 |
|
|
|
14,129 |
|
|
- |
|
|
34,011 |
|
|
14,129 |
|
|
34,011 |
|
|
48,140 |
|
|
|
2025 |
San Francisco Bay Area |
|
2 |
|
|
|
32,289 |
|
|
- |
|
|
68,749 |
|
|
32,289 |
|
|
68,749 |
|
|
101,038 |
|
|
|
2025 |
Seattle |
|
1 |
|
|
|
15,184 |
|
|
- |
|
|
9,873 |
|
|
15,184 |
|
|
9,873 |
|
|
25,057 |
|
|
|
|
South Florida |
|
2 |
|
|
|
27,717 |
|
|
- |
|
|
39,237 |
|
|
27,717 |
|
|
39,237 |
|
|
66,954 |
|
|
|
2025 |
Southern California |
|
3 |
|
|
|
119,208 |
|
|
- |
|
|
56,067 |
|
|
119,208 |
|
|
56,067 |
|
|
175,275 |
|
|
|
2025 |
Subtotal U.S. Markets: |
|
32 |
|
|
|
638,312 |
|
|
- |
|
|
1,084,972 |
|
|
638,312 |
|
|
1,084,972 |
|
|
1,723,284 |
|
|
|
|
|
|
|
|
|
|
|
|
|
|
|
|
|
|
|
|
|
|
|
Other Americas Markets |
|
|
|
|
|
|
|
|
|
|
|
|
|
|
|
|
|
|
Canada |
|
3 |
|
|
|
57,235 |
|
|
- |
|
|
139,433 |
|
|
57,235 |
|
|
139,433 |
|
|
196,668 |
|
|
|
2025 |
Mexico |
|
5 |
|
|
|
54,145 |
|
|
- |
|
|
88,405 |
|
|
54,145 |
|
|
88,405 |
|
|
142,550 |
|
|
|
2025 |
Subtotal Other Americas Markets: |
|
8 |
|
|
|
111,380 |
|
|
- |
|
|
227,838 |
|
|
111,380 |
|
|
227,838 |
|
|
339,218 |
|
|
|
|
|
|
|
|
|
|
|
|
|
|
|
|
|
|
|
|
|
|
|
Europe Markets |
|
|
|
|
|
|
|
|
|
|
|
|
|
|
|
|
|
|
France |
|
2 |
|
|
|
11,243 |
|
|
- |
|
|
60,675 |
|
|
11,243 |
|
|
60,675 |
|
|
71,918 |
|
|
|
2025 |
Germany |
|
2 |
|
|
|
9,371 |
|
|
- |
|
|
689 |
|
|
9,371 |
|
|
689 |
|
|
10,060 |
|
|
|
|
Italy |
|
5 |
|
|
|
23,399 |
|
|
- |
|
|
25,921 |
|
|
23,399 |
|
|
25,921 |
|
|
49,320 |
|
|
|
2025 |
Netherlands |
|
1 |
|
|
|
5,576 |
|
|
- |
|
|
27,700 |
|
|
5,576 |
|
|
27,700 |
|
|
33,276 |
|
|
|
2025 |
Poland |
|
2 |
|
|
|
5,680 |
|
|
- |
|
|
56,178 |
|
|
5,680 |
|
|
56,178 |
|
|
61,858 |
|
|
|
2025 |
United Kingdom |
|
11 |
|
|
|
130,010 |
|
|
- |
|
|
207,766 |
|
|
130,010 |
|
|
207,766 |
|
|
337,776 |
|
|
|
2025 |
Subtotal Europe Markets: |
|
23 |
|
|
|
185,279 |
|
|
- |
|
|
378,929 |
|
|
185,279 |
|
|
378,929 |
|
|
564,208 |
|
|
|
|
|
|
|
|
|
|
|
|
|
|
|
|
|
|
|
|
|
|
|
Asia Markets |
|
|
|
|
|
|
|
|
|
|
|
|
|
|
|
|
|
|
Japan |
|
7 |
|
|
|
69,454 |
|
|
- |
|
|
287,676 |
|
|
69,454 |
|
|
287,676 |
|
|
357,130 |
|
|
|
2025 |
India |
|
7 |
|
|
|
23,964 |
|
|
- |
|
|
11,205 |
|
|
23,964 |
|
|
11,205 |
|
|
35,169 |
|
|
|
|
Subtotal Asia Markets: |
|
14 |
|
|
|
93,418 |
|
|
- |
|
|
298,881 |
|
|
93,418 |
|
|
298,881 |
|
|
392,299 |
|
|
|
|
Total Development Portfolio |
|
77 |
|
|
|
1,028,389 |
|
|
- |
|
|
1,990,620 |
|
|
1,028,389 |
|
|
1,990,620 |
|
|
3,019,009 |
|
|
|
|
|
|
|
|
|
|
|
|
|
|
|
|
|
|
|
|
|
|
|
GRAND TOTAL |
|
3,056 |
|
|
|
24,331,196 |
|
|
41,528,950 |
|
|
17,719,883 |
|
|
25,223,837 |
|
|
58,356,192 |
|
|
83,580,029 |
|
|
(14,351,234 |
) |
|
Schedule III – Footnotes
(a)The following table reconciles real estate assets per Schedule III to the Consolidated Balance Sheets in Item 8. Financial Statements and Supplementary Data at December 31, 2025 (in thousands):
|
|
|
|
|
|
|
|
Total operating properties and development portfolio per Schedule III |
|
$ |
83,580,029 |
|
(g) |
|
Land |
|
|
4,888,153 |
|
|
|
Other real estate investments (i) |
|
|
6,661,174 |
|
|
|
Total per Consolidated Balance Sheets |
|
$ |
95,129,356 |
|
|
(i)Included in other real estate investments were principally: (i) land parcels we own and lease to third parties; (ii) renewable energy assets, including solar, electric vehicle charging and energy storage; (iii) non-strategic real estate assets that we do not intend to operate long term; (iv) newly developed and stabilized data centers; and (v) non-industrial real estate assets that we intend to redevelop as industrial properties or data centers.
(b)The aggregate cost for federal tax purposes at December 31, 2025, of our real estate assets was approximately $72 billion (unaudited).
(c)Real estate assets (excluding land balances) are depreciated over their estimated useful lives. These useful lives are generally 5 to 7 years for capital improvements, 10 years for standard tenant improvements, 15 to 25 years for depreciable land improvements, 25 to 40 years for operating properties acquired based on the age of the building and 40 years for operating properties we develop.
The following table reconciles accumulated depreciation per Schedule III to the Consolidated Balance Sheets in Item 8. Financial Statements and Supplementary Data at December 31, 2025 (in thousands):
|
|
|
|
|
|
|
|
Total accumulated depreciation per Schedule III |
|
$ |
14,351,234 |
|
(g) |
|
Accumulated depreciation on other real estate investments (i) |
|
|
377,915 |
|
|
|
Total per Consolidated Balance Sheets |
|
$ |
14,729,149 |
|
|
(i)Accumulated depreciation in other real estate investments includes the categories of real estate defined in footnote (a)(i) above.
(d)Properties with an aggregate undepreciated cost of $405.3 million secure $145.9 million of mortgage notes. See Note 7 to the Consolidated Financial Statements in Item 8. Financial Statements and Supplementary Data for more information related to our secured mortgage debt.
(e)Assessment bonds of $6.9 million are secured by assessments (similar to property taxes) on various underlying real estate properties with an aggregate undepreciated cost of $364.4 million. The assessment bonds are included in term loans and unsecured other debt in Note 7 to the Consolidated Financial Statements in Item 8. Financial Statements and Supplementary Data.
(f)Date of construction is provided for properties in the development portfolio that were completed but not yet stabilized.
(g)The following table summarizes our real estate assets and accumulated depreciation per Schedule III for the years ended December 31 (in thousands):
|
|
|
|
|
|
|
|
|
|
|
|
|
|
|
|
|
2025 |
|
|
2024 |
|
|
2023 |
|
|
Real estate assets: |
|
|
|
|
|
|
|
|
|
|
Balance at beginning of year |
|
$ |
81,108,966 |
|
|
$ |
79,802,952 |
|
|
$ |
73,250,949 |
|
|
Acquisitions of and improvements to operating properties, development
activity and net effect of changes in foreign exchange rates and other |
|
|
3,505,148 |
|
|
|
5,627,171 |
|
|
|
7,138,283 |
|
|
Basis of operating properties disposed of |
|
|
(1,166,772 |
) |
|
|
(2,481,169 |
) |
|
|
(404,914 |
) |
|
Change in the development portfolio balance, including the acquisition of
properties |
|
|
189,396 |
|
|
|
(1,537,842 |
) |
|
|
155,301 |
|
|
Assets transferred to and from held for sale and contribution |
|
|
(56,709 |
) |
|
|
(302,146 |
) |
|
|
(336,667 |
) |
|
Balance at end year |
|
$ |
83,580,029 |
|
|
$ |
81,108,966 |
|
|
$ |
79,802,952 |
|
|
|
|
|
|
|
|
|
|
|
|
|
Accumulated depreciation: |
|
|
|
|
|
|
|
|
|
|
Balance at beginning of year |
|
$ |
12,450,545 |
|
|
$ |
10,654,290 |
|
|
$ |
8,815,724 |
|
|
Depreciation expense |
|
|
2,011,907 |
|
|
|
1,925,386 |
|
|
|
1,837,145 |
|
|
Balances retired upon disposition of operating properties and net effect of
changes in foreign exchange rates and other |
|
|
(99,157 |
) |
|
|
(120,513 |
) |
|
|
7,697 |
|
|
Assets transferred to and from held for sale and contribution |
|
|
(12,061 |
) |
|
|
(8,618 |
) |
|
|
(6,276 |
) |
|
Balance at end of year |
|
$ |
14,351,234 |
|
|
$ |
12,450,545 |
|
|
$ |
10,654,290 |
|
Certain of the following documents are filed herewith. Certain other of the following documents that have been previously filed with the Securities and Exchange Commission and, pursuant to Rule 12b-32, are incorporated herein by reference.
|
|
|
2.1‡ |
|
Agreement and Plan of Merger, dated as of June 11, 2022, by and among the Prologis Parties and the DRE Parties (incorporated by reference to Exhibit 2.1 to Prologis’ Current Report on Form 8-K filed on June 13, 2022). |
2.2 |
|
Letter Agreement, dated as of September 16, 2022, by and among the Prologis Parties and the DRE Parties (incorporated by reference to Exhibit 2.1 to Prologis' Current Report on Form 8-K filed on September 16, 2022). |
3.1† |
|
Articles of Incorporation of Prologis. |
3.2 |
|
Articles Supplementary establishing and fixing the rights and preferences of the Series Q Cumulative Redeemable Preferred Stock of Prologis (incorporated by reference to Exhibit 3.4 to Prologis’ Registration Statement on Form 8-A filed on June 2, 2011). |
3.3 |
|
Articles of Merger of New Pumpkin Inc., a Maryland corporation, with and into Prologis, Inc., a Maryland corporation, changing the name of “AMB Property Corporation” to “Prologis, Inc.”, as filed with the State Department of Assessments and Taxation of Maryland on June 2, 2011, and effective June 3, 2011 (incorporated by reference to Exhibit 3.1 to Prologis’ Current Report on Form 8-K filed on June 8, 2011). |
3.4 |
|
Articles of Amendment (incorporated by reference to Exhibit 3.1 to Prologis’ Current Report on Form 8-K filed on May 8, 2012). |
3.5 |
|
Thirteenth Amended and Restated Agreement of Limited Partnership of the Operating Partnership (incorporated by reference to Exhibit 3.6 to Prologis’ Current Report on Form 8-K filed on June 8, 2011). |
3.6 |
|
First Amendment to Thirteenth Amended and Restated Agreement of Limited Partnership of Prologis, L.P., dated as of February 27, 2014 (incorporated by reference to Exhibit 3.1 to Prologis’ Current Report on Form 8-K filed on February 27, 2014). |
3.7 |
|
Second Amendment to the Thirteenth Amended and Restated Agreement of the Limited Partnership of Prologis, L.P., dated as of October 7, 2015 (incorporated by reference to Exhibit 3.1 to Prologis’ Current Report on Form 8-K filed on October 13, 2015). |
3.8 |
|
Amended and Restated Certificate of Limited Partnership of the Operating Partnership (incorporated by reference to Exhibit 3.7 to Prologis’ Current Report on Form 8-K filed on June 8, 2011). |
3.9 |
|
Articles Supplementary, dated as of April 3, 2014 (incorporated by reference to Exhibit 3.1 to Prologis’ Current Report on Form 8-K filed on April 3, 2014). |
3.10 |
|
Third Amendment to Thirteenth Amended and Restated Agreement of Limited Partnership of Prologis, L.P. (incorporated by reference to Exhibit 3.1 to Prologis’ Current Report on Form 8-K filed on February 4, 2020). |
3.11 |
|
Prologis, Inc. Articles of Amendment, dated as of May 4, 2020 (incorporated by reference to Exhibit 3.1 to Prologis’ Current Report on Form 8-K filed on May 4, 2020). |
3.12 |
|
Fourth Amendment to Thirteenth Amended and Restated Agreement of Limited Partnership of Prologis, L.P., dated as of April 27, 2023 (incorporated by reference to Exhibit 3.1 to Prologis' Quarterly Report on Form 10-Q for the quarter ended March 31, 2023 filed on April 28, 2023). |
3.13 |
|
Prologis, Inc. Articles of Amendment, dated as of May 10, 2024 (incorporated by reference to Exhibit 3.1 to Prologis’ Current Report on Form 8-K filed on May 14, 2024). |
3.14 |
|
Eleventh Amended and Restated Bylaws of Prologis, Inc. (incorporated by reference to Exhibit 3.1 to Prologis’ Current Report on Form 8-K filed on February 21, 2025). |
4.1† |
|
Description of Registrant’s Securities Registered Pursuant to Section 12 of the Securities Exchange Act of 1934. |
4.2 |
|
Form of Certificate for Common Stock of Prologis (incorporated by reference to Exhibit 4.1 to Prologis’ Registration Statement on Form S-4/A (No. 333-172741) filed on April 12, 2011). |
4.3 |
|
Form of Certificate for the Series Q Cumulative Redeemable Preferred Stock of Prologis (incorporated by reference to Exhibit 4.2 to Prologis’ Registration Statement on Form S-4/A (No. 333-172741) filed on April 28, 2011). |
4.4 |
|
Indenture, dated as of June 8, 2011, by and among the Operating Partnership, as issuer, Prologis, as guarantor, and U.S. Bank National Association, as trustee (incorporated by reference to Exhibit 4.2 to Prologis’ Registration Statement on Form S-3 (No. 333-177112) filed on September 30, 2011). |
|
|
|
|
|
|
4.5 |
|
Fifth Supplemental Indenture, dated as of August 15, 2013, among Prologis, Inc., Prologis, L.P. and U.S. Bank National Association (incorporated by reference to Exhibit 4.1 to Prologis’ Current Report on Form 8-K filed on August 15, 2013). |
4.6 |
|
Form of Sixth Supplemental Indenture among Prologis, Inc., Prologis, L.P., Elavon Financial Services Limited, UK Branch, Elavon Financial Services Limited and U.S. Bank National Association (incorporated by reference to Exhibit 4.1 to Prologis’ Current Report on Form 8-K filed on December 2, 2013). |
4.7 |
|
Form of Seventh Supplemental Indenture among Prologis, Inc., Prologis, L.P., Elavon Financial Services Limited, UK Branch, Elavon Financial Services Limited and U.S. Bank National Association (incorporated by reference to Exhibit 4.1 to Prologis’ Current Report on Form 8-K filed on February 18, 2014). |
4.8 |
|
Form of Eighth Supplemental Indenture among Prologis, Inc., Prologis, L.P., U.S. Bank National Association and Elavon Financial Services DAC, UK Branch (incorporated by reference to Exhibit 4.1 to Prologis’ Current Report on Form 8-K filed on June 6, 2017). |
4.9 |
|
Indenture, dated as of August 1, 2018, among Prologis Euro Finance LLC, Prologis, L.P. and U.S. Bank National Association, as trustee (incorporated by reference to Exhibit 4.1 to Prologis’ Current Report on Form 8-K/A filed on August 1, 2018). |
4.10 |
|
First Supplemental Indenture, dated as of August 1, 2018, among Prologis Euro Finance LLC, Prologis, L.P., U.S. Bank National Association, as trustee, transfer agent and security registrar and Elavon Financial Services DAC, UK Branch, as paying agent (incorporated by reference to Exhibit 4.2 to Prologis’ Current Report on Form 8-K/A filed on August 1, 2018). |
4.11 |
|
Form of Indenture, dated as of September 25, 2018, among Prologis Yen Finance LLC, Prologis, L.P. and U.S. Bank National Association, as trustee (incorporated by reference to Exhibit 4.9 to Prologis’ Current Report on Form 8-K/A filed on September 24, 2018). |
4.12 |
|
Form of First Supplemental Indenture, dated as of September 25, 2018, among Prologis Yen Finance LLC, Prologis, L.P., U.S. Bank National Association, as trustee, transfer agent, paying agent and security registrar (incorporated by reference to Exhibit 4.10 to Prologis’ Current Report on Form 8-K/A filed on September 24, 2018). |
4.13 |
|
Second Supplemental Indenture, dated as of March 26, 2019, among Prologis Yen Finance LLC, Prologis, L.P. and U.S. Bank National Association as trustee, transfer agent, paying agent and security registrar (incorporated by reference to Exhibit 4.1 to Prologis’ Quarterly Report on Form 10-Q for the quarter ended March 31, 2019 filed on April 23, 2019). |
4.14 |
|
Form of 3.00% Notes due 2026 (incorporated by reference to Exhibit 4.2 to Prologis’ Current Report on Form 8-K filed on May 28, 2014). |
4.15 |
|
Form of 2.250% Notes due 2029 (incorporated by reference to Exhibit 4.3 to Prologis’ Current Report on Form 8-K filed on June 6, 2017). |
4.16 |
|
Form of 3.875% Notes Due 2028 (incorporated by reference to Exhibit 4.1 to Prologis’ Current Report on Form 8-K filed on June 20, 2018). |
4.17 |
|
Form of 4.375% Notes Due 2048 (incorporated by reference to Exhibit 4.2 to Prologis’ Current Report on Form 8-K filed on June 20, 2018). |
4.18 |
|
Form of 1.875% Notes Due 2029 (incorporated by reference to Exhibit 4.4 to Prologis’ Current Report on Form 8-K filed on July 31, 2018). |
4.19 |
|
Form of 0.972% Notes due 2028 (incorporated by reference to Exhibit 4.2 to Prologis’ Current Report on Form 8-K/A filed on September 24, 2018). |
4.20 |
|
Form of 1.077% Notes due 2030 (incorporated by reference to Exhibit 4.3 to Prologis’ Current Report on Form 8-K/A filed on September 24, 2018). |
4.21 |
|
Form of 1.470% Notes due 2038 (incorporated by reference to Exhibit 4.4 to Prologis’ Current Report on Form 8-K/A filed on September 24, 2018). |
4.22 |
|
Form of 1.15% Notes due 2039 (incorporated by reference to Exhibit 4.2 to Prologis’ Quarterly Report on Form 10-Q for the quarter ended March 31, 2019 filed on April 23, 2019). |
4.23 |
|
Form of 0.250% Notes due 2027 (incorporated by reference to Exhibit 4.2 to Prologis’ Registration Statement 8-A12B filed on September 10, 2019). |
|
|
|
|
|
|
4.24 |
|
Form of 0.625% Notes due 2031 (incorporated by reference to Exhibit 4.4 to Prologis’ Registration Statement 8-A12B filed on September 10, 2019). |
4.25 |
|
Form of 1.500% Notes due 2049 (incorporated by reference to Exhibit 4.6 to Prologis’ Registration Statement 8-A12B filed on September 10, 2019). |
4.26 |
|
Form of Officers’ Certificate related to the 3.00% Notes due 2026 (incorporated by reference to Exhibit 4.1 to Prologis’ Current Report on Form 8-K filed on May 28, 2014). |
4.27 |
|
Form of Officers’ Certificate related to 2.250% Notes due 2029 (incorporated by reference to Exhibit 4.2 to Prologis’ Current Report on Form 8-K filed on June 6, 2017). |
4.28 |
|
Form of Officers’ Certificate related to 3.875% Notes Due 2028 (incorporated by reference to Exhibit 4.3 to Prologis’ Current Report on Form 8-K/A filed on June 20, 2018). |
4.29 |
|
Form of Officers’ Certificate related to 4.375% Notes Due 2048 (incorporated by reference to Exhibit 4.4 to Prologis’ Current Report on Form 8-K/A filed on June 20, 2018). |
4.30 |
|
Form of Officers’ Certificate related to 0.972% Notes due 2028 (incorporated by reference to Exhibit 4.6 to Prologis’ Current Report on Form 8-K/A filed on September 24, 2018). |
4.31 |
|
Form of Officers’ Certificate related to 1.077% Notes due 2030 (incorporated by reference to Exhibit 4.7 to Prologis’ Current Report on Form 8-K/A filed on September 24, 2018). |
4.32 |
|
Form of Officers’ Certificate related to 1.470% Notes due 2038 (incorporated by reference to Exhibit 4.8 to Prologis’ Current Report on Form 8-K/A filed on September 24, 2018). |
4.33 |
|
Form of Officers’ Certificate related to 1.875% Notes Due 2029 (incorporated by reference to Exhibit 4.3 to Prologis’ Current Report on Form 8-K/A filed on August 1, 2018). |
4.34 |
|
Form of Officers’ Certificate related to the 1.15% Notes due 2039 (incorporated by reference to Exhibit 4.3 to Prologis’ Quarterly Report on Form 10-Q for the quarter ended March 31, 2019 filed on April 23, 2019). |
4.35 |
|
Form of Officers’ Certificate related to the 0.250% Notes due 2027 (incorporated by reference to Exhibit 4.1 to Prologis’ Registration Statement 8-A12B filed on September 10, 2019). |
4.36 |
|
Form of Officers’ Certificate related to the 0.625% Notes due 2031 (incorporated by reference to Exhibit 4.3 to Prologis L.P.’s Registration Statement 8-A12B filed on September 10, 2019). |
4.37 |
|
Form of Officers’ Certificate related to the 1.500% Notes due 2049 (incorporated by reference to Exhibit 4.5 to Prologis L.P.’s Registration Statement 8-A12B filed on September 10, 2019). |
4.38 |
|
Form of Officers’ Certificate related to the 0.375% Notes due 2028 (incorporated by reference to Exhibit 4.1 to Prologis L.P.’s Registration Statement on Form 8-A12B filed on February 10, 2020). |
4.39 |
|
Form of 0.375% Notes due 2028 (incorporated by reference to Exhibit 4.2 to Prologis L.P.’s Registration Statement on Form 8-A12B filed on February 10, 2020). |
4.40 |
|
Form of Officers’ Certificate related to the 1.000% Notes due 2035 (incorporated by reference to Exhibit 4.3 to Prologis L.P.’s Registration Statement on Form 8-A12B filed on February 10, 2020). |
4.41 |
|
Form of 1.000% Notes due 2035 (incorporated by reference to Exhibit 4.4 to Prologis L.P.’s Registration Statement on Form 8-A12B filed on February 10, 2020). |
4.42 |
|
Form of Officers’ Certificate related to the 3.250% Notes due 2026 (incorporated by reference to Exhibit 4.1 to Prologis L.P.’s Current Report on Form 8-K filed on February 14, 2020). |
4.43 |
|
Form of 3.250% Notes due 2026 (incorporated by reference to Exhibit 4.2 to Prologis L.P.’s Current Report on Form 8-K filed on February 14, 2020). |
4.44 |
|
Form of Officers’ Certificate related to the 4.375% Notes due 2029 (incorporated by reference to Exhibit 4.3 to Prologis L.P.’s Current Report on Form 8-K filed on February 14, 2020). |
|
|
|
4.45 |
|
Form of 4.375% Notes due 2029 (incorporated by reference to Exhibit 4.4 to Prologis L.P.’s Current Report on Form 8-K filed on February 14, 2020). |
4.46 |
|
Form of Officers’ Certificate related to the 2.125% Notes due 2027 (incorporated by reference to Exhibit 4.5 to Prologis L.P.’s Current Report on Form 8-K filed on February 14, 2020). |
4.47 |
|
Form of 2.125% Notes due 2027 (incorporated by reference to Exhibit 4.6 to Prologis L.P.’s Current Report on Form 8-K filed on February 14, 2020). |
4.48 |
|
Form of Officers’ Certificate related to the 2.250% Notes due 2030 (incorporated by reference to Exhibit 4.7 to Prologis L.P.’s Current Report on Form 8-K filed on February 14, 2020). |
4.49 |
|
Form of 2.250% Notes due 2030 (incorporated by reference to Exhibit 4.8 to Prologis L.P.’s Current Report on Form 8-K filed on February 14, 2020). |
4.50 |
|
Form of Officers’ Certificate related to the 3.000% Notes due 2050 (incorporated by reference to Exhibit 4.9 to Prologis L.P.’s Current Report on Form 8-K filed on February 14, 2020). |
4.51 |
|
Form of 3.000% Notes due 2050 (incorporated by reference to Exhibit 4.10 to Prologis L.P.’s Current Report on Form 8-K filed on February 14, 2020). |
4.52 |
|
Form of Officers’ Certificate related to the 0.589% Notes due 2027 (incorporated by reference to Exhibit 4.1 to Prologis’ Current Report on Form 8-K filed on June 23, 2020). |
4.53 |
|
Form of 0.589% Notes due 2027 (incorporated by reference to Exhibit 4.2 to Prologis' Current Report on Form 8-K filed on June 23, 2020). |
4.54 |
|
Form of Officers’ Certificate related to the 0.850% Notes due 2030 (incorporated by reference to Exhibit 4.3 to Prologis’ Current Report on Form 8-K filed on June 23, 2020). |
4.55 |
|
Form of 0.850% Notes due 2030 (incorporated by reference to Exhibit 4.4 to Prologis' Current Report on Form 8-K filed on June 23, 2020). |
4.56 |
|
Form of Officers’ Certificate related to the 1.003% Notes due 2032 (incorporated by reference to Exhibit 4.5 to Prologis’ Current Report on Form 8-K filed on June 23, 2020). |
4.57 |
|
Form of 1.003% Notes due 2032 (incorporated by reference to Exhibit 4.6 to Prologis' Current Report on Form 8-K filed on June 23, 2020). |
4.58 |
|
Form of Officers’ Certificate related to the 1.222% Notes due 2035 (incorporated by reference to Exhibit 4.7 to Prologis’ Current Report on Form 8-K filed on June 23, 2020). |
4.59 |
|
Form of 1.222% Notes due 2035 (incorporated by reference to Exhibit 4.8 to Prologis' Current Report on Form 8-K filed on June 23, 2020). |
4.60 |
|
Form of Officers’ Certificate related to the 1.600% Notes due 2050 (incorporated by reference to Exhibit 4.9 to Prologis’ Current Report on Form 8-K filed on June 23, 2020). |
4.61 |
|
Form of 1.600% Notes due 2050 (incorporated by reference to Exhibit 4.10 to Prologis' Current Report on Form 8-K filed on June 23, 2020). |
4.62 |
|
Form of Officers’ Certificate related to the 1.250% Notes due 2030 (incorporated by reference to Exhibit 4.1 to Prologis’ Current Report on Form 8-K filed on August 19, 2020). |
4.63 |
|
Form of 1.250% Notes due 2030 (incorporated by reference to Exhibit 4.2 to Prologis’ Current Report on Form 8-K filed on August 19, 2020). |
4.64 |
|
Form of Officers’ Certificate related to the 2.125% Notes due 2050 (incorporated by reference to Exhibit 4.3 to Prologis’ Current Report on Form 8-K filed on August 19, 2020). |
|
|
|
|
|
|
4.67 |
|
Form of 0.500% Notes due 2032 (incorporated by reference to Exhibit 4.2 to Prologis' Current Report on Form 8-K filed on February 16, 2021). |
4.68 |
|
Form of Officers’ Certificate related to the 1.000% Notes due 2041 (incorporated by reference to Exhibit 4.3 to Prologis’ Current Report on Form 8-K filed on February 16, 2021). |
4.69 |
|
Form of 1.000% Notes due 2041 (incorporated by reference to Exhibit 4.4 to Prologis' Current Report on Form 8-K filed on February 16, 2021). |
4.70 |
|
Form of Officers’ Certificate related to the 1.625% Notes due 2031 (incorporated by reference to Exhibit 4.1 to Prologis’ Current Report on Form 8-K filed on February 19, 2021). |
4.71 |
|
Form of 1.625% Notes due 2031 (incorporated by reference to Exhibit 4.2 to Prologis' Current Report on Form 8-K filed on February 19, 2021). |
4.72 |
|
Form of Officers’ Certificate related to the 0.448% Notes due 2028 (incorporated by reference to Exhibit 4.1 to Prologis’ Current Report on Form 8-K filed on June 28, 2021). |
4.73 |
|
Form of 0.448% Notes due 2028 (incorporated by reference to Exhibit 4.2 to Prologis' Current Report on Form 8-K filed on June 28, 2021). |
4.74 |
|
Form of Officers’ Certificate related to the 0.564% Notes due 2031 (incorporated by reference to Exhibit 4.3 to Prologis’ Current Report on Form 8-K filed on June 28, 2021). |
4.75 |
|
Form of 0.564% Notes due 2031 (incorporated by reference to Exhibit 4.4 to Prologis' Current Report on Form 8-K filed on June 28, 2021). |
4.76 |
|
Form of Officers’ Certificate related to the 0.885% Notes due 2036 (incorporated by reference to Exhibit 4.5 to Prologis’ Current Report on Form 8-K filed on June 28, 2021). |
4.77 |
|
Form of 0.885% Notes due 2036 (incorporated by reference to Exhibit 4.6 to Prologis' Current Report on Form 8-K filed on June 28, 2021). |
4.78 |
|
Form of Officers’ Certificate related to the 1.134% Notes due 2041 (incorporated by reference to Exhibit 4.7 to Prologis’ Current Report on Form 8-K filed on June 28, 2021). |
4.79 |
|
Form of 1.134% Notes due 2041 (incorporated by reference to Exhibit 4.8 to Prologis' Current Report on Form 8-K filed on June 28, 2021). |
4.80 |
|
Form of Officers’ Certificate related to the 1.550% Notes due 2061 (incorporated by reference to Exhibit 4.9 to Prologis’ Current Report on Form 8-K filed on June 28, 2021). |
4.81 |
|
Form of 1.550% Notes due 2061 (incorporated by reference to Exhibit 4.10 to Prologis' Current Report on Form 8-K filed on June 28, 2021). |
4.82 |
|
Form of Officers’ Certificate related to the 1.000% Notes due 2029 (incorporated by reference to Exhibit 4.3 to Prologis’ Current Report on Form 8-K filed on February 8, 2022). |
4.83 |
|
Form of 1.000% Notes due 2029 (incorporated by reference to Exhibit 4.4 to Prologis’ Current Report on Form 8-K filed on February 8, 2022). |
4.84 |
|
Form of Officers’ Certificate related to the 1.500% Notes due 2034 (incorporated by reference to Exhibit 4.5 to Prologis’ Current Report on Form 8-K filed on February 8, 2022). |
4.85 |
|
Form of 1.500% Notes due 2034 (incorporated by reference to Exhibit 4.6 to Prologis’ Current Report on Form 8-K filed on February 8, 2022). |
4.86 |
|
Form of Officers’ Certificate related to the 4.625% Notes due 2033 (incorporated by reference to Exhibit 4.1 to Prologis’ Current Report on Form 8-K filed on September 15, 2022). |
4.87 |
|
Form of 4.625% Notes due 2033 (incorporated by reference to Exhibit 4.2 to Prologis' Current Report on Form 8-K filed on September 15, 2022). |
4.88 |
|
Form of 3.250% Senior Notes due 2026 (incorporated by reference to Exhibit 4.1 to Prologis' Current Report on Form 8-K filed on October 6, 2022). |
|
|
|
4.89 |
|
Officers’ Certificate related to the 3.250% Senior Notes due 2026 (incorporated by reference to Exhibit 4.2 to Prologis' Current Report on Form 8-K filed on October 6, 2022). |
4.90 |
|
Form of 3.375% Senior Notes due 2027 (incorporated by reference to Exhibit 4.3 to Prologis' Current Report on Form 8-K filed on October 6, 2022). |
4.91 |
|
Officers’ Certificate related to the 3.375% Senior Notes due 2027 (incorporated by reference to Exhibit 4.4 to Prologis' Current Report on Form 8-K filed on October 6, 2022). |
4.92 |
|
Form of 7.250% Senior Notes due June 2028 (incorporated by reference to Exhibit 4.5 to Prologis' Current Report on Form 8-K filed on October 6, 2022). |
4.93 |
|
Officers’ Certificate related to the 7.250% Senior Notes due June 2028 (incorporated by reference to Exhibit 4.6 to Prologis' Current Report on Form 8-K filed on October 6, 2022). |
4.94 |
|
Form of 4.000% Senior Notes due September 2028 (incorporated by reference to Exhibit 4.7 to Prologis' Current Report on Form 8-K filed on October 6, 2022). |
4.95 |
|
Officers’ Certificate related to the 4.000% Senior Notes due September 2028 (incorporated by reference to Exhibit 4.8 to Prologis' Current Report on Form 8-K filed on October 6, 2022). |
4.96 |
|
Form of 2.875% Senior Notes due 2029 (incorporated by reference to Exhibit 4.9 to Prologis' Current Report on Form 8-K filed on October 6, 2022). |
4.97 |
|
Officers' Certificate related to the 2.875% Senior Notes due 2029 (incorporated by reference to Exhibit 4.10 to Prologis' Current Report on Form 8-K filed on October 6, 2022). |
4.98 |
|
Form of 1.750% Senior Notes due 2030 (incorporated by reference to Exhibit 4.11 to Prologis' Current Report on Form 8-K filed on October 6, 2022). |
4.99 |
|
Officers’ Certificate related to the 1.750% Senior Notes due 2030 (incorporated by reference to Exhibit 4.12 to Prologis' Current Report on Form 8-K filed on October 6, 2022). |
4.100 |
|
Form of 1.750% Senior Notes due 2031 (incorporated by reference to Exhibit 4.13 to Prologis' Current Report on Form 8-K filed on October 6, 2022). |
4.101 |
|
Officers’ Certificate related to the 1.750% Senior Notes due 2031 (incorporated by reference to Exhibit 4.14 to Prologis' Current Report on Form 8-K filed on October 6, 2022). |
4.102 |
|
Form of 2.250% Senior Notes due 2032 (incorporated by reference to Exhibit 4.15 to Prologis' Current Report on Form 8-K filed on October 6, 2022). |
4.103 |
|
Officers’ Certificate related to the 2.250% Senior Notes due 2032 (incorporated by reference to Exhibit 4.16 to Prologis' Current Report on Form 8-K filed on October 6, 2022). |
4.104 |
|
Form of 3.050% Senior Notes due 2050 (incorporated by reference to Exhibit 4.17 to Prologis' Current Report on Form 8-K filed on October 6, 2022). |
4.105 |
|
Officers’ Certificate related to the 3.050% Senior Notes due 2050 (incorporated by reference to Exhibit 4.18 to Prologis' Current Report on Form 8-K filed on October 6, 2022). |
4.106 |
|
Ninth Supplemental Indenture, dated as of November 3, 2022, by and among Prologis, L.P., Prologis, Inc. and U.S. Bank Trust Company, National Association (incorporated by reference to Exhibit 4.1 to Prologis' Current Report on Form 8-K filed on November 3, 2022). |
4.107 |
|
Form of Officers’ Certificate related to the 5.250% Notes due 2031 (incorporated by reference to Exhibit 4.2 to Prologis' Current Report on Form 8-K filed on November 3, 2022). |
4.108 |
|
Form of 5.250% Notes due 2031 (incorporated by reference to Exhibit 4.3 to Prologis' Current Report on Form 8-K filed on November 3, 2022). |
4.109 |
|
Form of Officers’ Certificate related to the 1.003% Notes due 2027 (incorporated by reference to Exhibit 4.1 to Prologis’ Current Report on Form 8-K filed on December 1, 2022). |
4.110 |
|
Form of 1.003% Notes due 2027 (incorporated by reference to Exhibit 4.2 to Prologis' Current Report on Form 8-K filed on December 1, 2022). |
|
|
|
|
|
|
4.111 |
|
Form of Officers’ Certificate related to the 1.323% Notes due 2029 (incorporated by reference to Exhibit 4.3 to Prologis' Current Report on Form 8-K filed on December 1, 2022). |
4.112 |
|
Form of 1.323% Notes due 2029 (incorporated by reference to Exhibit 4.4 to Prologis' Current Report on Form 8-K filed on December 1, 2022). |
4.113 |
|
Form of Officers’ Certificate related to the 1.903% Notes due 2037(incorporated by reference to Exhibit 4.5 to Prologis' Current Report on Form 8-K filed on December 1, 2022). |
4.114 |
|
Form of 1.903% Notes due 2037 (incorporated by reference to Exhibit 4.6 to Prologis' Current Report on Form 8-K filed on December 1, 2022). |
4.115 |
|
Form of Officers’ Certificate related to the 3.875% Notes due 2030 (incorporated by reference to Exhibit 4.1 to Prologis' Current Report on Form 8-K filed on January 31, 2023). |
4.116 |
|
Form of 3.875% Notes due 2030 (incorporated by reference to Exhibit 4.2 to Prologis' Current Report on Form 8-K filed on January 31, 2023). |
4.117 |
|
Form of Officers’ Certificate related to the 4.250% Notes due 2043 (incorporated by reference to Exhibit 4.3 to Prologis' Current Report on Form 8-K filed on January 31, 2023). |
4.118 |
|
Form of 4.250% Notes due 2043 (incorporated by reference to Exhibit 4.4 to Prologis' Current Report on Form 8-K filed on January 31, 2023). |
4.119 |
|
Form of Officers’ Certificate related to the 4.750% Notes due 2033 (incorporated by reference to Exhibit 4.1 to Prologis' Current Report on Form 8-K filed on March 30, 2023). |
4.120 |
|
Form of 4.750% Notes due 2033 (incorporated by reference to Exhibit 4.2 to Prologis' Current Report on Form 8-K filed on March 30, 2023). |
4.121 |
|
Form of Officers’ Certificate related to the 5.250% Notes due 2053 (incorporated by reference to Exhibit 4.3 to Prologis' Current Report on Form 8-K filed on March 30, 2023). |
4.122 |
|
Form of 5.250% Notes due 2053 (incorporated by reference to Exhibit 4.4 to Prologis' Current Report on Form 8-K filed on March 30, 2023). |
4.123 |
|
Form of Officers’ Certificate related to the 4.625% Notes due 2033 (incorporated by reference to Exhibit 4.1 to Prologis' Current Report on Form 8-K filed on May 23, 2023). |
4.124 |
|
Form of 4.625% Notes due 2033 (incorporated by reference to Exhibit 4.2 to Prologis' Current Report on Form 8-K filed on May 23, 2023). |
4.125 |
|
Form of Officers’ Certificate related to the 4.875% Notes due 2028 (incorporated by reference to Exhibit 4.1 to Prologis' Current Report on Form 8-K filed on June 28, 2023). |
4.126 |
|
Form of 4.875% Notes due 2028 (incorporated by reference to Exhibit 4.2 to Prologis' Current Report on Form 8-K filed on June 28, 2023). |
4.127 |
|
Form of Officers’ Certificate related to the 5.125% Notes due 2034 (incorporated by reference to Exhibit 4.3 to Prologis' Current Report on Form 8-K filed on June 28, 2023). |
4.128 |
|
Form of 5.125% Notes due 2034 (incorporated by reference to Exhibit 4.4 to Prologis' Current Report on Form 8-K filed on June 28, 2023). |
4.129 |
|
Form of Officers’ Certificate related to the 5.250% Notes due 2053 (incorporated by reference to Exhibit 4.5 to Prologis' Current Report on Form 8-K filed on June 28, 2023). |
4.130 |
|
Form of 5.250% Notes due 2053 (incorporated by reference to Exhibit 4.6 to Prologis' Current Report on Form 8-K filed on June 28, 2023). |
4.131 |
|
Form of Officers’ Certificate related to the 5.000% Notes due 2034 (incorporated by reference to Exhibit 4.1 to Prologis' Current Report on Form 8-K filed on January 25, 2024). |
|
|
|
4.132 |
|
Form of 5.000% Notes due 2034 (incorporated by reference to Exhibit 4.2 to Prologis' Current Report on Form 8-K filed on January 25, 2024). |
4.133 |
|
Form of Officers’ Certificate related to the 5.250% Notes due 2054 (incorporated by reference to Exhibit 4.3 to Prologis' Current Report on Form 8-K filed on January 25, 2024). |
4.134 |
|
Form of 5.250% Notes due 2054 (incorporated by reference to Exhibit 4.4 to Prologis' Current Report on Form 8-K filed on January 25, 2024). |
4.135 |
|
Form of Officers’ Certificate related to the 4.700% Notes due 2029 (incorporated by reference to Exhibit 4.1 to Prologis' Current Report on Form 8-K filed on March 1, 2024). |
4.136 |
|
Form of 4.700% Notes due 2029 (incorporated by reference to Exhibit 4.2 to Prologis' Current Report on Form 8-K filed on March 1, 2024). |
4.137 |
|
Form of Officers’ Certificate related to the 4.000% Notes due 2034 (incorporated by reference to Exhibit 4.1 to Prologis' Current Report on Form 8-K filed on May 7, 2024). |
4.138 |
|
Form of 4.000% Notes due 2034 (incorporated by reference to Exhibit 4.2 to Prologis' Current Report on Form 8-K filed on May 7, 2024). |
4.139 |
|
Form of Officers’ Certificate related to the 5.625% Notes due 2040 (incorporated by reference to Exhibit 4.3 to Prologis' Current Report on Form 8-K filed on May 7, 2024). |
4.140 |
|
Form of 5.625% Notes due 2040 (incorporated by reference to Exhibit 4.4 to Prologis' Current Report on Form 8-K filed on May 7, 2024). |
4.141 |
|
Form of Officers’ Certificate related to the 5.000% Notes due 2035 (incorporated by reference to Exhibit 4.1 to Prologis' Current Report on Form 8-K filed on July 23, 2024). |
4.142 |
|
Form of 5.000% Notes due 2035 (incorporated by reference to Exhibit 4.2 to Prologis' Current Report on Form 8-K filed on July 23, 2024). |
4.143 |
|
Form of Officers’ Certificate related to the 5.250% Notes due 2054 (incorporated by reference to Exhibit 4.3 to Prologis' Current Report on Form 8-K filed on July 23, 2024). |
4.144 |
|
Form of 5.250% Notes due 2054 (incorporated by reference to Exhibit 4.4 to Prologis' Current Report on Form 8-K filed on July 23, 2024). |
4.145 |
|
Form of Officers’ Certificate related to the 4.200% Notes due 2033 (incorporated by reference to Exhibit 4.1 to Prologis' Current Report on Form 8-K filed on February 4, 2025). |
4.146 |
|
Form of 4.200% Notes due 2033 (incorporated by reference to Exhibit 4.2 to Prologis' Current Report on Form 8-K filed on February 4, 2025). |
4.147 |
|
Form of Officers’ Certificate related to the 4.750% Notes due 2031 (incorporated by reference to Exhibit 4.1 to Prologis' Current Report on Form 8-K filed on May 7, 2025). |
4.148 |
|
Form of 4.750% Notes due 2031 (incorporated by reference to Exhibit 4.2 to Prologis' Current Report on Form 8-K filed on May 7, 2025). |
4.149 |
|
Form of Officers’ Certificate related to the 5.250% Notes due 2035 (incorporated by reference to Exhibit 4.3 to Prologis' Current Report on Form 8-K filed on May 7, 2025). |
4.150 |
|
Form of 5.250% Notes due 2035 (incorporated by reference to Exhibit 4.4 to Prologis' Current Report on Form 8-K filed on May 7, 2025). |
4.151 |
|
Form of Officers’ Certificate related to the 3.250% Notes due 2032 (incorporated by reference to Exhibit 4.1 to Prologis, Inc.’s Current Report on Form 8-K filed on September 22, 2025). |
4.152 |
|
Form of 3.250% Notes due 2032 (incorporated by reference to Exhibit 4.2 to Prologis, Inc.’s Current Report on Form 8-K filed on September 22, 2025). |
4.153 |
|
Form of Officers’ Certificate related to the 3.875% Notes due 2037 (incorporated by reference to Exhibit 4.3 to Prologis, Inc.’s Current Report on Form 8-K filed on September 22, 2025). |
Other debt instruments are omitted in accordance with Item 601(b)(4)(iii)(A) of Registration S-K. Copies of such instruments will be furnished to the Securities and Exchange Commission upon request.
|
|
|
10.1 |
|
Amended and Restated Agreement of Limited Partnership of ProLogis Fraser, L.P., dated as of August 4, 2004 (incorporated by reference to Exhibit 10.1 to the Trust’s Quarterly Report on Form 10-Q for the quarter ended September 30, 2004). |
10.2 |
|
Fifteenth Amended and Restated Agreement of Limited Partnership of Prologis 2, L.P., (f/k/a AMB Property II, L.P.) dated as of February 19, 2010 (incorporated by reference to Exhibit 10.6 to Prologis’ Annual Report on Form 10-K for the year ended December 31, 2009 filed on February 22, 2010). |
10.3* |
|
Amended and Restated 2002 Nonqualified Deferred Compensation Plan (incorporated by reference to Exhibit 10.2 to Prologis’ Current Report on Form 8-K filed October 4, 2006 and also incorporated by reference to Exhibit 10.2 to the Operating Partnership’s Current Report on Form 8-K filed on October 4, 2006). |
10.4* |
|
The Amended and Restated 2002 Stock Option and Incentive Plan of AMB Property Corporation and AMB Property, L.P. (incorporated by reference to Exhibit 10.1 to Prologis’ Current Report on Form 8-K filed on May 15, 2007 and also incorporated by reference to Exhibit 10.1 to the Operating Partnership’s Current Report on Form 8-K filed on May 15, 2007). |
10.5* |
|
Prologis Outperformance Plan (incorporated by reference to Exhibit 10.1 to Prologis’ Current Report on Form 8-K filed on December 22, 2011). |
10.6* |
|
Prologis, Inc. 2016 Outperformance Plan (incorporated by reference to Exhibit 10.1 to Prologis’ Current Report on Form 8-K filed on August 16, 2016). |
10.7* |
|
Form of Prologis, Inc. 2016 Outperformance Plan LTIP Unit Award Agreement (incorporated by reference to Exhibit 10.2 to Prologis’ Current Report on Form 8-K filed on August 16, 2016). |
10.8* |
|
Form of Participation Points and LTIP Unit Award Agreement (incorporated by reference to Exhibit 10.1 to Prologis’ Current Report on Form 8-K filed on February 27, 2014). |
10.9* |
|
Second Amended and Restated Prologis Promote Plan (incorporated by reference to Exhibit 10.1 to Prologis’ Current Report on Form 8-K filed on August 1, 2014). |
10.10* |
|
Form of Prologis, Inc. Second Amended and Restated Prologis Promote Plan LTIP Unit Award Agreement (incorporated by reference to Exhibit 10.1 to Prologis’ Current Report on Form 8-K filed on August 18, 2014). |
10.11* |
|
Form of Prologis, Inc. Long-Term Incentive Plan LTIP Unit Award Agreement (General) (incorporated by reference to Exhibit 10.3 to Prologis’ Quarterly Report on Form 10-Q for the quarter ended September 30, 2014 filed on November 4, 2014). |
10.12* |
|
Form of Prologis, Inc. 2012 Long-Term Incentive Plan Restricted Stock Unit Agreement (LTIP Unit election) (incorporated by reference to Exhibit 10.27 to Prologis’ Annual Report on Form 10-K for the year ended December 31, 2015 filed on February 19, 2016). |
10.13* |
|
Form of Prologis, Inc. 2012 Long-Term Incentive Plan Restricted Stock Unit Agreement (incorporated by reference to Exhibit 10.5 to Prologis’ Quarterly Report on Form 10-Q for the quarter ended September 30, 2014 filed on November 4, 2014). |
10.14* |
|
Form of Prologis, Inc. 2012 Long-Term Incentive Plan Restricted Stock Unit Agreement (Bonus exchange) (incorporated by reference to Exhibit 10.6 to Prologis’ Quarterly Report on Form 10-Q for the quarter ended September 30, 2014 filed on November 4, 2014). |
10.15* |
|
ProLogis 2006 Long-Term Incentive Plan (incorporated by reference to Exhibit 10.2 to the Trust’s Current Report on Form 8-K filed on June 2, 2006). |
|
|
|
10.16* |
|
First Amendment of the ProLogis 2006 Long-Term Incentive Plan (incorporated by reference to Exhibit 10.1 to the Trust’s Quarterly Report on Form 10-Q for the quarter ended March 31, 2010 filed on April 30, 2010). |
10.17* |
|
Second Amendment of the ProLogis 2006 Long-Term Incentive Plan (incorporated by reference to Exhibit 10.1 to the Trust’s Current Report on Form 8-K filed on May 19, 2010). |
10.18* |
|
Third Amendment of the ProLogis 2006 Long-Term Incentive Plan (incorporated by reference to Exhibit 10.1 to the Trust’s Quarterly Report on Form 10-Q for the quarter ended September 30, 2010 filed on November 11, 2010). |
10.19* |
|
Form of Non-Qualified Share Option Award Terms; The Trust 2006 Long-Term Incentive Plan (incorporated by reference to Exhibit 10.25 to the Trust’s Annual Report on Form 10-K for the year ended December 31, 2009 filed on February 19, 2010). |
10.20* |
|
Form of Restricted Share Award Terms; ProLogis 2006 Long-Term Incentive Plan (incorporated by reference to Exhibit 10.27 to the Trust’s Annual Report on Form 10-K for the year ended December 31, 2009 filed on February 19, 2010). |
10.21* |
|
Form of Performance Share Award Terms; ProLogis 2006 Long-Term Incentive Plan (incorporated by reference to Exhibit 10.26 to the Trust’s Annual Report on Form 10-K for the year ended December 31, 2009 filed on February 19, 2010). |
10.22* |
|
ProLogis 2000 Share Option Plan for Outside Trustees (as Amended and Restated Effective as of December 31, 2008) (incorporated by reference to exhibit 10.13 to ProLogis’ Annual Report on Form 10-K for the year ended December 31, 2008 filed on February 27, 2009). |
10.23* |
|
ProLogis Deferred Fee Plan for Trustees (As Amended and Restated Effective as of May 14, 2010) (incorporated by reference to exhibit 10.3 to ProLogis’ Current Report on Form 8-K filed on May 19, 2010). |
10.24† |
|
Form of Indemnification Agreement between Prologis and certain directors and executive officers. |
10.25* |
|
Form of Restricted Stock Unit Agreement; Prologis, Inc. 2012 Long-Term Incentive Plan (incorporated by reference to Exhibit 10.1 to Prologis’ Quarterly Report on Form 10-Q for the quarter ended September 30, 2012 filed on November 2, 2012). |
10.26* |
|
Prologis, Inc. 2012 Long-Term Incentive Plan (incorporated by reference to Exhibit 10.1 to Prologis’ Current Report on Form 8-K filed on May 8, 2012). |
10.27* |
|
Form of Director Deferred Stock Unit Award terms (incorporated by reference to Exhibit 10.2 to Prologis’ Current Report on Form 8-K filed on May 8, 2012). |
10.28* |
|
Form of Change of Control and Noncompetition Agreement by and between Prologis, Inc. and its executive officers (incorporated by reference to Exhibit 10.2 to Prologis’ Current Report on Form 8-K filed on August 16, 2013). |
10.29* |
|
Form of Prologis, Inc. Long-Term Incentive Plan LTIP Unit Award Agreement (General form 2015) (incorporated by reference to Exhibit 10.57 to Prologis’ Annual Report on Form 10-K for the year ended December 31, 2014 filed on February 25, 2015). |
10.30* |
|
Form of Prologis, Inc. Long-Term Incentive Plan LTIP Unit Award Agreement (Bonus exchange) (incorporated by reference to Exhibit 10.2 to Prologis’ Quarterly Report on Form 10-Q for the quarter ended March 31, 2015 filed on February 19, 2016). |
10.31* |
|
Form of Prologis, Inc. Long-Term Incentive Plan LTIP Unit Award Agreement (General form 2016) (incorporated by reference to Exhibit 10.48 to Prologis’ Annual Report on Form 10-K for the year ended December 31, 2015 filed on February 19, 2016). |
10.32* |
|
Form of Prologis, Inc. Outperformance Plan LTIP Unit Exchange Award Agreement (incorporated by reference to Exhibit 10.58 to Prologis’ Annual Report on Form 10-K for the year ended December 31, 2014 filed on February 25, 2015). |
10.33* |
|
Form of Prologis, Inc. Long-Term Incentive Plan Equity Exchange Offer LTIP Unit Award Agreement (incorporated by reference to Exhibit 10.59 to Prologis’ Annual Report on Form 10-K for the year ended December 31, 2014 filed on February 25, 2015). |
10.34* |
|
Amended and Restated Prologis, Inc. 2011 Notional Account Deferred Compensation Plan (incorporated by reference to Exhibit 10.60 to Prologis’ Annual Report on Form 10-K for the year ended December 31, 2014 filed on February 25, 2015). |
|
|
|
10.35* |
|
Amended and Restated Prologis, Inc. Nonqualified Deferred Compensation Plan (incorporated by reference to Exhibit 10.61 to Prologis’ Annual Report on Form 10-K for the year ended December 31, 2014 filed on February 25, 2015). |
10.36* |
|
Second Amended and Restated Prologis 2005 Nonqualified Deferred Compensation Plan (incorporated by reference to Exhibit 10.62 to Prologis’ Annual Report on Form 10-K for the year ended December 31, 2014 filed on February 25, 2015). |
10.37* |
|
Prologis, Inc. 2018 Outperformance Plan (incorporated by reference to Exhibit 10.1 to Prologis’ Current Report on Form 8-K filed on January 18, 2018). |
10.38* |
|
Prologis, Inc. Amended and Restated 2018 Outperformance Plan (incorporated by reference to Exhibit 10.1 to Prologis’ Current Report on Form 8-K filed on March 27, 2018). |
10.39* |
|
Form of Prologis, Inc. 2018 Amendment to Outperformance Plan LTIP Unit Award Agreements (incorporated by reference to Exhibit 10.2 to Prologis’ Current Report on Form 8-K filed on March 27, 2018). |
10.40* |
|
Amended and Restated Director Deferred Stock Unit Award Terms (incorporated by reference to Exhibit 10.1 to Prologis’ Current Report on Form 8-K filed on May 8, 2018). |
10.41* |
|
Prologis, Inc. Second Amended and Restated 2018 Outperformance Plan (incorporated by reference to Exhibit 10.1 to Prologis’ Current Report on Form 8-K filed on August 28, 2018). |
10.42* |
|
Form of Outperformance Plan LTIP Unit Award Agreement (incorporated by reference to Exhibit 10.2 to Prologis’ Current Report on Form 8-K filed on August 28, 2018). |
10.43* |
|
Form of LTIP Unit Award Agreement (Bonus Exchange) (incorporated by reference to Exhibit 10.3 to Prologis’ Current Report on Form 8-K filed on August 28, 2018). |
10.44* |
|
Form of LTIP Unit Award Agreement (Omnibus) (incorporated by reference to Exhibit 10.4 to Prologis’ Current Report on Form 8-K filed on August 28, 2018). |
10.45* |
|
Form of RSU Agreement (Global) (incorporated by reference to Exhibit 10.5 to Prologis’ Current Report on Form 8-K filed on August 28, 2018). |
10.46* |
|
Form of RSU Agreement (LTIP Unit Election) (incorporated by reference to Exhibit 10.6 to Prologis’ Current Report on Form 8-K filed on August 28, 2018). |
10.47* |
|
Letter Agreement, dated as of February 3, 2017, by and between Prologis, Inc. and Hamid R. Moghadam (incorporated by reference to Exhibit 10.1 to Prologis’ Current Report on Form 8-K filed on February 3, 2017). |
10.48 |
|
Term Loan Agreement, dated as of March 4, 2019, among Prologis GK Holdings Y.K., as borrower, Prologis, L.P., as guarantor, the lenders party thereto, and Sumitomo Mitsui Banking Corporation, as Administrative Agent (incorporated by reference to Exhibit 10.1 to Prologis’ Current Report on Form 8-K filed on March 6, 2019). |
10.49 |
|
Guaranty of Payment, dated as of March 4, 2019, between Prologis, L.P., as guarantor, and Sumitomo Mitsui Banking Corporation, as Administrative Agent, for the lenders that are from time to time parties to the Term Loan Agreement dated as of March 4, 2019 (incorporated by reference to Exhibit 10.2 to Prologis’ Current Report on Form 8-K filed on March 6, 2019). |
10.50* |
|
Amended and Restated Change in Control and Noncompetition Agreement, dated as of April 30, 2019, between Prologis, Inc. and Hamid R. Moghadam (incorporated by reference to Exhibit 10.1 to Prologis’ Current Report on Form 8-K filed on May 3, 2019). |
10.51* |
|
Prologis, Inc. 2020 Long-Term Incentive Plan (incorporated by reference to Exhibit 10.1 to Prologis’ Current Report on Form 8-K filed on May 4, 2020). |
10.52* |
|
Form of First Amendment to Amended and Restated Prologis, Inc. 2011 Notional Account Deferred Compensation Plan (incorporated by reference to Exhibit 10.1 to Prologis’ Current Report on Form 8-K filed on September 25, 2020). |
10.53* |
|
Form of LTIP Unit Award Agreement (Omnibus 2020) (incorporated by reference to Exhibit 10.2 to Prologis’ Current Report on Form 8-K filed on September 25, 2020). |
10.54* |
|
Form of LTIP Unit Award Agreement (Bonus Exchange 2020) (incorporated by reference to Exhibit 10.3 to Prologis’ Current Report on Form 8-K filed on September 25, 2020). |
10.55* |
|
Form of Outperformance Plan LTIP Unit Award Agreement for Named Executive Officers (2020) (incorporated by reference to Exhibit 10.4 to Prologis’ Current Report on Form 8-K filed on September 25, 2020). |
|
|
|
|
|
|
10.56* |
|
Form of Outperformance Plan LTIP Unit Award Agreement (General 2020) (incorporated by reference to Exhibit 10.5 to Prologis’ Current Report on Form 8-K filed on September 25, 2020). |
10.57* |
|
Form of Deferred Compensation LTIP Unit Award Agreement (2020) (incorporated by reference to Exhibit 10.6 to Prologis’ Current Report on Form 8-K filed on September 25, 2020). |
10.58* |
|
Form of RSU Agreement (Global 2020) (incorporated by reference to Exhibit 10.7 to Prologis’ Current Report on Form 8-K filed on September 25, 2020). |
10.59* |
|
Form of RSU Agreement (Bonus Exchange 2020) (incorporated by reference to Exhibit 10.8 to Prologis’ Current Report on Form 8-K filed on September 25, 2020). |
10.60* |
|
Form of RSU Agreement (LTIP Unit Election 2020) (incorporated by reference to Exhibit 10.9 to Prologis’ Current Report on Form 8-K filed on September 25, 2020). |
10.61 |
|
First Amendment to Term Loan Agreement, dated as of October 1, 2021, among Prologis GK Holdings Y.K, as borrower, Prologis, L.P., as guarantor, the lenders party thereto, and Sumitomo Mitsui Banking Corporation, as Administrative Agent (incorporated by reference to Exhibit 10.2 to Prologis’ Quarterly Report on Form 10-Q for the quarter ended September 30, 2021 filed on October 26, 2021). |
10.62* |
|
Third Amended and Restated Prologis Promote Plan (incorporated by reference to Exhibit 10.1 to Prologis’ Current Report on Form 8-K filed on December 2, 2021). |
10.63 |
|
Global Senior Credit Agreement, dated as of June 30, 2022, among Prologis, L.P., various affiliates of Prologis, L.P., various lenders and agents, and Bank of America, N.A., as Global Administrative Agent (incorporated by reference to Exhibit 10.1 to Prologis’ Current Report on Form 8-K filed July 6, 2022). |
10.64* |
|
Form of LTIP Unit Award Agreement (Omnibus 2022) (incorporated by reference to Exhibit 10.1 to Prologis’ Current Report on Form 8-K filed on September 27, 2022). |
10.65* |
|
Form of Third Amended and Restated Prologis 2005 Nonqualified Deferred Compensation Plan (incorporated by reference to Exhibit 10.1 to Prologis’ Current Report on Form 8-K filed on December 12, 2022). |
10.66* |
|
Form of Second Amended and Restated Prologis, Inc. 2011 Notional Account Deferred Compensation Plan (incorporated by reference to Exhibit 10.2 to Prologis’ Current Report on Form 8-K filed on December 12, 2022). |
10.67* |
|
Form of Second Amended and Restated Prologis, Inc. Nonqualified Deferred Compensation Plan (incorporated by reference to Exhibit 10.3 to Prologis’ Current Report on Form 8-K filed on December 12, 2022). |
10.68* |
|
Prologis Bonus Exchange 2022 LTIP Unit Award Agreement - Advance Grant No Pre-Retirement Election (incorporated by reference to Exhibit 10.83 to Prologis' Annual Report on Form 10-K filed for the year ended December 31, 2022 filed on February 14, 2023). |
10.69* |
|
Prologis Bonus Exchange 2022 LTIP Unit Award Agreement - Advance Grant Pre-Retirement Election (incorporated by reference to Exhibit 10.84 to Prologis’ Annual Report on Form 10-K for the year ended December 31, 2022 filed on February 14, 2023). |
10.70* |
|
Form of Change of Control and Noncompetition Agreement by and between Prologis, Inc. and its executive officers (incorporated by reference to Exhibit 10.2 to Prologis’ Current Report on Form 8-K filed on January 5, 2023). |
10.71* |
|
Form of Amended Agreement Relating to Retirement Eligibility and Vesting of Equity-Based Awards (incorporated by reference to Exhibit 10.2 to Prologis’ Quarterly Report on Form 10-Q for the quarter ended June 30, 2023 filed on July 26, 2023). |
10.72* |
|
Fourth Amended and Restated Prologis Promote Plan, dated as of June 30, 2023 (incorporated by reference to Exhibit 10.3 to Prologis' Quarterly Report on Form 10-Q for the quarter ended June 30, 2023 filed on July 26, 2023). |
10.73 |
|
Seventh Amended and Restated Revolving Credit Agreement, dated as of August 25, 2023, among Prologis Marunouchi Finance Investment Limited Partnership, as initial borrower, Prologis, L.P., as guarantor, the lenders listed on the signature pages thereof, and Sumitomo Mitsui Banking Corporation, as Administrative Agent (incorporated by reference to Exhibit 10.1 to Prologis' Current Report on Form 8-K filed on August 31, 2023). |
10.74 |
|
Guaranty of Payment, dated as of August 25, 2023, between Prologis, L.P., as guarantor, and Sumitomo Mitsui Banking Corporation, as Administrative Agent, for the banks that are from time to time parties to the Seventh Amended and Restated Revolving Credit Agreement (incorporated by reference to Exhibit 10.2 to Prologis' Current Report on Form 8-K filed on August 31, 2023). |
|
|
|
|
|
|
10.75* |
|
Form of Performance Stock Unit Agreement (incorporated by reference to Exhibit 10.1 to Prologis' Current Report on Form 8-K filed January 17, 2024). |
10.76* |
|
Form of First Amendment to Fourth Amended and Restated Prologis Promote Plan (incorporated by reference to Exhibit 10.2 to Prologis' Current Report on Form 8-K filed on January 17, 2024). |
10.77 |
|
Amended and Restated Global Senior Credit Agreement, dated as of May 22, 2025, among Prologis, L.P., various affiliates of Prologis, L.P., various lenders and agents, and Bank of America, N.A., as Global Administrative Agent (incorporated by reference to Exhibit 10.1 to Prologis' Current Report on Form 8-K filed May 23, 2025). |
10.78 |
|
Second Amendment, dated as of May 22, 2025, among Prologis, L.P., various lenders and agents, and Bank of America, N.A., as Global Administrative Agent to the Amended and Restated Global Senior Credit Agreement (incorporated by reference to Exhibit 10.2 to Prologis' Current Report on Form 8-K filed May 23, 2025). |
10.79* |
|
Form of Performance Stock Unit Agreement (Cash-Settled Dividend Equivalents) (incorporated by reference to Exhibit 10.1 to Prologis' Current Report on Form 8-K filed on December 5, 2025). |
10.80* |
|
Form of Amendment to Amended Agreement Relating to Retirement Eligibility and Vesting of Equity-Based Awards (incorporated by reference to Exhibit 10.2 to Prologis' Current Report on Form 8-K filed on December 5, 2025). |
10.81† |
|
Form of Time-Sharing Agreement. |
19.1† |
|
Policy Governing Material, Non-Public Information and the Prevention of Insider Trading. |
21.1† |
|
Subsidiaries of Prologis, Inc. and Prologis, L.P. |
22.1† |
|
Subsidiary guarantors and issuers of guaranteed securities. |
23.1† |
|
Consent of KPMG LLP with respect to Prologis, Inc. |
23.2† |
|
Consent of KPMG LLP with respect to Prologis, L.P. |
24.1† |
|
Power of Attorney for Prologis, Inc. (included in signature page of this annual report). |
24.2† |
|
Power of Attorney for Prologis, L.P. (included in signature page of this annual report). |
31.1† |
|
Certification of Chief Executive Officer of Prologis, Inc. |
31.2† |
|
Certification of Chief Financial Officer of Prologis, Inc. |
31.3† |
|
Certification of Chief Executive Officer for Prologis, L.P. |
31.4† |
|
Certification of Chief Financial Officer for Prologis, L.P. |
32.1† |
|
Certification of Chief Executive Officer and Chief Financial Officer of Prologis, Inc., pursuant to Section 906 of the Sarbanes-Oxley Act of 2002. |
32.2† |
|
Certification of Chief Executive Officer and Chief Financial Officer for Prologis, L.P., pursuant to Section 906 of the Sarbanes-Oxley Act of 2002. |
97.1 |
|
Policy Relating to Recovery of Erroneously Awarded Compensation (incorporated by reference to Exhibit 19.1 to Prologis' Annual Report on Form 10-K filed for the year ended December 31, 2023). |
101. INS† |
|
Inline XBRL Instance Document - the instance document does not appear in the Interactive Data File as its XBRL tags are embedded within the Inline XBRL document |
101. SCH† |
|
Inline XBRL Taxonomy Extension Schema With Embedded Linkbase Documents |
104 |
|
Cover Page Interactive Data File (embedded within the Inline XBRL document) |
* Management Contract or Compensatory Plan or Arrangement
† Filed herewith
‡ Prologis has omitted certain schedules and exhibits pursuant to Item 601(b)(2) of Regulation S-K and shall furnish supplementally to the SEC copies of any of the omitted schedules and exhibits upon request by the SEC.
SIGNATURES
Pursuant to the requirements of Section 13 or 15(d) of the Securities Exchange Act of 1934, the registrant has duly caused this report to be signed on its behalf by the undersigned, thereunto duly authorized.
|
|
|
PROLOGIS, INC. |
|
|
|
By: |
|
/s/ Daniel S. Letter |
|
|
Daniel S. Letter |
|
|
Chief Executive Officer |
Date: February 13, 2026
POWER OF ATTORNEY
KNOW ALL PERSONS BY THESE PRESENTS, that we, the undersigned officers and directors of Prologis, Inc., hereby severally constitute Daniel S. Letter, Timothy D. Arndt and Deborah K. Briones, and each of them singly, our true and lawful attorneys with full power to them, and each of them singly, to sign for us and in our names in the capacities indicated below, the Form 10-K filed herewith and any and all amendments to said Form 10-K, and generally to do all such things in our names and in our capacities as officers and directors to enable Prologis, Inc. to comply with the provisions of the Securities Exchange Act of 1934, and all requirements of the U.S. Securities and Exchange Commission, hereby ratifying and confirming our signatures as they may be signed by our said attorneys, or any of them, to said Form 10-K and any and all amendments thereto.
Pursuant to the requirements of the Securities Exchange Act of 1934, this report has been signed below by the following persons on behalf of the registrant and in the capacities and on the dates indicated.
|
|
|
|
|
Signature |
|
Title |
|
Date |
|
|
|
|
|
/s/ Daniel S. Letter |
|
Chief Executive Officer and Director |
|
February 13, 2026 |
Daniel S. Letter |
|
|
|
|
|
|
|
/s/ Timothy D. Arndt |
|
Chief Financial Officer |
|
February 13, 2026 |
Timothy D. Arndt |
|
|
|
|
|
|
|
/s/ Lori A. Palazzolo |
|
Managing Director and Chief Accounting Officer |
|
February 13, 2026 |
Lori A. Palazzolo |
|
|
|
|
|
|
|
/s/ Hamid R. Moghadam |
|
Executive Chairman |
|
February 13, 2026 |
Hamid R. Moghadam |
|
|
|
|
|
|
|
|
/s/ Cristina G. Bita |
|
Director |
|
February 13, 2026 |
Cristina G. Bita |
|
|
|
|
|
|
|
/s/ James B. Connor |
|
Director |
|
February 13, 2026 |
James B. Connor |
|
|
|
|
|
|
|
|
|
/s/ George L. Fotiades |
|
Director |
|
February 13, 2026 |
George L. Fotiades |
|
|
|
|
|
|
|
/s/ Lydia H. Kennard |
|
Director |
|
February 13, 2026 |
Lydia H. Kennard |
|
|
|
|
|
|
|
|
|
/s/ Irving F. Lyons III |
|
Director |
|
February 13, 2026 |
Irving F. Lyons III |
|
|
|
|
|
|
|
/s/ Guy A. Metcalfe |
|
Director |
|
February 13, 2026 |
Guy A. Metcalfe |
|
|
|
|
|
|
|
|
|
/s/ Avid Modjtabai |
|
Director |
|
February 13, 2026 |
Avid Modjtabai |
|
|
|
|
|
|
|
|
|
/s/ David P. O’Connor |
|
Director |
|
February 13, 2026 |
David P. O’Connor |
|
|
|
|
|
|
|
|
|
/s/ Olivier Piani |
|
Director |
|
February 13, 2026 |
Olivier Piani |
|
|
|
|
|
|
|
|
|
/s/ Sarah A. Slusser |
|
Director |
|
February 13, 2026 |
Sarah A. Slusser |
|
|
|
|
|
|
|
|
|
|
|
|
|
|
SIGNATURES
Pursuant to the requirements of Section 13 or 15(d) of the Securities Exchange Act of 1934, the registrant has duly caused this report to be signed on its behalf by the undersigned, thereunto duly authorized.
|
|
|
PROLOGIS, L.P. |
By: |
|
Prologis, Inc., its general partner |
|
|
|
By: |
|
/s/ Daniel S. Letter |
|
|
Daniel S. Letter |
|
|
Chief Executive Officer |
Date: February 13, 2026
POWER OF ATTORNEY
KNOW ALL PERSONS BY THESE PRESENTS, that we, the undersigned officers and directors of Prologis, L.P., hereby severally constitute Daniel S. Letter, Timothy D. Arndt and Deborah K. Briones, and each of them singly, our true and lawful attorneys with full power to them, and each of them singly, to sign for us and in our names in the capacities indicated below, the Form 10-K filed herewith and any and all amendments to said Form 10-K, and generally to do all such things in our names and in our capacities as officers and directors to enable Prologis, L.P. to comply with the provisions of the Securities Exchange Act of 1934, and all requirements of the U.S. Securities and Exchange Commission, hereby ratifying and confirming our signatures as they may be signed by our said attorneys, or any of them, to said Form 10-K and any and all amendments thereto.
Pursuant to the requirements of the Securities Exchange Act of 1934, this report has been signed below by the following persons on behalf of the registrant and in the capacities and on the dates indicated.
|
|
|
|
|
Signature |
|
Title |
|
Date |
|
|
|
|
|
/s/ Daniel S. Letter |
|
Chief Executive Officer and Director |
|
February 13, 2026 |
Daniel S. Letter |
|
|
|
|
|
|
|
|
/s/ Timothy D. Arndt |
|
Chief Financial Officer |
|
February 13, 2026 |
Timothy D. Arndt |
|
|
|
|
|
|
|
/s/ Lori A. Palazzolo |
|
Managing Director and Chief Accounting Officer |
|
February 13, 2026 |
Lori A. Palazzolo |
|
|
|
|
|
|
|
/s/ Hamid R. Moghadam |
|
Executive Chairman |
|
February 13, 2026 |
Hamid R. Moghadam |
|
|
|
|
|
|
|
|
/s/ Cristina G. Bita |
|
Director |
|
February 13, 2026 |
Cristina G. Bita |
|
|
|
|
|
|
|
/s/ James B. Connor |
|
Director |
|
February 13, 2026 |
James B. Connor |
|
|
|
|
|
|
|
|
|
/s/ George L. Fotiades |
|
Director |
|
February 13, 2026 |
George L. Fotiades |
|
|
|
|
|
|
|
/s/ Lydia H. Kennard |
|
Director |
|
February 13, 2026 |
Lydia H. Kennard |
|
|
|
|
|
|
|
|
|
/s/ Irving F. Lyons III |
|
Director |
|
February 13, 2026 |
Irving F. Lyons III |
|
|
|
|
|
|
|
/s/ Guy A. Metcalfe |
|
Director |
|
February 13, 2026 |
Guy A. Metcalfe |
|
|
|
|
|
|
|
|
|
/s/ Avid Modjtabai |
|
Director |
|
February 13, 2026 |
Avid Modjtabai |
|
|
|
|
|
|
|
|
|
/s/ David P. O’Connor |
|
Director |
|
February 13, 2026 |
David P. O’Connor |
|
|
|
|
|
|
|
|
|
/s/ Olivier Piani |
|
Director |
|
February 13, 2026 |
Olivier Piani |
|
|
|
|
|
|
|
|
|
/s/ Sarah A. Slusser |
|
Director |
|
February 13, 2026 |
Sarah A. Slusser |
|
|
|
|