Prologis Proxy Statement
Notice of Annual Meeting
of Stockholders
Wednesday, May 2, 2018
1:30 p.m., Pacific time
Pier 1, Bay 1
San Francisco, California 94111
The date of this proxy statement is
| March 22, 2018 |

|
UNITED STATES
SECURITIES AND EXCHANGE COMMISSION
Washington, D.C. 20549
SCHEDULE 14A
(Rule 14a-101)
Proxy Statement Pursuant to Section 14(a) of the Securities
Exchange Act of 1934 (Amendment No.)
Filed by the Registrant ☒
Filed by a Party other than the Registrant ☐
Check the appropriate box:
| ☐ | Preliminary Proxy Statement |
| ☐ | Confidential, for Use of the Commission Only (as permitted by Rule 14a-6(e)(2)) |
| ☒ | Definitive Proxy Statement |
| ☐ | Definitive Additional Materials |
| ☐ | Soliciting Material Pursuant to Rule 14a-12 |
Prologis, Inc.
(Name of Registrant as Specified In Its Charter)
(Name of Person(s) Filing Proxy Statement, if other than the Registrant)
Payment of Filing Fee (Check the appropriate box):
| ☒ | No fee required. |
| ☐ | Fee computed on table below per Exchange Act Rules 14a-6(i)(1) and 0-11. |
| (1) | Title of each class of securities to which transaction applies: |
| (2) | Aggregate number of securities to which transaction applies: |
| (3) | Per unit price or other underlying value of transaction computed pursuant to Exchange Act Rule 0-11 (set forth the amount on which the filing fee is calculated and state how it was determined): |
| (4) | Proposed maximum aggregate value of transaction: |
| (5) | Total fee paid: |
| ☐ | Fee paid previously with preliminary materials. |
| ☐ | Check box if any part of the fee is offset as provided by Exchange Act Rule 0-11(a)(2) and identify the filing for which the offsetting fee was paid previously. Identify the previous filing by registration statement number, or the Form or Schedule and the date of its filing. |
| (1) | Amount Previously Paid: |
| (2) | Form, Schedule or Registration Statement No.: |
| (3) | Filing Party: |
| (4) | Date Filed: |
Prologis Proxy Statement
Notice of Annual Meeting
of Stockholders
Wednesday, May 2, 2018
1:30 p.m., Pacific time
Pier 1, Bay 1
San Francisco, California 94111
The date of this proxy statement is
| March 22, 2018 |
|
Important Notice Regarding the Availability of Proxy Materials for the Annual Meeting of Stockholders to be held on May 2, 2018. This proxy statement and accompanying form of proxy are first being made available to you on or about March 23, 2018. Proxy materials are available at www.proxyvote.com. This proxy statement contains important information for you to consider when deciding how to vote on the matters brought before the Annual Meeting of the Stockholders. Please read it carefully.

|
i | |||
|
PROXY SUMMARY
|
||
OUR BUSINESS MODEL DELIVERS RESULTS
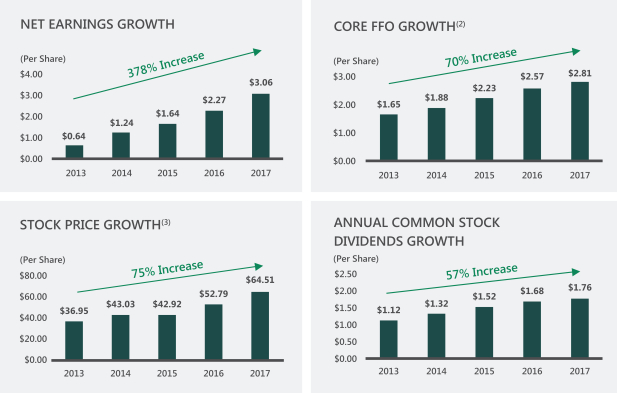
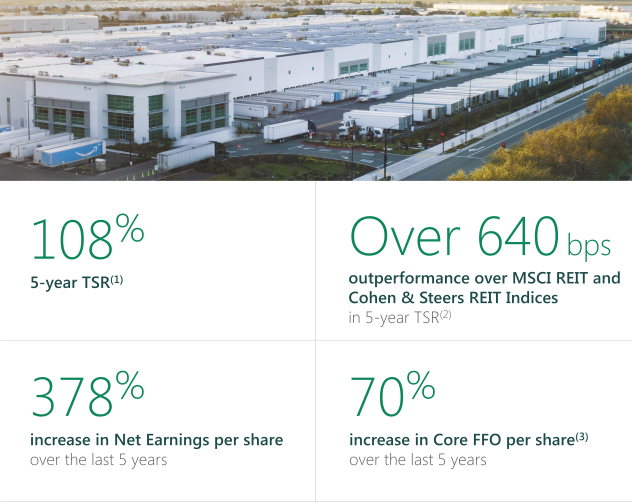
In 2017, we outperformed both operationally and in the equity markets for yet another successful year.
| ||
| (1) | Total stockholder return (“TSR”) is calculated based on the stock price appreciation and dividends paid to show the total return to a stockholder over a period of time. TSR assumes dividends are reinvested in common stock on the day the dividend is paid. |
| (2) | A real estate investment trust is a “REIT.” MSCI US REIT Index is the “MSCI REIT Index” and the Cohen & Steers Realty Majors Portfolio Index is the “Cohen & Steers REIT Index.” Measured in 5-year annualized TSR. |
| (3) | Core FFO per share is a non-GAAP measure. Please see Appendix A for a discussion and reconciliation to the most directly comparable GAAP measure. |
For further detail, please see “Compensation Discussion and Analysis.”
108% 5-year TSR(1) Over 640 bps outperformance over MSCI REIT and Cohen & Steers REIT Indices in 5-year TSR(2) 378% increase in Net Earnings per share over the last 5 years 70% increase in Core FFO per share(3) over the last 5 years
|
|
1 | |||
|
PROXY SUMMARY
|
||
2017
Environmental Stewardship, Social Responsibility and
Governance (ESG) Highlights
WE TAKE ESG SERIOUSLY
|
| ||
For further detail, please see “Board of Directors and Corporate Governance”, “Environmental Stewardship, Social Responsibility and Governance” and “Compensation Discussion and Analysis.”
| (1) | Global Real Estate Sustainability Benchmark (“GRESB”) |
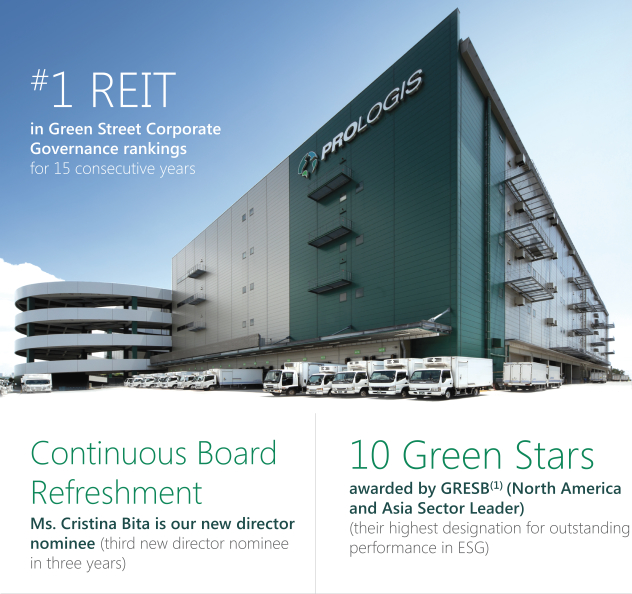
Continuous Board Refreshment Ms. Cristina Bita is our new director nominee (third new director nominee in three years) 10 Green Stars awarded by GRESB(1) (North America and Asia Sector Leader) (their highest designation for outstanding performance in ESG)
|
|
3 | |||
|
PROXY SUMMARY
|
||
Proposals Submitted to Vote at the 2018 Annual Meeting
| ¾ | We are asking our stockholders of record on March 6, 2018 to vote on the following matters at our 2018 annual meeting of stockholders to be held on May 2, 2018. Please see the section entitled “Additional Information” for details on how to vote. |
|
Proposal
|
Board
| ||||
| Proposal 1: Election of Directors
¾ At the annual meeting you will be asked to elect to the board of directors (the “Board”) of Prologis, Inc. the eleven persons nominated by the Board. The directors will be elected to one-year terms and will hold office until the 2019 annual meeting and until their successors are duly elected and qualified.
¾ Vote Required: You may vote for, vote against or abstain from voting for any of the director nominees. Assuming a quorum is present, to elect a particular director nominee, the number of votes cast “For” a director nominee must exceed the number of such votes cast “Against” the director nominee. Abstentions and broker non-votes, if any, will have no effect on the outcome of the election. A more detailed description of these majority voting procedures is provided below under “Majority Voting.”
|
For | ||||
| Proposal 2: Advisory Vote to Approve the Company’s Executive Compensation for 2017
¾ At the annual meeting you will be asked to approve a resolution on the company’s executive compensation for 2017 as reported in this proxy statement.
¾ Vote Required: You may vote for, vote against or abstain from voting to approve the resolution on the company’s executive compensation for 2017. Assuming a quorum is present, to be approved by the stockholders, the proposal must receive the affirmative vote of a majority of the shares of common stock present in person or by proxy at the annual meeting. Abstentions and broker non-votes, if any, are considered shares present in person or by proxy and thus will have the same effect as votes cast “Against” the proposal.
|
For | ||||
|
|
4 | |||
|
PROXY SUMMARY
|
||
|
Proposal
|
Board
| |||||
| Proposal 3: Ratification of the Appointment of Independent Registered Public Accounting Firm
¾ At the annual meeting you will be asked to ratify the appointment of KPMG LLP by the Audit Committee (the “Audit Committee”) of the Board as the company’s independent registered public accounting firm for the year 2018.
¾ Vote Required: You may vote for, vote against or abstain from voting on ratifying the appointment of KPMG LLP as our independent registered public accounting firm for the year 2018. Assuming a quorum is present, to be approved by the stockholders, the proposal must receive the affirmative vote of a majority of the shares of common stock present in person or by proxy at the annual meeting. Abstentions and broker non-votes, if any, are considered shares present in person or by proxy and thus will have the same effect as votes cast “Against” the proposal.
|
For | |||||
Abstentions and broker non-votes are counted for purposes of determining whether a quorum is reached.
References in this proxy statement to “we,” “us,” “our,” the “company,” and “Prologis” refer to Prologis, Inc. and its subsidiaries, unless the context otherwise requires.
This summary highlights information contained in this proxy statement. This summary does not contain all the information you should consider and you should read the entire proxy statement before voting. For more complete information regarding our 2017 performance, please review our Annual Report on Form 10-K for the year ended December 31, 2017. All company operational information in this proxy statement is for the year ended or as of December 31, 2017, unless otherwise noted. See Appendix A for definitions and discussion of non-GAAP measures and reconciliations to GAAP measures and for additional detail regarding definitions of terms as generally explained in the proxy statement.
|
|
5 | |||
|
BOARD OF DIRECTORS AND CORPORATE GOVERNANCE
|
||
Prologis Corporate Governance Tear Sheet
|
Director Independence and Compliance |
¾ 90% of our Board of Directors is independent: All directors, other than our chairman, are independent
¾ No related-party transactions
¾ No hedging or pledging of our securities
¾ All directors attended 75% or more of Board and Board committee meetings
¾ All directors are in compliance with our stock ownership guidelines (5x annual cash retainer)
| |
|
|
| |
|
Director Qualifications |
¾ Annual Board evaluation process involving Board, Board committee and individual director assessments: Administered by the chair of our Board Governance and Nomination Committee (the “Governance Committee”) and our lead independent director, with a third-party evaluation at least every two years
¾ Age/tenure policy: 72 years maximum age limit.(1) Impact of tenure on director independence is evaluated through our extensive annual Board evaluation process
¾ Our mix of director tenure, skills and background provides a balance of experience and institutional knowledge with fresh perspectives
¾ Ms. Cristina Bita is a new director nominee in our 2018 elections. If elected, our Board will have two female directors and 10 out of 11 directors will be independent.
| |
|
|
| |
|
Board Leadership |
¾ Lead independent director role with significant authority and responsibilities
¾ Chairman and CEO policy gives Board flexibility to determine best candidate for position
| |
|
|
| |
|
Strong Stockholder Rights |
¾ Adopted proxy access with 3/3/20/20(2) market standard (adopted in 2016)
¾ No stockholder rights plan
¾ Irrevocably opted out of Maryland staggered board provisions: All directors elected annually (adopted in 2014)
¾ Majority vote is the standard in uncontested director elections (adopted in 2007)
¾ Stockholders can amend bylaws with majority vote (adopted in 1997) |
| (1) | Our governance guidelines provide that directors will not be nominated or appointed to the Board if they are, or would be, 72 years or older at the time of the election or appointment. |
| (2) | See “Additional Information” for further detail on proxy access. |
|
|
7 | |||
|
BOARD OF DIRECTORS AND CORPORATE GOVERNANCE
|
||
Election of Directors (Proposal 1)
| ¾ The Board currently consists of ten directors. All ten current directors, as well as Ms. Bita, our new director nominee recommended by Hamid Moghadam, are standing to be elected to the Board at the 2018 annual meeting of stockholders to hold office until the 2019 annual meeting and until their successors are duly elected and qualified.
¾ The Board has affirmatively determined that all of our director nominees, other than Mr. Moghadam, are independent directors in accordance with New York Stock Exchange (“NYSE”) rules, our governance guidelines and our bylaws.
¾ Our bylaws provide for a majority voting standard for the election of directors. See “Additional Information—Majority Voting” for further detail.
¾ We do not know of any reason why any nominee would be unable or unwilling to serve as a director, if elected. However, if a nominee becomes unable to serve or will not serve, proxies may be voted for the election of such other person nominated by the Board as a substitute or the Board may reduce the number of directors. Each of the director nominees has consented to be named in this proxy statement and to serve as a director if elected.
¾ Information about director share ownership is presented below under “Security Ownership.”
¾ Certain of the director nominees previously served on the board of ProLogis (the “Trust”). In June 2011, AMB Property Corporation (“AMB”) and the Trust completed a merger transaction (the “Merger”) and, effective with the Merger, our name was changed from AMB Property Corporation to Prologis, Inc.
¾ The shares represented by the proxies received will be voted for the election of each of the eleven nominees named below, unless you indicate in the proxy that your vote should be cast against any or all of the director nominees or that you abstain from voting. Each nominee elected as a director will continue in office until his or her successor has been duly elected and qualified, or until the earliest of his or her resignation, retirement or death.
¾ The eleven nominees for election to the Board at the 2018 annual meeting, all proposed by the Board, are listed below with brief biographies.
|
||
|
The Board unanimously recommends that our stockholders vote FOR the election of each nominee.
| ||
|
|
8 | |||
|
BOARD OF DIRECTORS AND CORPORATE GOVERNANCE
|
||
Board Evaluations and Process for Selecting Directors
| ¾ In our annual Board evaluation process, the Governance Committee evaluates our directors in light of current needs of the Board and the company.
¾ Our annual Board evaluation process involves assessments at the Board, Board committee and individual director levels. Through this process, the Board determines who should be nominated to stand for election based on current company and Board needs.
¾ In this process, directors complete a Board survey to identify key skills and characteristics currently needed for the Board, as well as to provide information relating to Board composition and planning.
¾ Director interview questions are prepared based on current areas of focus as well as feedback from our stockholder outreach efforts.
¾ Annual one-on-one director interviews are conducted by our lead independent director and chair of the Governance Committee or, at least every two years, by an independent third party.
¾ The results of the director interviews are aggregated by our lead independent director, Governance Committee chair, or if applicable, the independent third party, and reported to the Governance Committee and then to our full Board. Our Board will follow up on items identified in the evaluation process.
¾ Our Governance Committee discusses Board succession and reviews potential candidates. This process takes place throughout the course of the year. Although the committee may retain third parties to assist in identifying potential nominees, it prefers internal references by directors who understand the needs and dynamics of the Board with a particular focus on inclusion and diversity of ideas and background.
¾ Feedback received in our 2018 Board evaluations noted the high functioning nature of the Board and the need for new directors with technology, innovation, finance and/or accounting backgrounds. Our nomination of Cristina Bita addresses these needs. |
Board Evaluation and Refreshment Process
1. Board Planning Survey
2. Director Interview Questions Based on Stockholder Feedback and Key Areas of Focus
3. One-on-One Director Interviews
4. Report to Governance Committee
5. Board Discussions and Follow Up
6. Identification of Current Board Needs
7. Identification of Potential Candidates and Board Interviews/Discussion
q
Three New Director Nominees in the Past Three Years |
|
|
9 | |||
|
BOARD OF DIRECTORS AND CORPORATE GOVERNANCE
|
||
Director Qualifications, Skills and Experience
| ¾ Each of the director nominees was chosen to serve on the Board based on his or her qualifications, skills and experience, as discussed in their biographies, and how those characteristics serve the current needs of the Board and the company. For information about our business, strategy and goals, please see “Compensation Discussion and Analysis” (“CD&A”).
¾ In making its nominations, the Governance Committee also assessed each director nominee by key characteristics, including courage to voice opinions, integrity, experience, accountability, good judgment, supportiveness in working with others and willingness to commit the time needed to satisfy the requirements of Board and committee membership.
¾ While the Governance Committee does not have a formal policy regarding diversity, the committee is committed to maintaining Board diversity in thought, background and experience—a mix of gender, cultural background, geographic origin, tenure, and professional experience that supports our business strategy and the current needs of the Board.
¾ Our governance guidelines provide that directors will not be nominated or appointed to the Board if they are, or would be, 72 years or older at the time of the election or appointment. Term limits on directors’ service have not been instituted. |
Board composition and refreshment
| ¾ The Governance Committee is focused on identifying qualified and diverse director candidates with commensurate experience and background. The Board’s current pool of potential candidates are mostly female and/or otherwise diverse candidates.
¾ In evaluating the current needs of the Board and the company, the Board identified a need for expertise in innovation, technology and finance/accounting. Our strategic plans take advantage of our scale to innovate for our customers, which leverages technology to do so. Also, as Mr. Losh approaches retirement from our Board next year due to our director retirement age limits, our Audit Committee will require another director with a strong finance and/or accounting background.
¾ With her vast experience in technology and finance at Google for over a decade, Ms. Cristina Bita is an exceptionally well-matched director candidate.
¾ By tenure, if all director nominees are elected, the Board will comprise three directors in the 0-4 year category and four directors in each of the 5-10 year and the 11-plus year categories. This mix provides an even balance of experience and institutional knowledge with fresh perspectives. |
|
|
10 | |||
|
BOARD OF DIRECTORS AND CORPORATE GOVERNANCE
|
||
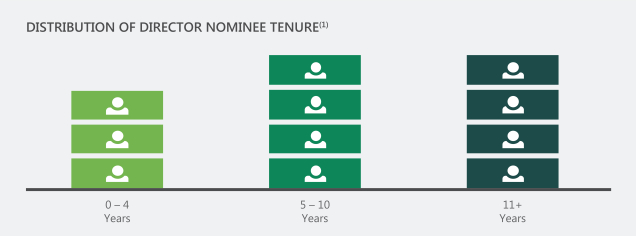
| (1) | Includes Ms. Bita in the 0-4 year category and, although the entire board was rebuilt at the time of the Merger in 2011, we include Mr. Moghadam, Mr. Skelton, Mr. Losh and Ms. Kennard in the 11+ year category as they were directors of the legal acquirer prior to the Merger. |
| ¾ | The Board is committed to regular refreshment to maintain an optimal balance of different perspectives and proper oversight over the company. |
| ¾ | The Board was completely refreshed and rebuilt at the time of the Merger in 2011. The Merger essentially created a new company with a new operating and corporate platform. At that time, all directors underwent intensive review to determine which directors would best fit the newly created combined company. |
| ¾ | Each director selected in this rebuilding process was onboarded as a new director to the newly established company. These directors were required to perform in a new governance environment, with new structures, processes, committees, charters and guidelines. |
| ¾ | We have continued to refresh the Board since the Merger. David O’Connor onboarded as a new director in 2015, Olivier Piani onboarded as a new director in 2017 and Ms. Bita is a new director nominee in our 2018 annual election. Our director candidate search process actively identifies and assesses a pool of potential candidates through a variety of sources, primarily through internal references. This process will serve to continue to refresh the Board and maintain a balanced mix of new perspectives and experience. |
|
|
11 | |||
|
BOARD OF DIRECTORS AND CORPORATE GOVERNANCE
|
||
BOARD QUALIFICATIONS
In addition to fundamental characteristics necessary for all directors, such as courage, wisdom and good judgment, below are qualifications of our Board identified as important in our Board evaluation process. These characteristics are critical to strong oversight.
We have deep experience in real estate on our Board covering all components of our business model. The Board believes a balance of perspectives from other industries is also critical to well-rounded oversight. Our Board’s wide range of experience across a spectrum of industries from banking to healthcare broadens perspectives and strengthens risk assessments by the Board. In addition to the qualifications listed below, Ms. Bita brings her experience in the technology industry to the Board providing valuable insight supporting our strategic initiatives driving innovation and data analytics.
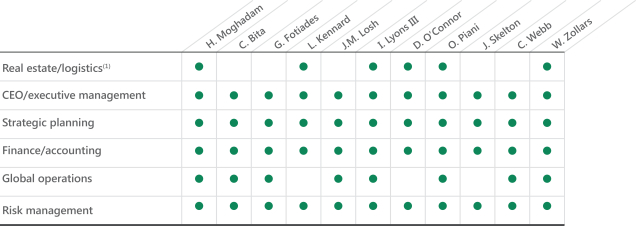
| (1) | Includes development, operations, real estate investments and fund management. |
|
|
12 | |||
|
BOARD OF DIRECTORS AND CORPORATE GOVERNANCE
|
||
Hamid R. Moghadam
| ¾ | Chairman of the Board since January 2000; Director since November 1997 |
Board Committees: Executive
Other public directorships: None | ||
|
Mr. Moghadam, 61, has been our Chief Executive Officer since the end of December 2012 and was our Co-Chief Executive Officer from June 2011 to December 2012. He is the co-founder of AMB Property Corporation and was AMB’s Chief Executive Officer from November 1997 (from the time of AMB’s initial public offering) to June 2011 when AMB merged with the Trust. |
||||
|
Other relevant qualifications. Mr. Moghadam is on the board of the Stanford Management Company and formerly served as its chairman. He is a former trustee of Stanford University and previously served on the Executive Committee of the Board of Directors of the Urban Land Institute. Mr. Moghadam holds Bachelor’s and Master’s degrees in engineering from the Massachusetts Institute of Technology and a Master of Business Administration from the Graduate School of Business at Stanford University. |
||||
Irving F. Lyons III
| ¾ | Lead Independent Director since June 2011 (prior to the Merger served as a trustee of the Trust from September 2009 to June 2011 and from March 1996 to May 2006) |
Board Committees: Executive
Other public directorships: Equinix, Inc. and Essex Property Trust, Inc. | ||
|
Mr. Lyons, 68, has been a principal with Lyons Asset Management, a private equity firm, since January 2005. In 2004, Mr. Lyons retired from the Trust where he served as chief investment officer from 1997 until his retirement. He joined the Trust in 1993 and served as president from 1999 to 2001 and vice chairman from 2001 to 2004. Mr. Lyons is a member of the boards of Equinix, Inc., a global data center operator, and Essex Property Trust, Inc., a real estate investment trust investing in apartment communities. Mr. Lyons previously served as chairman of the board of BRE Properties, Inc.
Other relevant qualifications. Mr. Lyons joined the Trust when King & Lyons, an industrial real estate management and development company, was acquired by the Trust in 1993. Mr. Lyons had been the managing general partner in that firm since its inception in 1979 and was one of its principals at the time of the acquisition. Mr. Lyons holds a Master in Business Administration from Stanford University and a Bachelor of Science in industrial engineering and operations research from the University of California at Berkeley. |
||||
|
|
13 | |||
|
BOARD OF DIRECTORS AND CORPORATE GOVERNANCE
|
||
Cristina G. Bita
| ¾ | New director nominee |
Other public directorships: None | ||
|
Ms. Bita, 39, is a Vice President of Finance at Google and Business Finance Officer for Google’s Hardware and Virtual Reality & Augmented Reality organizations, as well as Global Marketing. She has served in a number of finance leadership roles since joining Google in 2006 across a range of business areas, including Global Partnerships and Business Development, Global Sales and Consumer Products. Prior to Google, Ms. Bita spent six years with Siemens/Osram, where she held various positions in Business Unit Controllership and Corporate FP&A. |
||||
|
Other relevant qualifications. Ms. Bita holds a Master of Science in Finance from the Boston College Carroll School of Management and a Bachelor of Science in Business Administration (Accounting) from Salem State University. Ms. Bita is also a Certified Management Accountant (CMA). |
||||
George L. Fotiades
| ¾ | Director since June 2011 (prior to the Merger served as a trustee of the Trust from December 2001 to June 2011) |
Board Committees: Compensation (Chair)
Other public directorships: AptarGroup, Inc. and Cantel Medical Corp. | ||
|
Mr. Fotiades, 64, has been an operating partner at Five Arrows Capital Partners (Rothschild Merchant Banking) since April 2017. From April 2007 to April 2017, Mr. Fotiades was a partner, healthcare investments at Diamond Castle Holdings, LLP. Mr. Fotiades was chairman of Catalent Pharma Solutions, Inc., a provider of advanced technologies for pharmaceutical, biotechnology, and consumer health companies, from June 2007 to February 2010. Mr. Fotiades is a member of the board of AptarGroup, Inc., a global dispensing systems company, and is vice chairman of the board of Cantel Medical Corp., a provider of infection prevention and control products. He previously served on the board of Alberto-Culver Company, a consumer products company specializing in hair and skin care products.
Other relevant qualifications. Mr. Fotiades was previously the president and chief operating officer of Cardinal Health, Inc. and also served as president and chief executive officer of Cardinal’s Pharmaceutical Technologies and Services segment. Mr. Fotiades also served as president of Warner- Lambert’s consumer healthcare business, as well as in other senior positions at Bristol-Myers Squibb, Wyeth, and Procter & Gamble. Mr. Fotiades holds a Master of Management from The Kellogg School of Management at Northwestern University and a Bachelor of Arts from Amherst College. |
||||
|
|
14 | |||
|
BOARD OF DIRECTORS AND CORPORATE GOVERNANCE
|
||
Lydia H. Kennard
| ¾ | Director since August 2004 |
Board Committees: Governance
Other public directorships: Freeport-McMoRan Copper & Gold Inc. | ||
|
Ms. Kennard, 63, is the founder and chief executive officer of KDG Construction Consulting, a provider of project and construction management services, a principal of Airport Property Ventures, LLC, an aviation focused real estate operating and development company, and a principal with 3801-3825 N. Mission Rd., LA, LLC, a single-purpose real estate entity. Ms. Kennard is a member of the board of Freeport-McMoRan Copper & Gold Inc., a natural resource company. Ms. Kennard was previously a member of the board of URS Corporation, a provider of engineering, construction, and technical services, and Intermec, Inc., an automated identification and data collection company. |
||||
|
Other relevant qualifications. Ms. Kennard served as executive director of Los Angeles World Airports, a system of airports comprising Los Angeles International, Palmdale Regional, and Van Nuys General Aviation Airports from 1999 to 2003 and again from 2005 to 2007. From 1994 to 1999, she served as the system’s deputy executive for design and construction. She also previously served on the board of Indymac Bancorp, Inc., a thrift/mortgage bank holding company. Ms. Kennard holds a Juris Doctor degree from Harvard University, a Master’s degree in city planning from Massachusetts Institute of Technology, and a Bachelor of Science in urban planning and management from Stanford University. |
||||
J. Michael Losh
| ¾ | Director since January 2003 |
Board Committees: Audit (Chair)
Other public directorships: AON Corporation, Masco Corporation and H.B. Fuller Company | ||
|
Mr. Losh, 71, was interim chief financial officer of Cardinal Health, Inc., a health care products and services company, from July 2004 to May 2005 and served on its board from 1996 until September 2009. Mr. Losh is a member of the boards of AON Corporation, a global provider of risk management services, insurance and re-insurance, and human resource consulting; Masco Corporation, a home improvement and building products company; and H.B. Fuller Company, a global formulator, manufacturer, and marketer of chemical products. Mr. Losh previously served on the boards of TRW Automotive Holdings Inc., a global automotive supply company and CareFusion Corporation, a global medical technology company.
Other relevant qualifications. Mr. Losh spent 36 years with General Motors Corporation, an automobile manufacturer, most recently as executive vice president and chief financial officer from July 1994 to August 2000 and as chairman of GMAC, General Motors’ financial services group, from July 1994 to April 1999. Mr. Losh holds a Master in Business Administration from Harvard University and a Bachelor of Science in mechanical engineering from Kettering University. |
||||
|
|
15 | |||
|
BOARD OF DIRECTORS AND CORPORATE GOVERNANCE
|
||
David P. O’Connor
| ¾ | Director since January 2015 |
Board Committees: Compensation
Other public directorships: Regency Centers, Inc. and Paramount Group, Inc. | ||
|
Mr. O’Connor, 53, is a private investor, managing partner of High Rise Capital Partners, LLC, a private real estate investment firm, and a non-executive co-chairman of HighBrook Investors LLC. He was the co-founder and senior managing partner of High Rise Capital Management LP, a real estate securities hedge fund manager that operated from 2001 to 2011. Mr. O’Connor is a member of the boards of Regency Centers, Inc., a publicly traded real estate investment trust specializing in shopping centers, and Paramount Group, Inc., a publicly traded real estate investment and management company specializing in office buildings. He previously served on the board of Songbird Estates plc, the former majority owner of Canary Wharf in London, UK. |
||||
|
Other relevant qualifications. Mr. O’Connor was previously a principal, co-portfolio manager, and investment committee member of European Investors, Inc., a large dedicated real estate investment trust investor, from 1994 to 2000. Mr. O’Connor received a Master of Science in real estate from New York University and holds a Bachelor of Science degree from the Boston College Carroll School of Management. |
||||
Olivier Piani
| ¾ | Director since May 2017 |
Board Committees: Audit
Other public directorships: None | ||
|
Mr. Piani, 64, is the chief executive officer and founder of OP Conseils, a consulting company in real estate and finance that Mr. Piani started in January 2016. Mr. Piani is also a senior consultant with Ardian, a major European private equity group. From September 2008 to December 2015, Mr. Piani was chief executive officer of Allianz Real Estate, the real estate and asset management investment platform for the Allianz Group.
Other relevant qualifications. From 1998 to 2008, Mr. Piani built the pan-European platform for GE Capital Real Estate spanning seven different countries. Prior to joining GE in 1998, Mr. Piani was chief executive officer of UIC-Sofal, a real estate bank. From 1982 to 1995, Mr. Piani held various leadership positions in the Paribas Group in Paris, New York and London. Mr. Piani is a graduate of Paris Ecole Superieure de Commerce de Paris and received a Master of Business Administration from Stanford University. |
||||
|
|
16 | |||
|
BOARD OF DIRECTORS AND CORPORATE GOVERNANCE
|
||
Jeffrey L. Skelton
| ¾ | Director since November 1997 |
Board Committees: Governance (Chair), Executive (Chair)
Other public directorships: None | ||
|
Mr. Skelton, 68, retired in 2009 as president and chief executive officer of Symphony Asset Management, a subsidiary of Nuveen Investments, Inc., an investment management firm. After his retirement in 2009 and until 2013, Mr. Skelton was a co-founder and managing partner of Resultant Capital Partners, an investment management firm. |
||||
|
Other relevant qualifications. Prior to founding Symphony Asset Management in 1994, Mr. Skelton was with Wells Fargo Nikko Investment Advisors from 1984 to 1993, where he served in a variety of capacities, including chief research officer, vice chairman, co-chief investment officer, and chief executive officer of Wells Fargo Nikko Investment Advisors Limited in London. Previously, Mr. Skelton was also an assistant professor of finance at the University of California at Berkeley, Walter A. Haas School of Business. Mr. Skelton holds a Ph.D. in mathematical economics and finance and a Master of Business Administration from the University of Chicago. |
||||
Carl B. Webb
| ¾ | Director since August 2007 |
Board Committees: Audit
Other public directorships: Hilltop Holdings Inc. | ||
|
Mr. Webb, 68, is currently a co-managing member of Ford Financial Fund II, L.P. a private equity firm focusing on equity investments in financial services, a position he has held since February 2012. Mr. Webb has served as chairman of the Mechanics Bank board since April 2015. From June 2008 until December 2012, Mr. Webb was a senior partner of Ford Management, L.P. Mr. Webb was also the chief executive officer and a board member of Pacific Capital Bancorp and chairman of Santa Barbara Bank and Trust from August 2010 until December 2012. Mr. Webb has also served as a consultant to Hunter’s Glen/Ford, Ltd., a private investment partnership, since November 2002. Additionally, Mr. Webb is a member of the board of Hilltop Holdings Inc., a publicly traded financial services holding company.
Other relevant qualifications. Mr. Webb previously served on the boards of Plum Creek Timber Company, M & F Worldwide Corp., and Triad Financial SM LLC, where he was co-chairman from July 2007 to October 2009 and served as interim president and chief executive officer from August 2005 to June 2007. Since 1983, Mr. Webb held executive positions at banking institutions, including Golden State Bancorp, Inc. and its subsidiary, California Federal Bank, FSB, First Madison Bank, FSB, First Gibraltar Bank, FSB, and First National Bank at Lubbock. Mr. Webb holds a Bachelor of Business Administration from West Texas A&M University and a graduate banking degree from Southwestern Graduate School of Banking at Southern Methodist University. |
||||
|
|
17 | |||
|
BOARD OF DIRECTORS AND CORPORATE GOVERNANCE
|
||
William D. Zollars
| ¾ | Director since June 2011 (prior to the Merger served as a trustee of the Trust from December 2001 to May 2010) |
Board Committees: Governance, Compensation
Other public directorships: Cerner Corporation and CIGNA Corporation | ||
|
Mr. Zollars, 70, retired from YRC Worldwide, Inc., a global transportation service provider, in July 2011 where he served as chairman, president, and chief executive officer from 1999 until his retirement. He was president of Yellow Transportation, Inc. from 1996 to 1999. Mr. Zollars is a member of the boards of Cerner Corporation, a supplier of healthcare information technology solutions, healthcare devices, and related services, and CIGNA Corporation, a global health service organization.
Other relevant qualifications. Mr. Zollars was previously a senior vice president of Ryder Integrated Logistics, a division of Ryder System, Inc. and he spent 24 years in various executive positions, including eight years in international locations, at Eastman Kodak. Mr. Zollars holds a Bachelor of Arts in economics from the University of Minnesota. |
||||
We require that a majority of the Board be independent in accordance with NYSE rules. To determine whether a director is independent, the Board must affirmatively determine that there is no direct or indirect material relationship between the company and the director.
90% of the Board is independent.
| ¾ | The Board has determined that all our directors (including, our new director candidate, Ms. Bita), other than our chairman, Mr. Moghadam, are independent. |
The Board reached this determination after considering all relevant facts and circumstances, reviewing director questionnaires and considering transactions and relationships, if any, between us, our affiliates, our executive officers and their affiliates, and each of the directors and prospective director, members of each of their immediate families, and their affiliates.
Audit, Compensation and Governance Committees are 100% independent. The Board has also determined that all members of the Audit, Compensation and Governance Committees of the Board are independent in accordance with NYSE and Securities and Exchange Commission (“SEC”) rules.
|
|
18 | |||
|
BOARD OF DIRECTORS AND CORPORATE GOVERNANCE
|
||
Our governance guidelines do not specify a leadership structure for the Board, allowing the Board the flexibility to choose the best option for the company as circumstances warrant. The Board believes that strong independent leadership ensures effective oversight over the company. Such independent oversight is maintained through:
| ¾ | our lead independent director; |
| ¾ | our independent directors; |
| ¾ | the Audit, Governance and Talent and Compensation Committees, which are all comprised entirely of independent directors; |
| ¾ | annual review of the Board leadership structure and effectiveness of oversight through the Board evaluation process; and |
| ¾ | strong adherence to our governance guidelines. |
All of our independent directors have the ability to provide input for meeting agendas and are encouraged to raise topics for discussion by the Board. In addition, the Board and each Board committee has complete and open access to any member of management.
Each committee has the authority to retain independent legal, financial and other advisors as they deem appropriate without consulting or obtaining the approval of any member of management. The Board also holds regularly scheduled executive sessions of only independent directors in order to promote free and open discussion among the independent directors.
Chairman and CEO assessment
Our chairman and CEO and our lead independent director act together in a system of checks and balances, providing both strong oversight and operational insight.
Our CEO, Mr. Moghadam, serves as chairman of the Board. The lead independent director role is focused on ensuring independent oversight of the company. Mr. Moghadam’s roles as both CEO and chairman enable him to act as a bridge between management and the Board, ensuring that the Board understands our business when making its decisions.
Mr. Moghadam has the breadth of experience to execute our unique business plan and provide special insight to the Board.
Very few have experience running a public company with extensive global operations and substantial strategic capital and development businesses. Mr. Moghadam co-founded the company and has served on the Board since the company’s initial public offering in November 1997. As one of our founders, Mr. Moghadam has extensive knowledge and expertise in the real estate and REIT industries, as well as history and knowledge of our company.
|
|
19 | |||
|
BOARD OF DIRECTORS AND CORPORATE GOVERNANCE
|
||
Considering all of these factors, the Board believes that a structure that combines the roles of CEO and chairman, along with an independent lead director, independent chairs for each of the Board committees and independent non-employee directors, provides the best leadership for the company at this time and places the company in a competitive position to provide long-term value to our stockholders.
Lead independent director
If the offices of chairman and CEO are held by the same person, the independent members of the Board will annually elect an independent director to serve in a lead capacity. The lead independent director is generally expected to serve for more than one year. Mr. Lyons has been selected as the lead independent director by our Governance Committee and the independent members of our Board and has served in that capacity for nearly seven years.
The lead independent director coordinates the activities of the other independent directors and performs such other duties and responsibilities as the Board may determine.
The specific responsibilities of the lead independent director are currently as follows:
|
Executive Sessions/ Committee Meetings |
¾ Presides at all meetings of the Board at which the chairman is not present, including executive sessions of the independent directors (generally held at every regular Board meeting)
¾ Attends meetings of the various Board committees regularly
| |
| Meetings of Independent Directors |
¾ Has the authority to call meetings of the independent directors and set the agenda
| |
| Board Evaluations |
¾ Oversees, with the chair of the Governance Committee, annual evaluations of the Board, Board committees and individual directors, including an evaluation of the chairman’s effectiveness as both chairman and CEO
| |
| Liaison with Chairman and CEO |
¾ Serves as liaison between the independent directors and the chairman
¾ Meets regularly between Board meetings with the chairman and CEO
| |
| Board Processes and Information |
¾ Ensures the quality, quantity, appropriateness and timeliness of information provided to the Board and provides input to create meeting agendas
¾ Ensures that feedback is properly communicated to the Board and chairman
¾ Ensures the institution of proper Board processes, including the number, frequency and scheduling of Board meetings and sufficient time for discussion of all agenda items
| |
| Communications with Stockholders |
¾ Responds to stockholder inquiries when appropriate, following consultation with the chairman and CEO
¾ Communicates with stockholders when appropriate, following consultation with the chairman and CEO
|
|
|
20 | |||
|
BOARD OF DIRECTORS AND CORPORATE GOVERNANCE
|
||
Pursuant to the Maryland General Corporation Law and our bylaws, our business, property and affairs are managed under the direction of the Board. Members of the Board are kept informed of our business through our executive management team.
The four standing committees of the Board are: Audit, Governance, Compensation and Executive Committee (the “Executive Committee”). The Board has determined that each member of the Audit, Governance and Talent and Compensation Committees is an independent director in accordance with NYSE rules.
The current membership information for our Board committees is presented below.
Each committee has a charter which generally states the purpose of the committee and outlines the committee’s structure and responsibilities. The committees, other than the Executive Committee, must review the adequacy of their charter on an annual basis.
|
|
21 | |||
|
BOARD OF DIRECTORS AND CORPORATE GOVERNANCE
|
||
| Board Committees
|
| Audit Committee
Members: J. Michael Losh (Chair), Olivier Piani and Carl Webb
Number of Meetings in 2017: 9
¾ Oversees the financial accounting and reporting processes of the company
¾ Responsible for the appointment, compensation and oversight of our public accountants
¾ Monitors: (i) the integrity of our financial statements; (ii) our compliance with legal and regulatory requirements; (iii) our public accountant’s qualifications and independence; and (iv) the performance of our internal audit function and public accountants
¾ Oversees financial and cybersecurity risks relating to the company
¾ All committee members are designated by the Board as “audit committee financial experts” in accordance with SEC regulations and meet the independence, experience and financial literacy requirements of the NYSE and Section 10A of the Securities Exchange Act of 1934, as amended.
|
| Talent and Compensation Committee (the “Compensation Committee”)
Members: George Fotiades (Chair), David O’Connor and William Zollars
Number of Meetings in 2017: 4
¾ Discharges the Board’s responsibilities relating to compensation of directors and executives and produces an annual report on executive compensation for inclusion in the proxy statement
¾ Approves and evaluates our director and officer compensation plans, policies and programs
¾ Reviews and recommends to the Board corporate goals and objectives relative to the compensation of our CEO
¾ Evaluates our CEO’s performance in light of corporate goals and objectives, and sets the CEO’s compensation level based on this evaluation, including incentive and equity-based compensation plans
¾ Sets the amount and form of compensation for the executive officers who report to the CEO
¾ Makes recommendations to the Board (including recommendations for non-employee directors) on general compensation practices, including incentive and equity-based compensation plans, and adopts, administers and makes awards under annual and long-term incentive compensation and equity-based compensation plans, including any amendments to the awards under any such plans, and reviews and monitors awards under such plans
¾ Reviews and approves any new employment agreements, change in control agreements and severance or similar termination payments proposed to be made to the CEO or any other executive officer of the company
¾ Confirms that relevant reports are made to the Board or in periodic filings as required by governing rules and regulations of the SEC and NYSE
¾ Reviews and discusses with management CD&A and determines whether to recommend its inclusion in the proxy statement to the Board
|
|
|
22 | |||
|
BOARD OF DIRECTORS AND CORPORATE GOVERNANCE
|
||
| Board Committees
|
|
¾ Participates in succession planning for key executives
¾ Focuses on risks relating to remuneration of our officers and employees and administers our equity compensation plans, our nonqualified deferred compensation arrangements and our 401(k) plan
¾ Advises management in attracting, developing and retaining key employees, including review of inclusion and diversity initiatives.
|
| Board Governance and Nomination Committee
Members: Jeffrey Skelton (Chair), Lydia Kennard and William Zollars
Number of Meetings in 2017: 3
¾ Reviews and makes recommendations to the Board on Board organization and succession matters
¾ Assists the full Board in evaluating the effectiveness of the Board and its committees
¾ Reviews and makes recommendations for committee appointments to the Board
¾ Identifies individuals qualified to become Board members consistent with any criteria approved by the Board and proposes to the Board a slate of nominees for election to the Board
¾ Assesses and makes recommendations to the Board on corporate governance matters
¾ Develops and recommends to the Board a set of corporate governance principles applicable to the company
¾ Assists the Board in reviewing and approving the company’s activities, goals and policies concerning environmental stewardship and social responsibility matters
¾ Reviews the adequacy of our governance guidelines on an annual basis and focuses on reputational and corporate governance risks
|
| Executive Committee
Members: Jeffrey Skelton (Chair), Irving Lyons III and Hamid Moghadam
Number of Meetings in 2017: 4
¾ Acts only if action by the Board is required, the Board is unavailable and the matter to be acted on is time-sensitive
¾ Has all of the powers and authority of the Board, subject to such limitations as the Board, the committee’s charter and/or applicable law, rules and regulations may from time to time impose
|
|
|
23 | |||
|
BOARD OF DIRECTORS AND CORPORATE GOVERNANCE
|
||
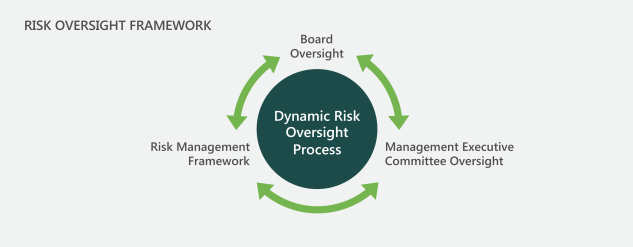
Board’s role in risk oversight
Risk awareness is embedded throughout our operations, underpinned by an integrated framework for identifying, assessing and managing risk.
The Board has the primary responsibility for overseeing risk management of the company. Oversight for certain specific risks falls under the responsibilities of our Board committees.
| ¾ | The Audit Committee focuses on financial and cybersecurity risks relating to the company. |
| ¾ | The Compensation Committee focuses on risks relating to talent retention and remuneration of our officers and employees. |
| ¾ | The Governance Committee focuses on reputational and corporate governance risks and ESG. |
These committees regularly advise the full Board of their risk oversight activities.
Critical components of our risk oversight framework include regular communication among the Board, our management executive committee and our risk management infrastructure to identify, assess and manage risk.
Identifying, Managing and Assessing Risks
Our risk oversight framework includes:
| ¾ | Board engagement with executive and risk management teams including multi-dimensional risk reviews, risk assessment mapping and one-on-one interviews between each director and our risk management team |
| ¾ | Executive management committee meetings focused on strategic risks |
| ¾ | A structured approach to capital deployment vetted through weekly investment committee meetings |
|
|
24 | |||
|
BOARD OF DIRECTORS AND CORPORATE GOVERNANCE
|
||
| ¾ | Management of one of the strongest balance sheets in the REIT industry achieved by lowering our financial risk and foreign currency exposure |
| ¾ | Rigorous internal and third-party audits assessing the company’s controls and procedures |
| ¾ | Centralized team dedicated to managing risk globally closely engaged with Prologis’ teams at an individual market level |
CEO and management succession planning
The Board is responsible for ensuring that we have a high-performing management team in place. The Board, with the assistance of the Compensation Committee, regularly conducts a detailed review of management development and succession planning activities to ensure that top management positions, including the CEO position, can be filled without undue interruption.
Communications with directors
We appreciate your input. You can communicate with any of the directors, individually or as a group, by writing to them in care of Edward S. Nekritz, Secretary, Prologis, Inc., Pier 1, Bay 1, San Francisco, California 94111. Such communications will be reviewed and forwarded to the appropriate director. Each communication intended for the Board and received by the secretary that is related to the operation of the company and is not otherwise commercial in nature will be forwarded to the specified party following its clearance through normal security procedures. The directors will be advised of any communications that were excluded through normal security procedures as appropriate and they will be made available to any director who wishes to review them.
Director attendance
The Board held four meetings in 2017, including telephonic meetings, and all of the directors attended 75% or more of the aggregate number of Board and applicable committee meetings on which he or she served during 2017 (held during the periods they served). Each director standing for election in 2018 is expected to attend the annual meeting of stockholders, either in person or telephonically, absent cause. All of our directors attended the annual meeting last year, in person or telephonically.
Director compensation
Please see “Director Compensation” and the table titled “Directors Compensation for Fiscal Year 2017.”
|
|
25 | |||
|
BOARD OF DIRECTORS AND CORPORATE GOVERNANCE
|
||
Stock ownership guidelines and prohibition on hedging/pledging
Our directors must comply with our stock ownership guidelines which require the director to maintain an ownership level in our common stock equal to five times the annual cash retainer (a total of $550,000 as of December 31, 2017). Shares included as owned by directors for purposes of the guidelines include common stock owned, vested or unvested equity awards (restricted stock, restricted stock units, shares and share units deferred under the terms of the Director Deferred Fee Plan or the applicable non-qualified deferred compensation plan, deferred share units and dividend equivalent units) and operating partnership or other partnership units exchangeable or redeemable for common stock. Until such time as the ownership thresholds are met, we will require directors to retain and hold 50% of any net shares of our common stock issued to our directors under our equity compensation plans.
Additionally, our insider trading policy prohibits our directors and employees from hedging the economic risk of ownership of our common stock and from pledging shares of our common stock.
All of our directors are currently in compliance with the stock ownership guidelines and the prohibition on hedging and pledging our common stock.
Independent compensation consultant
The Compensation Committee directly engages an outside compensation consulting firm, Frederic W. Cook & Co., Inc. (“FW Cook”) to assist the committee in assessing our compensation programs for our Board, our CEO and other members of executive management. FW Cook reports directly to the Compensation Committee. FW Cook receives no compensation from the company other than for its work in advising the Compensation Committee and maintains no other economic relationships with the company. FW Cook interacts directly with members of our management only on matters under the Compensation Committee’s oversight.
FW Cook conducted a comprehensive competitive review of the compensation program for our executive officers and our non-employee directors in 2017, which was used by the Compensation Committee to assist it in making compensation recommendations to the Board. Our CEO makes separate recommendations to the Compensation Committee concerning the form and amount of the compensation of our executive officers (excluding his own compensation). FW Cook has also assisted the Compensation Committee in evaluating the design of certain outperformance compensation plans implemented in 2012.
Annually, the Compensation Committee considers the independence of FW Cook in light of the rules regarding compensation committee advisor independence mandated under the Dodd-Frank Wall Street Reform and Consumer Protection Act (“Dodd-Frank Act”). The Compensation Committee reviewed factors, facts and circumstances regarding compensation consultant independence, including a letter from FW Cook addressing FW Cook’s and their consulting team’s
|
|
26 | |||
|
BOARD OF DIRECTORS AND CORPORATE GOVERNANCE
|
||
independent status with respect to the following factors: (i) other services provided to us by FW Cook; (ii) fees we pay to FW Cook as a percentage of their total revenues; (iii) FW Cook’s policies and procedures that are designed to prevent conflicts of interest; (iv) any business or personal relationship between FW Cook or members of their consulting team that serves the Compensation Committee and a member of the Compensation Committee; (v) any shares of our stock owned by FW Cook or members of their consulting team that serves the Compensation Committee; and (vi) any business or personal relationships between our executive officers and FW Cook or members of their consulting team that serves the Compensation Committee. After discussing these factors, facts and circumstances, the Compensation Committee affirmed the independent status of FW Cook and concluded that there are no conflicts of interest with respect to FW Cook.
Compensation Committee interlocks and insider participation
No member of the Compensation Committee: (i) was, during the year ended December 31, 2017, or had previously been, an officer or employee of the company or (ii) had any material interest in a transaction with the company or a business relationship with, or any indebtedness to, the company. No interlocking relationships existed during the year ended December 31, 2017, between any member of the Board or the Compensation Committee and an executive officer of the company.
Code of Ethics and Business Conduct and Governance Guidelines
The Board has adopted a code of ethics and business conduct that applies to all employees and directors. The Board has formalized policies, procedures and standards of corporate governance that are reflected in our Governance Guidelines.
Our Code of Ethics and Business Conduct outlines in great detail the key principles of ethical conduct expected of our employees, officers and directors, including matters related to conflicts of interest, use of company resources, fair dealing, and financial reporting and disclosure. The code establishes formal procedures for reporting illegal or unethical behavior to the company’s internal ethics committee. These procedures permit employees to report any concerns, including concerns about the company’s accounting, internal accounting controls or auditing matters, on a confidential or anonymous basis if desired. Employees may contact the ethics committee by e-mail, in writing, by web-based report or by calling a toll-free telephone number. Any significant concerns are reported to the Audit Committee in accordance with the code.
Simultaneous Board service
Our governance guidelines require that, if a director serves on three or more public company boards simultaneously, including our Board, a determination is
|
|
27 | |||
|
BOARD OF DIRECTORS AND CORPORATE GOVERNANCE
|
||
made by our Board as to whether such simultaneous service impairs the ability of such member to effectively serve the company. Messrs. Fotiades, Losh, Lyons, O’Connor and Zollars currently serve on at least three public company boards, including our Board. In each case, our Board has determined that such simultaneous board service does not impair the Board member’s ability to be an effective member of our Board. None of our directors currently serve on more than four public company boards (including our Board).
Certain relationships and related party transactions
We do not have any related party transactions to report under relevant SEC rules and regulations. According to our Articles of Incorporation, the Board may authorize any agreement or other transaction with any party even though one or more of our directors or officers may be a party to such an agreement or is an officer, director, stockholder, member or partner of the other party if: (i) the existence of the relationship is disclosed or known to the Board, and the contract or transaction is authorized, approved or ratified by the affirmative vote of not less than a majority of the disinterested directors, even if they constitute less than a quorum of the Board; (ii) the existence is disclosed to the stockholders entitled to vote, and the contract or transaction is authorized, approved or ratified by a majority of the votes cast by the stockholders entitled to vote (excluding shares owned by any interested director or officer or the organization in which such person is a director or has a material financial interest); or (iii) the contract or transaction is fair and reasonable to the company.
We recognize that transactions between us and related parties can present potential or actual conflicts of interest and create the appearance that our decisions are based on considerations other than the company’s best interests and the best interests of our stockholders. Related parties may include our directors, executives, significant stockholders and immediate family members and affiliates of such persons. Accordingly, several provisions of our code of ethics and business conduct are intended to help us avoid the conflicts and other issues that may arise in transactions between us and related parties, prescribing that:
| ¾ | employees will not engage in conduct or activity that may raise questions as to the company’s honesty, impartiality or reputation or otherwise cause embarrassment to the company; |
| ¾ | employees shall not hold financial interests that conflict with, or leave the appearance of conflicting with, the performance of their assigned duties; |
| ¾ | employees shall act impartially and not give undue preferential treatment to any private organization or individual; and |
| ¾ | employees should avoid actual conflicts or the appearance of conflicts of interest. |
These provisions of our code of ethics and business conduct may be amended, modified or waived by the Board or the Governance Committee, subject to the disclosure requirements and other provisions of the rules and regulations of the SEC and the NYSE.
|
|
28 | |||
|
BOARD OF DIRECTORS AND CORPORATE GOVERNANCE
|
||
No waivers of our code of ethics and business conduct were granted in 2017.
Although we do not have detailed written procedures concerning the waiver of the application of our code of ethics and business conduct or the review and approval of transactions with directors or their affiliates, our directors would consider all relevant facts and circumstances in considering any such waiver or review and approval.
|
|
29 | |||
|
|
||
Biographies of our executive officers as of December 31, 2017, other than Mr. Moghadam, are presented below. Information for Mr. Moghadam is included above under “Board of Directors and Corporate Governance.” All of our executive officers are named executive officers (each an “NEO”).
Thomas S. Olinger: Chief Financial Officer
Mr. Olinger, 51, has been our chief financial officer since May 2012 and was our chief integration officer from June 2011 to May 2012. Mr. Olinger was the chief financial officer of AMB from March 2007 to June 2011. Prior to joining AMB in February 2007, Mr. Olinger was the vice president and corporate controller at Oracle Corporation, an enterprise software company and provider of computer hardware products and services. Prior to his employment with Oracle, Mr. Olinger was an accountant and partner at Arthur Andersen LLP, where he served as the lead partner on our account from 1999 to 2002. Since January 2011, Mr. Olinger has served as a director of American Assets Trust, a real estate investment trust investing in retail, office, and residential properties. Mr. Olinger holds a Bachelor of Science degree in finance from the Kelley School of Business at Indiana University.
Eugene F. Reilly: CEO, The Americas
Mr. Reilly, 57, has been CEO, the Americas, since the Merger in June 2011, and he served as president, the Americas, as well as a number of other executive positions, at AMB from October 2003 until the Merger in June 2011. Mr. Reilly serves on the technical committee of FIBRA Prologis, a publicly traded Mexican REIT that is sponsored and managed by the company. Prior to joining AMB in October 2003, Mr. Reilly was chief investment officer of Cabot Properties, Inc., a private equity industrial real estate firm of which he was also a founding partner. From August 2009 until December 2015, Mr. Reilly served as a director of Strategic Hotels and Resorts, an owner and asset manager of high-end hotels and resorts. Mr. Reilly holds an A.B. degree in economics from Harvard College.
Edward S. Nekritz: Chief Legal Officer, General Counsel and Secretary
Mr. Nekritz, 52, has been our Chief Legal Officer, general counsel, and secretary since the Merger in June 2011. Mr. Nekritz was general counsel of the Trust from December 1998 to June 2011 and secretary of the Trust from March 1999 to June 2011. Mr. Nekritz serves on the technical committee of FIBRA Prologis. Prior to joining the Trust in September 1995, Mr. Nekritz was an attorney with Mayer, Brown & Platt (now Mayer Brown LLP). Mr. Nekritz holds a Juris Doctor degree from the University of Chicago Law School and an A.B. degree in government from Harvard College.
Gary E. Anderson: CEO, Europe and Asia
Mr. Anderson, 52, has been our CEO, Europe and Asia, since the Merger in June 2011. Mr. Anderson held various positions with the Trust from August 1994 to June 2011, including head of the Trust’s global fund business from March 2009 to June 2011 and president of the Trust’s European operations from November
|
|
30 | |||
|
EXECUTIVE OFFICERS
|
||
2006 to March 2009. Prior to joining the Trust, Mr. Anderson held various positions with Security Capital Group Incorporated, a diversified real estate investment company. Mr. Anderson holds a Master of Business Administration in finance and real estate from the Anderson Graduate School of Management at the University of California at Los Angeles and a Bachelor of Arts in marketing from Washington State University.
Michael S. Curless: Chief Investment Officer
Mr. Curless, 54, has been our chief investment officer since the merger in June 2011. Mr. Curless was chief investment officer of the Trust from September 2010 to June 2011, and he was with the Trust in various capacities from August 1995 through February 2000. Mr. Curless was president and a principal at Lauth, a privately-held national construction and development firm, from March 2000 until rejoining the Trust in September 2010. Prior thereto, he was a marketing director with the Trammell Crow Company. Mr. Curless holds a Master of Business Administration in finance and marketing and a Bachelor of Science in finance from the Kelley School of Business at Indiana University.
|
|
31 | |||
|
ENVIRONMENTAL STEWARDSHIP, SOCIAL RESPONSIBILITY AND GOVERNANCE
|
||
Prologis’ Approach to Environmental Stewardship, Social Responsibility and Governance (ESG)
Our Investment in the Future
| ¾ The principles of ESG are a natural fit in our business strategy. ESG is good business. It aligns with our longstanding commitment to be a valued partner for our customers and an exemplary citizen, minimizing our environmental impacts and maximizing returns for our stakeholders.
¾ Since our founding, we have invested in ESG. By taking the long view, we invest in the future. It took vision and years of advance planning to build our infrastructure—positioning our assets in the right locations, building scale globally, strengthening our balance sheet and cultivating our talent and our relationships with our customers and communities.
¾ Our forward-thinking approach anticipated that our customers would want modern sustainable logistics space in critical centers of trade. We understood that our customers would want efficient space where their employees could work comfortably and conveniently. We know that our facilities need to be resilient to stay a step ahead of customer needs and withstand the test of time.
¾ The right assets in the right locations are scarce. We knew that it takes time (sometimes decades) to acquire and develop land in strategic infill locations close to the end-consumer. This can require the clean-up of contaminated urban brownfield sites that are too complicated for others to touch. It takes time and talent to forge good working relationships with local communities and find solutions to drive these complicated projects to completion. It takes a strong balance sheet with the capital to invest in these projects and innovations that address customer needs.
¾ Our approach to social responsibility strengthens the symbiotic relationship we have with our customers, communities and employees. This approach positions us well to address the needs of our customers. Stronger customer and community relationships enhances customer longevity and deepens our presence in critical locations. Our talent is essential to execute our customer-focused business plan.
¾ Staying ahead of customer needs is fundamental to great customer service. Our scale gives us the infrastructure to enhance our customer experience and stay close to our customers through active engagement across the globe.
¾ Good governance at all levels gives us the resilience to grow responsibly. We commit to transparency and the highest levels of integrity in all of our business interactions. Such transparency allows our investors to better assess risk and improves their ability to value our company.
|
Top ESG performer
Listed on Dow Jones Sustainability Index North America for |
|
|
33 | |||
|
ENVIRONMENTAL STEWARDSHIP, SOCIAL RESPONSIBILITY AND GOVERNANCE
|
||

Our environmental goals and objectives are linked with our strategic business goals and objectives
|
¾ Enduring relationships with our customers is a competitive advantage. This focus strengthens customer longevity and retention, improving our returns over time. Repeat customers are critical, representing 89% of our leasing operations business.
¾ Sustainability is of growing importance to our customers’ success, becoming more influential in their purchasing decisions, as well as the decisions of their customers, the end-consumer. Demonstrating strong interest in sustainability, approximately 70% of our top 25 customers report their progress on sustainability indices such as the Carbon Disclosure Project (“CDP”).
¾ As the long-term owner of buildings we develop, we design with the future in mind. We have a vested interest in building resilient logistics facilities with modern sustainable features that will continue to meet customer demand and help customers run their operations as efficiently as possible.
¾ Prologis Park Dunstable is a good example of our ability to take an urban brownfield site and transform it into modern, efficient space. This project won a 2018 BREEAM(1) regional award for superior sustainable design and performance. At this site, we reduced the need for energy, installed roof lights and LED lighting and ensured high levels of air tightness and insulation. We also installed a rooftop solar structure with a system to provide pre-heated air to the office areas and a rooftop thermal infrastructure to generate hot water.
|
NAREIT Industrial Leader in the Light
Recognized for superior and sustained sustainability practices for six consecutive years |
| (1) | BREEAM is “Building Research Establishment’s Environmental Assessment Method” |
|
|
34 | |||
|
ENVIRONMENTAL STEWARDSHIP, SOCIAL RESPONSIBILITY AND GOVERNANCE
|
||
| ¾ | Our refurbishments at Prologis Park Pineham demonstrate how we innovate to provide our customers with cost-efficiencies and valuable data. Lighting is typically the largest electrical load in a distribution center, accounting for up to two-thirds of electrical use. Our facilities can operate on a 24-hour basis, which means that lighting can represent a significant cost to our customers. Prologis Park Pineham was fitted with a motion sensitive LED lighting system, which automatically dims when natural daylight is available or when there is no movement, thereby reducing energy costs for our customers. Our customers in this facility can view data on light level, occupancy movement and energy consumed on a wireless dashboard that can be accessed from anywhere at any time. |

| ¾ | We reduced Scope 1 and Scope 2 greenhouse gas (“GHG”) emissions(1) of our corporate operations by approximately 22% between 2011 and 2016. This surpassed our goal of a 20% reduction of corporate GHG emissions by 2020 four years in advance. |
| ¾ | In 2017, we publicly committed to set a science-based GHG emission reduction target as part of the Science Based Targets Initiative, also supported by many of our top customers. |
| (1) | Please see Appendix A for a definition of Scope 1 and Scope 2 GHG. |
|
|
35 | |||
|
ENVIRONMENTAL STEWARDSHIP, SOCIAL RESPONSIBILITY AND GOVERNANCE
|
||
PROLOGIS ENVIRONMENTAL STEWARDSHIP
| ¾ | Demonstrating our leadership in our industry, we were the first logistics real estate company in North America to publish an annual sustainability report in accordance with Global Reporting Initiative (“GRI”) Standards (and have been reporting according to the GRI guidelines since 2006). We also conduct annual GRESB reporting and annually disclose our independently verified carbon footprint to CDP. |
| 2017 RESULTS
|
PROGRESS
| |||||
| 112MSF |
LEED, BREEAM, CASBEE, DGNB, HQE or other certified space(1) |
|
Goal: 100% of new development designed with a goal of certification(2)
| |||
| 304 |
projects
|
|||||
| 17 |
countries
|
|||||
|
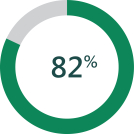
82% |
of our operating portfolio has energy-efficient lighting(3)
|
|
Goal: 100% energy-efficient lighting across our operating portfolio | |||
|
175MW |
of total solar generating capacity—sufficient to power over 26,000 average-sized homes globally
|
|
Goal: 200 MW of solar by 2020 | |||
| (1) | “LEED” is Leadership in Energy and Environmental Design, “BREEAM” is Building Research Establishment’s Environmental Assessment Method, “CASBEE” is Comprehensive Assessment System for Built Environment Efficiency, “DGNB” is the German Sustainable Building Council and “HQE” is High Quality Environment. |
| (2) | Or with sustainable design features where appropriate and in line with customer specifications. |
| (3) | Based on 96% of the portfolio surveyed. We define efficient lighting as LED and T5 and T8 fluorescent lighting. |
|
|
36 | |||
|
ENVIRONMENTAL STEWARDSHIP, SOCIAL RESPONSIBILITY AND GOVERNANCE
|
||

Prologis Ports Jersey City
Spotlighting the interconnection of Prologis development acumen with ESG
| ¾ | Prologis Ports Jersey City Distribution Center is a LEED-certified crown jewel in our portfolio. However, it was not always one. This project is a prime example of how our commitment to environmental stewardship and social responsibility naturally intersects with how we create value for our business, our stockholders, customers and communities. |
| ¾ | This Jersey City site was a former landfill. Multiple fires had erupted on the site due to the unpredictable chemical brew dumped there. No one wanted to touch it for decades. It required working with the communities, environmental protection agencies, waste management organizations and local and state political leadership. We had the expertise to find solutions, clean it up and make it a productive site benefitting the community, our customers and our business. |
| ¾ | For decades, the city had received no tax revenue from the unused site. After the completion of our development, the city received an estimated $1.7 million annually from this property. About 800 full-time workers found employment at this facility after this property was leased up upon completion. Our customers enjoy the modern efficiency of this facility in a prime location proximate to millions of end-consumers. |
|
|
37 | |||
|
ENVIRONMENTAL STEWARDSHIP, SOCIAL RESPONSIBILITY AND GOVERNANCE
|
||

Building customer, investor and community relationships and investing in our talent serves a critical business purpose
| ¾ Better relationships mean better business. Our commitment to social responsibility extends to our stakeholders—customers, investors, communities and employees. We strive to be a good neighbor and employer and endeavor to strengthen the communities where we work and live. |
Strong ESG practices
Recognized by FTSE4Good for 13 consecutive years | |
|
Customer partnerships
|
||
| ¾ Our customer service infrastructure runs deep and wide. Our global customer team fosters strong relationships with our customers to provide solutions across our global portfolio. We also have local offices in every key market to service our customers on the ground level.
¾ Our in-house property management team takes pride of ownership in keeping watch over our properties, providing a level of vigilance that outsourced providers cannot match.
¾ Our customer experience team is dedicated to understanding our customers and developing programs to enhance our customer experience on a broader level, a benefit of our scale and global footprint.
¾ We are investing in programs to train workers for our customers in local communities to address labor shortages, as well as a pilot project to establish industry design standards for tenant wellness.
¾ We work with customers on our Customer Sustainability Advisory Council to open communication channels in order to understand their top priorities. We learned, for example, that all customers on the council had set, or were establishing, science-based carbon emission targets. We also educate our customers on recommended sustainability practices, as well as conduct tenant safety training to ensure safe conditions in our buildings. |
|
|
38 | |||
|
ENVIRONMENTAL STEWARDSHIP, SOCIAL RESPONSIBILITY AND GOVERNANCE
|
||
|
Investor outreach
|
||
| ¾ Our public and private investor teams are committed to consistent engagement with our stockholders and strategic capital investors through frequent communication, in-person and telephonic meetings, investor forums, annual meetings and outreach roadshows.
¾ Through such engagement, we learned that our public and private investors want to place their capital in organizations that have strong ESG practices embedded in their business.
¾ In 2017, we participated in stockholder outreach with our lead independent director and the chair of our Talent and Compensation Committee (the “Compensation Committee”) to meet with over 70% of our stockholders to discuss our ESG and compensation programs. Our stockholders appreciated the opportunity to speak directly with our directors outside of the annual meeting season unrelated to a specific request or proposal. Many of our stockholders highlighted ESG as a current priority for them and their respective clients.
¾ Each of our funds has a dedicated team that meets with their respective investors at least quarterly to review performance and discuss strategic planning. Our ESG team conducts sustainability outreach with our fund investors regularly to review GRESB and other sustainability indices. Our team also includes an ESG section in each quarterly fund report. |
70%
of our stockholders met by our lead director and compensation committee chair in 2017 | |
|
Community involvement
|
||
| ¾ Our work in our communities has a critical business purpose. Location is key to our business. Strengthening our presence in critical locations requires deepening relationships with the communities in which we do business. Developing in these critical locations requires a good working relationship with the communities. Investing in the communities through our volunteerism and charitable programs builds trust, which leads to better solutions when we need them.
¾ The Prologis Foundation supports many charitable contribution programs, such as our Dollars for Doers program (matching dollars for volunteer hours spent) and our Matching Gifts program (matching dollars for employee donations to charities). Over $12 million has been donated through the Prologis Foundation in the last five years.
¾ Our Space for Good program donates available logistics space on a short-term basis to charitable organizations in need. We have donated more than 500 months of rent-free space to 89 non-profits in the last five years.
¾ Further reflecting our commitment to our communities, we sponsor employee volunteers servicing the needs of our communities. In the last five years, our employees volunteered over 50,000 hours of Prologis-sponsored community service. We sponsor an annual Impact Day of service for all Prologis employees across the globe, resulting in over 8,000 volunteer hours benefitting 38 nonprofit organizations in 2017. |
|
|
39 | |||
|
ENVIRONMENTAL STEWARDSHIP, SOCIAL RESPONSIBILITY AND GOVERNANCE
|
||
Employee health and wellness
| ¾ We focus on human capital management to grow an inclusive and diverse workforce. By engaging with our employees and investing in their careers through training and development, we are building a talent pool capable of executing our business strategies.
¾ Our CEO launched a company-wide initiative to leverage the competitive advantage brought by tapping talent identified through inclusion and diversity practices. In 2017, the Compensation Committee was reoriented and renamed the “Talent and Compensation Committee” to add a top-level focus on the identification and retention of talent, including our inclusion and diversity initiative. Inclusion and diversity was also integrated in our 2017 bonus assessments as a bonus performance metric.
¾ We also sponsor scholarship and internship programs with industry organizations to create a pipeline of women and minorities prepared for development and operations positions in commercial real estate.
¾ Our Activate Wellness initiative focuses on the overall well-being and productivity of our employees. This initiative includes programs encouraging regular exercise and health monitoring as well as financial counseling, skill development training and volunteering.
¾ As we strive to make Prologis a great place to work, we listen to our employees to be able to enhance their experience, advance their skill sets and further their careers with us. As part of our regular employee engagement, we conduct a biennial global employee survey to track employee satisfaction and address areas of improvement. Our 2017 survey had a 98% participation rate. |
|
|
40 | |||
|
ENVIRONMENTAL STEWARDSHIP, SOCIAL RESPONSIBILITY AND GOVERNANCE
|
||

Strong governance and oversight ensures the resilience of our business, creating a culture of uncompromising integrity
| ¾ Good governance builds the long-term resilience of our business. Strong oversight at all levels ensures a strong foundation that will continue to create value, supporting sustainable financial and operating performance over the long term.
Board independence, composition and diversity
¾ A board of directors with the right set of skills and backgrounds, provides the most effective oversight over the company and its strategies. We seek diversity of thought and perspective that comes from a mix of gender, geographic location, cultural background, skill set, tenure and experience.
¾ Our annual Board evaluation process identifies current needs and ferrets out concerns. This process is coupled with deep and frequent touch points by our lead independent director across all aspects of our Board and Board committee processes.
¾ To continue to refresh our Board, we have nominated Ms. Cristina Bita as a new candidate in our 2018 director elections. As a business finance and global marketing executive at Google, Ms. Bita has a substantial background in technology and finance that will support our Audit Committee and our current initiatives in innovation and technology. If she is elected, our Board will have two female directors and ten out of eleven directors will be independent.
Stockholder rights
¾ Our industry-leading governance program focuses foremost on good communication with our investors.
¾ Our extensive outreach to our stockholders in 2017 by our lead director and Compensation Committee chair evidences this commitment. As we will discuss later, we have made several changes to our ESG and compensation programs in response to investor input—including the addition of this in-depth discussion of our ESG strategy in our proxy statement. |
#1 REIT in Corporate Governance
By Green
Street Advisors |
|
|
41 | |||
|
ENVIRONMENTAL STEWARDSHIP, SOCIAL RESPONSIBILITY AND GOVERNANCE
|
||
|
Risk management framework
¾ Our organization is designed to be resilient.
¾ Risk management lies at the heart of every investment and process decision we make—at all levels. Our Board and Board committees consider risk with each determination made, reviewing multi-dimensional risk charts at every Board meeting. Our investment committee manages capital allocations and financial and legal risks globally, requiring a risk analysis for every applicable transaction. We have devoted a global team to the management of risk to ensure its integration across the company.
¾ Regular access to the teams across the organization is key to good risk management. Our Board interfaces with all levels of management and employees globally and cross-functionally through regular reporting at every meeting. The Board engages with employees directly at regular board dinners and other functions established to open communication channels with the Board across the organization. Every year, our Board visits a field office to meet with local officers and employees.
¾ Oversight runs at the property level as well. We futureproof our buildings to last and remain attractive to our customers in the long-term. A focus on safety, risk management and cost efficiencies is key to maximize net returns. Our development managers are educated in health, safety, ISO 14001 environmental management system standards and applicable sustainability certification rating systems. |
||
|
| ||
|
¾ Good risk management not only requires oversight of our facilities, but it also involves strong crisis management to ensure business continuity for our customers. As an example, our development at Prologis Park Zama 2 incorporates numerous design features that spotlight the resilience of our facilities, as well as our focus on our customers’ business continuity needs.
¾ This development has a seismic isolation system that keeps the facility stable during catastrophic events. In addition, this facility utilizes renewable energy from a rooftop solar installation that can supply power for a portable battery and telecom system in the case of power failure. Business continuity apparatuses, such as generators, earthquake early warning systems and satellite phones, keep operations running during emergencies. |
||
|
|
42 | |||
|
ENVIRONMENTAL STEWARDSHIP, SOCIAL RESPONSIBILITY AND GOVERNANCE
|
||
|
¾ As evidence of the resilience of our buildings and the strength of our risk management program and emergency response procedures, we incurred no customer business interruption loss in the 2017 Florida and Houston hurricanes and Mexico City earthquakes.
Ethics
¾ At Prologis, building an organization with consistent character and unwavering integrity everywhere we operate is a bedrock principle. Our reputation is sacred. It defines us and the type of business we do. To do business, we need our customers and investors to trust us. To trust us, they need to know that we will do the right thing.
¾ Our ethics program starts at the top with our Board and our executive team. Our Board and its committees are updated frequently on compliance. We have a dedicated compliance officer and internal audit team in charge of ensuring and monitoring global compliance across our operations. Foreign Corrupt Practices Act, anti-corruption and ethics reports are regularly given to our Board and audit committee. Training is conducted at all levels not only to reinforce the tone from the top, but to take ethics down from theory to real life practice. |
|
|
43 | |||
|
ENVIRONMENTAL STEWARDSHIP, SOCIAL RESPONSIBILITY AND GOVERNANCE
|
||
PROLOGIS ESG TEAR SHEET
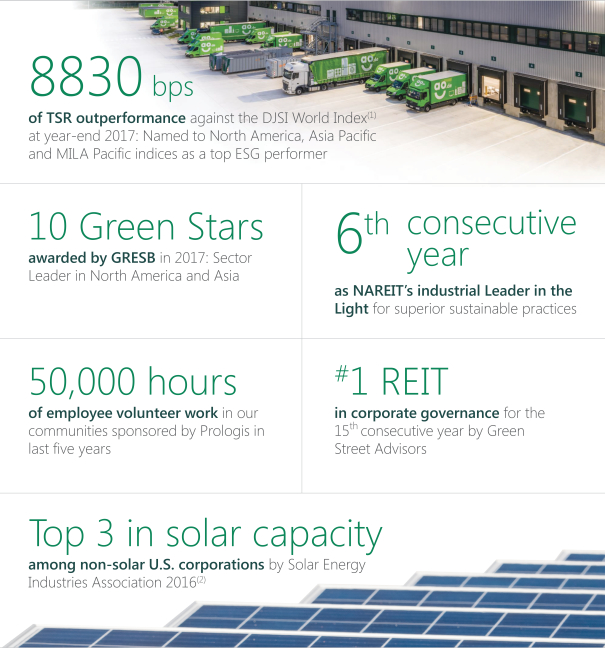
| (1) | “DJSI” is the Dow Jones Sustainability Index. “MILA” is “Mercado Integrado Latino Americano.” |
| (2) | Target and Walmart were the top 2 non-solar U.S. corporations. We were the top real estate company in this ranking. |
|
|
44 | |||
|
COMPENSATION DISCUSSION AND ANALYSIS
|
||
In 2017, we outperformed both operationally and in the equity markets, while managing our business responsibly
| ¾ | We achieved net earnings of $3.06 per share and Core FFO(1) of $2.81 per share, representing an increase of 35% and 9%, respectively, over 2016. Our three-year compound annual growth rate for net earnings and Core FFO per share was 35% and 14%, respectively. |
| ¾ | Our annualized three-year TSR outperformed the Cohen & Steers REIT Index(2) by 1290 basis points and the MSCI REIT Index(2) by 1350 basis points. |
| ¾ | We further assessed and strengthened our compensation programs in response to stockholder feedback to further align stockholder and NEO interests. |
| – | We amended our Prologis Outperformance Plan (“POP”) to add 7-year vesting on the bulk of earned equity starting with the 2018-2020 performance period. Our NEOs voluntarily elected to apply the additional vesting restrictions retroactively to any of their POP awards earned for the 2016-2018 and 2017-2019 performance periods. The NEOs did not receive any benefit in exchange for their election. |
| – | We eliminated the bonus exchange premium for our NEOs starting with the 2018 performance year and extended vesting from 3 to 4 years on the Prologis Promote Plan (“PPP”) and our annual equity awards starting with the 2018 annual compensation cycle. We held NEO base salaries flat in the last two years. |
| (1) | Core FFO per share is a non-GAAP measure. Please see Appendix A for a discussion and reconciliation to the most directly comparable GAAP measure. See Appendix A for a calculation of the compound annual growth rate of our Core FFO per share. |
| (2) | A real estate investment trust is a “REIT.” MSCI US REIT Index is the “MSCI REIT Index” and the Cohen & Steers Realty Majors Portfolio Index is the “Cohen & Steers REIT Index.” |
All company operational information in CD&A is for the year ended or as of December 31, 2017, unless otherwise noted. See Appendix A for definitions and discussion of non-GAAP measurements and reconciliations to the most directly comparable GAAP measures and for additional detail regarding definitions of terms as generally explained in CD&A. The Compensation Committee reviews management’s performance against key company performance measures, such as Core FFO per share, discussed below. See “2017 Compensation Decisions: Annual Base Salary and Bonus Opportunity” for more information about our key performance measures and targets.
|
|
47 | |||
|
COMPENSATION DISCUSSION AND ANALYSIS
|
||
| ¾ | 2017 has been another year of significant accomplishment. |
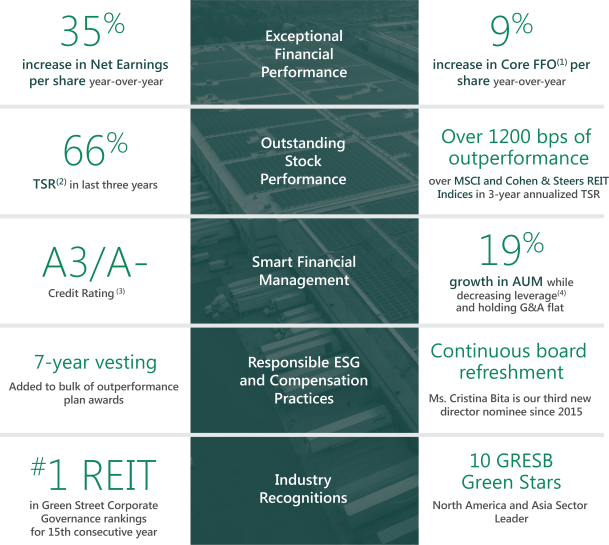
| (1) | Core FFO per share is a non-GAAP measure. Please see Appendix A for a discussion and reconciliations to the most directly comparable GAAP measure. |
| (2) | TSR is calculated based on the stock price appreciation and dividends paid to show the total return to a stockholder over a period of time. TSR assumes dividends are reinvested in common stock on the day the dividend is paid. |
| (3) | Change in ratings by Moody’s and S&P, respectively, in 2016 and maintained in 2017. Maintenance of credit ratings impacts our bonus determinations as discussed later. A securities rating is not a recommendation to buy, sell or hold securities and is subject to revision or withdrawal at any time by the rating organization. |
| (4) | Increase in AUM and decrease in leverage year-over-year. |
|
|
48 | |||
|
COMPENSATION DISCUSSION AND ANALYSIS
|
||
| ¾ | We anticipated the evolution of the global supply chain. Our business model positions us to meet the logistics demand of our global customers in an ever-changing world where location and speed to end-consumer is critical. We have approximately $78.7 billion in AUM in the world’s most vibrant consumption markets in 19 countries. Our substantial strategic capital business and development program are essential to our growth. |
| ¾ | Our compensation program supports our business model. Our compensation is based on performance measured against our operational goals and the TSR indices important to our stockholders. |
| ¾ | Our compensation reflects the level of our outperformance. As demonstrated in 2015, if we miss our established performance metrics, our compensation (largely formulaic in determination) reflects our underperformance. If we outperform, as we did in 2016 and 2017, our compensation reflects our outperformance according to plan formulas. |
| ¾ | When our compensation programs pay out, it means our stockholders also win. When our outperformance plans paid out in 2017, over $13.0 billion in value was created for our stockholders by exceeding the outperformance plan hurdles.(1) |
| (1) | Relating to PPP awards paid in 2017 and POP awards paid for the 2015-2017 performance year. See “CEO POP Award vs. Total Value Created For Stockholders In Exceeding the POP Hurdle” and “CEO PPP Award vs. Total Value Created in Achieving Promote Hurdles” for the calculation of our outperformance. |
|
|
49 | |||
|
COMPENSATION DISCUSSION AND ANALYSIS
|
||
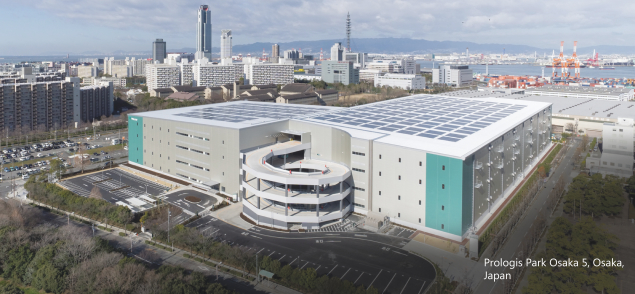
A Unique Business Model Thinking Ahead
| ¾ | Our business model centers around our customers. They want well-located, high quality logistics space in the world’s busiest consumption markets. This space is scarce. It takes time, resources and forward thinking to build a premier portfolio of the right assets in the right places. Predicting this demand more than three decades ago, we positioned our business accordingly and can now leverage our advantage. |
| ¾ | Our customers are multinational companies with logistics needs that span four continents. Generally all of our top 25 customers operate globally and 84% of the top 25 lease from us on multiple continents. |
| ¾ | The combination of our worldwide reach, significant development platform and size and scope of our strategic capital business puts us in a unique category among REITs. |
| ¾ | Our strategic capital partners provide capital that enables us to grow and own and manage properties across the globe in locations vital to our customers. |
| ¾ | Through our development business, we innovate to satisfy customer demand, deepen our market presence and refresh our portfolio quality. We build modern, sustainable and resilient facilities at the nucleus of the global supply chain. |
| ¾ | We utilize our scale to our advantage. We are working to give our customers the benefits our scale can provide—global customer service, procurement cost-savings and data intelligence to name a few. Thinking ahead of what is next, we are positioned to capture value beyond real estate that our global scale can bring. |
|
|
50 | |||
|
COMPENSATION DISCUSSION AND ANALYSIS
|
||
Our Operations Demonstrate Continued Strength
| ¾ | We rent logistics space in prime metropolitan locations to global customers such as Amazon, DHL, FedEx and Wal-Mart. Our operations generate income and cash flow by maintaining high occupancy and increasing rents. |
| ¾ | We continue to demonstrate strength in our operations, reporting average occupancy across our owned and managed portfolio of 96.3% in 2017. |
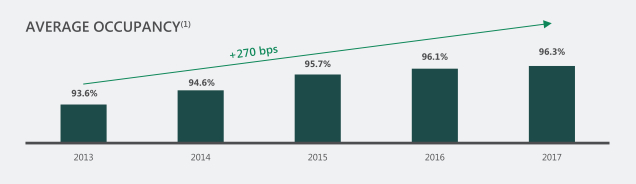
| (1) | Average occupancy is calculated across our owned and managed portfolio. |
|
|
51 | |||
|
COMPENSATION DISCUSSION AND ANALYSIS
|
||
Our Development Business Creates Significant Value
| ¾ | Developing well-located land into income-generating logistics facilities unlocks the value potential in raw assets. |
| ¾ | In 2017, we stabilized(1) development projects totaling $2.3 billion, creating approximately $660 million in value over our total expected investment in the properties.(2) |
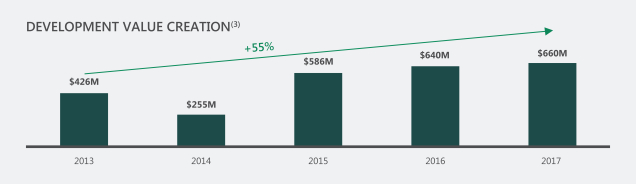
| (1) | Stabilized developments are generally properties that are completed and substantially leased. |
| (2) | Value created over our total expected investment through development and leasing activities based on current projections. Please see Appendix A for further detail regarding how we calculate “value creation.” |
| (3) | Development value creation is calculated across our owned and managed portfolio. |
|
|
52 | |||
|
COMPENSATION DISCUSSION AND ANALYSIS
|
||
Our Steady Strategic Capital Business Adds Recurring Fee Streams to Our Bottom Line
| ¾ | Our strategic capital business gives us access to third-party capital, both public and private, allowing us to diversify our sources of capital and grow while reducing our foreign currency exposure for investments outside the U.S. As of year-end 2017, we managed six private ventures and two non-U.S. publicly traded vehicles, of which we own 15%-55%. |
| ¾ | Our infinite life co-investment ventures are sources of steady and recurring income. These ventures pay us regular management fees to manage the assets in the ventures’ portfolios. In some ventures, we also receive special incentive fees called promotes if we produce returns on the ventures’ investments over certain hurdles. |
| ¾ | These promote hurdles, different for each venture, are all set at high levels so that, if met, the venture investors achieve significant returns. |
| ¾ | Not only do our venture investors benefit when we exceed promote hurdles, our stockholders reap rewards too. The promotes we earn, in addition to the recurring management fee streams, boost our earnings and cash flows benefitting our stockholders. |
| ¾ | Third-party share of asset management fees(1) and net promotes(2) from our strategic capital ventures have grown by 151% over the last five years. We expect these levels to moderate over time to reflect a regular stream of recurring income. |
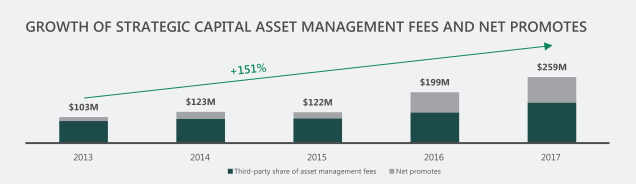
| (1) | Third-party share of asset management fees represents the portion of asset management fees that we receive from third parties and excludes the portion that is attributable to our ownership percentage of the applicable ventures. |
| (2) | Net promotes include actual promotes earned from third-party investors during the period, net of related cash expenses. |
|
|
53 | |||
|
COMPENSATION DISCUSSION AND ANALYSIS
|
||
Smart Management of Risk Protects Long-term Stockholder Value
| ¾ | Our balance sheet remains strong with our Moody’s and S&P credit ratings at A3/A- stable, respectively, in 2017. We are one of the top credit-rated REITs, with $3.6 billion in liquidity at year-end 2017. As a result, our bonds often trade at the tightest credit spreads among other REITs. |
| ¾ | Maintaining our credit ratings is fundamental to our plan for responsible growth. We have grown in AUM by 19% while further decreasing leverage year-over-year in 2017. |
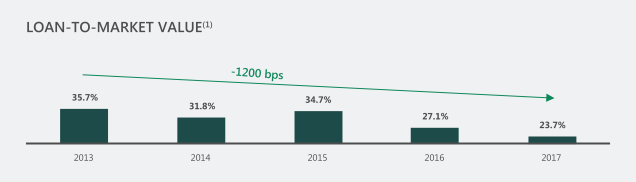
| (1) | Loan-to-Market Value is a non-GAAP measure. A decrease in loan-to-market value ratios demonstrates decreased leverage risk. A loan-to-market value ratio is generally the ratio of our ownership share of debt to our ownership share of our gross market capitalization. |
|
|
54 | |||
|
COMPENSATION DISCUSSION AND ANALYSIS
|
||
Our Business Model Delivers Long-term Growth on Both a Relative and Absolute Basis
| ¾ Our operational outperformance has led to dividend growth surpassing our peers. The three-year compound annual growth rate of our dividends was 10.1% versus that of our domestic industrial REIT comparison group (East Group Properties, First Industrial, DCT Industrial and Duke Realty), which averaged 8.3%.(1) We further increased our dividend for the first quarter of 2018 by 9% to $0.48 per share.
¾ Since 2013, our annual net earnings per share have grown by 378%, Core FFO per share by 70%, our common stock price per share by 75%, and our common stock dividends by 57%. We delivered this growth while also substantially deleveraging. |
||
|
| ||
| (1) | Compound annual growth rates were calculated for the 2013-2017 period, and the averaged rates for our comparison group are weighted by market capitalization. |
| (2) | Core FFO per share is a non-GAAP measure. Please see Appendix A for a discussion and reconciliation to the most directly comparable GAAP measure. |
| (3) | Growth of our year-end common stock price. |
|
|
55 | |||
|
COMPENSATION DISCUSSION AND ANALYSIS
|
||
In response to investor feedback, we implemented the following changes in 2017:
| Amended POP to limit award size and added a long-term vesting period
¾ We amended POP to apply an absolute and lower cap on the potential performance pools, which reduced the maximum pool. We also imposed an additional 7-year cliff vesting requirement on 80% of any earned award.
¾ Although this amendment applies prospectively, our NEOs voluntarily elected to subject any of their POP awards earned for the 2016-2018 and 2017-2019 performance periods to the additional 7-year cliff vesting construct. The NEOs received no benefit in exchange for their election. Our NEOs took this action to demonstrate their commitment to the company and our stockholders.
Increased vesting on annual equity and PPP award from 3 to 4 years
¾ We increased the vesting period on our annual equity and PPP awards starting with the 2018 annual grant cycle.
Held NEO base salaries flat in 2017
¾ Based in part on our annual compensation assessment, we did not increase NEO base salaries in 2017. We have held our NEOs’ base salaries flat for the past two years.
Eliminated bonus exchange premium for NEOs
¾ Starting with bonus opportunities for the 2018 performance period, NEOs will no longer receive a premium for participating in our bonus exchange program. The bonus exchange program with premium will continue to be available to all other employees, encouraging stock ownership at all levels of our organization.
Added inclusion and diversity as a bonus metric
¾ Inclusion and diversity is a key company initiative. To underscore its importance, we included inclusion and diversity as a bonus metric for our bonus opportunity for the 2017 performance year. |
|
|
56 | |||
|
COMPENSATION DISCUSSION AND ANALYSIS
|
||
Discussion and Analysis of CEO Compensation
CEO compensation is a small fraction of significant value created for stockholders
|
¾ In the last five years, Mr. Moghadam has led our company in the creation of $20.3 billion(1) in TSR value for our stockholders. We outperformed the Cohen & Steers REIT Index by 652 basis points and the MSCI REIT Index by 647 basis points in five-year annualized TSR at year-end 2017. His compensation over the same period was only 0.4% of the overall value created for our stockholders.(2)
¾ Under Mr. Moghadam’s leadership, we not only outperformed the Cohen & Steers REIT Index and MSCI REIT Index in the last five years, but have also excelled operationally. Our net earnings per share and our Core FFO per share(3) have grown by 378% and 70%, respectively, since year-end 2012.
¾ In achieving our A3/A-stable credit ratings(4) from Moody’s and S&P, respectively, Mr. Moghadam and his team have overseen the creation of one of the best balance sheets in our industry. As evidence of our long-term resilience, this accomplishment brings tremendous value to our stockholders in the lower cost of capital an A-rated company can command.
¾ AUM under Mr. Moghadam’s leadership has grown exponentially while we have leveraged our scale to keep costs at bay. He positioned us to grow by 63% in AUM over the last five years while reducing G&A as a percentage of AUM.(5)
¾ Mr. Moghadam’s vision foresaw the evolution of the supply chain. He structured our company with the firepower to grasp opportunity and resilience to weather storms. Looking forward, his vision continues. He has driven us to recognize the power of our unmatched scale and the potential of innovation beyond the scope of the typical real estate company.
¾ Mr. Moghadam continues to be heavily invested in the company to prove his deep ongoing commitment to our stockholders. Evidencing this, he receives 93% of his compensation in equity, a higher percentage than 98% of S&P500 CEOs,(6) and continually offers to take 100% of his compensation in equity to further demonstrate his dedication to our organization.
¾ The significant value Mr. Moghadam brings to our company is clear. Respected independent voices beyond our industry affirm it too. Harvard Business Review named Mr. Moghadam as one of the top 100 CEOs in the world in 2016 and 2017. Commercial Property Executive recognized Mr. Moghadam as their 2017 Executive of the Year. He was also the Ernst & Young Entrepreneur of the Year and received the NYU Schack Institute of Real Estate REIT Symposium Visionary Award in 2013, recognizing his value in positioning us for the growth we are realizing today.
|
$20.3 billion
in TSR value created for our stockholders in the last five years |
| (1) | Amount reflects the growth in total equity value over the last five years. This growth is defined as our equity capitalization as of the end of 2017, plus total dividends over the period assuming reinvestment, less equity issuances, equity compensation awards, and our equity capitalization as of the beginning of 2013. |
|
|
57 | |||
|
COMPENSATION DISCUSSION AND ANALYSIS
|
||
| (2) | Calculated using total compensation amounts from summary compensation tables for the years 2013 through 2017. The denominator in this calculation is $20.3 billion, as calculated per footnote 1 above. |
| (3) | Core FFO per share is a non-GAAP measure. Please see Appendix A for a discussion and reconciliation to the most directly comparable GAAP measure. |
| (4) | A securities rating is not a recommendation to buy, sell or hold securities and is subject to revision or withdrawal at any time by the rating organization. |
| (5) | General and administrative expense (“G&A”). Please see definition of “Assets Under Management” in Appendix A for further detail on how we calculated “G&A as a percentage of AUM”. |
| (6) | Using data from the summary compensation table for the full year 2016 and assumes no other bonus exchange program in the S&P500. |
|
|
58 | |||
|
COMPENSATION DISCUSSION AND ANALYSIS
|
||
COMPANY PERFORMANCE DURING CEO TENURE IN THE LAST FIVE YEARS
During Mr. Moghadam’s tenure as CEO in the last five years, the company has created tremendous value for our stockholders under his leadership.
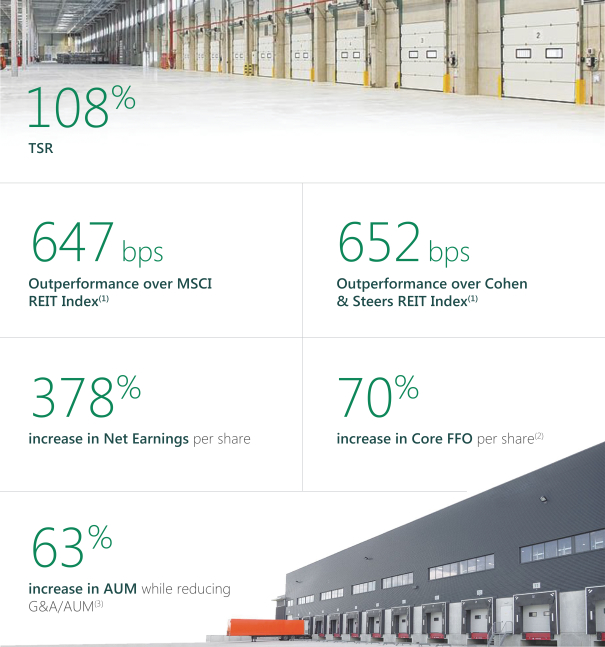
| (1) | Outperformance over the 5-year annualized TSR of the MSCI REIT Index and the Cohen & Steers REIT Index. |
| (2) | Core FFO per share is a non-GAAP measure. Please see Appendix A for a discussion and reconciliation to the most directly comparable GAAP measure. |
| (3) | Please see Appendix A for further detail on how we calculate “G&A/AUM.” |
|
|
59 | |||
|
COMPENSATION DISCUSSION AND ANALYSIS
|
||
CEO Core Compensation for 2017 Performance Year
| ¾ | The Compensation Committee reviews compensation from the standpoint of target core compensation, targeting the market median of a comparison group of large-cap REITs. The committee also assesses outperformance plan compensation, setting it at levels commensurate with extraordinary performance levels. |
SUMMARY OF CEO CORE COMPENSATION FOR 2017 PERFORMANCE YEAR
| Annual Base Salary
|
Annual Bonus
|
Annual LTI Equity Award
|
Aggregate Core
| |||
|
No salary increase in 2017 |
For 2017 performance paid in 2018 Minimum-Target-Maximum 0%-150%-300% of salary
|
For 2017 performance year granted in 2018 |
||||
|
$1,000,000 |
Paid at 137.5% of target ($2,062,500)
|
Paid at $12,375,000
|
$15,437,500 | |||
| (1) | Aggregate core compensation amounts are calculated differently than the total compensation amounts reflected in the Summary Compensation Table. Aggregate core compensation amounts include annual base salary, annual bonus and annual long-term incentive (“LTI”) equity awards for the 2017 performance year. It does not include annual LTI equity awards for the 2016 performance year (paid in 2017), POP awards for the performance period ended 2017 and PPP awards paid in 2017, nor does it include “Other Compensation”, bonus exchange premium amounts and POP participation point amounts (not yet earned) from the Summary Compensation Table. |
|
|
60 | |||
|
COMPENSATION DISCUSSION AND ANALYSIS
|
||
Strong correlation between CEO core compensation and relative three-year TSR and operational performance
| ¾ | The following graphic illustrates the linkage between CEO core compensation and company three-year TSR and Core FFO per share, demonstrating that compensation is aligned with our TSR and operational performance. |
| ¾ | Although we had strong operational performance in 2015, our three-year TSR at the end of 2015 underperformed the TSR indices of our equity formula. As core compensation is primarily comprised of annual LTI equity awards (measured by three-year TSR), our CEO’s core compensation was heavily impacted when annual LTI equity awards were paid out at only 50% of target due to TSR underperformance. |
| ¾ | In 2016, we outperformed both operationally and in TSR performance, and further outperformed in 2017. Our CEO core compensation correlates with this continued increase in operational and TSR performance. |
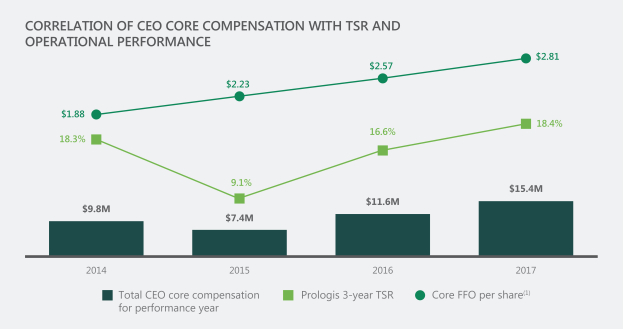
| (1) | Core FFO per share is a non-GAAP measure. Please see Appendix A for a discussion and reconciliation to the most directly comparable GAAP measure. |
|
|
61 | |||
|
COMPENSATION DISCUSSION AND ANALYSIS
|
||
CEO POP award is a small fraction of the $11.8 billion in value created in exceeding the POP hurdle
| ¾ | About 100 participants receive an annual opportunity to earn awards under POP but only if high-reach three-year relative TSR hurdles are met. A POP compensation pool only funds if and to the extent our three-year, compound annualized TSR exceeds the three-year MSCI REIT Index annual return by 100 basis points. |
| ¾ | The POP hurdle is high-reach and formulaic. Due to the difficulty of the performance hurdle, we did not earn awards for the first two performance periods (2012-2014 and 2013-2015) under the plan. |
| ¾ | By surpassing the POP hurdle, we create value for our stockholders above the performance of the MSCI REIT Index. In creating $11.8 billion of value by exceeding the POP hurdle for the 2015-2017 performance period, our CEO earned a $16.5 million POP award. This amount was only 0.1% of the $11.8 billion in outperformance generated for our stockholders above index performance. |
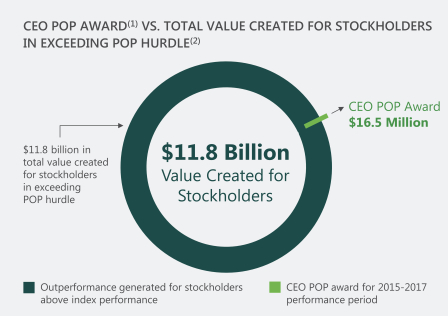
|
CEO POP award is
0.1%
of outperformance generated by exceeding POP hurdle |
| (1) | CEO POP award for the 2015-2017 POP performance period. |
| (2) | We calculate our outperformance by comparing the aggregate dollar value of our actual TSR versus the aggregate value of our TSR had it tracked the TSR of the MSCI REIT Index over the same period of time. The aggregate dollar value of our TSR is generally the sum of (i) the increase in value of existing and newly issued shares, plus (ii) cumulative dividends including reinvestment. Please see POP for further detail regarding the outperformance calculation. Prologis’ aggregate TSR over 2015-2017 was $15.8 billion vs. $4.0 billion had our stock performance matched the performance of the index. |
|
|
62 | |||
|
COMPENSATION DISCUSSION AND ANALYSIS
|
||
CEO PPP awards are a small fraction of the $1.2 billion in value created in achieving PPP hurdles
| ¾ | We also exceeded the difficult promote hurdles of four of our ventures, resulting in payments of PPP awards in 2017. |
| ¾ | PPP awards are earned if Prologis achieves certain high-reach promote hurdles. The promote thresholds relating to PPP awards are certain investment rates of return established as an incentive to Prologis to drive exceptional performance of the applicable venture. |
| ¾ | The promote hurdles are formulaic and difficult to achieve. Promotes are negotiated at arm’s length with institutional investors whose interest is to set the hurdles at superior levels to warrant a payout of incentive fees to the company. |
| ¾ | Our stockholders and venture investors benefit when we exceed the strenuous promote hurdles. Surpassing these promote hurdles means that we increased the net asset value of the applicable ventures to outsized levels, providing superior returns to our venture investors. |
| ¾ | $1.2 billion in aggregate value was created for our stockholders over the relevant measurement periods, which represents Prologis’ ownership share of the net asset value growth of the four applicable private ventures, the management fees paid to Prologis during the measurement periods and the promotes paid to Prologis in achieving the hurdles. |
| ¾ | Due to surpassing the hurdles and earning the promotes, $4.4 million in aggregate PPP awards was paid to our CEO in 2017. These PPP awards were only 0.4% of the $1.2 billion in total value created for our stockholders in achieving the strenuous hurdles. |
| ¾ | As we expect promotes to moderate in size, we anticipate the levels of PPP award opportunities will be impacted downward accordingly. |
|
|
63 | |||
|
COMPENSATION DISCUSSION AND ANALYSIS
|
||

|
CEO PPP awards are
0.4%
of the total value created in achieving the promote hurdles |
| (1) | The “total value created in achieving the promote hurdles” is calculated by determining our ownership share of the growth in net asset value (adjusting for dividends) of the applicable ventures during the incentive period, gross of any promote accrual for the applicable ventures, adding in management fees paid by such ventures to Prologis during the same period. The “total value created in achieving the promote hurdles” excludes equity transactions that, while impacting net asset value, did not create value for the fund, such as capital contributions, returns of capital, etc. It also excludes Prologis’ ownership share of management fees paid to Prologis by the ventures. The promotes relevant to this calculation were the promotes related to the PPP awards paid in 2017. |
|
|
64 | |||
|
COMPENSATION DISCUSSION AND ANALYSIS
|
||
2017 Say-on-Pay Vote and Stockholder Outreach
94% vote in favor of our say-on-pay proposal
| ¾ | At our 2017 annual meeting, our stockholders approved our 2016 executive compensation, with 94%(1) of the voting interests in favor of our proposal. |
Lead director and Compensation Committee chair met with 70% of our stockholders
| ¾ | We believe it is important to communicate regularly with our stockholders. In addition to our day-to-day interactions regarding our financial and operating performance, we conducted significant stockholder outreach in 2017 to discuss our ESG and compensation programs. |
| ¾ | In the fourth quarter of 2017, our lead director, our Compensation Committee chair and management met with more than 70% of our stockholders (by outstanding shares of common stock) to solicit their feedback. Important to our stockholders, we conducted our outreach outside of the annual meeting process unrelated to any specific request. |
| ¾ | Throughout 2017, our top stockholders also had direct and regular access to our CEO and executive team. Members of our executive team had more than 550 in-person meetings with our investors in 2017. We understand from our stockholders that this direct and regular access to our executive team is appreciated and not common for all companies of our size and stature. |
| ¾ | As discussed in the 2017 Compensation Highlights, we instituted a number of changes in response to what we learned during our 2017 outreach roadshow. |
| ¾ | Among these changes, we amended POP to limit award size by applying an absolute cap on the potential performance pools and imposed a 7-year cliff vesting requirement on the bulk of any earned awards. We also extended vesting periods on PPP and annual equity awards from 3 to 4 years. |
| ¾ | Also, we eliminated the bonus exchange premium for the NEOs, effective starting with bonuses for the 2018 performance year, and did not increase their base salaries in 2017. |
Common themes from 2017 outreach roadshow
| ¾ | Our stockholders supported our programs. The overall size of compensation was generally not a concern provided the payouts are supported by performance and value created for stockholders. |
| ¾ | Our stockholders recognized our industry leading corporate governance program. They also appreciated our inclusion and diversity initiative backed with monetary implications as an inclusion and diversity bonus metric. |
|
|
65 | |||
|
COMPENSATION DISCUSSION AND ANALYSIS
|
||
| ¾ | Our stockholders’ interest in our ESG program was another common theme emerging from our outreach. ESG is a growing focal point of our stockholders’ investment mandates, driving a need for a deeper dive into the ESG programs of their investments. |
| ¾ | In response to these learning points of our outreach process, we added a more in-depth discussion of how ESG supports our business strategy. We also included more fulsome discussion about the value created for our stockholders during our CEO’s tenure. |
| (1) | Calculated using a denominator adding the total number of votes cast for our say-on-pay proposal and votes cast against it. Calculated in accordance with voting requirements of our charter, the percentage is 90%. |
|
|
66 | |||
|
COMPENSATION DISCUSSION AND ANALYSIS
|
||
Discussion of Compensation Comparison Group
No REITs represent a true comparison to Prologis
| ¾ | The Compensation Committee sets a competitive reference point for the elements of target total core compensation (annual base salary, annual bonus and annual LTI equity awards) at the market median of a comparison group of large-cap REITs. |
| ¾ | Target compensation is positioned within a reasonable range of the competitive reference point based on the NEO’s level of experience, past performance and anticipated future contributions. |
| ¾ | In May 2017, FW Cook, our independent compensation consultant, conducted its annual compensation analysis on behalf of the Compensation Committee. The comparison group used by FW Cook comprised 10 large-cap REITs that are generally the largest internally managed U.S. publicly traded equity REITs by market capitalization. |
| ¾ | Although the following REITs were among the closest in comparison to us, the combination of our worldwide reach, significant development platform, and size and scope of our strategic capital business put us in a unique category. Such companies may individually demonstrate strength in one or two of these categories, but not in all. |
| Compensation Comparison Group
|
Size(1)
|
Developer(2)
|
Global(3)
|
Strategic
| ||||
|
Prologis
|
✓
|
✓
|
✓
|
✓
| ||||
|
American Tower Corporation
|
✓
|
✓
|
||||||
|
AvalonBay Communities, Inc.
|
✓
|
✓
|
||||||
|
Boston Properties, Inc.
|
✓
|
✓
|
||||||
|
Equinix(5)
|
✓
|
✓
|
✓
|
|||||
|
Equity Residential
|
✓
|
|||||||
|
General Growth Properties, Inc.
|
✓
|
|||||||
|
Public Storage, Inc.
|
✓
|
✓
|
||||||
|
Simon Property Group, Inc.
|
✓
|
✓
|
✓
|
|||||
|
Ventas, Inc.
|
✓
|
✓
|
||||||
| Welltower(5)
|
✓
|
✓
|
✓
|
|||||
| (1) | Size threshold is at least $32.0 billion of AUM based on enterprise value. |
| (2) | Total development portfolio is at least 5% of assets. |
| (3) | Operations outside of United States and Canada. |
| (4) | Based on management of a business including closed and open-ended funds and publicly-traded vehicles. Most comparison companies have joint ventures with one other partner. However, these joint ventures are structured and managed differently from our perpetual life funds (which can raise capital on a continual basis) and publicly traded vehicles with multiple investors that obtain liquidity by redemption or sale of their equity in the vehicles. |
| (5) | As discussed above, our comparison group is generally the ten largest internally-managed U.S. publicly-traded REITs. For the 2017 performance year, Equinix and Welltower replaced Vornado Realty Trust and HCP, Inc. (which were in our comparison group for the 2016 performance year) on this top ten list. |
|
|
67 | |||
|
COMPENSATION DISCUSSION AND ANALYSIS
|
||
Other industrial REITs are too small in size to be used in our comparison group
| ¾ | The comparison group did not include any industrial REITs because they were too small relative to us. The largest other industrial REIT is only 16% of our AUM.(1) |
| ¾ | In our 2017 outreach program, our stockholders expressed that it was important to see how our compensation ties to performance against other industrial REITs. We measure our performance relative to industrial REITs to determine the size of annual LTI equity awards, according to our equity award formula. Annual LTI equity awards are the largest portion of our core compensation. |
AUM is most the appropriate measure to gauge size and scope
| ¾ | Our AUM captures an additional $38.8 billion in assets that we manage but are not included in our consolidated balance sheet. In 2017, these assets generated revenue representing 54% of our owned and managed net operating income.(2) Our NEOs’ compensation is tied to the performance of all assets represented by our AUM, not just our consolidated assets. |
| ¾ | The graphic below shows that our AUM is substantially greater than the AUM(1) of most companies in our compensation comparison group. |
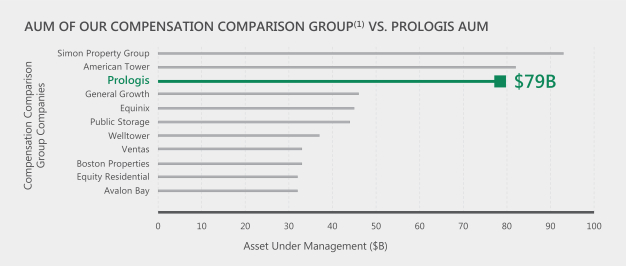
| (1) | AUMs of comparison group companies are derived from publicly available data. Prologis AUM includes estimated investment capacity. |
| (2) | Net operating income is a non-GAAP measure. Please see Appendix A for a discussion and reconciliation to the most directly comparable GAAP measure. |
|
|
68 | |||
|
COMPENSATION DISCUSSION AND ANALYSIS
|
||
Compensation Elements: Target Core Compensation is Geared to Median of Comparison Group
Outperformance plans make up for the size and scope discrepancy but only kick in with exceptional performance
| ¾ | Our overall approach is to pay median compensation for target performance. On a size-adjusted basis, our NEOs’ target core compensation would be below the median of our comparison group. We offer an outperformance opportunity to compensate for the difference in the size and scope of our comparison group. |
| ¾ | The outperformance opportunities are not regular compensation elements. They are only triggered when superior performance hurdles are met. |
HOW COMPENSATION PROGRAM COMPONENTS FIT TOGETHER
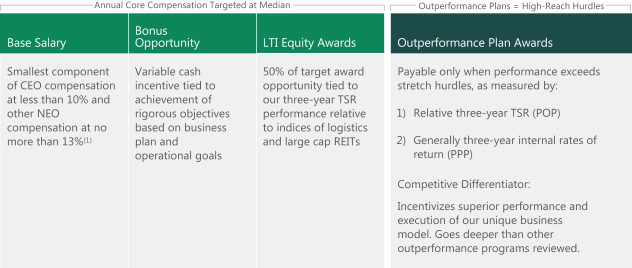
| (1) | Calculated using core compensation for the 2017 performance year. |
|
|
69 | |||
|
COMPENSATION DISCUSSION AND ANALYSIS
|
||
2017 Compensation Decisions: Annual Base Salary and Bonus Opportunity
No increases were made to annual base salaries for 2017 performance year
| ¾ | In assessing the overall compensation package of our NEOs, the Compensation Committee held our CEO’s base salary at $1 million and our other NEOs’ base salaries at $600,000 for the 2017 performance year. |
Annual 2017 bonus is based on operational performance against our strategic priorities
| ¾ | The Compensation Committee establishes annual bonus metrics based on our performance against our strategic priorities, which are weighted according to their significance. Our 2017 weightings changed slightly from 2016 to add an inclusion and diversity bonus metric at a 10% weighting. |
| ¾ | The Compensation Committee first scores corporate performance against our bonus metrics. The 2017 corporate score is the approximate weighted sum of our scores for performance along the categories of portfolio operations, deployment, strategic capital, land bank utilization and sales of non-strategic assets, back office/organization and inclusion and diversity, as discussed below. |
| ¾ | For the 2017 performance year, the Compensation Committee determined that our corporate score was 137.5% of target. |
| ¾ | Each NEO’s bonus is based on corporate and individual performance. Corporate performance determines 80% of our CEO’s bonus and 60% of the bonus for our other NEOs. For highlights of the bonus assessments of our NEOs, please see “Corporate Score and NEO Bonus Assessments” below. |
| ¾ | There is no minimum guaranteed bonus amount for any NEO. The NEO bonus opportunity is also capped (at 200% of target bonus). |
| ¾ | The Compensation Committee approaches our bonus program with rigor in determining bonus hurdles and assessing performance against such hurdles. Our bonus hurdles require strong performance against our strategic priorities for target payments as discussed below. The committee is judicious and restrained in determining our corporate scores, rarely giving a corporate score higher than 175% of target even in times of exceptional operational performance. |
| ¾ | In 2015, for example, when we delivered 19% Core FFO growth, had record-breaking occupancy and increased rents by an average of 13%, the Compensation Committee scored company performance at 162.5% of target. In 2016 and 2017, although we continued to excel operationally, our corporate scores were 155% and 137.5% of target, respectively. |
|
|
70 | |||
|
COMPENSATION DISCUSSION AND ANALYSIS
|
||
| ¾ | As our compensation program as a whole is largely formulaic, the Compensation Committee believes it is appropriate to be able to use their best judgment in determining our bonuses. Their past decisions have proven their ability to use their best judgment in a prudent and responsible manner. This also allows the Compensation Committee the flexibility to avoid unintended consequences and ensure that we are not rewarding individuals hitting formulaic benchmarks to the detriment of the long-term health of the company. |
Our bonus metrics are rigorous and difficult to achieve
| ¾ | Our 2017 bonuses were largely determined by our performance on cornerstone operational metrics (weighted at 35% of our total score): Core FFO per share, average occupancy, same store net operating income (“SSNOI”) growth and rent change on rollovers. These metrics are important to our stockholders in assessing the health and performance of our business. |
| ¾ | Our 2017 bonus targets required performance better than 2016 actual performance. Our target 2017 Core FFO per share bonus metric (including a constant level of promotes) was 6% higher than our actual 2016 Core FFO per share similarly adjusted for a constant level of promotes. (2) Our target 2017 rent change on rollover metric increased by 5% over our actual 2016 rent change on rollover. 2017 average occupancy targets were generally set around the level of actual 2016 average occupancy as our current strategy is to focus on rent increases and maintain current occupancy levels. Our targeted 2017 SSNOI was set at 3.4% growth over actual 2016 performance. |
| ¾ | The Compensation Committee weighted portfolio operational metrics significantly higher than any other bonus metric category (35% vs. 10%-15%). As our 2017 overall bonus score is largely driven by portfolio operational results as the highest component of revenue of our business (and targets for other bonus metric categories are competitively sensitive), we only disclose targets for our operational metrics. |
KEY ANNUAL BONUS METRICS
| 2017
| ||||||||
| Portfolio operations
|
50% of
|
Target performance 100% of Target Bonus
|
200%
of
|
Actual 2017
| ||||
| Core FFO per share(1)(2) |
$2.58 | $2.63 | $2.68 | $2.81 | ||||
| Average Occupancy |
95% | 96% | 97% | 96.3% | ||||
| SSNOI Growth(1)(2) |
2.9% | 3.4% | 3.9% | 3.7% | ||||
| Rent Change on Rollovers(1)(3) |
12.5% | 14.5% | 16.5% | 15.4% | ||||
| (1) | Average Occupancy, SSNOI Growth and Rent Change on Rollovers are based on our owned and managed portfolio. |
| (2) | Core FFO per share and SSNOI are non-GAAP measures. See Appendix A for definitions and discussions of non-GAAP measurements and reconciliations to the most directly comparable GAAP measures. Target Core FFO per share is calculated net of promotes. Actual Core FFO calculated net of promotes is $2.70 per share. |
| (3) | Rent Change on Rollovers is generally the change in rent upon lease renewal. |
|
|
71 | |||
|
COMPENSATION DISCUSSION AND ANALYSIS
|
||
CORPORATE SCORE AND NEO BONUS ASSESSMENTS
|
Portfolio Operations
|
Weighted at 35% | |
|
¾ Our company-wide operational results in 2017 were strong, as described above.
¾ Mr. Reilly exceeded operational targets in the Americas, and Mr. Anderson delivered strong SSNOI(1) growth in Asia. Mr. Nekritz led his team in negotiations and execution of $5 billion in real estate transactions as well as over 2,500 lease transactions.
| ||
|
Deployment
|
Weighted at 15% | |
|
¾ The profitability of our development continues to be strong. We developed more than $2 billion of new assets for an estimated value creation of $660 million on an owned and managed basis and executed approximately $3.8 billion in contributions and dispositions.
¾ Mr. Curless led our build-to-suit program with 38 development starts with $1.1 billion in total estimated investment. Mr. Anderson delivered exceptional deployment and strong stabilization activity in Europe. Under the leadership of Mr. Reilly and Mr. Curless, we disposed of $1.2 billion in assets in the Americas. Mr. Reilly also oversaw $1.3 billion of new development starts in the Americas.
| ||
|
Strategic Capital
|
Weighted at 15% | |
|
¾ Our strategic capital business had an exceptional year. We consolidated two major funds in Europe and two in the U.S. We raised approximately $2.9 billion in capital, increased our third-party capital under management to $28 billion and earned a record level of net promotes of $0.16 per share.
¾ Mr. Anderson and Mr. Nekritz oversaw a number of significant transactions involving our European funds, including the combination of two of our European funds. Under Mr. Olinger and Mr. Anderson, the combined Europe fund achieved a credit rating upgrade to A- by S&P.(2) Mr. Reilly and Mr. Nekritz led over $1.4 billion in buyout transactions and a $1.2 billion capital raise. Mr. Anderson and Mr. Olinger completed a successful equity raise for our publicly traded Japanese REIT.
| ||
|
Monetization of Land Bank & Disposition of Non-Strategic Assets
|
Weighted at 15% | |
|
¾ In 2017, our monetization and dispositions of land reduced our land bank to $1.4 billion.
| ||
|
Back Office/Organization
|
Weighted at 10% | |
|
¾ Our entire executive team was focused on customer experience initiatives and enhancing our business intelligence capabilities.
¾ Mr. Reilly drove G&A/AUM down across his regions. Mr. Anderson and Mr. Olinger rolled out our real estate forecasting and information management tools and Mr. Curless launched our customer experience initiative in the United States. Driving efficiency, Mr. Reilly, Mr. Nekritz and Mr. Olinger rolled out real estate transaction automation technology and developed streamlined leasing innovations in the United States.
| ||
|
|
72 | |||
|
COMPENSATION DISCUSSION AND ANALYSIS
|
||
|
Inclusion & Diversity
|
Weighted at 10% | |
|
¾ 2017 was a foundational year for our inclusion and diversity program driven by our entire executive team. The areas of focus were defined based on our global employee engagement survey. We diversified our external talent pipeline by implementing a new hiring approach further ensuring diverse candidate pools and interview panels. We also partnered with real estate trade organizations and other diversity-oriented advocates to support this initiative.
| ||
|
Balance Sheet Considerations
|
||
|
¾ Under Mr. Olinger’s leadership, we maintained our A-/A3 stable ratings by Moody’s and S&P, respectively,(2) ending the year with $3.6 billion in liquidity and one of the top REIT balance sheets in our industry. Mr. Olinger successfully completed over $5.0 billion in debt transactions with an average rate of 1.7% and ended the year with U.S. dollar net equity at 94%.
¾ As our bonus metrics reflect our current strategic goals, we did not allocate a portion of our bonus determination to a balance sheet/liquidity bonus metric as we have already achieved our balance sheet goals. We did not want to reward our executives for a goal already achieved.
¾ However, we account for the maintenance of our balance sheet health in our final assessment of our corporate and individual scores. The Compensation Committee will exercise its downward discretion to reduce the bonus payments if we fail to maintain our balance sheet appropriately.
| ||
|
Overall Corporate Score
|
Above Target | |
|
¾ Under the leadership of Mr. Moghadam, the executive team led the company in strong operating performance, reflecting solid execution by our team. We leased 170 million square feet, had record year-end occupancy of 97.2% and net effective rent change of 21.4% (Prologis share). We delivered substantial Core FFO(1) per share growth, an increase of 9.3 percent over 2016. Our credit metrics and balance sheet continue to be strong showcasing our significant liquidity and capacity to self-fund our growth for the foreseeable future. Mr. Moghadam and the other NEOs continue to drive innovation and improvement leveraging our scale and global expertise to add value to our enterprise beyond our real estate.
| ||
| (1) | Core FFO per share and SSNOI are non-GAAP measures. See Appendix A for definitions and discussion of non-GAAP measurements and reconciliations to the most directly comparable GAAP measures. |
| (2) | A securities rating is not a recommendation to buy, sell or hold securities and is subject to revision or withdrawal at any time by the rating organization. |
|
|
73 | |||
|
COMPENSATION DISCUSSION AND ANALYSIS
|
||
2017 ANNUAL BONUS DECISIONS
| 2017 Target
|
2017 Bonus*
|
|||||||||||
| NEO
|
% Target**
|
Amount
|
||||||||||
| Hamid Moghadam |
$ | 1,500,000 | 137.5% | $ | 2,062,500 | |||||||
| Thomas Olinger |
$ | 750,000 | 132.5% | $ | 993,750 | |||||||
| Eugene Reilly |
$ | 750,000 | 139.5% | $ | 1,046,250 | |||||||
| Edward Nekritz |
$ | 750,000 | 138.5% | $ | 1,038,750 | |||||||
| Gary Anderson |
$ | 750,000 | 139.5% | $ | 1,046,250 | |||||||
| Michael Curless |
$ | 750,000 | 134.5% | $ | 1,008,750 | |||||||
| * | Target bonus levels are based on salary for the year. All NEOs elected to participate in our bonus exchange program. See below for payment amounts in equity valued at 125% of the cash bonus amounts shown in this table. |
| ** | Our corporate score equals 137.5% of target. The Compensation Committee determined individual scores based on assessments of individual contributions to our business plan as described above. Individual scores for Messrs. Moghadam, Olinger, Reilly, Nekritz, Anderson and Curless equate to 137.5% of target, 125.0% of target, 142.5% of target, 140.0% of target, 142.5% of target, and 130.0% of target, respectively. Corporate scores are weighted 80% for Mr. Moghadam and 60% for the other NEOs. Individual scores are weighted 20% for Mr. Moghadam and 40% for the other NEOs. As our CEO’s individual score is heavily weighted to the corporate score, our CEO’s score usually reflects our corporate score. |
Bonus exchange aligns NEO and stockholder interests
| ¾ | We are eliminating the bonus exchange premium for NEOs starting with the 2018 performance year. The NEOs participated in this program for the 2017 performance year as explained below. |
| ¾ | Under our bonus exchange program for the 2017 performance year, all of our employees had the opportunity to elect to receive all or a portion of their cash bonus in company equity, serving to further align our interests with our stockholders. |
| ¾ | Equity awards granted as a result of the bonus exchange are valued at 125% of cash bonus exchanged. |
| ¾ | Bonus exchange awards for our NEOs have a three-year vesting period (40% after the first year, 40% after the second year and 20% after the third year). |
| ¾ | Our NEOs elected to exchange all of their 2017 bonus for LTIP units of Prologis, L.P. (the “LTIP Units”). For further detail about LTIP Units, please see the section below entitled “LTIP Units.” |
| ¾ | As a result of bonus exchange for the 2017 performance year, Mr. Moghadam received $2,578,125, Mr. Reilly and Mr. Anderson received $1,307,813, Mr. Nekritz received $1,298,438, Mr. Olinger received $1,242,188 and Mr. Curless received $1,260,938 in equity with a 3-year vesting period, in lieu of their cash bonuses. |
|
|
74 | |||
|
COMPENSATION DISCUSSION AND ANALYSIS
|
||
2017 Compensation Decisions: Annual LTI Equity Awards
Annual LTI equity awards are formulaic, 100% based on performance and not guaranteed
| ¾ | Under our equity award formula, 50% of target LTI equity awards is tied directly to our three-year annualized TSR performance against a weighted index of a combination of the Cohen & Steers REIT Index and comparison groups of domestic and global industrial REITs. The other 50% is awarded based on a qualitative assessment of performance. |
| ¾ | The equity formula does not guarantee minimum compensation. |
| ¾ | The equity award assessment, including the qualitative component, is entirely based on company and individual performance. |
| ¾ | The Compensation Committee can award less than 50% of target if warranted due to underperformance. The intent, however, is to grant the bottom end of the range (i.e., 50% of target) if warranted by individual and company performance commensurate with threshold levels of market compensation. |
| ¾ | This mix between relative TSR and qualitative performance is consistent with the average mix of our comparison group. |
| ¾ | Annual LTI equity award amounts are determined using the linear payout scale set forth below (with interpolation between levels). |
ANNUAL LTI EQUITY AWARD FORMULA
|
|
75 | |||
|
COMPENSATION DISCUSSION AND ANALYSIS
|
||
Annual LTI equity award benchmarks are a balance of industrial and large-cap REITs
| ¾ | We use two industrial REIT comparison groups (one domestic and one global) to compare our TSR performance against other REITs operating in our asset class. As the companies in these comparison groups are much smaller than we are, we also use a large-cap REIT index, the Cohen & Steers REIT Index, to compare our performance against similarly-sized companies. |
| ¾ | The weightings between the domestic and global industrial REIT comparison groups generally reflect the relative breakdown between our global and domestic AUM. |
| ¾ | Very few industrial REITs and even fewer global industrial REITs exist. The Cohen & Steers REIT Index is a performance benchmark that includes approximately 30 well-capitalized REITs. The Cohen & Steers REIT Index mitigates volatility of our smaller industrial REIT comparison groups and prevents any one company from dominating the index’s performance. This index is a measure important to our investors to evaluate our performance against other large-capitalization REITs. |
LTI EQUITY AWARD INDICES
| Benchmark Index
|
Composition
| |
| Domestic Public Industrial REITs |
East Group Properties (EGP) First Industrial (FR) DCT Industrial (DCT) Duke Realty (DRE)
| |
| Global Public Industrial REITs |
Global Logistics Properties (MC0.SI)(1) Goodman Group (GMG: AX) Segro plc (SGRO: LSE)
| |
| Cohen & Steers REIT Index |
Approximately 30 well-capitalized REITs, which are among the largest REITs in their respective property sectors.
| |
| (1) | Global Logistics Properties was privatized in January 2018 and will not be included in our global REIT comparison group starting with LTI equity awards for the 2018 performance year. |
2017 annual LTI equity awards reflect TSR outperformance against industrial REIT and Cohen & Steers REIT indices
| ¾ | Our outperformance relative to the weighted three-year annualized TSR of the industrial REIT comparison groups and Cohen & Steers REIT Index was 7.2%. |
| ¾ | Our three-year annualized TSR performance at year-end 2017 was 18.4%. |
| ¾ | The annualized three-year TSR for the Cohen & Steers REIT Index and the global and domestic industrial REIT comparison groups were 5.5%, 15.3% and 17.4%, respectively. |
|
|
76 | |||
| ¾ | The total weighted annualized three-year TSR of the Cohen & Steers REIT Index and the global and domestic industrial REIT comparison groups together was approximately 11.2%. |
| ¾ | Our TSR performance exceeded the maximum levels set forth in our equity award formula by 220 basis points. The equity formula capped LTI equity awards for the 2017 performance year at 150% of target. |
LTI EQUITY AWARDS FOR THE 2017 PERFORMANCE YEAR (GRANTED IN 2018)(1)
| 2017 Target Award Value
|
2017 Actual Award Value (Granted in 2018)
| |||||
| NEO
|
% Target
|
$
| ||||
|
Hamid Moghadam
|
$8,250,000
|
150%
|
$12,375,000
| |||
|
Thomas Olinger
|
$2,100,000
|
150%
|
$ 3,150,000
| |||
|
Eugene Reilly
|
$2,600,000
|
150%
|
$ 3,900,000
| |||
|
Edward Nekritz
|
$2,100,000
|
150%
|
$ 3,150,000
| |||
|
Gary Anderson
|
$2,100,000
|
150%
|
$ 3,150,000
| |||
| Michael Curless
|
$1,900,000
|
150%
|
$ 2,850,000
| |||
| (1) | The Compensation Committee considers LTI equity awards granted in 2018 to be part of compensation for the 2017 performance year. These awards will be reported in our Summary Compensation Table for the year 2018. |
Annual LTI equity awards for the 2016 performance year (granted in 2017)
| ¾ | Although the Summary Compensation Table presentation requires disclosure of LTI equity awards granted in 2017 to be included in aggregate compensation for 2017, the Compensation Committee considers these awards to be compensation for the 2016 performance year. |
| ¾ | As such, LTI equity awards granted in 2017 are part of the Compensation Committee’s assessment of compensation for the 2016 performance year, not the 2017 performance year. |
| ¾ | 2014-2016 company performance resulted in the 0.3% outperformance relative to the industrial REIT comparison groups and the Cohen & Steers REIT Index. In accordance with our equity formula, equity awards for the 2016 performance year were paid at 100% of target. See our 2017 proxy statement for further detail. |
| ¾ | For the 2016 performance year, Mr. Moghadam received $8.25 million; Mr. Reilly received $2.6 million, Mr. Olinger, Mr. Anderson and Mr. Nekritz received $2.1 million and Mr. Curless received $1.9 million in LTI equity awards. |
|
|
77 | |||
|
COMPENSATION DISCUSSION AND ANALYSIS
|
||
2017 Compensation Decisions: Outperformance Plans
| ¾ | As discussed earlier, our overall approach is to target core compensation at the median of our comparison group. On a size-adjusted basis, our NEOs’ target core compensation would be below the median of our comparison group. To compensate for the much smaller size and scope of companies in our comparison group, we offer outperformance plan opportunities that can be earned only if superior performance is achieved. |
| ¾ | Our outperformance plans extend beyond the NEOs to about 100 participants in total, distributing the compensation pools more broadly beyond the NEOs than most other outperformance plans we reviewed at the inception of the program. The Compensation Committee has allocated 15% of outperformance plan compensation pools to Mr. Moghadam and 6% to each of the other NEOs. |
POP now includes an absolute maximum cap and 7-year cliff vesting on earned awards
| ¾ | POP hurdles are formulaic and high reach. The Compensation Committee set the difficulty levels of the POP hurdles such that it would be unlikely to pay out regularly. The POP compensation pool only funds if and to the extent our three-year, compound annualized TSR exceeds the three-year compound annualized TSR of the MSCI REIT Index by 100 basis points. Only 3% of our outperformance above the hurdle (subject to a cap) funds the POP compensation pool. |
| ¾ | Monte Carlo statistical simulations show no payout in approximately 65% of the scenarios modeled. In fact, POP awards did not pay out for the first two performance cycles (2012-2014 and 2013-2015) under the plan. |
| ¾ | POP awards cannot be paid at a time when our absolute TSR is negative. |
| ¾ | If a pool funds because our relative TSR exceeds the POP performance hurdle, but our absolute three-year TSR is not positive, then the awards will not be paid unless and until absolute TSR becomes positive. The award will expire seven years after the end of the performance period, if absolute TSR does not become positive within that period. |
| ¾ | POP awards are a small percentage of the overall value created for our stockholders. As discussed in the CEO analysis above, our CEO’s POP award for the 2015-2017 performance period was only 0.1% of the $11.8 billion in value created for our stockholders in exceeding the POP hurdle. |
| ¾ | For performance periods starting prior to 2018, the POP compensation pool for each performance cycle is capped at the maximum of the greater of $75 million and 0.5% of our equity market capitalization at the start of a performance period. |
| ¾ | In response to stockholder feedback, we reduced the potential size of the pool by applying an absolute maximum cap of $100 million for the 2018- |
|
|
78 | |||
|
COMPENSATION DISCUSSION AND ANALYSIS
|
||
| 2020 performance period and imposed 7-year cliff vesting on the bulk of the earned awards (in lieu of the additional performance hurdles for amounts above $75 million to simplify the plan). |
| ¾ | Under the new construct, only 20% of POP awards are paid, if earned, at the end of the performance period. 80% of such earned awards are subject to the additional 7-year cliff vesting. The 20% that is paid at the end of the 3-year performance period is subject to an additional 3-year holding requirement. |
| ¾ | Although the new construct is effective for performance periods starting in 2018, our NEOs voluntarily elected to apply this construct retroactively to any of their awards earned for the 2016-2018 and 2017-2019 performance periods. The NEOs did not receive any benefit in exchange for their election. |
| ¾ | Under their election, 20% of amounts earned under applicable hurdles will be paid at the time applicable hurdles are met. A holding requirement will apply to these amounts until the sixth year after the beginning of the performance period. 80% of amounts earned under applicable hurdles will be subject to cliff vesting until the tenth year after the beginning of the performance period. |
Achieving formulaic PPP hurdles creates value for our stockholders
| ¾ | PPP performance hurdles are the formulaic promote hurdles established by our strategic capital ventures to incentivize superior performance. Promotes are earned by Prologis when returns in certain of our ventures exceed pre-negotiated preferred return hurdles. These promotes are third-party validated measures of operational success. |
| ¾ | For a number of our ventures, meeting a promote hurdle requires an internal rate of return in excess of a 7% to 9% annualized return (based on current hurdles as negotiated with our venture partners). Promotes are often structured such that the company receives 10% to 20% of returns above the negotiated return hurdles. The performance period for promotes is generally three years. |
| ¾ | To meet or surpass the promote hurdles, we must make smart capital allocation decisions and manage our assets to produce outstanding returns over an extended period of time. |
| ¾ | Achievement of promote hurdles generally means that we have created greater net asset value overall in the applicable venture and superior returns for our venture investors. This also translates into tremendous value created for our stockholders increasing the value of our ownership share of the ventures as well as driving earnings from promote and management fee payments. |
| ¾ | When we achieve the difficult promote hurdle and the company earns the promote, the promote proceeds are used to fund a PPP compensation |
|
|
79 | |||
|
COMPENSATION DISCUSSION AND ANALYSIS
|
||
| pool. This pool is 40% of the promote (after excluding our ownership share in the applicable venture) typically paid to about 100 participants in total. |
| ¾ | Individual awards under PPP are capped at the participants’ compensation (excluding awards under the two outperformance compensation plans) for the two most recently completed years. |
| ¾ | As discussed in the CEO analysis above, our CEO’s PPP awards paid in 2017 were only 0.4% of the total value created for our stockholders in achieving the promote hurdles. |
| ¾ | We expect the size of promotes will moderate in upcoming years, which will impact the size of PPP awards downward accordingly. |
|
|
80 | |||
|
COMPENSATION DISCUSSION AND ANALYSIS
|
||
Other Compensation Elements and Considerations
LTIP Units
| ¾ | LTIP Units are profits interests in Prologis, L.P., our operating partnership. Certain executives, including NEOs, may elect to receive LTIP Units in lieu of RSUs. Our NEOs elected to receive all of their equity awards granted in 2017 in LTIP Units, further aligning NEO and stockholder interests. |
| ¾ | LTIP Units were structured to be generally economically equivalent to RSUs. LTIP Units generally have the same vesting terms as RSUs. |
CEO waiver of retirement eligibility benefits
| ¾ | For any equity awards granted starting in 2017, Mr. Moghadam waived any vesting benefits related to meeting retirement-eligibility thresholds under our incentive plan. Vesting under such awards will continue after he terminates employment as long as he continues in a substantial role with the company or its affiliates. |
| ¾ | Had Mr. Moghadam not waived such provisions, he would be entitled to certain benefits such as the acceleration of vesting of his equity awards upon termination of his employment after he meets the retirement-eligibility thresholds under our compensation plans. |
Senior-level benefits
| ¾ | In addition to benefits provided to all other U.S. employees, such as our 401(k) plan, health care and welfare coverage, paid time-off, life and accident insurance and short and long-term disability programs, we offer our NEOs the following senior-level benefits: |
| – | Deferred compensation plans |
| – | Retiree medical benefits—upon retirement and having served as a member of the management executive committee (our CEO and certain direct reports) for five consecutive years, executives may continue health coverage under our plans at their own expense |
| – | Financial planning services |
| – | Company-paid parking |
| – | Personal use of leased corporate aircraft interest by our CEO if reimbursed by CEO |
|
|
81 | |||
|
COMPENSATION DISCUSSION AND ANALYSIS
|
||
Change-in-control benefits
| ¾ | Our NEOs’ benefits include fair and reasonable severance in connection with a change in control to serve the best interests of stockholders during a threatened or actual change in control by: |
| – | Providing for continuity of management team’s services, as well as providing for their best efforts over any transition period |
| – | Increasing objectivity of our management team in analyzing a proposed change in control and advising the Board if such proposal is in the best interests of stockholders |
| ¾ | Such benefits apply on a double-trigger basis (change in control has occurred and NEO’s employment status is impacted) and consist of: |
| – | Cash severance payments that are a multiple of salary and/or cash bonus opportunity levels (two times salary and bonus for NEOs) |
| – | Accelerated vesting of unvested equity awards, available through change-in-control agreements or long-term equity incentive plans |
Other considerations
COMPENSATION GOVERNANCE POLICIES
|
|
82 | |||
|
COMPENSATION DISCUSSION AND ANALYSIS
|
||
Risk mitigation
| ¾ | Annual Compensation Committee risk assessments of our compensation programs: The Compensation Committee monitors the risk profile with respect to compensation policies and practices. No material risks were found. |
| ¾ | Quarterly reports to Board on company performance against business plan and strategic objectives: The Board provides oversight to ensure that our compensation structure is not driving the company to take excessive operational risks. |
| ¾ | Internal management controls: Controls and procedures ensure operations are completed in line with governance standards to ensure that excessive risks are not taken, including a series of checks and balances with respect to commitment of capital. |
| ¾ | Real estate risk management: Real estate risk management processes monitor key risks associated with our real estate assets, such as levels of occupancy, non-income-producing assets, leverage, foreign currency exposure and other factors. |
| ¾ | Recoupment policy: This policy is a mechanism to claw back compensation in the event of a financial restatement. |
| ¾ | Stock ownership guidelines: These guidelines align management interests with stockholders. |
Stock ownership guidelines
| ¾ | All NEOs and directors are in compliance. |
| ¾ | The guidelines require stock ownership of at least a multiple of annual base salary for officers (10x base salary for CEO; 3x base salary for other NEOs; and 1x base salary for senior vice presidents, managing directors and regional presidents). |
| ¾ | The guidelines require share ownership for our directors of 5x the annual board retainer. |
| ¾ | Stock eligible under the guidelines includes common stock, vested, unvested and deferred equity awards (except stock options), associated dividend equivalents, earned LTIP Units and partnership units exchangeable into our common stock. The guidelines require retention of 50% of net shares received under our equity plans upon certain events until ownership thresholds are met. |
Hedging and pledging policies
All hedging and pledging of common stock is prohibited: Our insider trading policy prohibits all NEOs, employees and directors from hedging or pledging shares of our common stock. All of our NEOs and directors are currently in compliance with this prohibition.
|
|
83 | |||
|
COMPENSATION DISCUSSION AND ANALYSIS
|
||
Compensation recoupment (“Clawback”) policy
The Board has adopted a compensation clawback policy, which provides that in the event of a substantial restatement of our previously issued financial statements, a review will be undertaken by the Board of performance-based compensation awarded to certain officers that was attributable to our financial performance during the time periods restated. If the Board determines that an officer was improperly compensated and that it is in our best interests to recover or cancel such compensation, the Board will pursue all reasonable legal remedies to recover or cancel such performance-based compensation. The policy further provides that if the Board learns of any misconduct by certain officers that caused the restatement, the Board shall take such action as it deems necessary to remedy the misconduct, prevent its recurrence and, if appropriate, based on all relevant facts and circumstances, punish the wrongdoer. Such punishment by the Board could include dismissal, legal action for breach of fiduciary duty or such other action to enforce the officer’s obligations to us as may fit the facts surrounding the particular case. In determining the appropriate punishment, the Board may take into account punishments imposed by third parties. The Board’s power to determine the appropriate punishment for the wrongdoer is in addition to, and not in replacement of, remedies imposed by such third parties.
Equity grant policy and program administration
Awards are administered by our human resources and stock plan administration departments. Grants are made generally in the first quarter of the year, after promotion, at the time of new hire or in accordance with PPP. Equity grant dates are not scheduled based on the timing of the release of material non-public information.
We discontinued the issuance of stock option awards after February 2011.
Impact of accounting and tax treatment
To the extent reasonable, all executive compensation will be deductible by the company for federal income tax purposes. However, the Compensation Committee may design compensation program components that are not deductible. Because we intend to qualify as a REIT under the Internal Revenue Code, we generally distribute 100% of our net taxable income each year, and therefore, do not pay U.S. federal income tax. As a result, the possible loss of a federal tax deduction would not be expected to have a material impact on us. We intend that executive compensation comply with 409A of the Internal Revenue Code, which may impose additional taxes on our NEOs for arrangements that provide for the payment of deferred compensation that is not exempt or in compliance with Section 409A. In addition, we expense base salaries paid in the year they are earned and annual bonus awarded in cash in the year they are earned. In accordance with ASC Topic 718, we expense the value of equity awards granted, including those granted as part of annual bonus exchange, over the vesting period of such grants.
|
|
84 | |||
|
COMPENSATION COMMITTEE REPORT
|
||
Talent and Compensation Committee Report
We, the members of the Talent and Compensation Committee, have reviewed and discussed CD&A set forth above with the management of the company and, based on such review and discussion, have recommended to the Board that this CD&A be included in this proxy statement and, through incorporation by reference of this proxy statement, the company’s Annual Report on Form 10-K for the year ended December 31, 2017.
Talent and Compensation Committee:
George L. Fotiades (Chair)
David P. O’Connor
William D. Zollars
|
|
85 | |||
|
SUMMARY COMPENSATION TABLE
|
||
Summary Compensation Table for Fiscal Year 2017*
| Name and Principal Position (a)
|
Year (b)
|
Salary(1) ($) (c)
|
Bonus(1)(2)(3) ($) (d)
|
Stock Awards(3)(4)(5) ($) (e)
|
Non-Equity Incentive Plan Compensation(5) ($) (g)
|
All Other Compensation(6) ($) (i)
|
Total ($) (j)
|
|||||||||||||||||||||
| Hamid Moghadam
|
|
2017
|
|
$
|
1,000,000
|
|
$
|
2,062,500
|
|
$
|
16,203,727
|
|
$
|
—
|
|
$
|
85,900
|
|
$
|
19,352,127
|
| |||||||
| Chief Executive Officer
|
|
2016
|
|
$
|
1,000,000
|
|
$
|
2,310,000
|
|
$
|
12,126,019
|
|
$
|
—
|
|
$
|
106,818
|
|
$
|
15,542,837
|
| |||||||
|
|
2015
|
|
$
|
950,000
|
|
$
|
2,315,625
|
|
$
|
11,618,871
|
|
$
|
—
|
|
$
|
101,289
|
|
$
|
14,985,785
|
| ||||||||
| Thomas Olinger
|
|
2017
|
|
$
|
600,000
|
|
$
|
993,750
|
|
$
|
4,710,651
|
|
$
|
612,949
|
|
$
|
43,940
|
|
$
|
6,961,290
|
| |||||||
| Chief Financial Officer
|
|
2016
|
|
$
|
600,000
|
|
$
|
1,110,000
|
|
$
|
3,816,211
|
|
$
|
480,700
|
|
$
|
43,307
|
|
$
|
6,050,218
|
| |||||||
|
|
2015
|
|
$
|
575,000
|
|
$
|
1,133,000
|
|
$
|
3,448,224
|
|
$
|
—
|
|
$
|
42,037
|
|
$
|
5,198,261
|
| ||||||||
| Eugene Reilly
|
|
2017
|
|
$
|
600,000
|
|
$
|
1,046,250
|
|
$
|
5,223,773
|
|
$
|
612,949
|
|
$
|
34,633
|
|
$
|
7,517,605
|
| |||||||
| CEO, The Americas
|
|
2016
|
|
$
|
600,000
|
|
$
|
1,147,500
|
|
$
|
4,075,571
|
|
$
|
480,700
|
|
$
|
26,087
|
|
$
|
6,329,858
|
| |||||||
|
|
2015
|
|
$
|
575,000
|
|
$
|
1,240,000
|
|
$
|
3,924,986
|
|
$
|
—
|
|
$
|
36,757
|
|
$
|
5,776,743
|
| ||||||||
| Edward Nekritz
|
|
2017
|
|
$
|
600,000
|
|
$
|
1,038,750
|
|
$
|
4,721,901
|
|
$
|
612,949
|
|
$
|
37,718
|
|
$
|
7,011,318
|
| |||||||
| Chief Legal Officer and
|
|
2016
|
|
$
|
600,000
|
|
$
|
1,147,500
|
|
$
|
3,825,586
|
|
$
|
480,700
|
|
$
|
38,087
|
|
$
|
6,091,873
|
| |||||||
| General Counsel
|
|
2015
|
|
$
|
575,000
|
|
$
|
1,168,000
|
|
$
|
3,456,974
|
|
$
|
—
|
|
$
|
40,166
|
|
$
|
5,240,140
|
| |||||||
| Gary Anderson
|
|
2017
|
|
$
|
600,000
|
|
$
|
1,046,250
|
|
$
|
4,723,776
|
|
$
|
612,949
|
|
$
|
37,718
|
|
$
|
7,020,693
|
| |||||||
| CEO, Europe and Asia
|
|
2016
|
|
$
|
600,000
|
|
$
|
1,147,500
|
|
$
|
3,825,586
|
|
$
|
480,700
|
|
$
|
38,087
|
|
$
|
6,091,873
|
| |||||||
|
|
2015
|
|
$
|
575,000
|
|
$
|
1,118,000
|
|
$
|
3,444,474
|
|
$
|
—
|
|
$
|
27,158
|
|
$
|
5,164,632
|
| ||||||||
| Michael Curless
|
|
2017
|
|
$
|
600,000
|
|
$
|
1,008,750
|
|
$
|
4,514,412
|
|
$
|
612,949
|
|
$
|
41,925
|
|
$
|
6,778,036
|
| |||||||
| Chief Investment Officer
|
|
2016
|
|
$
|
600,000
|
|
$
|
1,147,500
|
|
$
|
3,653,866
|
|
$
|
480,700
|
|
$
|
39,407
|
|
$
|
5,921,473
|
| |||||||
|
|
2015
|
|
$
|
575,000
|
|
$
|
1,168,000
|
|
$
|
3,276,960
|
|
$
|
—
|
|
$
|
41,787
|
|
$
|
5,061,747
|
| ||||||||
| * | Columns (f) and (h) have been omitted from this table because they are not applicable. |
| (1) | No salary or bonus amounts were deferred under our nonqualified deferred compensation plans in any year (see the narrative discussion that follows the Nonqualified Deferred Compensation in Fiscal Year 2017 table below). Amounts deferred under the Prologis 401(k) Savings Plan (“401(k) Plan”) at the election of the NEO, from salary and/or bonus payments are included in the amounts presented in columns (c) or (d) and are as follows: |
| ¾ | Mr. Moghadam, Mr. Reilly, Mr. Nekritz, Mr. Anderson and Mr. Curless: $24,000 in 2017, 2016 and 2015 |
| ¾ | Mr. Olinger: $24,000 in 2017 and 2016 and $18,000 in 2015 |
| (2) | Bonuses earned for a fiscal year are paid in the subsequent fiscal year (e.g., the bonuses in column (d) earned for performance in 2017 were paid in the first quarter of 2018). |
|
|
86 | |||
|
SUMMARY COMPENSATION TABLE
|
||
| (3) | Under the bonus exchange, the NEO may elect to receive all or a portion of his cash bonus in equity awards (RSUs or LTIP Units (discussed below in the narrative discussion that follows the Grants of Plan-Based Awards in Fiscal Year 2017 table). The value of equity awards received is equal to 125% of the cash bonus exchanged. Equity awards granted as part of the bonus exchange have a vesting period of three years (40% in the first year, 40% in the second year and 20% in the third year). The amount in column (d) includes the actual bonus awarded to the NEO participating in the bonus exchange regardless of whether cash or stock awards were received. The value of the stock awards in excess of the bonus award (the 25% premium) is included in column (e). |
| Name
|
Year(i)
|
Annual Cash Bonus Award(ii)
|
Amount Exchanged(iii)
|
25% Premium on Exchange(iv)
|
Exchanged Equity Value(v)
|
# of Shares or Units(vi)
|
||||||||||||||||||
| Mr. Moghadam
|
|
2017
|
|
$
|
2,062,500
|
|
$
|
2,062,500
|
|
$
|
515,625
|
|
$
|
2,578,125
|
|
|
42,740
|
| ||||||
|
|
2016
|
|
$
|
2,310,000
|
|
$
|
2,310,000
|
|
$
|
577,500
|
|
$
|
2,887,500
|
|
|
57,623
|
| |||||||
|
|
2015
|
|
$
|
2,315,625
|
|
$
|
2,315,625
|
|
$
|
578,906
|
|
$
|
2,894,531
|
|
|
77,601
|
| |||||||
| Mr. Olinger
|
|
2017
|
|
$
|
993,750
|
|
$
|
993,750
|
|
$
|
248,438
|
|
$
|
1,242,188
|
|
|
20,593
|
| ||||||
|
|
2016
|
|
$
|
1,110,000
|
|
$
|
1,110,000
|
|
$
|
277,500
|
|
$
|
1,387,500
|
|
|
27,689
|
| |||||||
|
|
2015
|
|
$
|
1,133,000
|
|
$
|
1,133,000
|
|
$
|
283,250
|
|
$
|
1,416,250
|
|
|
37,969
|
| |||||||
| Mr. Reilly
|
|
2017
|
|
$
|
1,046,250
|
|
$
|
1,046,250
|
|
$
|
261,563
|
|
$
|
1,307,813
|
|
|
21,681
|
| ||||||
|
|
2016
|
|
$
|
1,147,500
|
|
$
|
1,147,500
|
|
$
|
286,875
|
|
$
|
1,434,375
|
|
|
28,624
|
| |||||||
|
|
2015
|
|
$
|
1,240,000
|
|
$
|
1,240,000
|
|
$
|
310,000
|
|
$
|
1,550,000
|
|
|
41,554
|
| |||||||
| Mr. Nekritz
|
|
2017
|
|
$
|
1,038,750
|
|
$
|
1,038,750
|
|
$
|
259,688
|
|
$
|
1,298,438
|
|
|
21,525
|
| ||||||
|
|
2016
|
|
$
|
1,147,500
|
|
$
|
1,147,500
|
|
$
|
286,875
|
|
$
|
1,434,375
|
|
|
28,624
|
| |||||||
|
|
2015
|
|
$
|
1,168,000
|
|
$
|
1,168,000
|
|
$
|
292,000
|
|
$
|
1,460,000
|
|
|
39,142
|
| |||||||
| Mr. Anderson
|
|
2017
|
|
$
|
1,046,250
|
|
$
|
1,046,250
|
|
$
|
261,563
|
|
$
|
1,307,813
|
|
|
21,681
|
| ||||||
|
|
2016
|
|
$
|
1,147,500
|
|
$
|
1,147,500
|
|
$
|
286,875
|
|
$
|
1,434,375
|
|
|
28,624
|
| |||||||
|
|
2015
|
|
$
|
1,118,000
|
|
$
|
1,118,000
|
|
$
|
279,500
|
|
$
|
1,397,500
|
|
|
37,466
|
| |||||||
| Mr. Curless
|
|
2017
|
|
$
|
1,008,750
|
|
$
|
1,008,750
|
|
$
|
252,188
|
|
$
|
1,260,938
|
|
|
20,904
|
| ||||||
|
|
2016
|
|
$
|
1,147,500
|
|
$
|
860,625
|
|
$
|
215,156
|
|
$
|
1,075,781
|
|
|
21,468
|
| |||||||
|
|
2015
|
|
$
|
1,168,000
|
|
$
|
1,168,000
|
|
$
|
292,000
|
|
$
|
1,460,000
|
|
|
39,142
|
| |||||||
| (i) | This is the year that the bonus is presented in the Summary Compensation Table. Bonuses for each year were awarded in the first quarter of the following year. |
| (ii) | Represents the bonus awarded to the NEO before the bonus exchange election. |
| (iii) | This column reflects the value of the bonus award that the NEO has elected to exchange. All NEOs elected to exchange 100% of their bonuses for 2017. Mr. Moghadam, Mr. Olinger, Mr. Reilly, Mr. Nekritz, Mr. Anderson elected to exchange 100% of their bonuses for 2016. Mr. Curless elected to exchange 75% of his bonus in 2016. All NEOs elected to exchange 100% of their bonuses in 2015. Accordingly, the NEOs exchanged the bonus amounts reflected in column (iii) for equity, and received the remainder of their bonus amounts, if any, in cash. As such, Mr. Curless received $286,875 of his 2016 bonus in cash. |
| (iv) | Grants a premium of 25% of the portion of the bonus that is subject to the exchange. |
| (v) | Represents the sum of the exchanged portion of the bonus and the 25% premium. This value is granted to the NEO in the form of equity with vesting over a three-year period (40% in the first year, 40% in the second year and 20% in the third year). |
| (vi) | Represents the total equity award granted to the NEO under the bonus exchange calculated based on the closing price of our common stock on the date the bonus is awarded. For all years presented, each NEO elected to receive the equity award in the form of LTIP Units. |
Information on how we value equity awards is included in the narrative discussion that follows the Grants of Plan-Based Awards in Fiscal Year 2017 table below.
| (4) | Amounts represent the value of equity awards granted in each year including awards granted under our annual LTI equity award program, awards granted under PPP in 2017 and 2016 (discussed below) and the allocation of participation points under POP in each year. Column (e) also includes the value of the premium awarded resulting from the election of the bonus exchange in a particular year (discussed above). |
|
|
87 | |||
|
SUMMARY COMPENSATION TABLE
|
||
Annual LTI Equity Incentive Awards:
Under our annual LTI equity award program, we generally grant equity awards in the first quarter for the performance period ended in the previous year. For example, the annual awards in column (e) for 2017 were granted in February 2017 but were based on a performance period that ended in 2016. The amount of each NEO’s annual award is based on performance criteria and the award is also subject to continued employment.
| ¾ | 2017 LTIP Units issued on March 7, 2017 (approved by the Compensation Committee on February 10, 2017) were: |
Mr. Moghadam—164,637 LTIP Units valued at $8,249,960
Mr. Olinger—41,907 LTIP Units valued at $2,099,960
Mr. Reilly—51,885 LTIP Units valued at $2,599,957
Mr. Nekritz—41,907 LTIP Units valued at $2,099,960
Mr. Anderson—41,907 LTIP Units valued at $2,099,960
Mr. Curless—37,916 LTIP Units valued at $1,899,971
The number of LTIP Units were determined using the closing price of our common stock on the award grant date of February 10, 2017 ($50.11). This is the value used for accounting purposes to expense the grant.
| ¾ | 2016: LTIP Units issued on March 9, 2016 (approved by the Compensation Committee on February 10, 2016) were: |
Mr. Moghadam—110,589 LTIP Units valued at $4,124,970
Mr. Olinger—28,150 LTIP Units valued at $1,049,995
Mr. Reilly—34,852 LTIP Units valued at $1,299,980
Mr. Nekritz—28,150 LTIP Units valued at $1,049,995
Mr. Anderson—28,150 LTIP Units valued at $1,049,995
Mr. Curless—25,469 LTIP Units valued at $949,994
The number of LTIP Units were determined using the closing price of our common stock on the award grant date of February 10, 2016 ($37.30). This is the value used for accounting purposes to expense the grant.
| ¾ | 2015: LTIP Units issued on March 13, 2015 (approved by the Compensation Committee on February 10, 2015) were: |
Mr. Moghadam—157,419 LTIP Units valued at $7,064,965
Mr. Olinger—35,093 LTIP Units valued at $1,574,974
Mr. Reilly—45,120 LTIP Units valued at $2,024,986
Mr. Nekritz—35,093 LTIP Units valued at $1,574,974
Mr. Anderson—35,093 LTIP Units valued at $1,574,974
Mr. Curless—31,082 LTIP Units valued at $1,394,960
The number of LTIP Units were determined using the closing price of our common stock on the award grant date of February 10, 2015 ($44.88). This is the value used for accounting purposes to expense the grant.
Information on how we value equity awards is included in the narrative discussion that follows the Grants of Plan-Based Awards in Fiscal Year 2017 table below. Also see “Compensation Discussion and Analysis.”
POP:
The values in column (e) include the NEO’s allocation of the estimated compensation pool value (or participation point value) awarded under POP. This value is included in the NEO’s compensation even though there is no assurance that the value of the participation points will ever be realized by the NEO.
| ¾ | 2017 (2017-2019 Performance Period): Values of participation points as of the date of the point allocation (January 3, 2017) were: Mr. Moghadam ($3,060,000) and all other NEOs (each $1,224,000). |
| ¾ | 2016 (2016-2018 Performance Period): Values of participation points as of the date of the point allocation (June 3, 2016) were: Mr. Moghadam ($3,990,000) and all other NEOs (each $1,596,000). |
| ¾ | 2015 (2015-2017 Performance Period): Values of participation points as of the date of the point allocation (February 10, 2015) were: Mr. Moghadam ($3,975,000) and all other NEOs (each $1,590,000). |
POP and the exchange of participation points for POP LTIP Units are discussed below in the narrative that follows the “Grants of Plan-Based Awards in Fiscal Year 2017” table.
| (5) | Awards in the form of cash and/or equity awards (vesting over a three-year period) were granted to participating employees, including all of the NEOs, in September 2017, May 2017, December 2016 and March 2016 under PPP. The value of the equity portion of the award is included in column (e) based on the fair value on the grant date of the equity awards. The cash portion of the award is included in column (g). Because it is not possible to determine whether any incentive fees or promotes will be received in future years, only awards resulting from compensation pools that have funded are included in the compensation of the NEOs. |
| ¾ | PPP awards paid in 2017: All of Mr. Moghadam’s 2017 PPP awards were paid in the form of equity (in aggregate, 79,531 LTIP Units or $4,378,142). 35% of the 2017 PPP awards for each of the other NEOs were in the form of cash (in aggregate $612,949). 65% of their 2017 PPP awards were in the form of equity (in aggregate, 20,677 LTIP Units or $1,138,253). The LTIP Units were valued at $54.60 and $64.02 per share, the closing price of our common stock on the grant date (May 2, 2017 and September 25, 2017, respectively). |
|
|
88 | |||
|
SUMMARY COMPENSATION TABLE
|
||
| ¾ | PPP awards paid in 2016: All of Mr. Moghadam’s 2016 PPP awards were paid in the form of equity (in aggregate, 75,089 LTIP Units or $3,433,549). 35% of the 2016 PPP awards for each of the other NEOs were in the form of cash (in aggregate $480,700). 65% of their 2016 PPP awards were paid in equity (in aggregate, 19,523 LTIP Units or $892,716). The LTIP Units were valued at $42.61 and $49.95 per share, the closing price of our common stock on the grant date (March 21, 2016 and December 1, 2016, respectively). |
Additional information on the participation points allocated under PPP and how they are valued is included in the narrative that follows the “Grants of Plan-Based Awards in Fiscal Year 2017” table.
| (6) | The amounts in column (i) represent the other compensation amounts paid to each of the NEOs in 2017, 2016 and 2015. These amounts include the following items: |
| 401(k) Plan Match |
Financial Planning Services(a) |
Parking(a) | Other(b) | Totals(c) | ||||||||||||||||||||
| Mr. Moghadam |
2017 | $ | 8,100 | $ | 60,000 | $ | 7,800 | $ | 10,000 | $ | 85,900 | |||||||||||||
| 2016 | $ | 7,950 | $ | 81,458 | $ | 7,410 | $ | 10,000 | $ | 106,818 | ||||||||||||||
| 2015 | $ | 7,950 | $ | 74,479 | $ | 8,860 | $ | 10,000 | $ | 101,289 | ||||||||||||||
| Mr. Olinger |
2017 | $ | 8,100 | $ | 16,765 | $ | 5,220 | $ | 13,855 | $ | 43,940 | |||||||||||||
| 2016 | $ | 7,950 | $ | 17,637 | $ | 5,220 | $ | 12,500 | $ | 43,307 | ||||||||||||||
| 2015 | $ | 7,950 | $ | 16,307 | $ | 5,280 | $ | 12,500 | $ | 42,037 | ||||||||||||||
| Mr. Reilly |
2017 | $ | 8,100 | $ | 16,765 | $ | 518 | $ | 9,250 | $ | 34,633 | |||||||||||||
| 2016 | $ | 7,950 | $ | 17,637 | $ | — | $ | 500 | $ | 26,087 | ||||||||||||||
| 2015 | $ | 7,950 | $ | 16,307 | $ | — | $ | 12,500 | $ | 36,757 | ||||||||||||||
| Mr. Nekritz |
2017 | $ | 8,100 | $ | 16,765 | $ | 353 | $ | 12,500 | $ | 37,718 | |||||||||||||
| 2016 | $ | 7,950 | $ | 17,637 | $ | — | $ | 12,500 | $ | 38,087 | ||||||||||||||
| 2015 | $ | 7,950 | $ | 19,716 | $ | — | $ | 12,500 | $ | 40,166 | ||||||||||||||
| Mr. Anderson |
2017 | $ | 8,100 | $ | 16,765 | $ | 353 | $ | 12,500 | $ | 37,718 | |||||||||||||
| 2016 | $ | 7,950 | $ | 17,637 | $ | — | $ | 12,500 | $ | 38,087 | ||||||||||||||
| 2015 | $ | 7,950 | $ | 19,208 | $ | — | $ | — | $ | 27,158 | ||||||||||||||
| Mr. Curless |
2017 | $ | 8,100 | $ | 16,765 | $ | 5,220 | $ | 11,840 | $ | 41,925 | |||||||||||||
| 2016 | $ | 7,950 | $ | 17,637 | $ | 5,220 | $ | 8,600 | $ | 39,407 | ||||||||||||||
| 2015 | $ | 7,950 | $ | 16,307 | $ | 5,280 | $ | 12,250 | $ | 41,787 | ||||||||||||||
| (a) | We provide financial planning services, and parking, if applicable, to certain of our employees, including the NEOs, based on their position with the company. |
| (b) | For 2017 includes: (i) matching charitable contributions by the company’s charitable foundation and (ii) service award for Mr. Olinger. |
For 2016 includes: matching charitable contributions by the company’s charitable foundation.
For 2015 includes: matching charitable contributions by the company’s charitable foundation.
Our charitable foundation will match the amount of charitable contributions to qualifying organizations made by our directors and all of our employees. The annual maximum amount of matching contributions in one year applicable to our NEOs is $12,500, not including amounts matched under special matching initiatives related to specific events, such as natural disasters. Matching contributions available in a particular year that are not used may be carried over to the subsequent year. Amounts reported represent charitable contributions of our charitable foundation that were paid directly to outside organizations during the calendar year to match qualifying contributions made by the NEOs during that year and can also include amounts carried over from previous years.
| (c) | No perquisite amounts are reported in any year for any of the NEOs as the aggregate amount of the incremental costs of any perquisites for an individual NEO does not exceed $10,000 in any year. In 2016, a leased corporate aircraft was used for a non-business purpose by Mr. Moghadam and Mr. Olinger. The incremental cost to the company for Mr. Moghadam was de minimis and reimbursed by him. There was no incremental cost to the company for Mr. Olinger’s personal use of the leased corporate aircraft. In 2017, a leased corporate aircraft was used for a non-business purpose by Mr. Moghadam. The incremental cost to the company for Mr. Moghadam was de minimis. These amounts are not included in Mr. Moghadam’s, or Mr. Olinger’s compensation in 2016 and 2017 because the total of perquisites did not exceed $10,000. |
|
|
89 | |||
|
GRANTS OF PLAN-BASED AWARDS
|
||
Grants of Plan-Based Awards in Fiscal Year 2017*
|
Estimated Future Payouts Under Equity Incentive Plan Awards
|
All Other Stock Awards: Number of Shares of Stock or Units (#) (i)
|
Grant Date Fair Value of Stock Awards ($) (l)
|
||||||||||||||
| Name (a)
|
Grant Date (b)
|
Maximum ($) (h)
|
||||||||||||||
| Annual and PPP Grants and POP Points: |
||||||||||||||||
| Hamid Moghadam |
01/03/17 | (1) | $ | 21,345,000 | — | $ | 3,060,000 | |||||||||
| 03/07/17 | (2) | — | 164,637 | $ | 8,249,960 | |||||||||||
| 05/18/17 | (3) | — | 75,736 | $ | 4,135,186 | |||||||||||
| 10/12/17 | (3) | — | 3,795 | $ | 242,956 | |||||||||||
| Thomas Olinger |
01/03/17 | (1) | $ | 8,538,000 | $ | 1,224,000 | ||||||||||
| 03/07/17 | (2) | — | 41,907 | $ | 2,099,960 | |||||||||||
| 05/18/17 | (3) | — | 19,691 | $ | 1,075,129 | |||||||||||
| 10/12/17 | (3) | — | 986 | $ | 63,124 | |||||||||||
| Eugene Reilly |
01/03/17 | (1) | $ | 8,538,000 | $ | 1,224,000 | ||||||||||
| 03/07/17 | (2) | — | 51,885 | $ | 2,599,957 | |||||||||||
| 05/18/17 | (3) | — | 19,691 | $ | 1,075,129 | |||||||||||
| 10/12/17 | (3) | — | 986 | $ | 63,124 | |||||||||||
| Edward Nekritz |
01/03/17 | (1) | $ | 8,538,000 | $ | 1,224,000 | ||||||||||
| 03/07/17 | (2) | — | 41,907 | $ | 2,099,960 | |||||||||||
| 05/18/17 | (3) | — | 19,691 | $ | 1,075,129 | |||||||||||
| 10/12/17 | (3) | — | 986 | $ | 63,124 | |||||||||||
| Gary Anderson |
01/03/17 | (1) | $ | 8,538,000 | $ | 1,224,000 | ||||||||||
| 03/07/17 | (2) | — | 41,907 | $ | 2,099,960 | |||||||||||
| 05/18/17 | (3) | — | 19,691 | $ | 1,075,129 | |||||||||||
| 10/12/17 | (3) | — | 986 | $ | 63,124 | |||||||||||
| Michael Curless |
01/03/17 | (1) | $ | 8,538,000 | $ | 1,224,000 | ||||||||||
| 03/07/17 | (2) | — | 37,916 | $ | 1,899,971 | |||||||||||
| 05/18/17 | (3) | — | 19,691 | $ | 1,075,129 | |||||||||||
| 10/12/17 | (3) | — | 986 | $ | 63,124 | |||||||||||
| Bonus Exchange Awards: |
||||||||||||||||
| Hamid Moghadam |
03/7/18 | (4) | — | 8,548 | $ | 515,625 | ||||||||||
| Thomas Olinger |
03/7/18 | (4) | — | 4,119 | $ | 248,438 | ||||||||||
| Eugene Reilly |
03/7/18 | (4) | — | 4,336 | $ | 261,563 | ||||||||||
| Edward Nekritz |
03/7/18 | (4) | — | 4,305 | $ | 259,688 | ||||||||||
| Gary Anderson |
03/7/18 | (4) | — | 4,336 | $ | 261,563 | ||||||||||
| Michael Curless |
03/7/18 | (4) | — | 4,181 | $ | 252,188 | ||||||||||
|
|
90 | |||
|
GRANTS OF PLAN-BASED AWARDS
|
||
| * | Columns (c) through (e), (f), (g), (j) and (k) have been omitted from this table because they are not applicable. |
| (1) | Represents the allocation of participation points in January 2017 under the POP for the 2017-2019 performance period. Since POP rewards only extraordinary performance, there is no Threshold or Target value. Notwithstanding the values of the participation points shown in this table, there can be no assurance that the company’s performance at the end of an applicable performance period will result in any payment under POP. The amount in column (h) represents the NEO’s allocation of the maximum pool value for the 2017-2019 Performance Period of $142.3 million. The value in column (l) is the grant-date fair value of the NEO’s allocation based on a valuation of the future compensation pool using a Monte Carlo simulation as of the grant date to estimate a fair value for accounting purposes, estimated at $20.4 million. Awards under POP may be paid in either cash or equity (with no additional vesting requirement) and the Compensation Committee has determined that the awards for the 2017-2019 Performance Period will be paid in equity, if at all. POP LTIP Units for the 2017-2019 performance period were issued on December 11, 2017. |
| (2) | Represents the annual long-term equity incentive awards for the performance year ended in 2016 that were granted in 2017. These awards were approved by the Compensation Committee on February 10, 2017 at which time the NEO elected to receive the award in the form of LTIP Units. The LTIP Units were issued on March 7, 2017 and vest ratably over a three-year period. The value in column (l) represents the award in column (i) valued at $50.11 per share, which was the closing price of our common stock on the February 10, 2017 award grant date. This value is used for accounting purposes to expense the grant. Annual long-term equity incentive awards for the performance year ended in 2017 were granted by the Compensation Committee in February 2018 and are not included in this table. See “Compensation Discussion and Analysis”. |
| (3) | The NEO was awarded a compensation opportunity through participation in PPP. PPP compensation pools were determined in May 2017 and September 2017 after incentive fees, or promotes, were earned and paid to us by four of our co-investment ventures. As a result, the NEOs each earned PPP awards related to these promotes. Mr. Moghadam’s entire award was paid in the form of equity, and the remaining NEOs’ awards were paid in the form of cash (35%) and equity (65%). Each NEO elected to receive the equity portion of their award in the form of LTIP Units, which were issued in May 2017 and October 2017 and vest ratably over a three-year period. The values of the LTIP Units granted are included in column (l) of this table based on the fair value of $54.60 per share for the May 2017 grant and $64.02 per share for the October 2017 grant, which were the closing prices of our common stock on the applicable grant dates (the dates the Compensation Committee granted the awards). This value is used for accounting purposes to expense the grant. See “Compensation Discussion and Analysis”. |
| (4) | Represents the LTIP Units granted to the NEO corresponding to the premium that results from electing the bonus exchange with respect to the bonus that was awarded in February 2018. Upon election, a premium of 25% is granted in the form of additional equity awards. This premium was granted in the form of LTIP Units that vest over three years (40% in each of the first two years and 20% in the last year). The value of the premium is included in column (e) of the “Summary Compensation Table for Fiscal Year 2017.” The value of the bonus award for 2017 (before the premium) is included as a bonus in column (d) of that table. The value in column (l) of this table represents the LTIP Units awarded for the premium and shown in column (i) valued at $60.32 per share, which was the closing price of our common stock on February 9, 2018, the date the bonus was awarded and the election to exchange was effective. This value is used for accounting purposes to expense the grant. The LTIP Units were issued on March 7, 2018. |
|
|
91 | |||
|
DISCUSSION OF SUMMARY COMPENSATION TABLE AND GRANTS OF PLAN-BASED AWARDS
| ||
Narrative Discussion to the Summary Compensation Table for Fiscal Year 2017 and the Grants of Plan-Based Awards in Fiscal Year 2017 Table
Equity compensation plans
At our annual meeting on May 3, 2012, our stockholders approved and adopted the Prologis, Inc. 2012 Long-Term Incentive Plan (the “2012 LTIP”). The 2012 LTIP enables our executive officers, employees, directors and consultants to participate in the ownership of the company and allows us to attract and retain our executive officers, other employees and directors, as well as provide incentives to such persons to maximize our company performance.
In addition, we have other equity compensation plans under which equity awards were outstanding as of December 31, 2017:
| ¾ | the Amended and Restated 2002 Stock Option and Incentive Plan and the Third Amended and Restated 1997 Stock Option and Incentive Plan, collectively, the “AMB Plans,” which were both approved by our stockholders; and |
| ¾ | the ProLogis 2006 Long-Term Incentive Plan, the ProLogis 2000 Share Option Plan for Outside Trustees and the ProLogis 1997 Long-Term Incentive Plan, collectively, the “Trust Plans,” which were assumed by us under the Merger agreement with all outstanding awards converted based on the Merger exchange ratio. The Trust Plans were approved by shareholders of the Trust. |
All future equity awards will be granted from the 2012 LTIP and we will no longer grant any awards from the AMB Plans or the Trust Plans. The available shares of common stock reserved for issuance under the AMB Plans and the Trust Plans as of May 3, 2012 were added to the share reserve of the 2012 LTIP. All outstanding awards under the AMB Plans and the Trust Plans will remain outstanding until they vest, expire or are forfeited by the participant. As of December 31, 2017, we had 8.3 million shares of common stock remaining available for future issuance under our plans and 8.8 million shares of common stock subject to outstanding unvested awards.
The 2012 LTIP does not expire but no further awards can be granted under the plan after the tenth anniversary date of the plan’s approval (May 3, 2022). The 2012 LTIP does not permit re-pricing of stock options without stockholder approval. Participants, including non-employee directors, in the 2012 LTIP may receive stock options, stock appreciation rights and full value awards, including dividend equivalents. Only employees may receive incentive stock options under the 2012 LTIP, however, we have not granted incentive stock options in the past and currently do not intend to grant any stock options of any kind.
For further detail, please see “Equity Compensation Plans” below.
Equity award terms
Under our annual LTI equity program and PPP, we currently intend to grant LTIP Units and RSUs. Restricted stock awards were last granted in 2012, and stock options were last granted in 2011. In addition, we provided certain executives with opportunities to earn awards under POP. Beginning in 2014, we offered to certain executives the option to elect to receive LTIP Units in lieu of RSUs that may be granted to them under our compensation program. The general terms of our equity awards outstanding at December 31, 2017 are as follows:
RSUs
Each RSU is convertible into one share of common stock upon vesting. The RSUs granted prior to the 2018 annual grant cycle generally vest ratably over a continued service period of three years, such that the awards vest 34% after the first year, 33% after the second year and 33% after the third year. RSUs granted in the 2018 annual grant cycle vest
|
|
92 | |||
|
DISCUSSION OF SUMMARY COMPENSATION TABLE AND GRANTS OF PLAN-BASED AWARDS
| ||
ratably over a period of four years, such that 25% of the award vests each year of the four-year period. Going forward, we intend to grant RSUs for annual LTI equity awards and PPP awards with four-year vesting periods. RSUs granted in accordance with the 2018 POP amendment will have a seven-year cliff vesting period (i.e., the entire award vests on a specified future date) after the end of the initial three-year performance period. RSUs have no voting rights. Certain awards, such as special grants due to hiring or retention considerations, may have different vesting terms, including cliff vesting terms. RSUs granted to NEOs as a part of the bonus exchange generally have a three-year vesting period, such that the bonus exchange awards vest 40% after the first year, 40% after the second year and 20% after the third year. Generally, RSUs earn dividend equivalents (either cash or equity) over the vesting period under the same payment terms as dividends paid on our common stock. RSUs are valued based on the closing price of our common stock on the grant date.
LTIP Units
Certain participants in the 2012 LTIP can elect to receive LTIP Units instead of RSUs. LTIP Units have similar terms to RSUs with respect to vesting provisions, voting rights and dividends. LTIP Units are different from POP LTIP Units granted under POP (as discussed below). LTIP Units are structured with the intent that the units will generally be economically equivalent to the RSUs that would be issued for the applicable awards and generally have the same vesting terms as the RSUs that are granted. Under certain conditions, an LTIP Unit is convertible into a common unit and then redeemable for one share of our common stock, or at our option, cash. Among other conditions, LTIP Units cannot be converted until they are vested and a waiting period of two years from the date of issuance is complete. Like RSUs, LTIP Units earn cash distributions equal to the dividend paid on our common stock. After vesting and other conditions are met, LTIP Units remain outstanding until such time as the holder of the LTIP Units elects to convert.
In December 2014, certain executives, including the NEOs, were given the election to exchange outstanding, unvested RSUs or restricted stock awards (“RSAs”) into LTIP Units with the same vesting terms as the RSUs or RSAs that were exchanged. The RSUs and RSAs subject to this exchange were cancelled and LTIP Units were issued pursuant to these exchanges in January 2015.
The exchange of the LTIP Units for unvested RSUs and RSAs in January 2015 did not result in incremental fair value for accounting purposes and does not change the total compensation of the NEO. As such, the issuance of the LTIP Units in this exchange (and subsequent cancellation of outstanding RSUs and RSAs) does not change the value of the equity awards as presented in the Summary Compensation Table or in the Grants of Plan-Based Awards Table.
For any equity awards granted starting in 2017, including issuances of LTIP Units, Mr. Moghadam has waived any vesting benefits related to meeting retirement-eligibility thresholds under our incentive plan. Vesting under such awards will continue after he terminates employment as long as he continues in a substantial role with the company or its affiliates.
Participation Points—POP
Please see “Compensation Discussion and Analysis” for a discussion of the general structure of POP and how it fits into our overall compensation program.
Under POP, certain employees are awarded a portion of a potential compensation pool to be determined based on the number of participation points allocated to them for each performance period. We made allocations of participation points under POP in 2017 for the 2017-2019 performance period, in 2016 for the 2016-2018 performance period, and in 2015 for the 2015-2017 performance period.
The participation points are valued using a Monte Carlo simulation as of the grant date. Participation points under POP were structured with the intent that the points have no economic value to the participants unless and until performance criteria are met and an award is paid for the applicable performance period.
|
|
93 | |||
|
DISCUSSION OF SUMMARY COMPENSATION TABLE AND GRANTS OF PLAN-BASED AWARDS
| ||
The total compensation pool applicable to about 100 participants in aggregate was initially represented by approximately 10,000 participation points. The actual awards for the performance period, if any, will be determined by multiplying the total compensation pool by a fraction, the numerator of which is the number of participation points held by a participant and the denominator of which is the total number of participation points held by all participants on the last day of the performance period. Awards can be paid in either cash or equity after the end of the three-year performance period. The Compensation Committee has determined that the awards will be paid, if at all, in equity. Earned POP awards cannot be paid unless and until absolute TSR becomes positive. Any earned POP award will expire seven years after the end of the performance period, if absolute TSR does not become positive within that period.
For each performance period, the Compensation Committee allocated participation points to the NEOs such that 15% of the compensation pool will be paid to Mr. Moghadam and 6% of the compensation pool will be paid to each of the other NEOs if such awards are earned. This percentage allocation of the compensation pool will be fixed regardless of the total number of participation points outstanding at the end of the performance period, so that the NEOs will not receive any greater percentage of the compensation pool if participants forfeit their points. In allocating the percentage of the compensation pools to the NEOs, the Compensation Committee took into consideration external market data concerning the typical ratio of CEO compensation to that of other NEOs and employees. The Compensation Committee generally allocated a smaller portion of the total compensation pool to the NEOs relative to the other participants than is typical in the outperformance plans of other companies the committee reviewed at the inception of the plan.
POP LTIP Units. Certain members of the executive management team, including the NEOs, elected to exchange their POP participation points for special LTIP Units (the “POP LTIP Units”) as defined under the operating partnership agreement of Prologis, L.P., as amended and/or restated from time to time.
The POP LTIP Units are structured with the intent that the units will be comparable economically to the awards under POP. A participant electing to receive the POP LTIP Units will receive the same percentage of the pool as if the participant had not participated in the exchange. Like other forms of awards under the plan, the POP LTIP Units will have no economic value to the participants until and unless the performance criteria are achieved at the end of a performance period and other conditions are met. Once the Compensation Committee determines whether the performance criteria have been met, the POP LTIP Units will be forfeited to the extent not earned based on the terms of POP. If an award is earned, an NEO will retain the number of POP LTIP Units equal in economic value to the percentage of the performance pool originally allocated to the NEO at the beginning of the applicable performance period. Any POP LTIP Units in excess of such amount will be forfeited.
Upon the satisfaction of certain conditions, including achievement of the relevant performance criteria, each POP LTIP Unit may be convertible into a common unit of the operating partnership and then redeemable for one share of our common stock, or cash at our option.
As has become standard tax structuring for profits interests that only vest if performance hurdles are met, the POP LTIP Units are entitled to distributions during the performance period equal to 10% of our common stock dividend. However, contrary to most performance-based programs at other REITs, we are requiring participants to make a significant, non-refundable capital contribution for the POP LTIP Units they receive. This feature is intended to make POP LTIP Units comparable economically to POP participation points allocated to applicable participants under the POP. This structure is designed so that participants receive no additional compensation as a result of the exchange of participation points into POP LTIP Units. This creates downside risk for participants if the performance hurdles are not achieved causing the forfeiture of the capital invested in their POP LTIP Units.
As such, the issuance of POP LTIP Units in exchange for participation points does not affect the compensation amounts for the NEOs in the Summary Compensation Table or in the Grants of Plan-Based Awards Table. The exchange of the POP LTIP Units for participation points does not result in incremental fair value for accounting purposes and does not change the total compensation of the NEOs. As a result, the issuance of the POP LTIP Units in exchange for participation points does not change the presentation of the value of the participation points in the Summary
|
|
94 | |||
|
DISCUSSION OF SUMMARY COMPENSATION TABLE AND GRANTS OF PLAN-BASED AWARDS
| ||
Compensation Table or in the Grants of Plan-Based Awards Table. The POP LTIP Units are included in the Outstanding Equity Awards at Fiscal Year-End table at their threshold value at December 31, 2017.
As discussed in CD&A, the POP compensation pool only funds if and to the extent our three-year, compound annualized TSR exceeds the three-year compound annualized TSR of the MSCI REIT Index by 100 basis points.
| ¾ | 2015-2017 performance period: This performance period began on January 1, 2015 and ended on December 31, 2017, including 97 participants at its start. The value of the potential compensation pool on February 13, 2015, the date participation points were awarded, was $26.5 million, determined using a Monte Carlo simulation. Variables used in the simulation under a risk-neutral premise include: (i) expected volatility of our common stock of 32%; (ii) expected volatility of the MSCI REIT Index of 24%; and (iii) correlation between our common stock and the MSCI REIT Index of 90%. The potential compensation pool was capped at $110.2 million, which was 0.5% of our equity market capitalization at December 31, 2014. As of December 31, 2017, the value of this compensation pool was $110.2 million. Awards for the 2015-2017 performance period were determined by the Compensation Committee on January 9, 2018, resulting in a $16.5 million award paid to Mr. Moghadam and $6.6 million paid to each of our NEOs. |
| ¾ | 2016-2018 performance period: This performance period began on January 1, 2016 and will end on December 31, 2018, including 110 participants at its start. The value of the potential compensation pool on June 3, 2016, the date participation points were awarded, was $26.6 million, determined using a Monte Carlo simulation. Variables used in the simulation under a risk-neutral premise include: (i) expected volatility of our common stock of 23%; (ii) expected volatility of the MSCI REIT Index of 18%; and (iii) correlation between our common stock and the MSCI REIT Index of 89%. The potential compensation pool was capped at $115.0 million, which was 0.5% of our equity market capitalization at December 31, 2015. As of December 31, 2017, the projected value of this compensation pool was $115.0 million. |
| ¾ | 2017-2019 performance period: This performance period began on January 1, 2017 and will end on December 31, 2019, including 112 participants at its start. The value of the potential compensation pool on January 3, 2017, the date participation points were awarded, was $20.4 million, determined using a Monte Carlo simulation. Variables used in the simulation under a risk-neutral premise include: (i) expected volatility of our common stock of 25%; (ii) expected volatility of the MSCI REIT Index of 19%; and (iii) correlation between our common stock and the MSCI REIT Index of 88%. The potential compensation pool was capped at $142.3 million, which was 0.5% of our equity market capitalization at December 31, 2016. As of December 31, 2017, the projected value of this compensation pool was $142.3 million. |
In accordance with the 2016 amendment of POP, applicable to the 2016-2018 and 2017-2019 performance periods, any amounts above $75 million will be paid over the course of three years after the end of the initial three-year performance period only if we continue to perform at or above the MSCI REIT Index. One-third of this excess amount above $75 million will be paid at the end of each of the three years following the initial three-year performance period, if we perform at or above the index at the end of each applicable year. A holding requirement applies to any equity paid until the end of the third year following the initial three-year performance period. If our absolute TSR is not positive, we will not be paid any amounts under the plan unless and until our absolute TSR turns positive. If our absolute TSR fails to turn positive within seven years after achieving the performance hurdle at the end of the initial three-year performance period, our awards will be forfeited.
In 2018, our NEOs voluntarily elected to apply long-term cliff vesting to 80% of any awards earned for the 2016-2018 and 2017-2019 performance periods. The applicable portion of the awards will vest at the end of the tenth year after the beginning of the performance period. See discussion of POP in “Compensation Discussion and Analysis” for further details.
|
|
95 | |||
|
DISCUSSION OF SUMMARY COMPENSATION TABLE AND GRANTS OF PLAN-BASED AWARDS
| ||
Participation Points—PPP
Please see “Compensation Discussion and Analysis” for a discussion of the general structure of PPP and how it fits into our overall compensation program.
Under PPP, certain employees receive participation points representing their share of a potential compensation pool that, if funded, will be awarded to the participant in a percentage of equity with any remainder in cash. The equity portion of the award would be paid in RSUs or LTIP Units with a three-year vesting period (and starting with the 2018 annual grant cycle, a four-year vesting period). The participation points awarded have no value unless and until an incentive fee or promote is received and the Compensation Committee grants the applicable PPP award. No awards or values are reported as of the date of the allocation of participation points because it is not possible to determine whether any incentive fees or promotes will be received in future years from a particular venture. For accounting purposes, the cash awards will be expensed when earned and paid to participants and the equity awards are expensed over the vesting period.
The Compensation Committee initially allocated approximately 10,000 participation points to about 100 participants for each applicable venture, representing each venture’s PPP award pool. For each applicable venture, the Compensation Committee allocated participation points to the NEOs such that 15% of the compensation pool will be paid to Mr. Moghadam and 6% of the compensation pool will be paid to each of the other NEOs if such awards are earned. This percentage allocation of the compensation pool will be fixed regardless of the total number of participation points outstanding at the end of the performance period. In determining the allocation of PPP participation points to the NEOs, the Compensation Committee utilized a similar rationale as with the awards of participation points made for POP discussed above.
PPP compensation pools were funded in 2017 and 2016. No PPP awards were earned in 2015. The value of a PPP award earned by an NEO is reported as compensation in the year the award is earned by the NEO on the date of determination by the Compensation Committee. In 2014, PPP was amended to allow the Compensation Committee to grant awards with the equity percentage over 50% and the remainder in cash. The cash awards earned by the NEOs in 2017 and 2016 under PPP are included as “Non-Equity Incentive Plan Compensation” in the Summary Compensation Table for Fiscal Year 2017 for the respective year. The equity awards (LTIP Units) are included as “Stock Awards” in the Summary Compensation Table for Fiscal Year 2017 for the respective year.
Stock options
We discontinued the issuance of stock options prior to the Merger in June 2011. Stock options outstanding are all vested and exercisable. Stock options granted generally vested ratably over a continued service period of three years, however, certain stock options previously granted as a result of the bonus exchange vested over a one-year period (25% per quarter). Stock options were granted with an exercise price equal to the closing price of our common stock on the grant date. The exercise price for any outstanding stock option may not be decreased after the grant date except for reductions approved by our stockholders or if there is an overall adjustment to our outstanding shares, such as an adjustment triggered by a stock split. Stock options expire on the tenth anniversary of the grant date.
|
|
96 | |||
|
OUTSTANDING EQUITY AWARDS
|
||
Outstanding Equity Awards at Fiscal Year-End
(December 31, 2017)
| Option Awards(1) | Stock Awards(1) | |||||||||||||||||||||||||||
| Name (a) |
Number of Securities Underlying Unexercised Options (#) Exercisable (b) |
Option Exercise Price ($) (e) |
Option Expiration Date (f) |
Number of Shares or Units of Stock That Have Not Vested (#) (g) |
Market Value of Shares or Units of Stock That Have Not Vested(1) ($) (h) |
Equity Incentive Plan Awards: Number of Unearned Shares, Units or Rights That Have Not Vested (#) (i) |
Equity Incentive Plan Awards: Market or Payout Value of Unearned Shares, Units or Other Rights That Have Not Vested ($) (j) |
|||||||||||||||||||||
| Hamid Moghadam |
62,601 | (2) | $ | 4,038,391 | ||||||||||||||||||||||||
| 72,988 | (3) | $ | 4,708,456 | |||||||||||||||||||||||||
| 46,560 | (4) | $ | 3,003,586 | |||||||||||||||||||||||||
| 28,805 | (5) | $ | 1,858,211 | |||||||||||||||||||||||||
| 21,254 | (6) | $ | 1,371,096 | |||||||||||||||||||||||||
| 164,637 | (7) | $ | 10,620,733 | |||||||||||||||||||||||||
| 57,623 | (8) | $ | 3,717,260 | |||||||||||||||||||||||||
| 75,736 | (9) | $ | 4,885,729 | |||||||||||||||||||||||||
| 3,795 | (10) | $ | 244,815 | |||||||||||||||||||||||||
| 383,735 | (11) | — | (11) | |||||||||||||||||||||||||
| 234,179 | (12) | — | (12) | |||||||||||||||||||||||||
| 171,520 | (13) | — | (13) | |||||||||||||||||||||||||
| Thomas Olinger |
5,200 | $ | 22.14 | 2/11/20 | ||||||||||||||||||||||||
| 16,771 | (2) | $ | 1,081,897 | |||||||||||||||||||||||||
| 18,578 | (3) | $ | 1,198,467 | |||||||||||||||||||||||||
| 22,781 | (4) | $ | 1,469,602 | |||||||||||||||||||||||||
| 7,489 | (5) | $ | 483,115 | |||||||||||||||||||||||||
| 5,526 | (6) | $ | 356,482 | |||||||||||||||||||||||||
| 41,907 | (7) | $ | 2,703,421 | |||||||||||||||||||||||||
| 27,689 | (8) | $ | 1,786,217 | |||||||||||||||||||||||||
| 19,691 | (9) | $ | 1,270,266 | |||||||||||||||||||||||||
| 986 | (10) | $ | 63,607 | |||||||||||||||||||||||||
| 153,494 | (11) | — | (11) | |||||||||||||||||||||||||
| 93,671 | (12) | — | (12) | |||||||||||||||||||||||||
| 68,608 | (13) | — | (13) | |||||||||||||||||||||||||
| Eugene Reilly |
19,614 | (2) | $ | 1,265,299 | ||||||||||||||||||||||||
| 23,002 | (3) | $ | 1,483,859 | |||||||||||||||||||||||||
| 24,932 | (4) | $ | 1,608,363 | |||||||||||||||||||||||||
| 7,489 | (5) | $ | 483,115 | |||||||||||||||||||||||||
| 5,526 | (6) | $ | 356,482 | |||||||||||||||||||||||||
| 51,885 | (7) | $ | 3,347,101 | |||||||||||||||||||||||||
| 28,624 | (8) | $ | 1,846,534 | |||||||||||||||||||||||||
| 19,691 | (9) | $ | 1,270,266 | |||||||||||||||||||||||||
| 986 | (10) | $ | 63,607 | |||||||||||||||||||||||||
| 153,494 | (11) | — | (11) | |||||||||||||||||||||||||
| 93,671 | (12) | — | (12) | |||||||||||||||||||||||||
| 68,608 | (13) | — | (13) | |||||||||||||||||||||||||
|
|
97 | |||
|
OUTSTANDING EQUITY AWARDS
|
||
| Option Awards(1) | Stock Awards(1) | |||||||||||||||||||||||||||
| Name (a) |
Number of Securities Underlying Unexercised Options (#) Exercisable (b) |
Option Exercise Price ($) (e) |
Option Expiration Date (f) |
Number of Shares or Units of Stock That Have Not Vested (#) (g) |
Market Value of Shares or Units of Stock That Have Not Vested(1) ($) (h) |
Equity Incentive Plan Awards: Number of Unearned Shares, Units or Rights That Have Not Vested (#) (i) |
Equity Incentive Plan Awards: Market or Payout Value of Unearned Shares, Units or Other Rights That Have Not Vested ($) (j) |
|||||||||||||||||||||
| Edward Nekritz |
16,994 | (2) | $ | 1,096,283 | ||||||||||||||||||||||||
| 18,578 | (3) | $ | 1,198,467 | |||||||||||||||||||||||||
| 23,485 | (4) | $ | 1,515,017 | |||||||||||||||||||||||||
| 7,489 | (5) | $ | 483,115 | |||||||||||||||||||||||||
| 5,526 | (6) | $ | 356,482 | |||||||||||||||||||||||||
| 41,907 | (7) | $ | 2,703,421 | |||||||||||||||||||||||||
| 28,624 | (8) | $ | 1,846,534 | |||||||||||||||||||||||||
| 19,691 | (9) | $ | 1,270,266 | |||||||||||||||||||||||||
| 986 | (10) | $ | 63,607 | |||||||||||||||||||||||||
| 153,494 | (11) | — | (11) | |||||||||||||||||||||||||
| 93,671 | (12) | — | (12) | |||||||||||||||||||||||||
| 68,608 | (13) | — | (13) | |||||||||||||||||||||||||
| Gary Anderson |
16,699 | (2) | $ | 1,077,252 | ||||||||||||||||||||||||
| 18,578 | (3) | $ | 1,198,467 | |||||||||||||||||||||||||
| 22,479 | (4) | $ | 1,450,120 | |||||||||||||||||||||||||
| 7,489 | (5) | $ | 483,115 | |||||||||||||||||||||||||
| 5,526 | (6) | $ | 356,482 | |||||||||||||||||||||||||
| 41,907 | (7) | $ | 2,703,421 | |||||||||||||||||||||||||
| 28,624 | (8) | $ | 1,846,534 | |||||||||||||||||||||||||
| 19,691 | (9) | $ | 1,270,266 | |||||||||||||||||||||||||
| 986 | (10) | $ | 63,607 | |||||||||||||||||||||||||
| 153,494 | (11) | — | (11) | |||||||||||||||||||||||||
| 93,671 | (12) | — | (12) | |||||||||||||||||||||||||
| 68,608 | (13) | — | (13) | |||||||||||||||||||||||||
| Michael Curless |
11,592 | (2) | $ | 747,800 | ||||||||||||||||||||||||
| 16,809 | (3) | $ | 1,084,349 | |||||||||||||||||||||||||
| 23,485 | (4) | $ | 1,515,017 | |||||||||||||||||||||||||
| 7,489 | (5) | $ | 483,115 | |||||||||||||||||||||||||
| 5,526 | (6) | $ | 356,482 | |||||||||||||||||||||||||
| 37,916 | (7) | $ | 2,445,961 | |||||||||||||||||||||||||
| 21,468 | (8) | $ | 1,384,901 | |||||||||||||||||||||||||
| 19,691 | (9) | $ | 1,270,266 | |||||||||||||||||||||||||
| 986 | (10) | $ | 63,607 | |||||||||||||||||||||||||
| 153,494 | (11) | — | (11) | |||||||||||||||||||||||||
| 93,671 | (12) | — | (12) | |||||||||||||||||||||||||
| 68,608 | (13) | — | (13) | |||||||||||||||||||||||||
| Columns | (c and d) have been omitted from this table because they are not applicable. |
| (1) | Dollar amounts are based on the closing price of our common stock on December 31, 2017, which was $64.51 per share. |
| (2) | LTIP Units: vested on March 13, 2018. |
|
|
98 | |||
|
OUTSTANDING EQUITY AWARDS
|
||
| (3) | LTIP Units: vested on March 9, 2018 (50%) and will vest on March 9, 2019 (50%). |
| (4) | LTIP Units: vested on March 9, 2018 (67%) and will vest on March 9, 2019 (33%). |
| (5) | LTIP Units: will vest on April 19, 2018 (50%) and April 19, 2019 (50%). |
| (6) | LTIP Units: will vest on December 16, 2018 (50%) and December 16, 2019 (50%). |
| (7) | LTIP Units: vested on March 7, 2018 (34%) and remainder will vest in equal amounts on each of March 7, 2019 and 2020. |
| (8) | LTIP Units: vested on March 7, 2018 (40%) and will vest on March 7, 2019 (40%) and March 7, 2020 (20%). |
| (9) | LTIP Units: will vest in equal amounts on each May 18, 2018, 2019 and 2020. |
| (10) | LTIP Units: will vest in equal amounts on each October 12, 2018, 2019 and 2020. |
| (11) | For the 2015-2017 Performance Period, column (i) represents the number of POP LTIP Units issued to the NEO in exchange for participation points originally allocated to the NEO under POP on February 10, 2015. No value is presented in column (j) because awards under POP have no threshold value. Actual awards were determined and paid after the end of the three-year performance period. As of December 31, 2017, the value of the compensation pool for the 2015-2017 Performance Period was $110.2 million. As a result, on January 25, 2018, Mr. Moghadam and each other NEO earned 263,918 and 105,567 POP LTIP units, respectively, for the 2015-2017 Performance Period. The remainder of POP LTIP Units originally issued to the NEOs were forfeited. See the narrative discussion of POP LTIP Units that follows the Grants of Plan-Based Awards Table for 2017. |
| (12) | For the 2016-2018 Performance Period, column (i) represents the number of POP LTIP Units issued to the NEO in exchange for participation points originally allocated to the NEO under POP on June 3, 2016. No value is presented in column (j) because awards under POP have no threshold value. Actual awards will not be determined or paid unless and until relevant performance hurdles are met. As of December 31, 2017, the projected value of the compensation pool for the 2016-2018 Performance Period was $115.0 million. See the narrative discussion of LTIP Units that follows the Grants of Plan-Based Awards Table for 2017. |
| (13) | For the 2017-2019 Performance Period, column (i) represents the number of POP LTIP Units issued to the NEO in exchange for participation points originally allocated to the NEO under POP on January 3, 2017. No value is presented in column (j) because awards under POP have no threshold value. Actual awards will not be determined or paid until the end of the three-year performance period. As of December 31, 2017, the projected value of the compensation pool for the 2017-2019 Performance Period was $142.3 million. See the narrative discussion of LTIP Units that follows the Grants of Plan-Based Awards Table for 2017. |
|
|
99 | |||
|
OPTION EXERCISES AND STOCK VESTED
|
||
Option Exercises and Stock Vested in Fiscal Year 2017
| Option Awards
|
Stock Awards
|
|||||||||||||||
| Name (a)
|
Number of Shares Acquired on Exercise (#) (b)
|
Value Realized on Exercise ($) (c)
|
Number of Shares Acquired on Vesting (#) (d)
|
Value Realized on Vesting ($) (e)
|
||||||||||||
| Hamid Moghadam |
356,957 | $ | 8,262,871 | (1) | 73,547 | (4) | $ | 3,675,144 | (4) | |||||||
| 359,707 | (5)(6) | $ | 18,796,232 | (5)(6) | ||||||||||||
| Thomas Olinger |
95,425 | $ | 3,456,151 | (2) | 138,330 | (5)(7) | $ | 7,183,047 | (5)(7) | |||||||
| Eugene Reilly |
— | $ | — | 148,459 | (5)(8) | $ | 7,685,093 | (5)(8) | ||||||||
| Edward Nekritz |
83,700 | $ | 3,209,328 | (3) | 141,875 | (5)(9) | $ | 7,359,575 | (5)(9) | |||||||
| Gary Anderson |
— | $ | — | 137,984 | (5)(10) | $ | 7,165,993 | (5)(10) | ||||||||
| Michael Curless |
— | $ | — | 127,235 | (5)(11) | $ | 6,635,072 | (5)(11) | ||||||||
| (1) | This value is the difference between the market price of our common stock and the exercise price of the stock options when they were exercised by Mr. Moghadam (May 25 – June 2, 2017). The stock options exercised were granted on February 2, 2011 at an exercise price of $32.95. |
| (2) | This value is the difference between the market price of our common stock and the exercise price of the stock options when they were exercised by Mr. Olinger (April 27, 2017 and December 18, 2017). The stock options exercised were granted on February 21, 2008 at an exercise price of $48.76, February 10, 2009 at an exercise price of $15.92, and on February 11, 2010 at an exercise price of $22.14. |
| (3) | This value is the difference between the market price of our common stock and the exercise price of the stock options when they were exercised by Mr. Nekritz (March 20, 2017, May 17, 2017 and June 2, 2017). The stock options exercised were granted on November 11, 2008 at an exercise price of $15.39. |
| (4) | Shares were granted on February 13, 2014 and vested on February 13, 2017. Mr. Moghadam deferred these shares under our nonqualified deferred compensation plan. Mr. Moghadam has not sold any of the shares he acquired as a result of this vesting. See also the Nonqualified Deferred Compensation in Fiscal Year 2017 table below. |
| (5) | Under certain conditions, an LTIP Unit is convertible into a common unit of the operating partnership which can then be redeemed into one share of our common stock (or cash at our election). Among other conditions, LTIP Units cannot be converted until they are vested and after the completion of a requisite waiting period from the date of issuance. See “Narrative Discussion to the Summary Compensation Table for Fiscal Year 2017 and the Grants of Plan-Based Awards in Fiscal Year 2017 Table.” |
| (6) | Represents the vesting of LTIP Units as presented below: |
| ¾ | 15,111 units with a value of $985,237, issued on September 17, 2014, vested on September 17, 2017; |
| ¾ | 177,669 units with a value of $9,332,953, issued on February 10, 2015, vested on January 17, 2017; |
| ¾ | 68,642 units with a value of $3,384,051, issued on March 9, 2016, vested on March 9, 2017; |
| ¾ | 73,255 units with a value of $3,610,739, issued on March 13, 2015, vested on March 13, 2017; |
| ¾ | 14,403 units with a value of $782,083, issued on April 19, 2016, vested on April 19, 2017; |
| ¾ | 10,627 units with a value of $701,169, issued on December 16, 2016, vested on December 16, 2017. |
| (7) | Represents the vesting of LTIP Units as presented below: |
| ¾ | 3,929 units with a value of $256,171, issued on September 17, 2014, vested on September 17, 2017; |
| ¾ | 10,102 units with a value of $504,797, RSUs originally granted on February 13, 2014 and exchanged for LTIP Units on January 20, 2015, vested on February 13, 2017; |
| ¾ | 71,067 units with a value of $3,733,150, issued on February 10, 2015, vested on January 17, 2017; |
| ¾ | 24,760 units with a value of $1,220,666, issued on March 9, 2016, vested on March 9, 2017; |
| ¾ | 21,964 units with a value of $1,082,606, issued on March 13, 2015, vested on March 13, 2017; |
| ¾ | 3,745 units with a value of $203,354, issued on April 19, 2016, vested on April 19, 2017; |
| ¾ | 2,763 units with a value of $182,303, issued on December 16, 2016, vested on December 16, 2017. |
| (8) | Represents the vesting of LTIP Units as presented below: |
| ¾ | 3,929 units with a value of $256,171, issued on September 17, 2014, vested on September 17, 2017; |
| ¾ | 14,143 units with a value of $706,726, RSUs originally granted on February 13, 2014 and exchanged for LTIP Units on January 20, 2015, vested on February 13, 2017; |
|
|
100 | |||
|
OPTION EXERCISES AND STOCK VESTED
|
||
| ¾ | 71,067 units with a value of $3,733,150, issued on February 10, 2015, vested on January 17, 2017; |
| ¾ | 28,472 units with a value of $1,403,670, issued on March 9, 2016, vested on March 9, 2017; |
| ¾ | 24,340 units with a value of $1,199,719, issued on March 13, 2015, vested on March 13, 2017; |
| ¾ | 3,745 units with a value of $203,354, issued on April 19, 2016, vested on April 19, 2017; |
| ¾ | 2,763 units with a value of $182,303, issued on December 16, 2016, vested on December 16, 2017. |
| (9) | Represents the vesting of LTIP Units as presented below: |
| ¾ | 3,929 units with a value of $256,171, issued on September 17, 2014, vested on September 17, 2017; |
| ¾ | 12,732 units with a value of $636,218, RSUs originally granted on February 13, 2014 and exchanged for LTIP Units on January 20, 2015, vested on February 13, 2017; |
| ¾ | 71,067 units with a value of $3,733,150, issued on February 10, 2015, vested on January 17, 2017; |
| ¾ | 25,229 units with a value of $1,243,790, issued on March 9, 2016, vested on March 9, 2017; |
| ¾ | 22,410 units with a value of $1,104,589, issued on March 13, 2015, vested on March 13, 2017; |
| ¾ | 3,745 units with a value of $203,354, issued on April 19, 2016, vested on April 19, 2017; |
| ¾ | 2,763 units with a value of $182,303, issued on December 16, 2016, vested on December 16, 2017. |
| (10) | Represents the vesting of LTIP Units as presented below: |
| ¾ | 3,929 units with a value of $256,171, issued on September 17, 2014, vested on September 17, 2017; |
| ¾ | 10,102 units with a value of $504,797, RSUs originally granted on February 13, 2014 and exchanged for LTIP Units on January 20, 2015, vested on February 13, 2017; |
| ¾ | 71,067 units with a value of $3,733,150, issued on February 10, 2015, vested on January 17, 2017; |
| ¾ | 24,559 units with a value of $1,210,759, issued on March 9, 2016, vested on March 9, 2017; |
| ¾ | 21,819 units with a value of $1,075,459, issued on March 13, 2015, vested on March 13, 2017; |
| ¾ | 3,745 units with a value of $203,354, issued on April 19, 2016, vested on April 19, 2017; |
| ¾ | 2,763 units with a value of $182,303, issued on December 16, 2016, vested on December 16, 2017. |
| (11) | Represents the vesting of LTIP Units as presented below: |
| ¾ | 3,929 units with a value of $256,171, issued on September 17, 2014, vested on September 17, 2017; |
| ¾ | 8,486 units with a value of $424,045, RSUs originally granted on February 13, 2014 and exchanged for LTIP Units on January 20, 2015, vested on February 13, 2017; |
| ¾ | 71,067 units with a value of $3,733,150, issued on February 10, 2015, vested on January 17, 2017; |
| ¾ | 24,317 units with a value of $1,198,828, issued on March 9, 2016, vested on March 9, 2017; |
| ¾ | 12,928 units with a value of $637,221, issued on March 13, 2015, vested on March 13, 2017; |
| ¾ | 3,745 units with a value of $203,354, issued on April 19, 2016, vested on April 19, 2017; |
| ¾ | 2,763 units with a value of $182,303, issued on December 16, 2016, vested on December 16, 2017. |
|
|
101 | |||
|
NONQUALIFIED DEFERRED COMPENSATION
|
||
Nonqualified Deferred Compensation in Fiscal Year 2017*
| Name (a) | Plans | Executive Contributions in Last FY ($) (b) |
Aggregate Earnings In Last FY ($) (d) |
Aggregate Withdrawals/ Distributions ($) (e) |
Aggregate Balance at Last FYE ($) (f) |
|||||||||||||
| Hamid Moghadam |
AMB NQ Plans & 2012 NQDC Plan(1) |
$ | 3,691,324 | $ | 13,599,633 | (2) | $ | — | $ | 69,171,398 | ||||||||
| Notional Account NQDC Plan(3) |
$ | — | $ | 11,298,907 | $ | — | $ | 33,399,540 | ||||||||||
| Thomas Olinger |
AMB NQ Plans & 2012 NQDC Plan(1) |
$ | — | $ | 394,125 | (2) | $ | — | $ | 2,026,053 | ||||||||
| Eugene Reilly |
$ | — | $ | — | $ | — | $ | — | ||||||||||
| Edward Nekritz |
$ | — | $ | — | $ | — | $ | — | ||||||||||
| Gary Anderson |
$ | — | $ | — | $ | — | $ | — | ||||||||||
| Michael Curless |
$ | — | $ | — | $ | — | $ | — | ||||||||||
| * | Column (c) has been omitted from this table because it is not applicable. |
| (1) | The NEO deferred the receipt of RSUs that vested during 2017. See additional information on the awards deferred in the Option Exercises and Stock Vested in Fiscal Year 2017 table above. The value reported as a contribution represents the value on the date the shares were delivered to the rabbi trust which is not necessarily the value on the vesting date. The NEO did not defer any cash compensation in 2017. Dividends earned on our common stock that the NEO has deferred are credited to his account in cash, which is then invested in investment options other than our common stock. Our nonqualified deferred compensation plans are described in more detail in the narrative discussion that follows these footnotes. |
| (2) | Represents earnings that are computed based on the specific investment options that are elected by the NEO, as described in the narrative discussion that follows these footnotes. Primarily these earnings consist of the dividends paid on the shares of our common stock deferred by the NEO and the change in the market value of those shares. These amounts are not included in the NEO’s total compensation presented in the Summary Compensation Table for Fiscal Year 2017 above. |
| (3) | Participants in our nonqualified deferred compensation plans prior to the Merger received a lump-sum payment, triggered by the Merger, equal to the value of their account balance in June 2011. After the Merger, we established a new nonqualified deferred compensation plan that is discussed in further detail below. Under this Notional Account NQDC Plan, an initial account credit value was established for the NEO who received distributions from this plan in June 2011 as a result of the Merger. Participants in the Notional Account NQDC are credited with the excess in value, if any, of their Notional Earnings Account (representing the initial account credit value plus the cumulative earnings or losses associated with the underlying, hypothetical investments, if any) over the initial account credit value. The amount in column (f) represents the excess of the participant’s notional earnings account value over the initial account credit value as of December 31, 2017. The extent to which this excess is attributable to changes in values during 2017 is reflected as earnings for 2017 in column (d). The initial account credit value is not reflected in this table because the participant does not have a right to the initial account credit value. See the narrative discussion that follows these footnotes. |
|
|
102 | |||
|
NONQUALIFIED DEFERRED COMPENSATION
|
||
Narrative Discussion to Nonqualified Deferred Compensation in Fiscal Year 2017 Table
2012 NQDC Plan
Effective 2012, we established a nonqualified deferred compensation plan (the “2012 NQDC Plan”). The 2012 NQDC Plan allows certain eligible employees and non-employee directors of the company and our participating subsidiaries to elect to defer up to 100% of their eligible compensation, such as annual salary, bonus, equity awards and directors’ fees, that were earned and vested on or after January 1, 2012. The deferred compensation under the 2012 NQDC Plan is our unsecured obligation and amounts deferred are held in a rabbi trust. Participants select from various investment options available under the plan to earn investment credits on their elective deferrals. There are no guaranteed returns for any of the investment options or for any participants in the plans. The amount of earnings that a participant receives depends on the participant’s investment elections related to cash balances in the account and, with respect to shares of our common stock that have been deferred, the dividends earned on that stock and the change in market value of the stock during the period. The 2012 NQDC Plan offers a variety of investment choices with respect to cash contributions. Our common stock is not an investment option available with respect to deferrals of cash compensation. The NEOs did not elect to defer any of their 2017 cash compensation (salary or bonus) under the 2012 NQDC Plan.
If a participant elects to defer the receipt of an equity award, the underlying common stock is held in the rabbi trust, which cannot be reinvested in any other investment option. Cash dividends earned on these shares of our common stock after deferral are credited with earnings and losses based on specific investment options, other than our common stock, that are selected by the participant. Distributions under these plans are made in a lump sum payment upon termination of employment, or service as a non-employee director, or in the event of a change in control or death of a participant. With respect to equity awards deferred by non-employee directors, participants may elect to receive distributions prior to termination of service.
We have reserved the right under the 2012 NQDC Plan to make discretionary matching contributions to participant accounts from time to time. No such discretionary contributions have been made. The participants’ elective deferrals and matching contributions, if any, are fully vested at all times. We pay all of the administrative costs associated with the 2012 NQDC Plan. Generally, the compensation that is deferred is tax-deferred until it is distributed to the participant. However, amounts deferred are subject to FICA and Medicare employee and employer taxes in accordance with statutory requirements.
In December 2014, the 2012 NQDC Plan was amended, primarily to allow for LTIP Units to be issued in lieu of other deferred compensation upon a distribution event.
AMB NQ Plans
Prior to the Merger, we maintained two nonqualified deferred compensation plans: (i) the Amended and Restated AMB 2005 Nonqualified Deferred Compensation Plan (the “2005 NQ Plan”) and (ii) the Amended and Restated Nonqualified Deferred Compensation Plan (the “2002 NQ Plan”), (together, the “AMB NQ Plans”). The AMB NQ Plans allowed our directors and certain eligible employees to defer certain compensation, including the receipt of restricted stock awards and, in the case of the 2002 NQ Plan, gains from exercise of stock options, received under our equity compensation plans. The AMB NQ Plans provided that upon a change in control, such as the Merger in June 2011, participants would receive a lump-sum payment equal to the vested account balance. Such distributions were made in 2011.
Compensation subject to deferral elections made under the AMB NQ Plans prior to the Merger with respect to compensation earned in 2011 and beyond was not subject to the distributions under the AMB NQ Plans triggered by the Merger. Mr. Moghadam has deferred certain gains resulting from the exercise of stock options under the 2002 NQ
|
|
103 | |||
|
NONQUALIFIED DEFERRED COMPENSATION
|
||
Plan. In addition, Mr. Moghadam and Mr. Olinger have deferred shares of our common stock received upon vesting of certain equity awards under the 2005 NQ Plan.
The deferred compensation under the AMB NQ Plans is our unsecured obligation and amounts deferred are held in a rabbi trust. Participants select from various investment options available under the plans to receive investment credit on their elective deferrals. There are no guaranteed returns for any of the investment options or for any participants in the plans. The amount of earnings that a participant receives depends on the participant’s investment elections related to cash balances in the account and, with respect to deferred shares of our common stock, the dividends earned on the stock and the change in market value of the stock during the period. Cash dividends earned on shares of our common stock after deferral are credited earnings and losses based on specific investment options, other than our common stock, selected by the participant. Distributions under these plans are made in either a lump sum payment or installments. Participants can elect a specific distribution date in accordance with Section 409A of the Internal Revenue Code or, if no election is made, the amounts will be distributed upon termination of the participant’s employment with us. Distributions are also made in the event of change in control or a participant’s death or disability.
In December 2014, the 2005 NQ Plan was amended, primarily to allow for LTIP Units to be issued in lieu of other deferred compensation upon a distribution event under the plan.
Notional Account NQDC Plan
The Notional Account NQDC Plan was adopted in conjunction with the Merger with the purpose of providing the opportunity for certain participants of the AMB NQ Plans to continue to receive tax deferred earnings with respect to taxes on distributions triggered by the Merger.
Each participant in the AMB NQ Plans who continued to be employed by us after the Merger or continued as a non-employee director after the Merger received an initial account credit in a notional earnings account under the Notional Account NQDC Plan. Mr. Moghadam and Mr. Olinger participate in the Notional Account NQDC Plan. The initial account credit value for a participant was equal to the deemed amount of the tax liability on the distributions they received in 2011 that were triggered by the Merger. The initial account credit value is either invested in our common stock or hypothetically invested in measurement funds selected by the participant, which do not include our common stock. Measurement funds are used for measurement purposes only and plan participants do not have rights in or to the underlying hypothetical investments.
A notional earnings account is credited with hypothetical earnings or charged with hypothetical losses associated with the underlying hypothetical investments in measurement funds. Upon a distribution event under the plan, the participant is entitled to the excess, if any, of the value in the notional earnings account (representing the value of the initial account credit plus cumulative earnings or losses associated with the underlying hypothetical investments, if any) over the initial account credit value.
Mr. Moghadam’s initial account credit value was in the amount of $25,798,616. A rabbi trust was created to hold shares of our common stock and cash in the amount of Mr. Moghadam’s initial account credit balance. We issued 803,945 shares of our common stock to the rabbi trust representing Mr. Moghadam’s initial account credit value. The number of shares was determined based on the price of our common stock at the time, $32.09 per share. Mr. Moghadam is entitled to direct the voting of these shares and, as such, they are reflected as beneficially owned by him in the stock ownership table presented below. Mr. Moghadam is not entitled to receive these shares upon distribution of his notional earnings account under the plan. Upon a distribution event under the plan, Mr. Moghadam is entitled to the excess, if any, of the value in the notional earnings account (representing the value of the initial account credit plus cumulative earnings or losses associated with the underlying common stock, if any) over the initial account credit value.
Mr. Olinger’s initial account credit value was hypothetically invested in measurement funds selected by him. The initial account credit value for Mr. Olinger was $122,697.
|
|
104 | |||
|
NONQUALIFIED DEFERRED COMPENSATION
|
||
In December 2014, the Notional Account NQDC Plan was amended, primarily to allow for LTIP Units to be issued in lieu of other deferred compensation upon a distribution event under the plan.
Investment funds and returns for 2017
The participants in our nonqualified deferred compensation plans can elect measurement funds which are the same investment funds that are available to participants in our 401(k) Plan, with the exception of investments in our company stock. Our company stock is not an available investment option under the nonqualified deferred compensation plans. These investment funds are shown below with the returns earned by these investments funds in 2017:
| Vanguard Treasury M/M Fund |
0.80% | Metropolitan West High Yield Bond I | 6.37% | |||||||
| PIMCO Real Return/Institutional |
3.92% | Vanguard Interm. Term Bond Index Inst. | 3.88% | |||||||
| Vanguard Short-Term Bond Index Admiral |
1.18% | Vanguard Balanced Index Fund (Instl) | 13.86% | |||||||
| Vanguard Target Retirement Income |
8.47% | Vanguard Target Retirement 2015 | 11.50% | |||||||
| Vanguard Target Retirement 2020 |
14.08% | Vanguard Target Retirement 2025 | 15.94% | |||||||
| Vanguard Target Retirement 2030 |
17.52% | Vanguard Target Retirement 2035 | 19.12% | |||||||
| Vanguard Target Retirement 2040 |
20.71% | Vanguard Target Retirement 2045 | 21.42% | |||||||
| Vanguard Target Retirement 2050 |
21.39% | Vanguard Target Retirement 2055 | 21.38% | |||||||
| Vanguard Target Retirement 2060 |
21.36% | American Beacon Small Cap Value I | 8.67% | |||||||
| American Funds Growth Fund of Am.R6 |
26.53% | American Funds Wash. Mutual Inv R6 | 20.54% | |||||||
| Vanguard Growth Index Fund (Inst) |
27.81% | Vanguard Institutional Index I | 21.79% | |||||||
| Vanguard Mid-Cap Index Fund Instl. |
19.29% | Vanguard Small Cap Growth Index (Inst) | 21.94% | |||||||
| Artisan International Institutional |
31.24% | Vanguard Total Intl Stock Index Admiral | 27.55% | |||||||
| Invesco Global Real Estate R5 |
13.12% |
|
|
105 | |||
|
POTENTIAL PAYMENTS UPON TERMINATION OR CHANGE IN CONTROL
|
||
Potential Payments upon Termination or Change in Control
We have change in control and noncompetition agreements (the “CIC Agreements”) with our NEOs. The CIC Agreements are subject to automatic one-year extensions. Some form of severance benefits (cash payments and/or acceleration of vesting of unvested equity awards) are provided to our NEOs for: (i) in the CIC Agreements; (ii) under the equity award agreements; or (iii) under the terms of POP. These benefits are available under the following scenarios: (1) death; (2) disability; (3) retirement (as defined and under certain circumstances) and (4) termination without cause or termination by employee for good reason within two years of a change in control (as defined).
In the event of a change in control, the CIC Agreements provide for severance benefits on a “double-trigger” basis with severance benefits payable only upon termination of employment (which is, generally, termination without cause or termination by employee for good reason as such term is defined in the CIC Agreements), within two years following the change in control. Under the CIC Agreements, in consideration for the rights to receive such severance payments, the NEO is subject to confidentiality obligations during employment and after termination, non-competition obligations during the term of employment and non-solicitation obligations for two years after the date of termination. A change of control, as defined in the CIC Agreements, generally occurs upon: (i) the consummation of a transaction, approved by our stockholders, to merge or consolidate the company with another entity, sell or otherwise dispose of all or substantially all of its assets or adopt a plan of liquidation, provided, however, that a change in control shall not occur if a transaction results in 50% or more of the beneficial ownership of the voting power of the company or other relevant entity being held by the same persons (although not necessarily in the same proportion) who held the voting power of the company immediately prior to the transaction (except that upon the completion of the transaction, employees or employee benefit plans of the company may be a new holder of such beneficial ownership); (ii) the beneficial ownership of securities representing 50% or more of the combined voting power of the company is acquired, other than from the company, by any person (with certain exceptions); or (iii) at any time during any period of two consecutive years, board members at the beginning of such period cease to constitute at least a majority of the Board (unless the election or the nomination for election of each new director was approved by a vote of at least two-thirds of the directors still in office at the time of such election or nomination who were directors at the beginning of such period).
Potential payments due to the NEOs under the scenarios listed above are presented in the table below based on the assumption that a termination occurred as of December 31, 2017. The acceleration of vesting of unvested equity awards benefit is estimated using the closing stock price of our common stock on December 31, 2017 of $64.51 per share. Under our company policy, each of our employees would be paid for their earned and unused vacation benefits upon termination under any termination scenario, so the value of this benefit is not included in the amounts below. Because the termination scenarios are as of December 31, 2017, the NEOs would have completed the performance year such that they would receive their annual bonus and their annual long-term equity incentive award for the 2017 performance year. Therefore, these payments are not considered to be severance benefits and such amounts are not included in the amounts presented.
|
|
106 | |||
|
POTENTIAL PAYMENTS UPON TERMINATION OR CHANGE IN CONTROL
|
||
| Name of Executive/Type of Benefit
|
Death
|
Disability
|
After Change in Control: Termination without Cause or Voluntary Termination for Good Reason(1)
|
|||||||||
| Hamid Moghadam |
||||||||||||
| Cash severance (salary and bonus)(2) |
$ | 1,500,000 | $ | — | $ | 5,000,000 | ||||||
| Health and welfare benefits(3) |
$ | — | $ | — | $ | 86,320 | ||||||
| 280G adjustment(4) |
$ | — | $ | — | $ | — | ||||||
| Equity awards (vesting accelerated)(5)(6) |
$ | 73,035,775 | $ | 73,035,775 | $ | 73,035,775 | ||||||
| Total Estimated Value |
$ | 74,535,775 | $ | 73,035,775 | $ | 78,122,095 | ||||||
| Thomas Olinger |
||||||||||||
| Cash severance (salary and bonus)(2) |
$ | 350,000 | $ | — | $ | 2,700,000 | ||||||
| Health and welfare benefits(3) |
$ | — | $ | — | $ | 86,320 | ||||||
| 280G adjustment(4) |
$ | — | $ | — | $ | — | ||||||
| Equity awards (vesting accelerated)(5)(6) |
$ | 25,848,075 | $ | 25,848,075 | $ | 25,848,075 | ||||||
| Total Estimated Value |
$ | 26,198,075 | $ | 25,848,075 | $ | 28,634,395 | ||||||
| Eugene Reilly |
||||||||||||
| Cash severance (salary and bonus)(2) |
$ | 350,000 | $ | — | $ | 2,700,000 | ||||||
| Health and welfare benefits(3) |
$ | — | $ | — | $ | 86,320 | ||||||
| 280G adjustment(4) |
$ | — | $ | — | $ | — | ||||||
| Equity awards (vesting accelerated)(5)(6) |
$ | 27,159,628 | $ | 27,159,628 | $ | 27,159,628 | ||||||
| Total Estimated Value |
$ | 27,509,628 | $ | 27,159,628 | $ | 29,945,948 | ||||||
| Edward Nekritz |
||||||||||||
| Cash severance (salary and bonus)(2) |
$ | 350,000 | $ | — | $ | 2,700,000 | ||||||
| Health and welfare benefits(3) |
$ | — | $ | — | $ | 86,320 | ||||||
| 280G adjustment(4) |
$ | — | $ | — | $ | — | ||||||
| Equity awards (vesting accelerated)(5)(6) |
$ | 25,968,193 | $ | 25,968,193 | $ | 25,968,193 | ||||||
| Total Estimated Value |
$ | 26,318,193 | $ | 25,968,193 | $ | 28,754,513 | ||||||
| Gary Anderson |
||||||||||||
| Cash severance (salary and bonus)(2) |
$ | 350,000 | $ | — | $ | 2,700,000 | ||||||
| Health and welfare benefits(3) |
$ | — | $ | — | $ | 86,320 | ||||||
| 280G adjustment(4) |
$ | — | $ | — | $ | — | ||||||
| Equity awards (vesting accelerated)(5)(6) |
$ | 25,884,265 | $ | 25,884,265 | $ | 25,884,265 | ||||||
| Total Estimated Value |
$ | 26,234,265 | $ | 25,884,265 | $ | 28,670,585 | ||||||
| Michael Curless |
||||||||||||
| Cash severance (salary and bonus)(2) |
$ | 350,000 | $ | — | $ | 2,700,000 | ||||||
| Health and welfare benefits(3) |
$ | — | $ | — | $ | 94,347 | ||||||
| 280G adjustment(4) |
$ | — | $ | — | $ | — | ||||||
| Equity awards (vesting accelerated)(5)(6) |
$ | 24,786,499 | $ | 24,786,499 | $ | 24,786,499 | ||||||
| Total Estimated Value |
$ | 25,136,499 | $ | 24,786,499 | $ | 27,580,846 | ||||||
|
|
107 | |||
|
POTENTIAL PAYMENTS UPON TERMINATION OR CHANGE IN CONTROL
|
||
| (1) | Cause is generally defined in the CIC Agreements as: (i) the willful and continued failure by the executive to substantially perform specified duties; (ii) the engaging in conduct that is demonstrably injurious to the company (monetarily or otherwise); or (iii) the engaging in egregious misconduct involving serious moral turpitude. Termination by employee for good reason, as generally defined in the CIC Agreements, can occur should we: (i) change the executive’s duties such that they are inconsistent with the position held prior to the change in control and results in a material diminution in the executive’s authority, duties, or responsibilities; (ii) material reduction in the executive’s annual base compensation after the change in control; (iii) relocate the executive’s place of employment more than 50 miles from the current location or require the executive to be based anywhere other than where the executive was based prior to the change in control without the executive’s written consent resulting in a material change to geographic location; or (iv) not comply with the provisions of the agreements or arrangements pertaining to the officer’s compensation and benefits. |
| (2) | Under the death and disability scenarios contained in the CIC Agreements, the NEO would receive a cash severance payment equal to his annual base salary plus the annual bonus amount that he received or was entitled to receive for the most recent annual period (target level for 2017) less amounts that would be paid to the executive from other company benefits. The starting amount under each scenario ($2,500,000 for Mr. Moghadam and $1,350,000 for each of the other NEOs) is based on the executive’s annual base salary as of December 31, 2017 ($1,000,000 for Mr. Moghadam and $600,000 for each of the other NEOs) and the executive’s annual bonus at target for 2017 ($1,500,000 for Mr. Moghadam and $750,000 for each of the other NEOs). Under the death scenario, each executive’s severance payment has been reduced by $1,000,000, which is the approximate present value of the life insurance benefit provided by the company. The life insurance benefit provided by the company is two times base salary with a limit of $1,000,000. Under the disability scenario, the starting amount is the same as under the death scenario and each executive’s severance payment has been reduced to zero based on the expected present value of future disability benefits that the executive would receive that are provided and funded by the company. The annual disability benefit provided by the company is 60% of base salary subject to a maximum of $204,000 per year. For this purpose, it is assumed that the present value of the future annual disability benefits to be received will be in excess of the payments required under the CIC Agreements. Under the change in control scenario, the NEO would receive cash severance equal to two times his annual base salary and two times his annual bonus (at target) for the current year. |
| (3) | In the change in control scenario contained in the CIC Agreements, the NEO would receive a cash payment equal to the cost of continuation of health insurance coverage in place at the date of termination for 24 months. Additionally, the CIC Agreements provide for the payment of an amount equal to two times the company’s matching contribution under the 401(k) Plan ($16,500) and for outplacement services for one year with an estimated value of $25,000. |
| (4) | The CIC Agreements provide for the reduction of any payments to which the NEO is entitled after a change in control should such payments constitute a “parachute payment” (as defined in Section 280G of the Internal Revenue Code). Such payments shall be either (a) reduced (but not below zero) so that the aggregate present value of the payment shall be $1.00 less than three times the officer’s “base amount” (also as defined in Section 280G of the Internal Revenue Code) so that no portion of the payment will be subject to the excise tax imposed by Section 4999 of the Internal Revenue Code or (b) paid in full, whichever produces the better net after-tax result for the NEO (taking into account any applicable excise tax under Section 4999 and any applicable income taxes). Under the scenarios for 2017, none of the NEOs, would receive a better net after-tax result with a reduction. |
| (5) | The estimates for each scenario reflect the value that would be realized as of December 31, 2017 as a result of accelerated vesting of earned but unvested stock awards, LTIP Units and participation points (or POP LTIP Units) awarded under the POP. Values are included to the extent that vesting would be accelerated under the applicable scenario under the terms of the applicable agreements. All stock options held by the NEOs are vested so no additional value is realized under any scenario related to stock options. For each scenario, the value attributable to stock awards is computed based on the closing price of our common stock on December 31, 2017 ($64.51). |
Under the death and disability scenarios, awards under POP would not be paid until the end of the performance period and the actual awards paid would be based on performance for the entire performance period. Under these scenarios, the value of the participation points allocated to each NEO under POP (and the POP LTIP Units exchanged for such participation points) for the 2016-2018 performance period and the 2017-2019 performance period is computed as of December 31, 2017 using estimated compensation pools based on actual performance for the performance period through December 31, 2017. As of December 31, 2017, the estimated value of the aggregate compensation pool for these performance periods is $115.0 million for the 2016 – 2018 performance period and $142.3 million for the 2017 – 2019 performance period.
Under the change in control scenario, the Compensation Committee would determine the size of the compensation pool for each performance period and cash awards would be paid as of the executive’s termination date due to the change in control. Under this scenario, the value of the participation points allocated to each NEO under POP (and the POP LTIP Units exchanged for such participation points) for the 2016-2018 Performance Period and the 2017-2019 Performance Periods is computed consistently with the value applicable to the death and disability scenarios.
The POP awards earned for the 2015-2017 performance period were not included in the death, disability and change in control calculations as participants were eligible to earn their awards (pending approval by the Compensation Committee) as of December 31, 2017 and, as such, the awards would not be considered a death, disability or severance benefit.
| (6) | The 2012 LTIP provides for acceleration of vesting of unvested stock awards and stock options upon retirement, defined as attaining 62 years of age with a combined sum of age and years of service equal to or exceeding 75. The POP allows participants to retain their participation points upon retirement using the 2012 LTIP definition of retirement. None of the NEOs met the retirement eligibility criteria as of December 31, 2017, the assumed date of the termination scenarios for this presentation. Therefore, no acceleration benefit is reported for a retirement scenario. |
|
|
108 | |||
|
CEO PAY RATIO
|
||
Prologis provides fair and equitable compensation to its employees through a combination of competitive base pay, incentives, retirement plans and other benefits. As required by Section 953(b) of the Dodd-Frank Wall Street Reform and Consumer Protection Act, and Item 402(u) of Regulation S-K, we are providing the following information about the relationship of the annual total compensation of our employees and the annual total compensation of our CEO, Mr. Moghadam:
For 2017, our last completed fiscal year:
| ¾ | the annual total compensation of the employee identified at the median of our company as of December 31, 2017 (other than the CEO) was $94,915; and |
| ¾ | the annual total compensation of our CEO, as reported in the Summary Compensation Table included in this Proxy Statement, was $19,352,127. |
Based on this information, the ratio of the annual total compensation of our CEO to the median of the annual total compensation of all other employees was 204 to 1.
This pay ratio is a reasonable estimate calculated in a manner consistent with SEC rules based on our payroll and employment records and the methodology described below. The SEC rules for identifying the median compensated employee and calculating the pay ratio based on that employee’s annual total compensation allow companies to adopt a variety of methodologies, to apply certain exclusions, and to make reasonable estimates and assumptions that reflect their compensation practices. As such, the pay ratio reported by other companies may not be comparable to the pay ratio reported above, as other companies may have different employment and compensation practices and may utilize different methodologies, exclusions, estimates and assumptions in calculating their own pay ratios.
Pay ratios within our industry will also differ and may not be comparable depending on the size, scope, global breadth and structure of the company.
To identify the median of the annual total compensation of all our employees, as well as to determine the annual total compensation of the “median employee,” the methodology and the material assumptions, adjustments, and estimates that we used were as follows:
| ¾ | To identify the median employee, we calculated compensation of our employees using their 2017 annual base salaries, bonuses for the 2017 performance year (including any bonus exchange premium received), annual LTI equity awards paid in 2017, value of POP points for the 2017-2019 performance period, PPP awards paid in 2017 and company contributions to applicable retirement plans. |
| ¾ | We determined that as of December 31, 2017, our employee population consisted of 1,562 individuals. The total number of U.S. and non-U.S. employees were 833 and 729, respectively |
| ¾ | We did not exclude any employees from our employee population. We excluded a limited number of temporary agency employees, whose compensation is determined by the agency and who are not considered our employees for purposes of the pay ratio calculation. |
| ¾ | We annualized the base pay and cash incentive bonus for 2017 new hires. |
| ¾ | Foreign salaries were converted to U.S. dollars at the December 31, 2017 exchange rate. |
| ¾ | No cost of living adjustments were utilized in the compensation calculation. |
| ¾ | Once the median employee was identified, we calculated the total compensation for our median employee using the same methodology we used to calculate Mr. Moghadam’s total compensation in the Summary Compensation Table for the Fiscal Year 2017. |
|
|
109 | |||
|
ADVISORY VOTE TO APPROVE THE COMPANY’S EXECUTIVE COMPENSATION
|
||
Advisory Vote to Approve the Company’s Executive Compensation for 2017 (Proposal 2)
The Dodd-Frank Act allows our stockholders to vote to approve, on an advisory (non-binding) basis, the compensation of our NEOs as disclosed in this proxy statement in accordance with SEC rules.
The compensation of our NEOs is discussed above under “Executive Compensation.” Our executive compensation programs are designed to attract, motivate and retain our NEOs, who are critical to our success. Under these programs, our NEOs are rewarded for the achievement of specific annual, long-term and strategic goals and the realization of increased stockholder value. Please read CD&A for additional details about our executive compensation programs, including information about the compensation of our NEOs for 2017.
This proposal, commonly known as a “say-on-pay” proposal, gives our stockholders the opportunity to express their views on our NEOs’ compensation that is described in this proxy statement. This vote is not intended to address any specific item of compensation, but rather the overall compensation of our NEOs and the philosophy, policies and practices described in this proxy statement. Accordingly, we ask our stockholders to vote “FOR” the following resolution at the annual meeting:
“RESOLVED, that the company’s stockholders approve, on an advisory basis, the company’s 2017 executive compensation, as discussed and disclosed in the company’s proxy statement for the 2018 annual meeting of stockholders pursuant to the compensation disclosure rules of the Securities and Exchange Commission, including the Compensation Discussion and Analysis, the Executive Compensation Tables and related narratives.”
You may vote for, vote against or abstain from voting to approve the above resolution on the company’s executive compensation for 2017. Assuming a quorum is present, to be approved by the stockholders, the proposal must receive the affirmative vote of a majority of the shares of common stock having voting power present in person or by proxy at the annual meeting. Abstentions and broker non-votes are considered voting power present in person or by proxy and thus will have the same effect as votes cast “Against” the proposal.
As an advisory vote, this proposal is not binding on the company. However, the Compensation Committee values the opinions of our stockholders and will review and consider the voting results when making future executive compensation decisions. The company currently intends to hold an advisory vote on its executive compensation on an annual basis.
The Board unanimously recommends that our stockholders vote, on an advisory basis, “FOR” the approval of our 2017 executive compensation, as disclosed in this proxy statement pursuant to the compensation disclosure rules of the Securities and Exchange Commission.
|
|
110 | |||
|
DIRECTOR COMPENSATION
|
||
Director Compensation
Director compensation held flat in 2017
Non-employee directors are compensated with a mix of cash and equity-based compensation, with a higher percentage of the overall mix in equity-based compensation. An employee who also serves as a member of the Board, such as Mr. Moghadam, does not receive additional compensation for service on the Board.
In May 2017, FW Cook conducted a competitive review of our non-employee director compensation to ensure that our compensation levels are competitive and the structure of the program is consistent with corporate governance best practices. The Compensation Committee has targeted our non-employee director compensation at the 75th percentile of the S&P 500, but not to exceed the 90th percentile of a comparison group of 10 large-cap REITs. These REITs are the same companies that are in the comparison group that is used to evaluate executive compensation and are listed above under “Compensation Discussion and Analysis.” The targeted percentiles are reflective of our overall size, scope and breadth of our business, which approximates the 75th percentile of the S&P500 and exceeds that of most of the companies in the comparison group.
FW Cook’s review found that (i) our non-employee director compensation is between 75th and 90th percentiles of the comparison group and between the median and 75th percentile of the S&P 500, assuming a 5% increase from 2016 compensation levels for the comparison group and the S&P 500 and (ii) the mix between the cash and equity components of our non-employee director compensation (40% in cash and 60% in equity) was consistent with median competitive practice of both the comparison group and the S&P 500.
Although FW Cook’s analysis supported an increase in director compensation, the Compensation Committee recommended no increases to director compensation in 2017. The recommendations were approved by the full Board.
Compensation applicable to service on the Board by our non-employee directors for 2017 was as follows:
| ¾ | Annual cash retainer: $110,000 |
| ¾ | Annual equity awards: Valued on the grant date at $165,000 |
| – | In the form of deferred share units (“DSUs”), each convertible into one share of our common stock, that will vest upon the earlier of one year from the grant date or the date of the next annual meeting. After vesting, receipt of the underlying common stock is deferred until at least three years from grant date. The DSUs earn dividend equivalent units (“DEUs”) while they are outstanding. |
| ¾ | Lead independent director retainer: $50,000 |
| ¾ | Annual retainer for serving as chair of a committee: |
| – | Audit: $30,000 |
| – | Compensation: $25,000 |
| – | Governance: $20,000 |
| – | Executive: None |
| ¾ | Excess meeting fee: Meeting fee of $1,500 for each meeting attended in excess of a combined 20 Board and committee meetings per year. |
The equity component of the compensation paid to our directors is awarded under the terms of the 2012 LTIP. See the narrative discussion that follows the Grants of Plan-Based Awards for Fiscal Year 2017 table above under “Executive Compensation.” In addition, we reimburse our directors for reasonable travel costs incurred to attend the meetings of the Board and its committees.
|
|
112 | |||
|
DIRECTOR COMPENSATION
|
||
Nonqualified Deferred Compensation Plans for Directors
2012 NQDC Plan and AMB NQ Plans
Messrs. Fotiades, Losh and Webb elected to defer receipt of their annual retainers and other fees earned, as applicable, in 2017. The compensation earned by these directors has been converted into phantom shares in a hypothetical fee deferral account, under the terms of the 2012 NQDC Plan. The footnotes to the Director Compensation for Fiscal Year 2017 table below contain information on the amount of deferrals applicable to these directors.
In 2012, Mr. Fotiades deferred his annual cash retainer into a cash account under the 2012 NQDC Plan. As of December 31, 2017, Mr. Fotiades’ balance in the cash account under the 2012 NQDC Plan was $178,645, including earnings in 2017 of $37,042.
See discussion of our deferred compensation plans in the narrative that follows the Nonqualified Deferred Compensation in Fiscal Year 2017 table above under “Executive Compensation.”
Notional Account NQDC Plan
Under the Notional Account NQDC Plan, Mr. Losh and Ms. Kennard received an initial account credit value in a notional earnings account equal to the amount of the deemed tax liability on the distributions they received in 2011 triggered by the Merger. The initial account credit value is hypothetically invested in measurement funds selected by the participant, which do not include our company stock. Measurement funds are used for measurement purposes only and plan participants do not have rights in or to the underlying hypothetical investments. Notional earnings accounts are credited with hypothetical earnings or charged with hypothetical losses associated with the underlying hypothetical investments. Upon their retirement from the Board, Mr. Losh and Ms. Kennard are entitled to the excess, if any, of the value in their notional earnings account (representing the value of the initial account credit plus cumulative earnings or losses associated with the underlying hypothetical investments, if any) over their initial account credit value.
The initial account credit values for Mr. Losh and Ms. Kennard were $469,558 and $98,047, respectively. As of December 31, 2017, the value of the notional earnings account exceeded the initial account credit value for Mr. Losh by $496,601, including an increase attributable to 2017 of $192,657, and for Ms. Kennard by $33,073, including an increase attributable to 2017 of $23,164.
See discussion of our deferred compensation plans in the narrative that follows the Nonqualified Deferred Compensation in Fiscal Year 2017 table above under “Executive Compensation.”
ProLogis Deferred Fee Plan for Trustees
This plan, which was assumed by us in the Merger, allowed members of the Trust’s board to receive their fees currently or elect to defer the receipt of their fees until after their board service ended. Deferrals were in the form of cash or Trust common shares. For those choosing shares, fees earned were credited to hypothetical fee deferral accounts based on the closing price of the common shares as of the date of the deferral. Under the Merger agreement, the Trust common shares in the deferral account were converted to our common stock using the Merger exchange ratio. Each share in the hypothetical account represents one share of our common stock and earns dividends under the same terms as dividends paid on our common stock. Upon retirement from the Board, the participant will be issued the shares of
|
|
113 | |||
|
DIRECTOR COMPENSATION
|
||
common stock included in their hypothetical fee deferral account pursuant to specific deferral elections, which generally delay payment until the next fiscal year after service on the Board ends. No additional deferrals could be made under this plan after December 31, 2011.
Mr. Fotiades participated in this plan at the time of the Merger. As of December 31, 2017, including amounts earned as dividends, Mr. Fotiades had a balance of 23,187 shares in his hypothetical fee deferral account.
Mr. Lyons and Mr. Zollars have hypothetical fee deferral accounts associated with prior service on the Trust’s board but were not participants in this plan at the time of the Merger. Mr. Lyons’ balance (495 shares as of December 31, 2017) is being distributed to him in five annual installments that began in 2015. Mr. Zollars’ balance (2,258 shares as of December 31, 2017) is being distributed to him in ten annual installments through 2020.
|
|
114 | |||
|
DIRECTOR COMPENSATION
|
||
Director Compensation for Fiscal Year 2017*
| Name (a) | Fees Earned or Paid in Cash(1) ($) (b) |
Stock Awards ($) (c) |
All Other Compensation ($) (g) |
Total(1) ($) (h) |
||||||||||||
| George Fotiades |
$ | 135,000 | (2) | $ | 164,958 | (3) | $ | 12,500 | (5) | $ | 312,458 | |||||
| Christine Garvey |
$ | 37,229 | $ | — | $ | — | (5) | $ | 37,229 | |||||||
| Lydia Kennard |
$ | 110,000 | $ | 164,958 | (3)(4) | $ | 12,500 | (5) | $ | 287,458 | ||||||
| J. Michael Losh |
$ | 140,000 | (2) | $ | 164,958 | (3)(4) | $ | 12,500 | (5) | $ | 317,458 | |||||
| Irving Lyons III |
$ | 160,000 | $ | 164,958 | (3) | $ | 12,500 | (5) | $ | 337,458 | ||||||
| David O’Connor |
$ | 110,000 | $ | 164,958 | (3) | $ | 12,500 | (5) | $ | 287,458 | ||||||
| Olivier Piani |
$ | 73,190 | $ | 164,958 | (3) | $ | — | (5) | $ | 238,148 | ||||||
| Jeffrey Skelton |
$ | 130,000 | $ | 164,958 | (3)(4) | $ | 12,500 | (5) | $ | 307,458 | ||||||
| Carl Webb |
$ | 110,000 | (2) | $ | 164,958 | (3) | $ | 12,500 | (5) | $ | 287,458 | |||||
| William Zollars |
$ | 110,000 | $ | 164,958 | (3) | $ | 12,500 | (5) | $ | 287,458 | ||||||
| * | Columns (d), (e) and (f) have been omitted from this table because they are not applicable. |
| (1) | The compensation structure for the Board is described in the narrative discussion that precedes this table. Mr. Moghadam is an employee of the company and does not receive additional compensation associated with his service on the Board. |
| (2) | Directors may elect to defer their compensation under the 2012 NQDC Plan. Under this plan, the cash compensation is converted into phantom shares that are held in a hypothetical fee deferral account under the terms of the 2012 NQDC Plan. As of December 31, 2017, the balance in the hypothetical fee deferral accounts under the 2012 NQDC Plan (which also includes deferrals prior to 2017) and the years in which the deferral was elected were as follows: |
| ¾ Mr. Fotiades (2013 to 2017): |
12,242 shares (including 357 DEUs earned in 2017) | |
| ¾ Mr. Losh (2012 to 2017): |
18,867 shares (including 507 DEUs earned in 2017) | |
| ¾ Mr. Webb: (2013 and 2017): |
11,695 shares (including 307 DEUs earned in 2017) |
Based on their individual elections, each of the directors’ phantom shares will be distributed to them upon termination of service on the Board. See the discussion above and also the narrative discussion that follows the Nonqualified Deferred Compensation in Fiscal Year 2017 table above under “Executive Compensation.”
| (3) | Represents the grant date fair value of 3,065 DSUs awarded to each of our non-employee directors who were elected at our annual meeting on May 3, 2017. The value of the DSUs is based on the closing price of our common stock on the date of grant which was $53.82 per share. The DSUs vest on the earlier of the date of the next annual meeting or the one-year anniversary of the grant date. These awards are expected to vest on May 2, 2018, the date of our 2018 annual meeting. Receipt of the vested DSUs is deferred until three years from the grant date. Messrs. Fotiades, Losh, Lyons and O’Connor have elected to further defer the receipt of the DSUs granted in 2017 until their service on the Board ends. While they are outstanding, DSUs earn DEUs, which are vested and paid to the director under the same terms as the underlying DSU award. |
We awarded DSUs under similar terms to our directors in 2014, which were distributed (3,541 shares) in May 2017 to all directors other than Messrs. Fotiades and Losh, each of whom had previously elected to defer receipt under our 2012 NQDC Plan, and Messrs. O’Connor and Piani who were not members of the Board in 2014. Awards granted in 2015 and 2016 are now fully vested and are scheduled to be distributed in April 2018 and May 2019, respectively, unless a specific deferral election has been made by the director.
Prior to the Merger, we granted restricted stock to our directors, and the Trust granted DSUs to members of its board. The restricted stock had a one-year vesting period and directors could elect to defer the awards after vesting under the AMB NQ Plans discussed above. The DSUs granted by the Trust were immediately vested, but were required to be deferred until after their service on the Trust’s board ended. The DSUs held by those trustees who joined our Board after the Merger were assumed by us under the Merger agreement, were converted based on the Merger exchange ratio, and continue to be deferred. These DSUs earn DEUs while they are outstanding.
|
|
115 | |||
|
DIRECTOR COMPENSATION
|
||
DSUs and associated accrued DEUs outstanding as of December 31, 2017 were as follows and are vested unless otherwise noted (including DSUs and accrued DEUs granted by the Trust prior to the Merger):
| ¾ Mr. Fotiades: |
41,236 shares (3,131 shares unvested) Receipt of all amounts deferred until service on the Board ends | |
| ¾ Ms. Garvey: |
3,795 shares to be distributed in May 2019 | |
| ¾ Ms. Kennard: |
10,931 shares (3,131 shares unvested) 3,131 shares to be distributed in May 2020; 3,795 shares to be distributed in May 2019; 4,005 shares to be distributed in April 2018 | |
| ¾ Mr. Losh: |
22,651 shares (3,131 shares unvested) Receipt of all shares deferred until service on the Board ends | |
| ¾ Mr. Lyons: |
22,968 shares (3,131 shares unvested) 3,473 shares were distributed in January 2018 per specific deferral election; receipt of remaining shares deferred until service on the Board ends | |
| ¾ Mr. O’Connor: |
10,931 shares (3,131 shares unvested) 4,005 shares to be distributed in April 2018; receipt of remaining shares deferred until service on the Board ends | |
| ¾ Mr. Piani: |
3,131 shares (3,131 shares unvested) 3,131 shares to be distributed in May 2020 | |
| ¾ Mr. Skelton: |
10,931 shares (3,131 shares unvested) 3,131 shares to be distributed in May 2020; 3,795 shares to be distributed in May 2019; 4,005 shares to be distributed in April 2018 | |
| ¾ Mr. Webb: |
10,931 (3,131 shares unvested) 3,131 shares to be distributed in May 2020; 3,795 shares to be distributed in May 2019; 4,005 shares to be distributed in April 2018 | |
| ¾ Mr. Zollars: |
10,931 (3,131 shares unvested) 3,131 shares to be distributed in May 2020; 3,795 shares to be distributed in May 2019; 4,005 shares to be distributed in April 2018 |
| (4) | In the past, stock options were granted to non-employee directors as part of their equity compensation (including stock options granted to those directors who previously served on the Trust’s board, which were assumed by us under the Merger agreement and converted based on the Merger exchange ratio). All stock options held by our current directors are fully vested and exercisable and were as follows as of December 31, 2017: |
| ¾ Ms. Kennard: |
21,142 options with exercise prices ranging from $17.71 to $26.58 and expiration dates ranging from May 7, 2019 to May 6, 2020. | |
| ¾ Mr. Losh: |
10,380 options with exercise prices ranging from $26.58 to $57.94 and expiration dates ranging from May 8, 2018 to May 6, 2020. | |
| ¾ Mr. Skelton: |
24,760 options with exercise prices ranging from $17.71 to $57.94 and expiration dates ranging from May 8, 2018 to May 6, 2020. |
| (5) | The Prologis Foundation will match the amount of charitable contributions to qualifying organizations made by our directors and all of our employees. Amounts reported represent charitable contributions of our charitable foundation that were paid directly to outside organizations to match qualifying contributions made by the director. The annual maximum amount of matching contributions in one year applicable to our directors is $12,500. Matching contributions in a particular year that are not used may be carried over to the subsequent year. |
|
|
116 | |||
|
SECURITY OWNERSHIP
|
||
The number of shares of our common stock beneficially owned, as of the date indicated in the footnotes below, by each person known to us to be the beneficial owner of five percent or more, in the aggregate, of our outstanding common stock as of the date indicated in the footnotes below is as follows:
| Name and Address(1)
|
Number of Shares Beneficially Owned
|
% of Outstanding Shares of Common Stock
| ||
| The Vanguard Group, Inc.(2) 100 Vanguard Blvd. Malvern, PA 19355 |
77,974,862 | 14.72% | ||
| BlackRock, Inc.(3) 55 East 52nd Street New York, NY 10022 |
53,388,532 | 10.00% | ||
| State Street Corporation(4) State Street Financial Center One Lincoln Street Boston, MA 02111 |
29,912,490 | 5.60% | ||
|
| ||||
| (1) | Entities included have filed a Schedule 13G representing that the shares of common stock they are reporting were acquired and are held in the ordinary course of business, were not acquired and are not held for the purpose of or with the effect of changing or influencing the control of Prologis and were not acquired and are not held in connection with or as a participant in any transaction having such purpose or effect. |
| (2) | Information regarding beneficial ownership of our common stock by The Vanguard Group, Inc. (“Vanguard”), Vanguard Fiduciary Trust Company (“VFTC”), a wholly owned subsidiary of Vanguard, and Vanguard Investments Australia, Ltd. (“VIA”), a wholly owned subsidiary of Vanguard, is included herein based on a Schedule 13G/A filed with the SEC on February 12, 2018, relating to such common shares beneficially owned as of December 31, 2017. Such report provides that Vanguard: (i) is the beneficial owner of all such common shares (577,961 and 1,695,980 of such common shares are beneficially owned as a result of its ownership of VFTC and VIA, respectively); (ii) has sole voting power with respect to 1,358,514 of such common shares; (iii) has shared voting power with respect to 769,313 of such common shares; (iv) has sole dispositive power with respect to 76,481,474 of such common shares; and (v) has shared dispositive power with respect to 1,493,388 of such common shares. The number of shares reported as beneficially owned by Vanguard in Vanguard’s Schedule 13G/A includes 35,808,913 common shares, representing 6.76% of our outstanding common stock, that Vanguard Specialized Funds—Vanguard REIT Index Fund (“Vanguard REIT Fund”) separately reported as beneficially owned in a Schedule 13G/A filed with the SEC on February 2, 2018. According to Vanguard REIT Fund’s Schedule 13G/A, Vanguard REIT Fund has sole voting power with respect to all such common shares and no dispositive power with respect to any such common shares. |
| (3) | Information regarding beneficial ownership of our common stock by entities related to BlackRock, Inc. is included herein based on a Schedule 13G/A filed with the SEC on January 9, 2018, relating to such common shares beneficially owned as of December 31, 2017. Such report provides that BlackRock Inc.: (i) is the beneficial owner of all such common shares and has sole dispositive power with respect to all such common shares and (ii) has sole voting power with respect to 48,038,267 of such common shares. |
| (4) | State Street Corporation reported that they are the beneficial owner according to Schedule 13G filed with the SEC on February 14, 2018. Information regarding the beneficial ownership of our common stock by entities related to State Street Corporation is included herein based on a third-party report that shows that State Street Corporation holds 29,912,490, comprising 5.6% of our outstanding shares of our common stock. |
|
|
117 | |||
|
SECURITY OWNERSHIP
|
||
The following table shows the number of shares of our common stock beneficially owned, as of March 6, 2018, by: (i) our CEO; (ii) our chief financial officer; (iii) our other NEOs currently employed by us; (iv) each of our directors; and (v) our directors and all our executive officers as a group.
| Shares Beneficially Owned
|
||||||||||||||||||||
|
Name(1)
|
Number of Shares of Common Stock as of March 6, 2018(2)
|
Number of Shares of Common Stock That May Be Acquired by May 5,
|
Total Beneficial Ownership
|
% of Outstanding Shares of Common Stock(8)
|
% of Outstanding Shares of Common Stock and Units(9)
|
|||||||||||||||
| NEOs: |
||||||||||||||||||||
| Hamid Moghadam(10) |
3,677,223 | 894,738 | 4,571,961 | 0.96% | 0.94% | |||||||||||||||
| Thomas Olinger(11) |
37,192 | 363,548 | 400,740 | * | * | |||||||||||||||
| Eugene Reilly(12) |
63,176 | 422,988 | 486,164 | * | * | |||||||||||||||
| Edward Nekritz |
148,071 | 395,212 | 543,283 | * | * | |||||||||||||||
| Gary Anderson |
1,738 | 272,723 | 274,461 | * | * | |||||||||||||||
| Michael Curless(13) |
29,033 | 292,628 | 321,661 | * | * | |||||||||||||||
| Directors: |
||||||||||||||||||||
| George Fotiades |
24,049 | — | 24,049 | * | * | |||||||||||||||
| Lydia Kennard |
28,288 | 25,147 | 53,435 | * | * | |||||||||||||||
| J. Michael Losh(14) |
25,339 | 10,380 | 35,719 | * | * | |||||||||||||||
| Irving Lyons III(15) |
126,487 | — | 126,487 | * | * | |||||||||||||||
| David O’Connor |
15,000 | 4,005 | 19,005 | * | * | |||||||||||||||
| Olivier Piani |
— | — | — | |||||||||||||||||
| Jeffrey Skelton |
40,055 | 28,765 | 68,820 | * | * | |||||||||||||||
| Carl Webb |
67,220 | 4,005 | 71,225 | * | * | |||||||||||||||
| William Zollars |
20,225 | 4,005 | 24,230 | * | * | |||||||||||||||
| All directors and executive officers as a group (15 total) |
4,303,096 | 2,718,144 | 7,021,240 | 1.32% | 1.28% | |||||||||||||||
|
|
||||||||||||||||||||
| * | Represents less than 0.1% of the outstanding shares of common stock and limited partnership units, as applicable. |
| (1) | The principal address of each person is: c/o Prologis, Inc., Pier 1, Bay 1, San Francisco, California 94111. |
| (2) | This column includes shares of our common stock beneficially owned as of the date indicated. Includes vested shares of our common stock owned through our 401(k) Plan and our nonqualified deferred compensation plans, as applicable. Unless indicated otherwise, all interests are owned directly and the indicated person has sole voting and dispositive power. For discussion of our nonqualified deferred compensation plans, see the narrative discussion that follows the Nonqualified Deferred Compensation in Fiscal Year 2017 table above under “Executive Compensation.” |
| (3) | This column includes shares of our common stock that may be acquired within 60 days of March 6, 2018 through (i) the exercise of vested, non-voting options to purchase our common stock, (ii) scheduled vesting or payment of restricted stock, restricted stock units, or DSUs and associated accrued DEUs and (iii) the exchange of limited partnership units beneficially owned directly or indirectly. Unvested and unearned awards granted under our employee stock plans that do not vest, or are not earned, by May 5, 2018 or vested awards that do not have a scheduled payment date by May 5, 2018, are not included. Vested LTIP Units earned under our employee stock plans that have not been held for the minimum holding period and cannot be converted to common partnership units by May 5, 2018, are not included. Unless indicated otherwise, all interests are owned directly and the indicated person will have sole voting and dispositive power upon receipt. |
|
|
118 | |||
|
SECURITY OWNERSHIP
|
||
| (4) | This column does not include shares of phantom stock held in hypothetical fee deferral accounts under the terms of our nonqualified deferred compensation plans, all of which are non-voting. Phantom share balances as of March 6, 2018 were as follows: |
| ¾ Mr. Fotiades:
|
12,242 shares | |
| ¾ Mr. Losh:
|
18,867 shares | |
| ¾ Mr. Webb:
|
11,695 shares |
Generally, the director has deferred receipt of the underlying common stock until his service on the Board ends. See “Director Compensation—Director Compensation for Fiscal Year 2017.”
| (5) | This column does not include shares of phantom stock held in hypothetical fee deferral accounts by directors who were formerly members of the Trust’s board, all of which are non-voting. Balances as of March 6, 2018 were as follows: |
| ¾ Mr. Fotiades: |
23,187 shares | |
| ¾ Mr. Lyons: |
247 shares | |
| ¾ Mr. Zollars: |
1,506 shares |
Mr. Lyons’ phantom stock is currently being distributed ratably over a five-year period that began in January 2015 and will end in January 2019. Mr. Zollars’ phantom stock is currently being distributed ratably over a 10-year period that began in January 2011 and will end in January 2020. Mr. Fotiades’ phantom stock will be distributed to him in January of the year following his termination from the Board. See “Director Compensation—Director Compensation for Fiscal Year 2017.”
| (6) | This column does not include vested DSUs and associated accrued DEUs, all of which are non-voting, which were earned by directors who were formerly members of the Trust’s board. Balances as of March 6, 2018 were as follows: |
| ¾ Mr. Fotiades: |
18,585 shares | |
| ¾ Mr. Lyons: |
8,565 shares |
Generally, these awards are payable to the director when his or her service on the Board ends. See “Director Compensation—Director Compensation for Fiscal Year 2017.”
| (7) | This column does not include vested DSUs and associated accrued DEUs, all of which are non-voting, receipt of which has been deferred to a date later than May 5, 2018, pursuant to a specific deferral election. See “Director Compensation—Director Compensation for Fiscal Year 2017.” Balances as of March 6, 2018 were as follows: |
| ¾ Mr. Fotiades: |
22,651 shares | |
| ¾ Ms. Garvey: |
3,795 shares | |
| ¾ Ms. Kennard: |
10,931 shares | |
| ¾ Mr. Losh: |
22,651 shares | |
| ¾ Mr. Lyons: |
10,931 shares | |
| ¾ Mr. O’Connor: |
10,931 shares | |
| ¾ Mr. Piani: |
3,131 shares | |
| ¾ Mr. Skelton: |
10,931 shares | |
| ¾ Mr. Webb: |
10,931 shares | |
| ¾ Mr. Zollars: |
10,931 shares |
| (8) | The percentage of shares of common stock beneficially owned by a person assumes that all the limited partnership units held by the person that can be exchanged as of May 5, 2018 are exchanged for shares of our common stock, that none of the limited partnership units held by any other persons are so exchanged, that all options for the purchase of shares of our common stock exercisable by May 5, 2018 held by the person are exercised in full, and that no options for the purchase of shares of our common stock held by any other persons are exercised. The percentage of shares of common stock beneficially owned by all directors and executive officers as a group assumes that all the limited partnership units held by the group that can be exchanged as of May 5, 2018 are exchanged for shares of our common stock, that none of the limited partnership units held by any person outside of the group are so exchanged, that all options for the purchase of shares of our common stock exercisable by May 5, 2018, held by the group are exercised in full, and that no options for the purchase of shares of our common stock held by any other persons outside of the group are exercised. |
| (9) | The percentage of shares of common stock and units beneficially owned by a person assumes that all of the limited partnership units held by the person that can be exchanged as of May 5, 2018 are exchanged for shares of our common stock, that all of the limited partnership units held by other persons that can be exchanged as of May 5, 2018 are so exchanged, that all options for the purchase of shares of our common stock exercisable by May 5, 2018 held by the person are exercised in full, and that no options for the purchase of shares of our common stock held by other persons are exercised. The percentage of shares of common stock and units beneficially owned by all directors and executive officers as a group assumes that all of the limited partnership units held by the group that can be exchanged as of |
|
|
119 | |||
|
SECURITY OWNERSHIP
|
||
| May 5, 2018 are exchanged for shares of our common stock, that all of the limited partnership units held by other persons outside of the group that can be exchanged as of May 5, 2018 are so exchanged, that all options for the purchase of shares of our common stock exercisable by May 5, 2018, held by the group are exercised in full, and that no options for the purchase of shares of our common stock held by other persons outside of the group are exercised. |
| (10) | Includes 131,775 shares that are indirectly held through a trust of which Mr. Moghadam is the trustee, 982,414 shares are held through a rabbi trust pursuant to the AMB NQ Plans and the 2012 NQDC Plan, for which the trustee holds all voting power, 803,945 shares are indirectly held through the Notional Account NQDC Plan for which Mr. Moghadam has voting power. In addition, Mr. Moghadam shares voting and dispositive power with his spouse with respect to 1,759,089 of such shares. |
| (11) | Includes 8,022 shares directly owned and 29,170 shares held through a rabbi trust pursuant to the AMB NQ Plans and the 2012 NQDC Plan, for which the trustee holds all voting power. |
| (12) | Includes 60,365 shares directly owned and 2,811 shares held through a trust for which Mr. Reilly’s spouse is the trustee. |
| (13) | Includes 102 shares directly owned, 14,466 shares held in a trust for which Mr. Curless is the trustee and beneficiary, and 14,465 shares held through a trust for which Mr. Curless’ spouse is the trustee and beneficiary. |
| (14) | Includes 21,339 shares directly owned and 4,000 shares indirectly owned through accounts of Mr. Losh’s children. |
| (15) | Includes 32,955 shares that are directly owned, 92,532 shares that are held through a family trust of which Mr. Lyons and his spouse are trustees and 1,000 shares held in trust for the benefit of Mr. Lyons’ daughter for which Mr. Lyons is the trustee. |
|
|
120 | |||
|
EQUITY COMPENSATION PLANS
|
||
We currently grant equity awards only under the 2012 LTIP. However, we do have awards outstanding that were granted under the AMB Plans and the Trust Plans. All future equity awards will be granted from the 2012 LTIP. The available shares of common stock reserved for issuance under the AMB Plans and the Trust Plans as of May 3, 2012, the date our stockholders approved the 2012 LTIP, were added to the share reserve of the 2012 LTIP. All outstanding awards under the AMB Plans and the Trust Plans will remain outstanding until they vest, expire, or are forfeited by the participant. The 2012 LTIP does not expire but no further awards can be granted under the plan after the tenth anniversary date of the plan approval (May 3, 2022). Information about our equity compensation plans as of December 31, 2017 is as follows:
| Plan Category (a) |
# of Securities to be Issued Upon Exercise of Outstanding Options, Warrants and Rights (b) |
Weighted-Average Exercise Price of Outstanding Options, Warrants and Rights (c) |
# of Securities Remaining Available for Future Issuance Under Equity Compensation Plans (Excluding Securities Reflected in Column (b)) (d) | ||||||||||||
| Equity compensation plans approved by security holders(1)(2) |
8,843,610 | $ | 24.68 | 8,316,285 | |||||||||||
| Equity compensation plans not approved by security holders
|
— | — | — | ||||||||||||
| (1) | The amount in column (b) includes 652,265 shares of common stock that can be issued upon the exercise of outstanding stock options (all of which are vested), 1,538,461 outstanding RSUs, DSUs, DEUs and phantom shares (of which 164,844 are vested), and 6,652,884 LTIP Units (of which 1,531,936 are vested). |
| (2) | The weighted average exercise price in column (c) relates to 652,265 outstanding stock options reflected in column (b), which have a weighted average term to expiration of 2.0 years. Of the amount in column (b), 8,191,345 will be issued for no consideration. |
|
|
121 | |||
|
AUDIT MATTERS
|
||
The purpose of the Audit Committee is to be an informed, vigilant and effective overseer of our financial accounting and reporting processes consistent with risk mitigation appropriate in the circumstances. The committee is directly responsible for the appointment, compensation and oversight of our independent registered public accounting firm. The committee is comprised of the three directors named below. Each member of the committee is independent as defined by SEC and NYSE rules. In addition, the Board has determined that each member of the Audit Committee is an audit committee financial expert and is financially literate in accordance with applicable NYSE and SEC rules. Management is responsible for the company’s internal controls and the financial reporting process. The company’s independent registered public accounting firm is responsible for performing an independent audit of the company’s consolidated financial statements and the effectiveness of the company’s internal controls over financial reporting in accordance with the standards of the Public Company Accounting Oversight Board (United States) (“PCAOB”), and issuing reports thereon. The Audit Committee is responsible for overseeing the conduct of these activities. The committee’s function is more fully described in its charter which has been approved by the Board. The charter can be viewed, together with any future changes, on our website at http://ir.prologis.com/governance.cfm.
We have reviewed and discussed the company’s audited financial statements for the fiscal year ended December 31, 2017 and unaudited financial statements for the quarterly periods ended March 31, June 30 and September 30, 2017 with management and KPMG LLP, the company’s independent registered public accounting firm. We also reviewed and discussed management’s assessment of the effectiveness of the company’s internal controls over financial reporting. The committee has discussed with KPMG LLP the matters that are required to be discussed by Auditing Standard No. 1301, Communication With Audit Committees, issued by the PCAOB. KPMG LLP has provided to the company the written disclosures and the letter required by applicable PCAOB requirements regarding their communications with the Audit Committee concerning independence, and the Audit Committee has discussed with KPMG LLP its independence. The committee also concluded that KPMG LLP’s performance of non-audit services to us and our affiliates, as pre-approved by the committee and described in the next section, does not impair KPMG LLP’s independence.
Based on the considerations referred to above, the Audit Committee recommended to the Board that the audited financial statements be included in our Annual Report on Form 10-K for 2017. The foregoing report is provided by the following independent directors, who constitute the committee.
Audit Committee:
J. Michael Losh (Chair)
Olivier Piani
Carl B. Webb
|
|
123 | |||
|
AUDIT MATTERS
|
||
Independent Registered Public Accounting Firm
The Audit Committee engaged KPMG LLP as our independent registered public accounting firm for the fiscal years ended December 31, 2017 and 2016. KPMG LLP was also retained to provide certain audit-related and tax services in 2017 and 2016.
In the course of the provision of services on our behalf, we recognize the importance of our independent registered public accounting firm’s ability to maintain objectivity and independence in its audit of our financial statements and the importance of minimizing any relationships that could appear to impair that objectivity. To that end, the Audit Committee has adopted policies and procedures governing the pre-approval of audit and non-audit work performed by our independent registered public accounting firm. The independent registered public accounting firm is authorized to perform specified pre-approved services up to certain annual amounts and up to specified amounts for specific services. Such limits vary by the type of service provided. Individual engagements anticipated to exceed pre-established thresholds must be separately approved. All of the fees reflected below for 2017 and 2016 were either specifically pre-approved by the Audit Committee or pre-approved pursuant to the Audit Committee’s Audit and Non-Audit Services Pre-Approval Policy. These policies and procedures also detail certain services which the independent registered public accounting firm is prohibited from providing to us.
The following table represents fees for professional audit services rendered for the audit of our consolidated financial statements for the years ended December 31, 2017 and 2016 and fees billed for other services rendered in each year.
| Types of Fees | 2017 | 2016 | ||||||
| Audit fees(1) |
$ | 4,365,612 | $ | 4,378,265 | ||||
| Audit-related fees(2) |
7,500 | — | ||||||
| Tax fees(3) |
383,669 | 324,883 | ||||||
| All other fees(4) |
— | — | ||||||
| Totals |
$ | 4,756,781 | $ | 4,703,148 | ||||
| (1) | Audit fees consists of fees for professional services for the audit of our consolidated financial statements included in our Annual Report on Form 10-K and the review of our consolidated financial statements included in our Quarterly Reports on Form 10-Q, including all services required to comply with the standards of the PCAOB, and fees associated with performing the integrated audit of internal controls over financial reporting (Sarbanes-Oxley Section 404 work). Additionally, amounts include fees for services associated with comfort letters, statutory audits and reviews of documents filed with the SEC. |
| (2) | Audit-related fees consist of fees for assurance and related services associated with the issuance of an attestation report. |
| (3) | Tax fees are primarily fees for tax compliance, tax return preparation and pre-approved tax consultations. |
| (4) | No other fees were billed for 2017 or 2016. |
|
|
124 | |||
|
AUDIT MATTERS
|
||
Ratification of the Appointment of the Independent
Registered Public Accounting Firm (Proposal 3)
The Audit Committee is directly responsible for the appointment, compensation, retention and oversight of our independent registered public accounting firm retained to audit our financial statements. The Audit Committee has appointed KPMG LLP as our independent registered public accounting firm for the year 2018. KPMG LLP has been our external auditors since 2002. The Audit Committee is responsible for the audit fee negotiations associated with the company’s retention of KPMG LLP. In order to ensure continuing auditor independence, the Audit Committee periodically considers whether there should be a regular rotation of the independent registered public accounting firm. In conjunction with the mandated rotation of KPMG LLP’s lead engagement partner, the Audit Committee and its chairperson are directly involved in the selection of KPMG LLP’s new lead engagement partner. The Audit Committee and the Board believe that the continued retention of KPMG LLP to serve as our independent registered public accounting firm is in the best interest of the company and our stockholders.
We are asking our stockholders to ratify the selection of KPMG LLP as our independent registered public accounting firm for the year 2018. In the event our stockholders do not approve the appointment, the appointment will be reconsidered by the Audit Committee.
KPMG LLP representatives are expected to attend the 2018 annual meeting. They will have an opportunity to make a statement if they desire to do so and will be available to respond to appropriate stockholder questions.
You may vote for, vote against, or abstain from voting on ratifying the appointment of KPMG LLP as our independent registered public accounting firm for the year 2018. Assuming a quorum is present, to be approved by the stockholders, the proposal must receive the affirmative vote of a majority of the shares of common stock having voting power present in person or by proxy at the annual meeting. Abstentions and broker non-votes are considered voting power present in person or by proxy and thus will have the same effect as votes cast “Against” the proposal.
The Board unanimously recommends that the stockholders vote FOR the ratification of the appointment of KPMG LLP as our independent registered public accounting firm for the year 2018.
|
|
125 | |||
|
ADDITIONAL INFORMATION
|
||
Notice of 2018 Annual Meeting of Stockholders
March 22, 2018
To our Stockholders:
I invite you to attend the 2018 annual meeting of stockholders of Prologis, Inc. at 1:30 p.m. on May 2, 2018 at Pier 1, Bay 1, San Francisco, California 94111.
Items of business. The following items of business will be conducted at our 2018 annual meeting of stockholders:
| 1. | To elect eleven directors to our Board to serve until the next annual meeting of stockholders and until their successors are duly elected and qualified. |
| 2. | Advisory vote to approve the company’s executive compensation for 2017. |
| 3. | To ratify the appointment of KPMG LLP as our independent registered public accounting firm for the year 2018. |
| 4. | To consider any other matters that may properly come before the meeting and at any adjournments or postponements of the meeting. |
| Record Date. If you were a holder of shares of our common stock at the close of business on March 6, 2018, you are entitled to receive this notice and to vote at the annual meeting and any adjournment(s) or postponement(s) of the annual meeting. | How to Vote. You can vote your shares by proxy through the Internet, by telephone or by mail using the instructions on the proxy card. Any proxy may be revoked in the manner described in the accompanying proxy statement at any time prior to its exercise at the annual meeting. | Meeting Attendance. If you plan to attend the meeting in person, you must bring proof of current ownership of our common stock to be admitted to and to attend the 2018 annual meeting. |
|
|
127 | |||
|
ADDITIONAL INFORMATION
|
||
Proxy Materials. On or about March 23, 2018, we intend to distribute to our stockholders:
| (i) | Either in printed form by mail or electronically by e-mail, a Notice of Annual Meeting and Internet Availability of Proxy Materials containing instructions on: (a) how to electronically access our 2018 Proxy Statement and 2017 Annual Report to Stockholders, which includes our 2017 Annual Report on Form 10-K; (b) how to vote; and (c) how to request printed proxy materials (if desired). |
| (ii) | If requested or required, printed proxy materials, which will include our 2018 Proxy Statement, our 2017 Annual Report on Form 10-K and a proxy card. |
Proxy Materials and Voting Information
Proxy materials
We are required under SEC regulations to provide you with a proxy statement when we ask you to sign a proxy designating individuals to vote on your behalf. A proxy is a legal designation of another person to vote the stock you own, which person is also referred to as your “proxy.” This designation may be done in a written document that is called a “proxy” or “proxy card.”
The proxy materials consist of our 2018 Proxy Statement and our 2017 Annual Report to Stockholders, which includes our 2017 Annual Report on Form 10-K.
Your vote is very important. For this reason, our Board is requesting that you permit your common stock to be represented and voted at the annual meeting by the proxies named on the proxy card.
Notice of Internet Availability
We have implemented the Notice and Access Rule enacted by the SEC for distribution of materials for our annual meeting. Accordingly, we are sending a Notice of Internet Availability to many of our stockholders of record and our beneficial owners. All stockholders will be able to access the proxy materials. We believe that the electronic availability of materials is an appropriate proxy communication solution that will allow us to provide our stockholders with the materials they need, while lowering the cost of delivery and reducing the environmental impact of our annual meetings. Stockholders may request to receive printed copies of the proxy materials.
|
|
128 | |||
|
ADDITIONAL INFORMATION
|
||
Distribution of proxy materials
On or about March 23, 2018, the Notice of Annual Meeting and Internet Availability of Proxy Materials (“Notice of Internet Availability”) will be distributed to many of our stockholders, either in printed form by mail or electronically by email, in lieu of mailing the printed proxy materials. The Notice of Internet Availability instructs stockholders as to how they may: (i) access and review all of the proxy materials through the Internet; (ii) submit their proxy; and (iii) receive printed proxy materials. Also on or about March 23, 2018, printed proxy materials, including our 2018 Proxy Statement and our Annual Report on Form 10-K for 2017, will be mailed to all other stockholders, as requested or required. On the mailing date, all stockholders and beneficial owners will have the ability to access all of the proxy materials on the Internet at www.proxyvote.com or http://ir.prologis.com/annuals.cfm.
Stockholders may request to receive proxy materials electronically by e-mail on an ongoing basis by selecting the link “Consent for Electronic Delivery” at http://ir.prologis.com/annual-reports. You can also sign up for electronic delivery of proxy materials by following the instructions on the proxy card and Notice of Internet Availability with respect to how to vote using the Internet and, when prompted, indicate that you agree to receive or access proxy materials electronically in future years. If you register to receive future proxy materials electronically by e-mail, you will receive an e-mail next year with instructions on how to access those proxy materials and how to vote. If you change your e-mail address, you will need to update your registration. Your election on how to receive proxy materials will remain in effect until you terminate it.
Stockholders will receive printed copies of the proxy materials if they have elected this form of delivery or they are participants in our 401(k) Plan. Printed copies of the proxy materials will be provided upon request at no charge by submitting a written notice to Investor Relations, Prologis, Inc., Pier 1, Bay 1, San Francisco, California 94111.
Voting in person at the annual meeting
If your shares are registered directly in your name with our transfer agent, Computershare Trust Company, N.A., you are considered the stockholder of record with respect to those shares and a Notice of Internet Availability or printed proxy materials and a proxy card are being sent directly to you. As the stockholder of record, you have the right to vote in person at the annual meeting. If you choose to vote in person at the annual meeting, you can bring the proxy card mailed to you if you received printed proxy materials, or you can vote using a ballot that will be provided to you at the annual meeting. Even if you plan to attend the annual meeting, we recommend that you authorize your proxy to vote your shares in advance so that your vote will be counted should you later decide not to attend the annual meeting.
Most of our stockholders hold their shares in street name through a broker, bank, trustee, or other nominee rather than directly in their own name. In this case, you are considered the beneficial owner of shares held in street name, and a Notice of Internet Availability or printed proxy materials are being forwarded to you together with a voting instruction card. As the beneficial owner, you are also invited to attend the annual meeting. However, because a beneficial owner is not the stockholder of record, you may not vote these shares in person at the annual meeting unless you obtain a “legal proxy” from the broker, bank, trustee, or nominee that holds your shares, which will give you the right to vote the shares at the annual meeting. You will need to contact your broker, bank, trustee, or nominee to obtain a legal proxy. You will need to bring that legal proxy to the annual meeting in order to vote in person.
Voting without attending the annual meeting
Whether you hold shares directly as a stockholder of record or beneficially in street name, you may direct your vote without attending the annual meeting. You may vote by granting a proxy or, for shares held in street name, by submitting voting instructions to your broker, bank, trustee, or nominee. In most cases, you will be able to do this by telephone, through the Internet, or by mail. If you are a stockholder of record, please refer to the summary instructions on the proxy card included with your proxy materials or the instructions on how to vote contained in the Notice of
|
|
129 | |||
|
ADDITIONAL INFORMATION
|
||
Internet Availability. If you hold your shares in street name, the voting instructions will be communicated to you by your broker, bank, trustee, or nominee. The Notice of Internet Availability also provides instructions on how you can request a printed copy of the proxy materials and proxy card, if you desire.
By Telephone or through the Internet—If you have telephone or Internet access, you may submit your proxy by following the instructions included with your proxy materials or, if you requested a printed copy of the proxy materials, on the proxy card. If you provide specific voting instructions, your shares will be voted as you have instructed.
By Mail—If you requested a printed copy of the proxy materials, you may submit your proxy by mail by signing the proxy card or, for shares held in street name, by following the voting instruction card included by your broker, bank, trustee, or nominee and mailing it in the postage-paid envelope that is included. If you provide specific voting instructions, your shares will be voted as you have instructed.
The telephone and Internet proxy voting facilities for stockholders of record will close at 11:59 p.m., Eastern time, on May 1, 2018, unless the meeting is postponed or adjourned, in which case such voting facilities may remain open or be reopened until the day before the postponed or adjourned meeting.
The availability of telephone and Internet voting for beneficial owners will depend on the voting processes of your broker, bank, trustee, or nominee. Therefore, we recommend that you follow the voting instructions in the materials you receive from your broker, bank, trustee, or nominee.
If you vote by telephone or through the Internet, you do not have to return a proxy card or voting instruction card.
The telephone and Internet proxy voting procedures are designed to authenticate stockholders by use of a control number and to allow stockholders to confirm that their instructions have been properly recorded. The method by which you vote will in no way limit your right to vote at the annual meeting if you later decide to attend the annual meeting in person.
Changing your vote
You may revoke your proxy at any time and change your vote at any time before the final vote at the annual meeting. If you are a stockholder of record, you may do this by signing and submitting a written notice to Edward S. Nekritz, Secretary, Prologis, Inc., Pier 1, Bay 1, San Francisco, California 94111, by submitting a new proxy card with a later date, by voting again by telephone or through the Internet (your latest telephone or Internet proxy is counted), or by attending the annual meeting in person and voting by ballot at the annual meeting. If you hold your shares beneficially in street name, you will need to contact your broker, bank, trustee, or nominee to determine the process for revoking a voting instruction. Merely attending the annual meeting will not revoke a proxy unless you specifically request your proxy to be revoked.
All shares that have been properly voted (for which proxies have not been revoked) will be voted at the annual meeting.
Specific voting instructions not given
If you hold your shares directly in your name, and you sign and return a proxy card without giving specific voting instructions, the shares of common stock represented by that proxy will be voted as recommended by the Board. If you hold your shares in street name through a broker, bank, trustee, or nominee and you do not provide specific voting instructions, your broker, bank, trustee, or nominee will have discretion to vote such shares but only with respect to routine matters (Proposal 3).
If no voting instructions are received from you, and you hold your shares in street name, your broker, bank, trustee or nominee will not turn in a proxy card for your shares on the non-routine matters proposed at our annual meeting. Non-routine matters are the election of directors (Proposal 1) and the advisory vote to approve the company’s executive compensation for 2017 (Proposal 2).
|
|
130 | |||
|
ADDITIONAL INFORMATION
|
||
If you hold shares in your 401(k) Plan account and do not provide the trustee of the 401(k) Plan with specific voting instructions, the trustee will vote all uninstructed shares held in our 401(k) Plan in the same proportion as how instructed shares held in the 401(k) Plan are voted.
Proxy solicitation
We pay the cost of soliciting proxies. Proxies may be solicited on our behalf by our directors, officers, or employees, in person or by telephone, facsimile, or other electronic means. These people will not be specially compensated for their solicitation of proxies.
In accordance with the rules and regulations of the SEC and NYSE, we will also reimburse brokerage firms and other custodians, nominees and fiduciaries for their expenses incurred in sending proxies and proxy materials to the beneficial owners of shares of our common stock.
NO PERSON IS AUTHORIZED TO GIVE ANY INFORMATION OR TO MAKE ANY REPRESENTATIONS OTHER THAN THOSE CONTAINED IN THIS PROXY STATEMENT AND, IF GIVEN OR MADE, SUCH INFORMATION MUST NOT BE RELIED UPON AS HAVING BEEN AUTHORIZED. THE DELIVERY OF THIS PROXY STATEMENT SHALL, UNDER NO CIRCUMSTANCES, CREATE ANY IMPLICATION THAT THERE HAS BEEN NO CHANGE IN THE AFFAIRS OF PROLOGIS, INC. SINCE THE DATE OF THIS PROXY STATEMENT.
Admission to the annual meeting
Stockholders must bring proof of current ownership of our common stock to be admitted to and to attend the 2018 annual meeting.
Board’s voting recommendations
The Board recommends a vote:
| ¾ | “for” the election of each of the eleven nominees to the Board named in the proxy statement (Proposal 1); |
| ¾ | “for” the approval of the company’s executive compensation for 2017 (Proposal 2); and |
| ¾ | “for” the ratification of the appointment of KPMG LLP as our independent registered public accounting firm for the year 2018 (Proposal 3). |
Who can vote
Each issued and outstanding share of common stock is entitled to one vote on each matter properly brought before the annual meeting. Holders of record of Prologis common stock at the close of business on the record date, March 6, 2018, are entitled to notice of and to vote at the annual meeting. As of March 6, 2018, there were 533,068,686 shares of our common stock outstanding.
Quorum requirement
There is no right to cumulative voting. A quorum is met if a majority of the shares of common stock outstanding as of the record date are represented, in person or by proxy, at the annual meeting. Your shares are counted as present at the meeting if you are present and entitled to vote in person at the meeting, if you have properly submitted a proxy card, or if you authorize your proxy to vote your shares by telephone or through the Internet.
|
|
131 | |||
|
ADDITIONAL INFORMATION
|
||
If you are present at the annual meeting in person or by proxy, but you abstain from voting on any or all proposals, your shares are still counted as present and entitled to vote for purposes of determining a quorum.
Broker non-votes are also counted as present and entitled to vote for purposes of determining a quorum. A broker non-vote occurs when a nominee holding shares of our common stock for a beneficial owner is present at the meeting, in person or by proxy, and entitled to vote, but does not vote on a particular proposal because the nominee does not have discretionary voting power with respect to that item and has not received instructions on how to vote with respect to that item from the beneficial owner.
Majority voting
Our bylaws provide that the vote required for election of directors is a “majority vote of the votes cast” in uncontested elections of directors. Accordingly, directors are required to be elected by the majority of votes cast by the shares present in person or represented by proxy with respect to such director in uncontested elections. A majority of the votes cast means that the number of shares voted “For” a director nominee by the holders of shares of common stock entitled to vote on the election of directors and represented in person or by proxy at the annual meeting must exceed the number of such shares voted “Against” the director nominee. Abstentions and broker non-votes, if any, will have no effect on the outcome of the proposal.
In a contested election (where a determination is made that the number of director nominees is expected to exceed the number of directors to be elected at a meeting), the vote standard will be a plurality of the votes cast with respect to such director. In the event of a contested election where the plurality vote standard applies, stockholders shall be permitted to vote only “for” a director nominee or to designate their vote be “withheld” from such nominee.
If a nominee who is serving as a director is not elected by a majority vote at the annual meeting, then, under Maryland law, such director would continue to serve as a “holdover director.” Under our bylaws, any director who fails to be elected by a majority vote shall tender his or her resignation to the Board, subject to acceptance by the Board. The Governance Committee will make a recommendation to the Board on whether to accept or reject the resignation, or whether other action should be taken. The Board will then act on the Governance Committee’s recommendation and publicly disclose its decision and the rationale behind it within 90 days from the date of the certification of election results. If the resignation is not accepted, the director will continue to serve until the next annual meeting and until the director’s successor is duly elected and qualified. The director who tenders his or her resignation will not participate in the Board’s decision. Non-incumbent directors who are not elected at the annual meeting would not become directors and would not serve on the Board as a “holdover director.”
Proxy access
In 2016, we adopted proxy access with a “3/3/20/20” market standard. The amendment and restatement of our bylaws provides that, subject to certain requirements, a stockholder, or a group of up to 20 stockholders, owning three percent or more of our outstanding common stock continuously for at least three years, can require us to include in our annual meeting proxy materials director nominations for up to 20% of the number of directors, or two directors, whichever is greater. Proxy access rights are subject to additional eligibility, procedural and disclosure requirements set forth in our bylaws.
Stockholder recommended nominees for director
The Governance Committee will evaluate nominees for director recommended by stockholders against the same criteria that it uses to evaluate other director nominees, as described under ‘Board of Directors and Corporate Governance—Director Qualifications, Skills and Experience.’ The committee will consider nominees to the Board
|
|
132 | |||
|
ADDITIONAL INFORMATION
|
||
recommended by stockholders with respect to elections to be held at an annual meeting if notice of the nomination is timely delivered in writing to our secretary prior to the meeting. See “Submitting Stockholder Proposals” for notice requirements prescribed by our Bylaws.
Additional matters present at the annual meeting
We do not anticipate any other business to be brought before the 2018 annual meeting of stockholders. In addition to the scheduled items, however, the meeting may consider properly presented stockholder proposals and matters relating to the conduct of the meeting. As to any other business, the proxies, in their discretion, are authorized to vote on other matters that may properly come before the meeting and any adjournments or postponements of the meeting.
Submitting Stockholder Proposals
There are no stockholder proposals for consideration at the 2018 annual meeting. You may submit proposals, including director nominations, for consideration at our next annual meeting expected to be held in 2018 as follows:
Deadline for submitting stockholder proposals for inclusion in our 2019 proxy statement. Rule 14a-8 of the Securities Exchange Act of 1934 (the “Exchange Act”) provides that certain stockholder proposals must be included in the proxy statement for our annual meeting. For a stockholder proposal to be considered for inclusion in the 2018 proxy statement for our 2019 annual meeting, it must be received at our principal executive offices (Pier 1, Bay 1, San Francisco, California 94111) no later than November 22, 2018. The proposal must comply with the SEC regulations under Rule 14a-8 of the Exchange Act regarding the inclusion of stockholder proposals in our proxy materials. Proposals and nominations should be addressed to Edward S. Nekritz, Secretary, Prologis, Inc., Pier 1, Bay 1, San Francisco, California 94111.
If, however, the date of the 2019 annual meeting is advanced or delayed by more than 30 days from May 2, 2019, we must receive notice a reasonable time before we begin to print and distribute our proxy materials.
Deadline for submitting stockholder proposals or director nominations not to be included in our 2018 Proxy Statement. If you intend to present a proposal or nomination for director at our 2019 annual meeting, but you do not intend to have it included in our 2018 proxy statement, the notice of proposal or nomination must be delivered to, or mailed and received by, us at our principal executive offices (Pier 1, Bay 1, San Francisco, California 94111) between January 2, 2019 and February 1, 2019.
If, however, the date of the 2019 annual meeting is advanced or delayed by more than 30 days from May 2, 2019, we must receive the notice of proposal or nomination not more than 120 days prior to the date of the 2019 annual meeting and not less than 90 days prior to the date of the 2019 annual meeting.
If less than 100 days’ notice or prior public disclosure of the date of the 2019 annual meeting (which was advanced or delayed by more than 30 days from May 2, 2019) is given or made to stockholders, the deadline to receive the notice of proposal or nomination is the close of business on the 10th day following the day on which notice of the 2019 annual meeting date was mailed or publicly disclosed. Proposals and nominations should be addressed to Edward S. Nekritz, Secretary, Prologis, Inc., Pier 1, Bay 1, San Francisco, California 94111.
Deadline for submitting proxy access director nominations to be included in our 2019 proxy statement. If you intend to present a nomination for director at our 2019 annual meeting pursuant to the proxy access provisions in our bylaws, the notice of proxy access nomination must be delivered to, or mailed and received by, us at our principal executive offices (Pier 1, Bay 1, San Francisco, California 94111) between January 2, 2019 and February 1, 2019.
|
|
133 | |||
|
ADDITIONAL INFORMATION
|
||
If, however, the date of the 2019 annual meeting is advanced or delayed by more than 30 days from May 2, 2019, we must receive the notice of nomination not more than 120 days prior to the date of the 2019 annual meeting and not less than 90 days prior to the date of the 2019 annual meeting.
If less than 100 days’ notice or prior public disclosure of the date of the 2019 annual meeting (which was advanced or delayed by more than 30 days from May 2, 2019) is given or made to stockholders, the deadline to receive the notice of nomination is the close of business on the 10th day following the day on which notice of the 2019 annual meeting date was given or publicly disclosed. Proposals and nominations should be addressed to Edward S. Nekritz, Secretary, Prologis, Inc., Pier 1, Bay 1, San Francisco, California 94111.
Stockholder notice. As set forth in our bylaws, for stockholder proposals other than director nominations, such stockholder’s notice must contain, among other things, with respect to each proposed matter:
| ¾ | a brief description of the business and the reasons for conducting such business at the annual meeting; |
| ¾ | the name of the stockholder and any “stockholder associated person” (as defined in our bylaws); |
| ¾ | the record address or current address, if different, of the stockholder and any stockholder associated person; |
| ¾ | the class, series and number of shares the stockholder and any stockholder associated person beneficially holds (including the number of shares held beneficially but not of record and the name of any nominee holder of such shares); |
| ¾ | any material interest the stockholder or any stockholder associated person has in such business; |
| ¾ | whether and the extent to which hedging or other transaction(s) have been entered into by the stockholder or on the stockholder’s behalf, or by a stockholder associated person or on that person’s behalf (including any agreement, arrangement, or understanding made with the effect or intent to mitigate loss, manage risk of stock price changes, or to increase the voting power of such stockholder or stockholder associated person) and a general description of such activity; and |
| ¾ | to the extent known by the stockholder giving notice, the name and address of any other stockholder supporting a proposal of other business. |
Please review our bylaws for more information regarding requirements to submit a stockholder proposal outside of Rule 14a-8.
As set forth in our bylaws, for director nominations, a stockholder’s notice must contain, among other things, with respect to each proposed nominee:
| ¾ | the name, age, business address and residence address of the proposed nominee; |
| ¾ | the principal occupation or employment of the proposed nominee; |
| ¾ | the class, series, and number of shares beneficially held by the proposed nominee, the date such shares were acquired, and the investment intent of such acquisition; |
| ¾ | any other information relating to the proposed nominee that is required to be disclosed under Regulation 14A of the Exchange Act; |
| ¾ | the proposed nominee’s written consent to serve as a director if elected and, with respect to proxy access nominations, to be named in our proxy materials; |
| ¾ | a statement whether such person, if elected or re-elected, or as a condition thereto, will tender an irrevocable resignation effective upon failure to receive the required vote for re-election at the next meeting at which such person would face re-election and upon acceptance of such resignation by the Board; and |
| ¾ | with respect to the stockholder giving the notice: (i) the name of the stockholder, the record address (or current address, if different) of the stockholder, and the class, series and number of shares the stockholder beneficially |
|
|
134 | |||
|
ADDITIONAL INFORMATION
|
||
| holds (including the number of shares held beneficially but not of record and the name of any nominee holder of such shares); (ii) whether and the extent to which hedging or other transaction(s) have been entered into by the stockholder or on the stockholder’s behalf (including any agreement, arrangement, or understanding made with the effect or intent to mitigate loss, manage risk of stock price changes, or to increase the voting power of such stockholder) and a general description of such activity; and (iii) to the extent known by the stockholder giving notice, the name and address of any other stockholder giving notice, the name and address of any other stockholder supporting the nominee for election or re-election as a director, as well as similar information regarding any stockholder associated person. |
We may require a proposed nominee to furnish other information to determine the eligibility of such proposed nominee to serve as one of our directors. Please review our bylaws for more information regarding proxy access eligibility, procedural and disclosure requirements and other relevant requirements to nominate directors.
|
|
135 | |||
|
ADDITIONAL INFORMATION
|
||
Section 16(a) Beneficial Ownership Reporting Compliance
Section 16(a) of the Exchange Act, as amended, requires our directors, certain officers and certain beneficial owners of our common stock to file reports of holdings and transactions in our common stock with the SEC and the NYSE. Except as provided below, based on our records and other information available to us, we believe that, in 2017, all of the above persons and entities met all applicable SEC filing requirements. In 2017, Ms. Kennard inadvertently failed to file a report on a timely basis due to administrative error.
Annual Report to Stockholders and Corporate Governance Documents
We will provide copies of our annual report to requesting stockholders, free of charge, by contacting Investor Relations, Prologis, Inc., Pier 1, Bay 1, San Francisco, California 94111, telephone (415) 394-9000. Our Code of Ethics and Business Conduct, Governance Guidelines and our Audit, Compensation and Governance Committee charters can be viewed, on our website at http://ir.prologis.com/governance.cfm. In addition, copies of our Code of Ethics and Business Conduct, Governance Guidelines, our Audit, Compensation and Governance Committee charters and our bylaws can be obtained by any stockholder, free of charge, upon written request to Edward S. Nekritz, Secretary, Prologis, Inc., Pier 1, Bay 1, San Francisco, California 94111.
March 22, 2018
San Francisco, California
|
|
136 | |||
|
APPENDIX A: DEFINITIONS AND RECONCILIATIONS OF GAAP AND NON-GAAP FINANCIAL MEASURES
|
||
Please refer to our annual and quarterly financial statements filed with the Securities and Exchange Commission on Forms 10-K and 10-Q and other public reports for further information about us and our business.
Annualized FFO Growth Rate is average year-on-year growth rate of Core FFO per share, over a period of time, reflecting the rate on an annual basis.
Annualized TSR is calculated based on the stock price appreciation and dividends paid to show a total return to a stockholder over a period of time. This calculation assumes dividends are reinvested into the stock on the day the dividend is paid. We annualize TSR by converting the total return of the stock at the end of a prescribed time period to an annualized basis.
Asset Management Fees represents the third-party share of asset management and transactional fees from both consolidated and unconsolidated co-investment ventures.
Assets Under Management (“AUM”) represents the estimated fair value of the real estate we own or manage through both our consolidated and unconsolidated entities. We calculated AUM be adding the third-party investors’ share of the estimated fair value of the assets in the co-investment ventures to our share of total market capitalizations (calculated as market equity plus our share of total debt). For purposes of calculating G&A as a percentage of AUM, or G&A/AUM, we use the estimated book value of our owned and managed real estate assets to determine AUM. To calculate the estimated book value, we add the gross book value of operating properties, land, and other real estate assets and the total expected investment of our development portfolio. The calculations of G&A as a percentage of AUM for December 31, 2017, 2016, 2015, 2014, and 2013 are provided in our earnings supplemental information for the fourth quarter of each respective year (furnished on Forms 8-K on January 23, 2018, January 24, 2017, January 26, 2016, January 27, 2015, and January 30, 2014, respectively).
Calculation of Per Share Amounts (in thousands, except per share amounts):
| 2017 | 2016 | 2015 | 2014 | 2013 | ||||||||||||||||
| Net earnings |
||||||||||||||||||||
| Net earnings |
$ | 1,641,931 | $ | 1,203,218 | $ | 862,788 | $ | 622,235 | $ | 315,422 | ||||||||||
| Noncontrolling interest attributable to exchangeable limited partnership units |
46,280 | 37,079 | 13,120 | 3,636 | 1,305 | |||||||||||||||
| Gains, net of expenses, associated with exchangeable debt assumed exchanged |
— | — | (1,614 | ) | — | — | ||||||||||||||
| Adjusted net earnings—Diluted |
$ | 1,688,211 | $ | 1,240,297 | $ | 874,294 | $ | 625,871 | $ | 316,727 | ||||||||||
| Weighted average common shares outstanding—Basic |
530,400 | 526,103 | 521,241 | 499,583 | 486,076 | |||||||||||||||
| Incremental weighted average effect on exchange of limited partnership units |
15,945 | 16,833 | 8,569 | 3,501 | 2,060 | |||||||||||||||
| Incremental weighted average effect of equity awards |
5,955 | 3,730 | 1,961 | 3,307 | 3,410 | |||||||||||||||
| Incremental weighted average effect on exchangeable debt assumed exchanged(a) |
— | — | 2,173 | — | — | |||||||||||||||
| Weighted average common shares outstanding—Diluted |
552,300 | 546,666 | 533,944 | 506,391 | 491,546 | |||||||||||||||
| Net earnings per share—Basic |
$ | 3.10 | $ | 2.29 | $ | 1.66 | $ | 1.25 | $ | 0.65 | ||||||||||
| Net earnings per share—Diluted |
$ | 3.06 | $ | 2.27 | $ | 1.64 | $ | 1.24 | $ | 0.64 | ||||||||||
|
|
A-2 | |||
|
APPENDIX A: DEFINITIONS AND RECONCILIATIONS OF GAAP AND NON-GAAP FINANCIAL MEASURES
|
||
| 2017 | 2016 | 2015 | 2014 | 2013 | ||||||||||||||||
| Core FFO |
||||||||||||||||||||
| Core FFO |
$ | 1,551,153 | $ | 1,400,498 | $ | 1,181,290 | $ | 953,147 | $ | 813,224 | ||||||||||
| Noncontrolling interest attributable to exchangeable limited partnership units |
2,903 | 4,273 | 213 | 209 | 2,828 | |||||||||||||||
| Interest expense on exchangeable debt assumed exchanged |
— | — | 3,506 | 16,984 | 16,940 | |||||||||||||||
| Core FFO—Diluted |
$ | 1,554,056 | $ | 1,404,771 | $ | 1,185,009 | $ | 970,340 | $ | 832,992 | ||||||||||
| Weighted average common shares outstanding—Basic |
530,400 | 526,103 | 521,241 | 499,583 | 486,076 | |||||||||||||||
| Incremental weighted average effect on exchange of limited partnership units |
15,945 | 16,833 | 6,897 | 1,964 | 3,411 | |||||||||||||||
| Incremental weighted average effect of equity awards |
5,955 | 3,730 | 1,961 | 3,307 | 3,410 | |||||||||||||||
| Incremental weighted average effect on exchangeable debt assumed exchanged(a) |
— | — | 2,173 | 11,879 | 11,879 | |||||||||||||||
| Weighted average common shares outstanding—Diluted |
552,300 | 546,666 | 532,272 | 516,733 | 504,776 | |||||||||||||||
| Core FFO per share—Diluted |
$ | 2.81 | $ | 2.57 | $ | 2.23 | $ | 1.88 | $ | 1.65 | ||||||||||
| (a) | In March 2015, the exchangeable debt was settled primarily through the issuance of common stock. The adjustment in 2015 assumes the exchange occurred on January 1, 2015. |
Compound Annual Growth Rate, also referred to as CAGR, is used to determine the annual growth rate over a specified period of time longer than one year. The compound annual growth is calculated by dividing the ending value by the beginning value and multiplying the result to the power of one divided by the number of years in the calculation and then subtracting one from the result. We determined the three-year compound annual growth rate of our Core FFO per share at December 31, 2017, to be 14% by dividing the 2017 diluted Core FFO per share of $2.81 by 2014 diluted Core FFO per share of $1.88, then multiplying the result to the one-third power and then subtracting one from the result.
Estimated Value Creation represents the value that we expect to create through our development and leasing activities. We calculate Value Creation by estimating the Stabilized NOI that the property will generate and applying a stabilized capitalization rate applicable to that property. Estimated Value Creation is calculated as the amount by which the value exceeds our total expected investment and does not include any fees or promotes we may earn. Estimated Value Creation for our Value-Added Properties that are sold includes the realized economic gain.
Estimated Weighted Average Margin is calculated on developed properties as the Value Creation less estimated closing costs and taxes, if any, on properties expected to be sold or contributed, divided by the TEI.
Funds from Operations attributable to common stockholders and unitholders (“FFO”). FFO is a non-GAAP financial measure that is commonly used in the real estate industry. The most directly comparable GAAP measure to FFO is net earnings.
The National Association of Real Estate Investment Trusts (“NAREIT”) defines FFO as earnings computed under GAAP to exclude historical cost depreciation and gains and losses from the sales, along with impairment charges, of previously depreciated properties. We also exclude the gains on revaluation of equity investments upon acquisition of a controlling interest and the gain recognized from a partial sale of our investment, as these are similar to gains from the
|
|
A-3 | |||
|
APPENDIX A: DEFINITIONS AND RECONCILIATIONS OF GAAP AND NON-GAAP FINANCIAL MEASURES
|
||
sales of previously depreciated properties. We exclude similar adjustments from our unconsolidated entities and the third parties’ share of our consolidated co-investment ventures.
Our FFO Measures. Our FFO measures begin with NAREIT’s definition and we make certain adjustments to reflect our business and the way that management plans and executes our business strategy. While not infrequent or unusual, the additional items we adjust for in calculating FFO, as modified by Prologis, and Core FFO, both as defined below, are subject to significant fluctuations from period to period. Although these items may have a material impact on our operations and are reflected in our financial statements, the removal of the effects of these items allows us to better understand the core operating performance of our properties over the long term. These items have both positive and negative short-term effects on our results of operations in inconsistent and unpredictable directions that are not relevant to our long-term outlook.
We calculate our FFO measures, as defined below, based on our proportionate ownership share of both our unconsolidated and consolidated ventures. We reflect our share of our FFO measures for unconsolidated ventures by applying our average ownership percentage for the period to the applicable reconciling items on an entity by entity basis. We reflect our share for consolidated ventures in which we do not own 100% of the equity by adjusting our FFO measures to remove the noncontrolling interests share of the applicable reconciling items based on our average ownership percentage for the applicable periods.
These FFO measures are used by management as supplemental financial measures of operating performance and we believe that it is important that stockholders, potential investors and financial analysts understand the measures management uses. We do not use our FFO measures as, nor should they be considered to be, alternatives to net earnings computed under GAAP, as indicators of our operating performance, as alternatives to cash from operating activities computed under GAAP or as indicators of our ability to fund our cash needs.
We analyze our operating performance primarily by the rental revenues of our real estate and the revenues from our strategic capital business, net of operating, administrative and financing expenses. This income stream is not directly impacted by fluctuations in the market value of our investments in real estate or debt securities.
FFO, as modified by Prologis attributable to common stockholders and unitholders (“FFO, as modified by Prologis”).
To arrive at FFO, as modified by Prologis, we adjust the NAREIT defined FFO measure to exclude the impact of foreign currency related items and deferred tax, specifically:
| ¾ | deferred income tax benefits and deferred income tax expenses recognized by our subsidiaries; |
| ¾ | current income tax expense related to acquired tax liabilities that were recorded as deferred tax liabilities in an acquisition, to the extent the expense is offset with a deferred income tax benefit in earnings that is excluded from our defined FFO measure; |
| ¾ | unhedged foreign currency exchange gains and losses resulting from debt transactions between us and our foreign consolidated subsidiaries and our foreign unconsolidated entities; |
| ¾ | foreign currency exchange gains and losses from the remeasurement (based on current foreign currency exchange rates) of certain third-party debt of our foreign consolidated and unconsolidated entities; and |
| ¾ | mark-to-market adjustments associated with derivative financial instruments. |
| ¾ | We use FFO, as modified by Prologis, so that management, analysts and investors are able to evaluate our performance against other REITs that do not have similar operations or operations in jurisdictions outside the U.S. |
|
|
A-4 | |||
|
APPENDIX A: DEFINITIONS AND RECONCILIATIONS OF GAAP AND NON-GAAP FINANCIAL MEASURES
|
||
Core FFO attributable to common stockholders and unitholders (“Core FFO”). In addition to FFO, as modified by Prologis, we also use Core FFO. To arrive at Core FFO, we adjust FFO, as modified by Prologis, to exclude the following recurring and nonrecurring items that we recognized directly in FFO, as modified by Prologis:
| ¾ | gains or losses from the disposition of land and development properties that were developed with the intent to contribute or sell; |
| ¾ | income tax expense related to the sale of investments in real estate and third-party acquisition costs related to the acquisition of real estate; |
| ¾ | impairment charges recognized related to our investments in real estate generally as a result of our change in intent to contribute or sell these properties; |
| ¾ | gains or losses from the early extinguishment of debt and redemption and repurchase of preferred stock; and |
| ¾ | expenses related to natural disasters. |
We use Core FFO, including by segment and region, to: (i) assess our operating performance as compared to other real estate companies; (ii) evaluate our performance and the performance of our properties in comparison with expected results and results of previous periods; (iii) evaluate the performance of our management; (iv) budget and forecast future results to assist in the allocation of resources; (v) provide guidance to the financial markets to understand our expected operating performance; and (vi) evaluate how a specific potential investment will impact our future results.
Limitations on the use of our FFO measures. While we believe our modified FFO measures are important supplemental measures, neither NAREIT’s nor our measures of FFO should be used alone because they exclude significant economic components of net earnings computed under GAAP and are, therefore, limited as an analytical tool. Accordingly, these are only a few of the many measures we use when analyzing our business. Some of the limitations are:
| ¾ | The current income tax expenses and acquisition costs that are excluded from our modified FFO measures represent the taxes and transaction costs that are payable. |
| ¾ | Depreciation and amortization of real estate assets are economic costs that are excluded from FFO. FFO is limited, as it does not reflect the cash requirements that may be necessary for future replacements of the real estate assets. Furthermore, the amortization of capital expenditures and leasing costs necessary to maintain the operating performance of logistics facilities are not reflected in FFO. |
| ¾ | Gains or losses from non-development property and dispositions or impairment charges related to expected dispositions represent changes in value of the properties. By excluding these gains and losses, FFO does not capture realized changes in the value of disposed properties arising from changes in market conditions. |
| ¾ | The deferred income tax benefits and expenses that are excluded from our modified FFO measures result from the creation of a deferred income tax asset or liability that may have to be settled at some future point. Our modified FFO measures do not currently reflect any income or expense that may result from such settlement. |
| ¾ | The foreign currency exchange gains and losses that are excluded from our modified FFO measures are generally recognized based on movements in foreign currency exchange rates through a specific point in time. The ultimate settlement of our foreign currency-denominated net assets is indefinite as to timing and amount. Our FFO measures are limited in that they do not reflect the current period changes in these net assets that result from periodic foreign currency exchange rate movements. |
| ¾ | The gains and losses on extinguishment of debt that we exclude from our Core FFO, may provide a benefit or cost to us as we may be settling our debt at less or more than our future obligation. |
| ¾ | The natural disaster expenses that we exclude from Core FFO are costs that we have incurred. |
|
|
A-5 | |||
|
APPENDIX A: DEFINITIONS AND RECONCILIATIONS OF GAAP AND NON-GAAP FINANCIAL MEASURES
|
||
We compensate for these limitations by using our FFO measures only in conjunction with net earnings computed under GAAP when making our decisions. This information should be read with our complete Consolidated Financial Statements prepared under GAAP. To assist investors in compensating for these limitations, we reconcile our modified FFO measures to our net earnings computed under GAAP as follows (in millions).
| 2017 | 2016 | 2015 | 2014 | 2013 | ||||||||||||||||
| FFO |
||||||||||||||||||||
| Reconciliation of net earnings to FFO measures: |
||||||||||||||||||||
| Net earnings attributable to common stockholders |
$ | 1,641.9 | $ | 1,203.2 | $ | 862.8 | $ | 622.2 | $ | 315.4 | ||||||||||
| Add (deduct) NAREIT defined adjustments: |
||||||||||||||||||||
| Real estate related depreciation and amortization |
847.5 | 899.8 | 854.5 | 617.8 | 624.6 | |||||||||||||||
| Gains on dispositions of real estate properties, net (excluding development properties and land) |
(855.4 | ) | (423.0 | ) | (500.8 | ) | (553.2 | ) | (271.3 | ) | ||||||||||
| Reconciling items related to noncontrolling interests |
(39.0 | ) | (104.8 | ) | (78.1 | ) | 47.9 | (9.0 | ) | |||||||||||
| Our share of reconciling items included in earnings from unconsolidated entities |
147.5 | 162.1 | 185.6 | 186.5 | 159.8 | |||||||||||||||
|
Subtotal—NAREIT defined FFO |
1,742.5 | 1,737.3 | 1,324.0 | 921.2 | 819.5 | |||||||||||||||
| Add (deduct) our modified adjustments: |
||||||||||||||||||||
| Unrealized foreign currency and derivative losses (gains), net |
69.4 | (7.5 | ) | 1.0 | 19.0 | 32.8 | ||||||||||||||
| Deferred income tax benefit |
(5.0 | ) | (5.5 | ) | (5.1 | ) | (87.2 | ) | (20.0 | ) | ||||||||||
| Current income tax expense on dispositions related to acquired tax assets |
2.3 | — | 3.5 | 30.5 | 20.7 | |||||||||||||||
| Reconciling items related to noncontrolling interests |
(0 | ) | 0.7 | (1.3 | ) | — | — | |||||||||||||
| Our share of reconciling items included in earnings from unconsolidated entities |
(14.7 | ) | (22.9 | ) | (13.6 | ) | 4.0 | 2.2 | ||||||||||||
| FFO, as modified by Prologis |
1,794.5 | 1,702.1 | 1,308.5 | 887.5 | 855.2 | |||||||||||||||
| Adjustments to arrive at Core FFO: |
||||||||||||||||||||
| Gains on dispositions of development properties and land, net |
(327.5 | ) | (334.4 | ) | (258.1 | ) | (172.4 | ) | (427.6 | ) | ||||||||||
| Current income tax expense (benefit) on dispositions |
19.1 | 24.2 | (0.2 | ) | 15.4 | 87.8 | ||||||||||||||
| Acquisition expenses |
— | 4.6 | 47.0 | 4.2 | 3.0 | |||||||||||||||
| Losses (gains) on early extinguishment of debt and preferred stock repurchase, net |
72.3 | (2.5 | ) | 86.3 | 171.8 | 286.1 | ||||||||||||||
| Reconciling items related to noncontrolling interests |
(0.4 | ) | 4.3 | (11.1 | ) | — | — | |||||||||||||
| Our share of reconciling items included in earnings from unconsolidated entities |
(6.8 | ) | 2.2 | 8.9 | 46.6 | 8.7 | ||||||||||||||
| Core FFO |
$ | 1,551.2 | $ | 1,400.5 | $ | 1,181.3 | $ | 953.1 | $ | 813.2 | ||||||||||
Investment Capacity is our estimate of the gross real estate, which could be acquired by our co-investment ventures through the use of existing equity commitments from us and our partners assuming the ventures maximum leverage limits are used.
Liquidity is equal to the sum of the current availability of our consolidated credit facilities ($3.1 billion) plus our consolidated cash and cash equivalents ($0.5 billion).
LED lighting. LED stands for “light-emitting diode.” LED lighting is a type of energy efficient lighting.
|
|
A-6 | |||
|
APPENDIX A: DEFINITIONS AND RECONCILIATIONS OF GAAP AND NON-GAAP FINANCIAL MEASURES
|
Loan-to-Market Value, or debt as percentage of gross market capitalization, is a non-GAAP measure used by us to analyze the leverage risk in our debt risk portfolio. We make adjustments to reflect our economic ownership in each entity in which we invest, whether consolidated or unconsolidated. The following table presents the calculation of Loan-to-Market Value for the years ended December 31 (in thousands).
| 2017 | 2016 | 2015 | 2014 | 2013 | ||||||||||||||||
| Debt as a % of gross real estate assets: |
||||||||||||||||||||
| Consolidated debt (at par) |
$ | 9,469,106 | $ | 10,632,534 | $ | 11,620,995 | $ | 9,293,367 | $ | 8,970,567 | ||||||||||
| Noncontrolling interests share of consolidated debt (at par) |
(70,422 | ) | (634,945 | ) | (674,048 | ) | (383,455 | ) | (175,211 | ) | ||||||||||
| Prologis share of unconsolidated debt (at par) |
2,040,271 | 1,557,561 | 1,768,900 | 1,853,320 | 2,101,573 | |||||||||||||||
| Total Prologis share of debt (at par) |
11,438,955 | 11,555,150 | 12,715,847 | 10,763,232 | 10,896,929 | |||||||||||||||
| Prologis share of outstanding foreign currency derivatives |
4,965 | (22,349 | ) | (34,769 | ) | (102,080 | ) | 20,828 | ||||||||||||
| Consolidated cash and cash equivalents |
(447,046 | ) | (807,316 | ) | (264,080 | ) | (350,692 | ) | (491,129 | ) | ||||||||||
| Noncontrolling interests share of consolidated cash and cash equivalents |
55,827 | 52,519 | 51,204 | 45,236 | 7,904 | |||||||||||||||
| Prologis share of unconsolidated cash and cash equivalents |
(132,276 | ) | (138,773 | ) | (163,595 | ) | (111,629 | ) | (145,186 | ) | ||||||||||
| Total Prologis share of debt, net of adjustments |
$ | 10,920,425 | $ | 10,639,231 | $ | 12,304,607 | $ | 10,244,067 | $ | 10,289,346 | ||||||||||
| Total outstanding common stock and limited partnership units |
546,355 | 542,660 | 540,067 | 511,265 | 502,517 | |||||||||||||||
| Share price at year end |
64.51 | 52.79 | 42.92 | 43.03 | 36.95 | |||||||||||||||
| Total equity capitalization |
35,245,361 | 28,647,021 | 23,179,676 | 21,999,733 | 18,568,003 | |||||||||||||||
| Total Prologis share of debt, net of adjustments |
10,920,425 | 10,639,231 | 12,304,607 | 10,244,067 | 10,289,346 | |||||||||||||||
| Gross market capitalization |
$ | 46,165,786 | $ | 39,286,252 | $ | 35,484,283 | $ | 32,243,800 | $ | 28,857,349 | ||||||||||
| Debt as a % of gross real estate assets |
23.7 | % | 27.1 | % | 34.7 | % | 31.8 | % | 35.7 | % | ||||||||||
Net Operating Income (“NOI”) is a non-GAAP financial measure used to evaluate our operating performance and represents rental revenue less rental expenses.
Net Promote includes actual promotes earned from third-party investors during the period, net of related cash expenses.
Same Store. We evaluate the operating performance of the operating properties we own and manage using a “same store” analysis because the population of properties in this analysis is consistent from period to period, which eliminates the effects of changes in the composition of the portfolio. We have defined the same store portfolio, for the three months ended December 31, 2017, as those owned and managed properties that were in operation at January 1, 2016 and have been in operation throughout the same three-month periods in both 2016 and 2017 (including development properties that have been completed and available for lease). We have removed all properties that were disposed of to a third party or were classified as held for sale to a third party from the population for both periods. We believe the factors that affect rental revenues, rental expenses and NOI in the same store portfolio are generally the same as for the total operating portfolio. To derive an appropriate measure of period-to-period operating performance, we remove the effects of foreign currency exchange rate movements by using the recent period end exchange rate to translate from local currency into the U.S. dollar, for both periods.
|
|
A-7 | |||
|
APPENDIX A: DEFINITIONS AND RECONCILIATIONS OF GAAP AND NON-GAAP FINANCIAL MEASURES
|
Same store is a commonly used measure in the real estate industry. Our same store measures are non-GAAP financial measures that are calculated beginning with rental revenues, rental recoveries and rental expenses from the financial statements prepared in accordance with GAAP. It is also common in the real estate industry and expected from the analyst and investor community that these numbers be further adjusted to remove certain non-cash items included in the financial statements prepared in accordance with GAAP to reflect a cash same store number. In order to clearly label these metrics, we call one Same Store NOI and one Same Store NOI—Cash. As our same store measures are non-GAAP financial measures, they have certain limitations as analytical tools and may vary among real estate companies. As a result, we provide a reconciliation from our financial statements prepared in accordance with GAAP to same store property NOI with explanations of how these metrics are calculated.
We calculate our same store results on a quarterly basis. The following table summarizes same store NOI and the change from prior period for the four quarters of 2017 and on a cumulative annual basis and the square feet of the portfolio used in the calculation (dollars and square feet in millions):
| Three Months Ended | ||||||||||||||||||||
| March 31,(1) | June 30,(1) | September 30,(1) | December 31, | Full Year | ||||||||||||||||
| 2017 NOI—same store portfolio |
$ | 730.3 | $ | 735.3 | $ | 751.6 | $ | 743.5 | $ | 2,960.7 | ||||||||||
| 2016 NOI—same store portfolio |
$ | 697.9 | $ | 707.3 | $ | 730.3 | $ | 720.5 | $ | 2,856.0 | ||||||||||
| Percentage change |
4.6 | % | 3.9 | % | 2.9 | % | 3.2 | % | 3.7 | % | ||||||||||
| Square feet of portfolio |
586.3 | 577.8 | 572.2 | 560.0 | ||||||||||||||||
| (1) | A reconciliation of our same store results for these fiscal quarters to the Consolidated Statements of Income is provided in our previously filed quarterly reports on Form 10-Q for the respective quarter. |
The following is a reconciliation of our consolidated rental revenues, rental recoveries, rental expenses and property NOI for the full year, as included in the Consolidated Statements of Income and within Note 20 to the Consolidated Financial Statements, in our annual reports on Form 10-K for year ended December 31, 2017, to the respective amounts in our same store portfolio analysis for the three months ended December 31 (dollars in millions):
| Three Months Ended | ||||||||||||||||||||
| March 31, | June 30, | September 30, | December 31, | Full Year | ||||||||||||||||
| 2017 |
||||||||||||||||||||
| Rental revenues |
$ | 439.9 | $ | 448.0 | $ | 416.4 | $ | 433.5 | $ | 1,737.8 | ||||||||||
| Rental recoveries |
127.0 | 128.4 | 114.8 | 117.1 | $ | 487.3 | ||||||||||||||
| Rental expenses |
(152.7 | ) | (147.8 | ) | (128.7 | ) | (140.3 | ) | $ | (569.5 | ) | |||||||||
| Property NOI |
$ | 414.2 | $ | 428.6 | $ | 402.5 | $ | 410.3 | $ | 1,655.6 | ||||||||||
| 2016 |
||||||||||||||||||||
| Rental revenues |
$ | 437.1 | $ | 426.2 | $ | 435.8 | $ | 435.7 | $ | 1,734.8 | ||||||||||
| Rental recoveries |
117.0 | 120.0 | 124.4 | 124.2 | 485.6 | |||||||||||||||
| Rental expenses |
(146.6 | ) | (140.7 | ) | (140.5 | ) | (141.1 | ) | (568.9 | ) | ||||||||||
| Property NOI |
$ | 407.5 | $ | 405.5 | $ | 419.7 | $ | 418.8 | $ | 1,651.5 | ||||||||||
|
|
A-8 | |||
|
APPENDIX A: DEFINITIONS AND RECONCILIATIONS OF GAAP AND NON-GAAP FINANCIAL MEASURES
|
| Three Months Ended December 31, |
||||||||||||
| 2017 | 2016 | Percentage Change |
||||||||||
| Rental Revenues(1)(2) |
||||||||||||
| Consolidated: |
||||||||||||
| Rental revenues as included in the Consolidated Statements of Income |
$ | 433.6 | $ | 435.7 | ||||||||
| Rental recoveries as included in the Consolidated Statements of Income |
117.1 | 124.2 | ||||||||||
| Consolidated adjustments to derive same store results: |
||||||||||||
| Rental revenues and recoveries of properties not in the same store portfolio—properties developed, acquired and sold to third parties during the period and land subject to ground leases |
(74.4 | ) | (66.1 | ) | ||||||||
| Effect of changes in foreign currency exchange rates and other |
(7.7 | ) | 0.6 | |||||||||
| Unconsolidated co-investment ventures—rental revenues |
525.2 | 463.9 | ||||||||||
| Same store portfolio—rental revenues(2) |
$ | 993.8 | $ | 958.3 | 3.7 | % | ||||||
| Rental Expenses(1)(3) |
||||||||||||
| Consolidated: |
||||||||||||
| Rental expenses as included in the Consolidated Statements of Income |
$ | 140.3 | $ | 141.0 | ||||||||
| Consolidated adjustments to derive same store results: |
||||||||||||
| Rental expenses of properties not in the same store portfolio—properties developed, acquired and sold to third parties during the period and land subject to ground leases |
(31.8 | ) | (22.7 | ) | ||||||||
| Effect of changes in foreign currency exchange rates and other |
17.9 | 13.6 | ||||||||||
| Unconsolidated co-investment ventures—rental expenses |
123.9 | 105.0 | ||||||||||
| Same store portfolio—rental expenses(3) |
$ | 250.3 | $ | 236.9 | 5.3 | % | ||||||
|
NOI(1) |
||||||||||||
| Consolidated: |
||||||||||||
| Property NOI as included in the Consolidated Statements of Income |
$ | 410.4 | $ | 418.9 | ||||||||
| Consolidated adjustments to derive same store results: |
||||||||||||
| Property NOI of properties not in the same store portfolio—properties developed, acquired and sold to third parties during the period and land subject to ground leases |
(42.6 | ) | (43.4 | ) | ||||||||
| Effect of changes in foreign currency exchange rates and other |
(25.6 | ) | (13.0 | ) | ||||||||
| Unconsolidated co-investment ventures—property NOI |
401.3 | 358.9 | ||||||||||
| Same store portfolio—NOI |
$ | 743.5 | $ | 721.4 | 3.2 | % | ||||||
| (1) | We include 100% of the same store NOI from the properties in our same store portfolio. During the periods presented, certain properties owned by us were contributed to a co-investment venture and are included in the same store portfolio. Neither our consolidated results nor those of the co-investment ventures, when viewed individually, would be comparable on a same store basis because of the changes in composition of the respective portfolios from period to period (e.g. the results of a contributed property are included in our consolidated results through the contribution date and in the results of the unconsolidated entities subsequent to the contribution date). |
| (2) | We exclude the net termination and renegotiation fees from our same store rental revenues to allow us to evaluate the growth or decline in each property’s rental revenues without regard to one-time items that are not indicative of the property’s recurring operating |
|
|
A-9 | |||
|
APPENDIX A: DEFINITIONS AND RECONCILIATIONS OF GAAP AND NON-GAAP FINANCIAL MEASURES
|
| performance. Net termination and renegotiation fees represent the gross fee negotiated to allow a customer to terminate or renegotiate their lease, offset by the write-off of the asset recorded due to the adjustment to straight-line rents over the lease term. The adjustments to remove these items are included in “effect of changes in foreign currency exchange rates and other” in this table. |
| (3) | Rental expenses include the direct operating expenses of the property such as property taxes, insurance and utilities. In addition, we include an allocation of the property management expenses for our direct-owned properties based on the property management services provided to each property (generally, based on a percentage of revenues). On consolidation, these amounts are eliminated and the actual costs of providing property management services are recognized as part of our consolidated rental expenses. These expenses fluctuate based on the level of properties included in the same store portfolio and any adjustment is included as “effect of changes in foreign currency exchange rates and other” in this table. |
Scope 1 GHG are greenhouse gas emissions from sources owned or controlled by Prologis and
Scope 2 GHG are indirect greenhouse gas emissions associated with consumption of purchased electricity and gas.
Stabilization is defined as the earlier of when a property that was developed has been completed for one year or is 90% occupied. Upon Stabilization, a property is moved into our Operating Portfolio.
Stabilized NOI is equal to the estimated twelve months of potential gross rental revenue (base rent, including above or below market rents plus operating expense reimbursements) multiplied by 95% to adjust income to a stabilized vacancy factor of 5%, minus estimated operating expenses.
Total Expected Investment (“TEI”) represents total estimated cost of development or expansion, including land, development and leasing costs. TEI is based on current projections and is subject to change.
Total Stockholder Return (“TSR”) is calculated based on the stock price appreciation and dividends paid to show a total return to a stockholder over a period of time. This calculation assumes dividends are reinvested into the stock on the day the dividend is paid.
Weighted Average Annualized Growth Rate is the growth rate of an investment assuming that the investment has been compounding over a period of time. The growth rate is weighted by using the daily market capitalization of the applicable company averaged over a specified period of time.
Weighted Average Annualized TSR weights the annualized TSR of a company by using the daily market capitalization of the company averaged over the same period of time as the TSR. If applicable, the average daily market capitalization is then converted to USD using the applicable currency’s average daily exchange rate over the same period of time.
Weighted Average Stabilized Capitalization (“Cap”) Rate is calculated as Stabilized NOI divided by the Acquisition Cost.
|
|
A-10 | |||
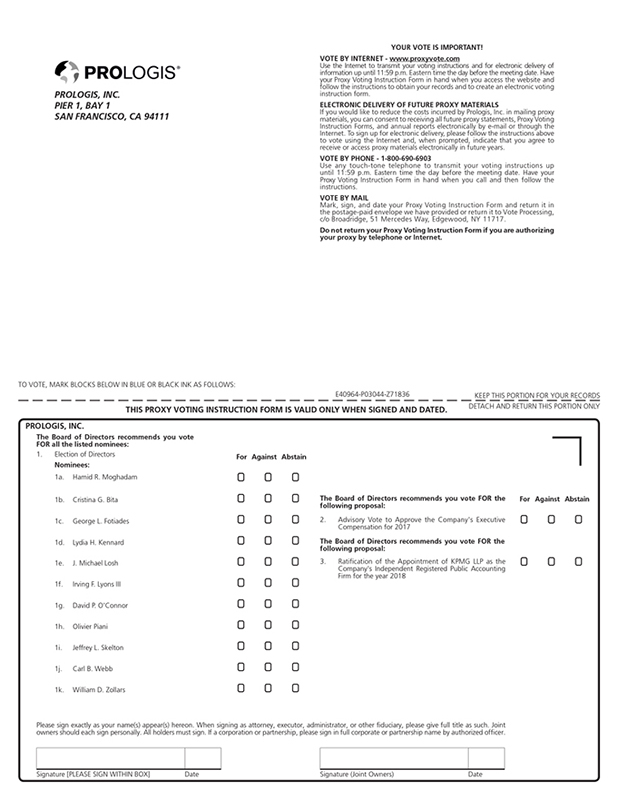
YOUR VOTE IS IMPORTANT! VOTE BY INTERNET—www.proxyvote.com Use the Internet to transmit your voting instructions and for electronic delivery of information up until 11:59 p.m. Eastern time the day before the meeting date. Have your Proxy Voting Instruction Form in hand when you access the website and follow the instructions to obtain your records and to create an electronic voting PROLOGIS, INC. instruction form. PIER 1, BAY 1 ELECTRONIC DELIVERY OF FUTURE PROXY MATERIALS SAN FRANCISCO, CA 94111 If you would like to reduce the costs incurred by Prologis, Inc. in mailing proxy materials, you can consent to receiving all future proxy statements, Proxy Voting Instruction Forms, and annual reports electronically by e-mail or through the Internet. To sign up for electronic delivery, please follow the instructions above to vote using the Internet and, when prompted, indicate that you agree to receive or access proxy materials electronically in future years. VOTE BY PHONE—1-800-690-6903 Use any touch-tone telephone to transmit your voting instructions up until 11:59 p.m. Eastern time the day before the meeting date. Have your Proxy Voting Instruction Form in hand when you call and then follow the instructions. VOTE BY MAIL Mark, sign, and date your Proxy Voting Instruction Form and return it in the postage-paid envelope we have provided or return it to Vote Processing, c/o Broadridge, 51 Mercedes Way, Edgewood, NY 11717. Do your not proxy return by your telephone Proxy Voting or Internet. Instruction Form if you are authorizing TO VOTE, MARK BLOCKS BELOW IN BLUE OR BLACK INK AS FOLLOWS: E40964-P03044-Z71836 KEEP THIS PORTION FOR YOUR RECORDS THIS PROXY VOTING INSTRUCTION FORM IS VALID ONLY WHEN SIGNED AND DATED. DETACH AND RETURN THIS PORTION ONLY PROLOGIS, INC. The Board of Directors recommends you vote FOR all the listed nominees: 1. Election of Directors For Against Abstain Nominees: 1a. Hamid R. Moghadam ! ! ! 1b. Cristina G. Bita ! ! ! The Board of Directors recommends you vote FOR the For Against Abstain following proposal: 1c. George L. Fotiades ! ! ! 2. Advisory Vote to Approve the Company’s Executive ! ! ! Compensation for 2017 1d. Lydia H. Kennard ! ! ! The Board of Directors recommends you vote FOR the following proposal: 1e. J. Michael Losh ! ! ! 3. Ratification of the Appointment of KPMG LLP as the ! ! ! Company’s Independent Registered Public Accounting Firm for the year 2018 1f. Irving F. Lyons III ! ! ! 1g. David P. O’Connor ! ! ! 1h. Olivier Piani ! ! ! 1i. Jeffrey L. Skelton ! ! ! 1j. Carl B. Webb ! ! ! 1k. William D. Zollars ! ! ! Please sign exactly as your name(s) appear(s) hereon. When signing as attorney, executor, administrator, or other fiduciary, please give full title as such. Joint owners should each sign personally. All holders must sign. If a corporation or partnership, please sign in full corporate or partnership name by authorized officer. Signature [PLEASE SIGN WITHIN BOX] Date Signature (Joint Owners) Date
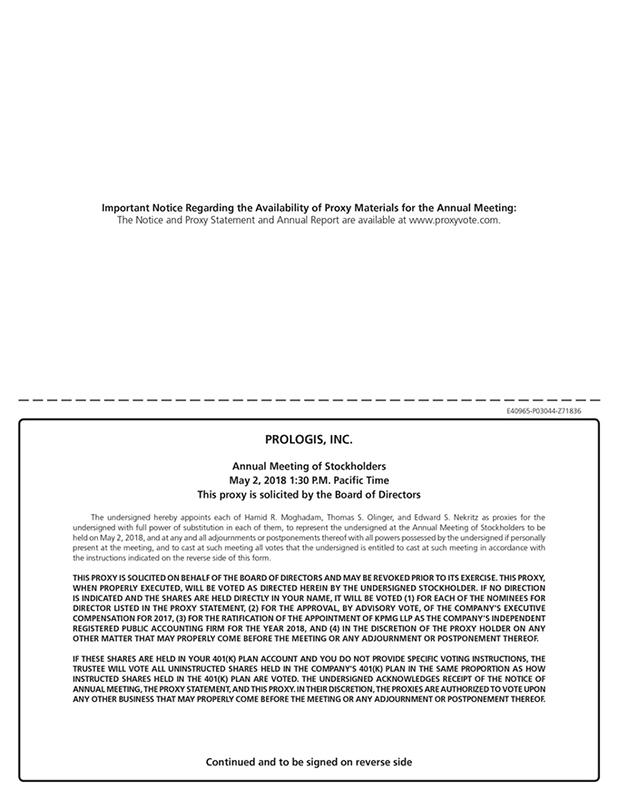
Important Notice Regarding the Availability of Proxy Materials for the Annual Meeting: The Notice and Proxy Statement and Annual Report are available at www.proxyvote.com. E40965-P03044-Z71836 PROLOGIS, INC. Annual Meeting of Stockholders May 2, 2018 1:30 P.M. Pacific Time This proxy is solicited by the Board of Directors The undersigned hereby appoints each of Hamid R. Moghadam, Thomas S. Olinger, and Edward S. Nekritz as proxies for the undersigned with full power of substitution in each of them, to represent the undersigned at the Annual Meeting of Stockholders to be held on May 2, 2018, and at any and all adjournments or postponements thereof with all powers possessed by the undersigned if personally present at the meeting, and to cast at such meeting all votes that the undersigned is entitled to cast at such meeting in accordance with the instructions indicated on the reverse side of this form. THIS PROXY IS SOLICITED ON BEHALF OF THE BOARD OF DIRECTORS AND MAY BE REVOKED PRIOR TO ITS EXERCISE. THIS PROXY, WHEN PROPERLY EXECUTED, WILL BE VOTED AS DIRECTED HEREIN BY THE UNDERSIGNED STOCKHOLDER. IF NO DIRECTION IS INDICATED AND THE SHARES ARE HELD DIRECTLY IN YOUR NAME, IT WILL BE VOTED (1) FOR EACH OF THE NOMINEES FOR DIRECTOR LISTED IN THE PROXY STATEMENT, (2) FOR THE APPROVAL, BY ADVISORY VOTE, OF THE COMPANY’S EXECUTIVE COMPENSATION FOR 2017, (3) FOR THE RATIFICATION OF THE APPOINTMENT OF KPMG LLP AS THE COMPANY’S INDEPENDENT REGISTERED PUBLIC ACCOUNTING FIRM FOR THE YEAR 2018, AND (4) IN THE DISCRETION OF THE PROXY HOLDER ON ANY OTHER MATTER THAT MAY PROPERLY COME BEFORE THE MEETING OR ANY ADJOURNMENT OR POSTPONEMENT THEREOF. IF THESE SHARES ARE HELD IN YOUR 401(K) PLAN ACCOUNT AND YOU DO NOT PROVIDE SPECIFIC VOTING INSTRUCTIONS, THE TRUSTEE WILL VOTE ALL UNINSTRUCTED SHARES HELD IN THE COMPANY’S 401(K) PLAN IN THE SAME PROPORTION AS HOW INSTRUCTED SHARES HELD IN THE 401(K) PLAN ARE VOTED. THE UNDERSIGNED ACKNOWLEDGES RECEIPT OF THE NOTICE OF ANNUAL MEETING, THE PROXY STATEMENT, AND THIS PROXY. IN THEIR DISCRETION, THE PROXIES ARE AUTHORIZED TO VOTE UPON ANY OTHER BUSINESS THAT MAY PROPERLY COME BEFORE THE MEETING OR ANY ADJOURNMENT OR POSTPONEMENT THEREOF. Continued and to be signed on reverse side