|
|
FIRST QUARTER 2015
Earnings Release and Supplemental Information
UNAUDITED
|
|
Table of Contents
Supplemental 1Q 2015
Prologis Park Prague D1 West DC4, Prague, Czech Republic
Prologis Park Osaka 5, Osaka, Japan
Stapleton Business Center North, Denver, Colorado, USA
Cover: Prologis Park Tres Rios, Mexico City, Mexico
Overview
Press Release 1
Highlights
Company Profile 4
Company Performance 5
Operating Performance 7
Guidance 8
Financial Information
Consolidated Balance Sheets 9
Pro-rata Balance Sheet Information 10
Consolidated Statements of Operations 11
Reconciliation of Net Earnings (Loss) to FFO 12
Pro-rata Operating Information and Reconciliation to FFO 13
EBITDA Reconciliation 14
Strategic Capital
Summary and Financial Highlights 15
Operating and Balance Sheet Information 16
Operations Overview
Operating Metrics 17
Operating Portfolio 19
Customer Information 22
Capital Deployment
Overview 23
Value Creation from Development Stabilization 24
Development Starts 25
Development Portfolio 26
Third Party Building Acquisitions 27
Dispositions and Contributions 28
Land Portfolio 29
Capitalization
Overview 31
Debt Summary 32
Debt Covenants and Other Metrics 33
Net Asset Value
Components 34
Notes and Definitions (A) 36
(A) Terms used throughout document are defined in the Notes and Definitions
Copyright © 2015 Prologis
 Copyright ©
2015 Prologis
1
–
Core Funds From Operations Per Share Grew 14 Percent Year-Over-Year –
–
Rent Change on Rollovers Increased 9.7 Percent –
–
Stabilized $358.2 Million of Development with Estimated Margin of 35.5 Percent – –
Increases Mid-Point of 2015 Core FFO Guidance, excluding KTR Capital Partners transaction
–
SAN FRANCISCO (April 19, 2015) – Prologis, Inc. (NYSE: PLD), the global leader
in industrial real estate, today reported results for the first quarter 2015.
Core funds from operations (Core FFO) per diluted share was $0.49 for the
first quarter compared with $0.43 for the same period in 2014.
“We had an excellent start to the year and we continue to deliver growth
across our three lines of business,” said Hamid R. Moghadam, chairman and
CEO, Prologis. “Generally, market conditions are in great shape, and the scale,
quality and diversification of our global platform, combined with solid
execution by teams throughout the world, are driving strong financial
results.”
STRONG OPERATING PERFORMANCE RESULTING FROM FOCUSED
INVESTMENT STRATEGY
Prologis ended the quarter with 95.9 percent occupancy in its operating
portfolio, an increase of 140 basis points over the same period in 2014. In the
first quarter, the company leased 39.2 million square feet (3.6 million square
meters) in its combined operating and development portfolios, which includes
3.9 million square feet (0.4 million square meters) of properties under
development. Tenant retention was 86.3 percent.
Rent change on rollovers was positive, with GAAP rental rates on signed
leases increasing 9.7 percent. In the U.S., GAAP rental rates on signed leases
increased 15.1 percent.
During the first quarter, same store NOI for the owned and managed portfolio
increased 3.5 percent on a GAAP basis and 3.9 percent on an adjusted cash
basis. On a Prologis’ share basis, same store NOI increased 3.7 percent on a
GAAP basis and 4.2 percent on an adjusted cash basis.
PROFITABLE CAPITAL DEPLOYMENT
During the first quarter, Prologis invested $421.0 million ($278.6 million
Prologis’ share) at attractive yields.
Value Creation
The company generated $264.2 million ($259.3 million Prologis’ share) of
estimated value creation during the quarter. This includes $127.2 million ($122.3
million Prologis’ share) of estimated value creation from $358.2 million ($331.0
million Prologis’ share) of development stabilizations at an estimated
development margin of 35.5 percent and $137.0 million (of which 100% is
Prologis’ share) of value creation recognized through its value-added conversion
program.
“During the quarter we monetized one of our significant value-added conversion
projects, said Moghadam. While these projects are episodic, they
produce meaningful gains and NAV appreciation as we convert some of our infill
industrial properties higher and better use. Through the first quarter of 2015, we
have averaged approximately $50 million annually in gains from our value-add
efforts over the last nine years.”
Development Starts
The company started $280.1 million ($218.4 million Prologis share) of new
developments with an estimated weighted average yield upon stabilization of 7.1
percent and an estimated development margin of 20.5 percent. Build-to-suits
represented 16.5 percent of development starts in the first quarter.
At quarter end, the book value of the company’s land bank totaled $1.8 billion
with an estimated build-out potential of $11.1 billion.
Acquisitions
Prologis acquired $140.9 million ($60.2 million Prologis’ share) of buildings with
a stabilized capitalization rate on Prologis’ share of 6.8
percent. Dispositions and Contributions
Prologis completed $464.7 million ($461.6 million Prologis’ share) of third-party
building dispositions, primarily through its value-added conversion program, and
contributions to its co-investment ventures of $29.6 million ($20.4 million
Prologis’ share). Prologis’ share of dispositions and contributions had a
stabilized capitalization rate of 3.6 percent.
Prologis Announces First Quarter 2015 Earnings Results |
 Copyright ©
2015 Prologis
2
CAPITAL MARKETS ACTIVITY INSULATES EARNINGS AND NAV FROM MOVEMENTS
IN FOREIGN CURRENCIES
Prologis completed $405.2 million of capital markets activity in the quarter and
increased its U.S. dollar net equity exposure to 91 percent.
“I am very pleased with our financial position, our balance sheet and credit
metrics are as strong as they have ever been,” said Tom Olinger, chief financial
officer, Prologis. “Additionally, we have effectively hedged the impact of foreign
currency movements on our estimated 2015 Core FFO, insulating our earnings
and net asset value.”
NET EARNINGS
Net earnings per diluted share was $0.65 for the first quarter compared with
$0.01 for the same period in 2014.
GUIDANCE NARROWED AND MIDPOINT RAISED FOR 2015
Guidance for 2015 does not include any impact from the KTR Capital Partners
transaction
Prologis narrowed its 2015 Core FFO guidance range to $2.07 to $2.13 per diluted
share from $2.04 to $2.12 per diluted share representing 12 percent growth at the
midpoint compared with full year 2014. The company expects to recognize net
earnings, for GAAP purposes, of $0.98 to $1.04 per share. This assumes (on an
owned and managed basis):
Year-end occupancy between 95.5 and 96.5 percent
GAAP same store NOI growth between 3.75 and 4.50 percent
Development stabilizations between $1.7 and $1.9 billion
Development starts between $2.3 and $2.6 billion
Building acquisitions between $1.0 and $1.5 billion
Contributions to co-investment ventures between $1.3 and $1.8 billion
Third-party dispositions between $2.1 billion and 2.5 billion
Strategic capital revenue between $195 and $205 million
Net G&A between $235 and $245 million
The Core FFO and earnings guidance reflected above excludes any potential
future gains (losses) recognized from real estate transactions. In reconciling
from net earnings to Core FFO, Prologis makes certain adjustments including
but not limited to real estate depreciation and amortization expenses, gains
(losses) recognized from real estate transactions and early extinguishment of
debt or redemption of preferred stock, impairment charges, deferred taxes
and unrealized gains or losses on foreign currency or derivative activity.
The difference between the company's Core FFO and net earnings guidance for 2015
relates predominantly to real estate depreciation and realized gains or losses on real
estate transactions.
NEW WEBCAST & CONFERENCE CALL INFORMATION
Prologis will host a live webcast and conference call with senior management to
discuss first quarter results, current market conditions and future outlook on April
20, at 8 a.m. U.S. Eastern time. Interested parties are encouraged to access the
webcast by clicking on the Investor Events and Presentations section on the
opening page of the Prologis Investor Relations website
(http://ir.prologis.com). Interested parties also can
participate via conference call by dialing +1 877 256 7020 (toll-free from the
U.S. and Canada) or +1 973 409 9692 (from all other countries) and entering conference
code 48765488. A telephonic replay will be available April 20-May 20 at +1
855 859 2056 (from the U.S. and Canada) or +1 404 537 3406 (from all other countries)
using conference code 48765488. The webcast replay will be posted when available in
the "Events & Presentations" section of Investor Relations on the Prologis
website. ABOUT PROLOGIS
Prologis, Inc., is the global leader in industrial real estate. As of March 31, 2015,
Prologis owned or had investments in, on a wholly owned basis or through
co-investment ventures, properties and development projects expected to total
approximately 594 million square feet (55 million square meters) in 21 countries.
The company leases modern distribution facilities to more than 4,700 customers,
including third-party logistics providers, transportation companies, retailers and
manufacturers.
FORWARD-LOOKING STATEMENTS
The statements in this document that are not historical facts are forward-looking
statements within the meaning of Section 27A of the Securities Act of 1933, as
amended, and Section 21E of the Securities Exchange Act of 1934, as amended.
These forward-looking statements are based on current expectations, estimates and
projections about the industry and markets in which Prologis operates,
management’s beliefs and assumptions made by management. Such statements
involve uncertainties that could significantly impact Prologis’ financial results. Words
such as “expects,” “anticipates,” “intends,”
“plans,” “believes,” “seeks,” “estimates,”
|
 Copyright ©
2015 Prologis
3
variations of such words and similar expressions are intended to identify such
forward-looking statements, which generally are not historical in nature. All
statements that address operating performance, events or developments that we
expect or anticipate will occur in the future — including statements relating to rent
and occupancy growth, development activity and changes in sales or contribution
volume of properties, disposition activity, general conditions in the geographic
areas where we operate, our debt and financial position, our ability to form new
co-investment ventures and the availability of capital in existing or new co-
investment ventures — are forward-looking statements. These statements are not
guarantees of future performance and involve certain risks, uncertainties and
assumptions that are difficult to predict. Although we believe the expectations
reflected in any forward-looking statements are based on reasonable assumptions,
we can give no assurance that our expectations will be attained and therefore,
actual outcomes and results may differ materially from what is expressed or
forecasted in such forward-looking statements. Some of the factors that may affect
outcomes and results include, but are not limited to: (i) national, international,
regional and local economic climates, (ii) changes in financial markets, interest
rates and foreign currency exchange rates, (iii) increased or unanticipated
competition for our properties, (iv) risks associated with acquisitions, dispositions
and development of properties, (v) maintenance of real estate investment trust
(“REIT”) status and tax structuring, (vi) availability of financing and capital, the
levels of debt that we maintain and our credit ratings, (vii) risks related to our
investments in our co-investment ventures and funds, including our ability to
establish new co-investment ventures and funds, (viii) risks of doing business
internationally, including currency risks, (ix) environmental uncertainties, including
risks of natural disasters, and (x) those additional factors discussed in reports filed
with the Securities and Exchange Commission by Prologis under the heading “Risk
Factors.” Prologis undertakes no duty to update any forward-looking statements
appearing in this document.
MEDIA CONTACTS
Tracy Ward, Tel: +1 415 733 9565, tward@prologis.com, San
Francisco Nina Beizai, Tel: +1 415 733 9493,
nbeizai@prologis.com, San Francisco
|
|
|
Highlights
Company Profile
Supplemental 1Q 2015
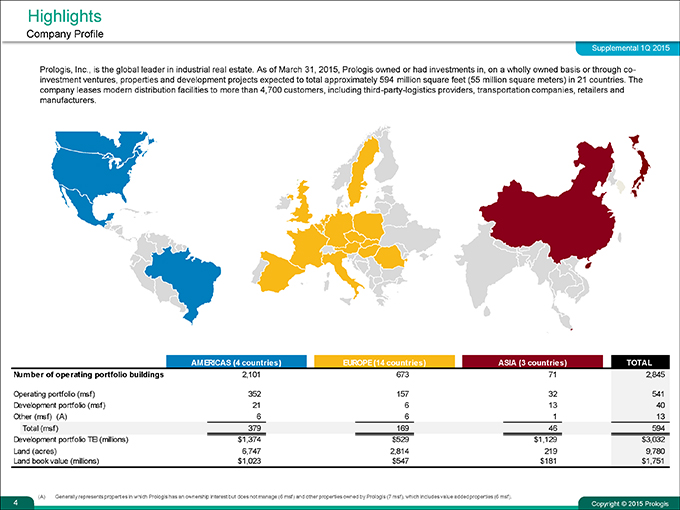
Prologis, Inc., is the global leader in industrial real estate. As of March 31, 2015, Prologis owned or had investments in, on a wholly owned basis or through co-investment ventures, properties and development projects expected to total approximately 594 million square feet (55 million square meters) in 21 countries. The company leases modern distribution facilities to more than 4,700 customers, including third-party-logistics providers, transportation companies, retailers and manufacturers.
AMERICAS (4 countries) EUROPE (14 countries) ASIA (3 countries) TOTAL
Number of operating portfolio buildings 2,101 673 71 2,845
Operating portfolio (msf) 352 157 32 541
Development portfolio (msf) 21 6 13 40
Other (msf) (A) 6 6 1 13
Total (msf) 379 169 46 594
Development portfolio TEI (millions) $1,374 $529 $1,129 $3,032
Land (acres) 6,747 2,814 219 9,780
Land book value (millions) $1,023 $547 $181 $1,751
(A) Generally represents properties in which Prologis has an ownership interest but does not manage (6 msf) and other properties owned by Prologis (7 msf), which includes value added properties (6 msf).
Copyright © 2015 Prologis
4
|
|
Highlights
Company Performance
Supplemental 1Q 2015
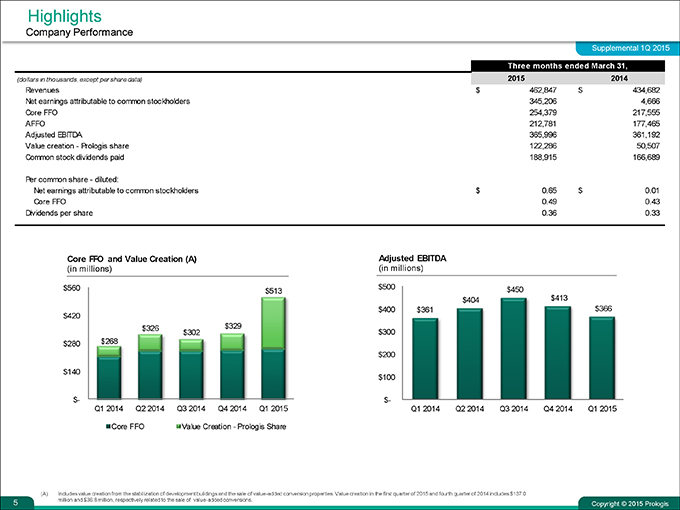
Three months ended March 31,
(dollars in thousands, except per share data) 2015 2014
Revenues $ 462,847 $ 434,682
Net earnings attributable to common stockholders 345,206 4,666
Core FFO 254,379 217,555
AFFO 212,781 177,465
Adjusted EBITDA 365,996 361,192
Value creation—Prologis share 122,286 50,507
Common stock dividends paid 188,915 166,689
Per common share—diluted:
Net earnings attributable to common stockholders $ 0.65 $ 0.01
Core FFO 0.49 0.43
Dividends per share 0.36 0.33
Core FFO and Value Creation (A) Adjusted EBITDA
(in millions)(in millions)
$560 $513 $500 $450
$404 $413
$400 $361 $366
$420
$326 $329
$302 $300
$280 $268
$200
$140
$100
$- $-
Q1 2014 Q2 2014 Q3 2014 Q4 2014 Q1 2015 Q1 2014 Q2 2014 Q3 2014 Q4 2014 Q1 2015
Core FFO Value Creation—Prologis Share
(A) Includes value creation from the stabilization of development buildings and the sale of value-added conversion properties. Value creation in the first quarter of 2015 and fourth quarter of 2014 includes $137.0 million and $36.8 million, respectively related to the sale of value-added conversions.
Copyright © 2015 Prologis
5
|
|
Highlights
Company Performance
(in millions) Supplemental 1Q 2015
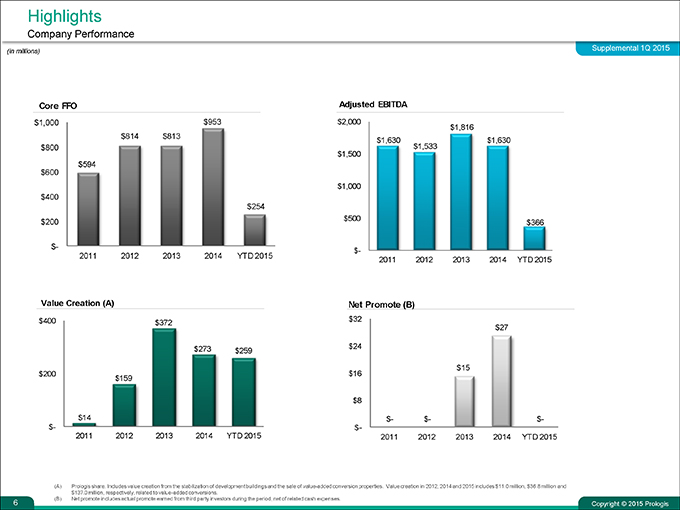
Core FFO Adjusted EBITDA
$1,000 $953 $2,000 $1,816
$814 $813 $1,630 $1,630
$800 $1,533
$1,500
$594
$600
$1,000
$400
$254
$200 $500 $366
$- $-
2011 2012 2013 2014 YTD 2015 2011 2012 2013 2014 YTD 2015
Value Creation (A) Net Promote (B)
$400 $372 $32 $27
$273 $259 $24
$15
$ $16
$8
$- $- $-
$-
YTD 2015 2011 2012 2013 2014 YTD 2015
(A) Prologis share. Includes value creation from the stabilization of development buildings and the sale of value-added conversion properties. Value creation in 2012, 2014 and 2015 includes $11.0 million, $36.8 million and $137.0 million, respectively, related to value-added conversions.
(B) Net promote includes actual promote earned from third party investors during the period, net of related cash expenses.
Copyright © 2015 Prologis
6
|
|
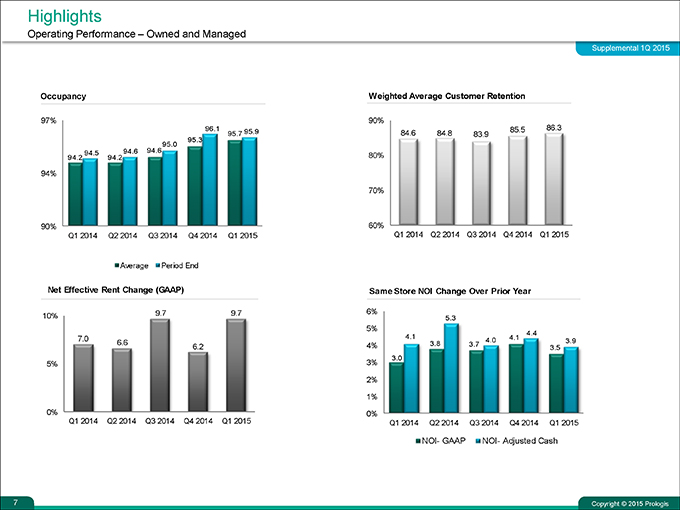
Highlights
Operating Performance – Owned and Managed
Supplemental 1Q 2015
Occupancy Weighted Average Customer Retention
97% 90%
96.1 95.7 95.9 84.6 84.8 83.9 85.5 86.3
95.0 95.3
94.5 94.6 94.6
94.2 94.2 80%
94%
70%
90% 60%
Q1 2014 Q2 2014 Q3 2014 Q4 2014 Q1 2015 Q1 2014 Q2 2014 Q3 2014 Q4 2014 Q1 2015
Average Period End
Net Effective Rent Change (GAAP) Same Store NOI Change Over Prior Year
9.7 9.7 6%
10% 5.3
5% 4.4
7.0 4.1 4.0 4.1 3.9
6.6 6.2 4% 3.8 3.7 3.5
3.0
5% 3%
2%
1%
0%
015 Q1 2014 Q2 2014 Q3 2014 Q4 2014 Q1 2015
NOI- GAAP NOI- Adjusted Cash
Copyright © 2015 Prologis
7
|
|
Copyright © 2015 Prologis Supplemental 1Q 2015
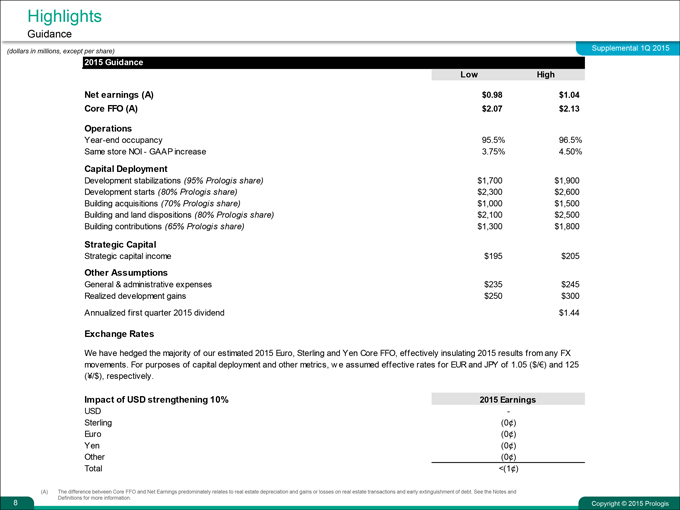
Highlights
Guidance
(A)The difference between Core FFO and Net Earnings predominately relates to real estate depreciation and gains or losses on real estate transactions and early extinguishment of debt. See the Notes and Definitions for more information.
(dollars in millions, except per share) 2015 Guidance LowHighNet earnings (A)$0.98$1.04Core FFO (A)$2.07$2.13OperationsYear-end occupancy95.5%96.5%Same store NOI - GAAP increase3.75%4.50%Capital DeploymentDevelopment stabilizations (95% Prologis share)$1,700$1,900Development starts (80% Prologis share)$2,300$2,600Building acquisitions (70% Prologis share)$1,000$1,500Building and land dispositions (80% Prologis share)$2,100$2,500Building contributions (65% Prologis share)$1,300$1,800Strategic CapitalStrategic capital income$195$205Other AssumptionsGeneral & administrative expenses$235$245Annualized first quarter 2015 dividend$1.44Exchange RatesImpact of USD strengthening 10%2015 EarningsUSD-Sterling(0¢)Euro(0¢)Yen(0¢)Other(0¢)Total<(1¢)We have hedged the majority of our estimated 2015 Euro, Sterling and Yen Core FFO, effectively insulating 2015 results from any FX movements. For purposes of capital deployment and other metrics, we assumed effective rates for EUR and JPY of 1.05 ($/¬) and 125 (¥/$), respectively.
8
|
|
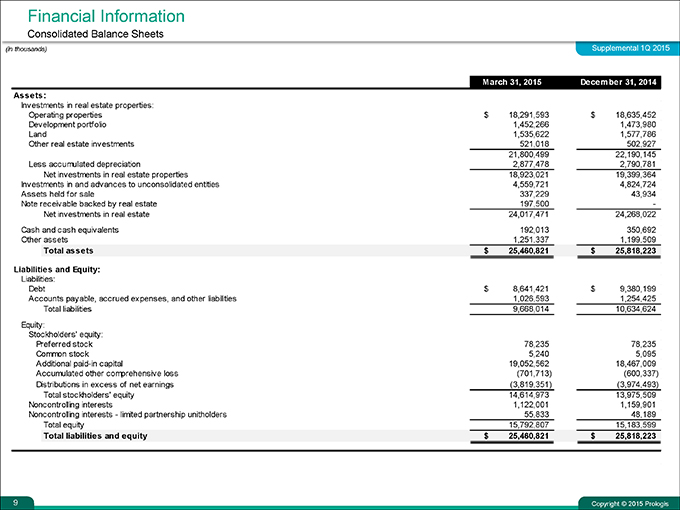
Financial Information
Consolidated Balance Sheets
(in thousands) Supplemental 1Q 2015
March 31, 2015 December 31, 2014
Assets:
Investments in real estate properties:
Operating properties $ 18,291,593 $ 18,635,452
Development portfolio 1,452,266 1,473,980
Land 1,535,622 1,577,786
Other real estate investments 521,018 502,927
21,800,499 22,190,145
Less accumulated depreciation 2,877,478 2,790,781
Net investments in real estate properties 18,923,021 19,399,364
Investments in and advances to unconsolidated entities 4,559,721 4,824,724
Assets held for sale 337,229 43,934
Note receivable backed by real estate 197,500 -
Net investments in real estate 24,017,471 24,268,022
Cash and cash equivalents 192,013 350,692
Other assets 1,251,337 1,199,509
Total assets $ 25,460,821 $ 25,818,223
Liabilities and Equity:
Liabilities:
Debt $ 8,641,421 $ 9,380,199
Accounts payable, accrued expenses, and other liabilities 1,026,593 1,254,425
Total liabilities 9,668,014 10,634,624
Equity:
Stockholders’ equity:
Preferred stock 78,235 78,235
Common stock 5,240 5,095
Additional paid-in capital 19,052,562 18,467,009
Accumulated other comprehensive loss (701,713) (600,337)
Distributions in excess of net earnings (3,819,351) (3,974,493)
Total stockholders’ equity 14,614,973 13,975,509
Noncontrolling interests 1,122,001 1,159,901
Noncontrolling interests—limited partnership unitholders 55,833 48,189
Total equity 15,792,807 15,183,599
Total liabilities and equity $ 25,460,821 $ 25,818,223
Copyright © 2015 Prologis
9
|
|
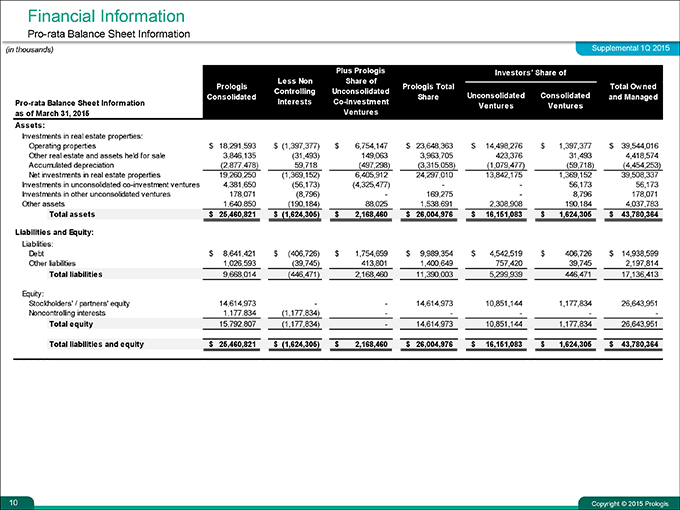
Financial Information
Pro-rata Balance Sheet Information
(in thousands) Supplemental 1Q 2015
Plus Prologis Investors’ Share of
Less Non Share of
Prologis Prologis Total Total Owned
Controlling Unconsolidated
Consolidated Share Unconsolidated Consolidated and Managed
Pro-rata Balance Sheet Information Interests Co-Investment Ventures Ventures
as of March 31, 2015 Ventures
Assets:
Investments in real estate properties:
Operating properties $ 18,291,593 $ (1,397,377) $ 6,754,147 $ 23,648,363 $ 14,498,276 $ 1,397,377 $ 39,544,016
Other real estate and assets held for sale 3,846,135 (31,493) 149,063 3,963,705 423,376 31,493 4,418,574
Accumulated depreciation(2,877,478) 59,718 (497,298) (3,315,058) (1,079,477) (59,718) (4,454,253)
Net investments in real estate properties 19,260,250 (1,369,152) 6,405,912 24,297,010 13,842,175 1,369,152 39,508,337
Investments in unconsolidated co-investment ventures 4,381,650 (56,173) (4,325,477) — 56,173 56,173
Investments in other unconsolidated ventures 178,071 (8,796) — 169,275 — 8,796 178,071
Other assets 1,640,850 (190,184) 88,025 1,538,691 2,308,908 190,184 4,037,783
Total assets $ 25,460,821 $ (1,624,305) $ 2,168,460 $ 26,004,976 $ 16,151,083 $ 1,624,305 $ 43,780,364
Liabilities and Equity:
Liabilities:
Debt $ 8,641,421 $ (406,726) $ 1,754,659 $ 9,989,354 $ 4,542,519 $ 406,726 $ 14,938,599
Other liabilities 1,026,593 (39,745) 413,801 1,400,649 757,420 39,745 2,197,814
Total liabilities 9,668,014 (446,471) 2,168,460 11,390,003 5,299,939 446,471 17,136,413
Equity:
Stockholders’ / partners’ equity 14,614,973 — 14,614,973 10,851,144 1,177,834 26,643,951
Noncontrolling interests 1,177,834(1,177,834)
Total equity 15,792,807 (1,177,834) — 14,614,973 10,851,144 1,177,834 26,643,951
Total liabilities and equity $ 25,460,821 $ (1,624,305) $ 2,168,460 $ 26,004,976 $ 16,151,083 $ 1,624,305 $ 43,780,364
Copyright © 2015 Prologis
10
|
|
Financial Information
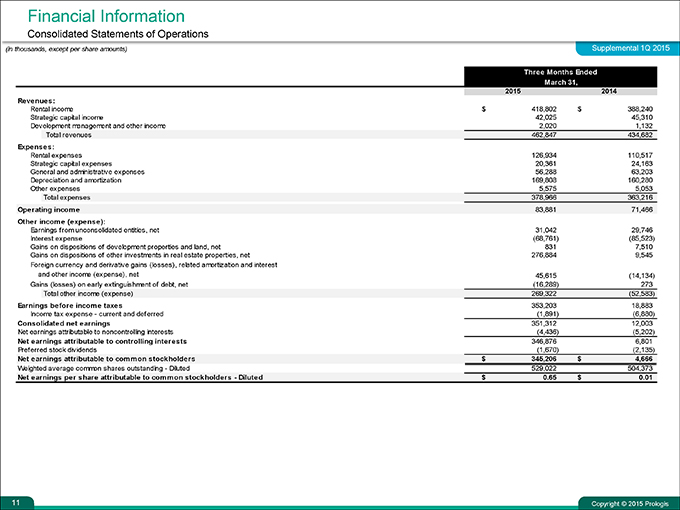
Consolidated Statements of Operations
(in thousands, except per share amounts) Supplemental 1Q 2015
Three Months Ended
March 31,
2015 2014
Revenues:
Rental income $ 418,802 $ 388,240
Strategic capital income 42,025 45,310
Development management and other income 2,020 1,132
Total revenues 462,847 434,682
Expenses:
Rental expenses 126,934 110,517
Strategic capital expenses 20,361 24,163
General and administrative expenses 56,288 63,203
Depreciation and amortization 169,808 160,280
Other expenses 5,575 5,053
Total expenses 378,966 363,216
Operating income 83,881 71,466
Other income (expense):
Earnings from unconsolidated entities, net 31,042 29,746
Interest expense (68,761) (85,523)
Gains on dispositions of development properties and land, net 831 7,510
Gains on dispositions of other investments in real estate properties, net 276,884 9,545
Foreign currency and derivative gains (losses), related amortization and interest
and other income (expense), net 45,615 (14,134)
Gains (losses) on early extinguishment of debt, net (16,289) 273
Total other income (expense) 269,322 (52,583)
Earnings before income taxes 353,203 18,883
Income tax expense—current and deferred (1,891) (6,880)
Consolidated net earnings 351,312 12,003
Net earnings attributable to noncontrolling interests (4,436) (5,202)
Net earnings attributable to controlling interests 346,876 6,801
Preferred stock dividends (1,670) (2,135)
Net earnings attributable to common stockholders $ 345,206 $ 4,666
Weighted average common shares outstanding—Diluted 529,022 504,373
Net earnings per share attributable to common stockholders—Diluted $ 0.65 $ 0.01
Copyright © 2015 Prologis
11
|
|
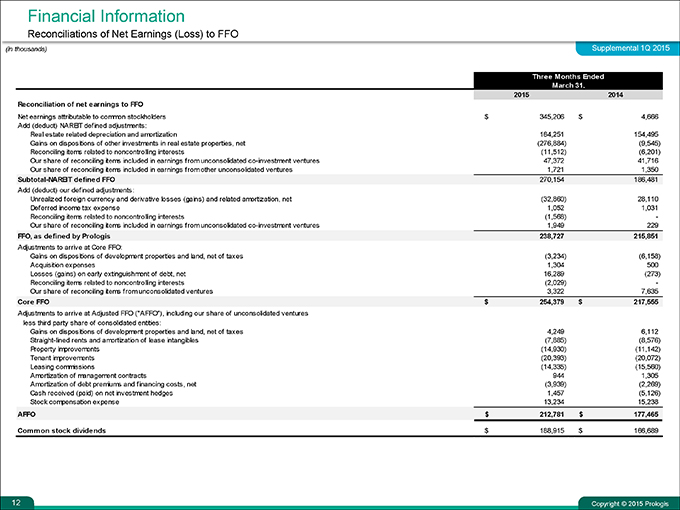
Financial Information
Reconciliations of Net Earnings (Loss) to FFO
(in thousands) Supplemental 1Q 2015
Three Months Ended
March 31,
2015 2014
Reconciliation of net earnings to FFO
Net earnings attributable to common stockholders $ 345,206 $ 4,666
Add (deduct) NAREIT defined adjustments:
Real estate related depreciation and amortization 164,251 154,495
Gains on dispositions of other investments in real estate properties, net(276,884)(9,545)
Reconciling items related to noncontrolling interests(11,512)(6,201)
Our share of reconciling items included in earnings from unconsolidated co-investment ventures 47,372 41,716
Our share of reconciling items included in earnings from other unconsolidated ventures 1,721 1,350
Subtotal-NAREIT defined FFO 270,154 186,481
Add (deduct) our defined adjustments:
Unrealized foreign currency and derivative losses (gains) and related amortization, net(32,860) 28,110
Deferred income tax expense 1,052 1,031
Reconciling items related to noncontrolling interests(1,568) -
Our share of reconciling items included in earnings from unconsolidated co-investment ventures 1,949 229
FFO, as defined by Prologis 238,727 215,851
Adjustments to arrive at Core FFO:
Gains on dispositions of development properties and land, net of taxes(3,234)(6,158)
Acquisition expenses 1,304 500
Losses (gains) on early extinguishment of debt, net 16,289(273)
Reconciling items related to noncontrolling interests(2,029) -
Our share of reconciling items from unconsolidated ventures 3,322 7,635
Core FFO $ 254,379 $ 217,555
Adjustments to arrive at Adjusted FFO (“AFFO”), including our share of unconsolidated ventures
less third party share of consolidated entities:
Gains on dispositions of development properties and land, net of taxes 4,249 6,112
Straight-lined rents and amortization of lease intangibles(7,885)(8,576)
Property improvements(14,930)(11,142)
Tenant improvements(20,393)(20,072)
Leasing commissions(14,335)(15,560)
Amortization of management contracts 944 1,305
Amortization of debt premiums and financing costs, net(3,939)(2,269)
Cash received (paid) on net investment hedges 1,457(5,126)
Stock compensation expense 13,234 15,238
AFFO $ 212,781 $ 177,465
Common stock dividends $ 188,915 $ 166,689
Copyright © 2015 Prologis
12
|
|
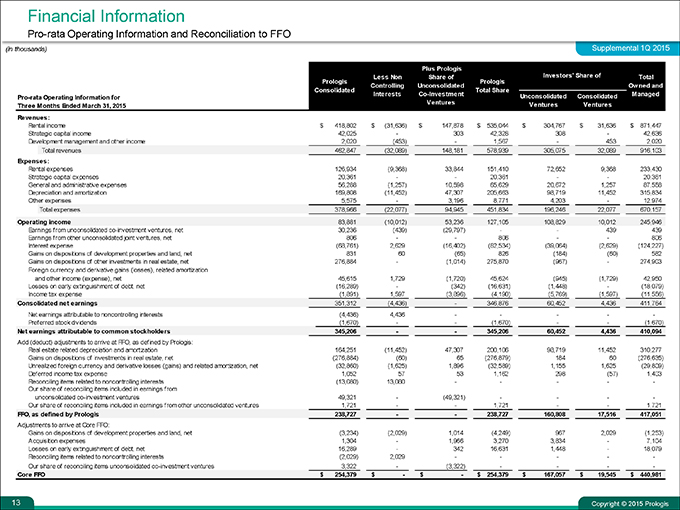
Financial Information
Pro-rata Operating Information and Reconciliation to FFO
(in thousands) Supplemental 1Q 2015
Plus Prologis
Less Non Share of Investors’ Share of Total
Prologis Prologis
Controlling Unconsolidated Owned and
Consolidated Total Share
Pro-rata Operating Information for Interests Co-Investment Unconsolidated Consolidated Managed
Three Months Ended March 31, 2015 Ventures Ventures Ventures
Revenues:
Rental income $ 418,802 $ (31,636) $ 147,878 $ 535,044 $ 304,767 $ 31,636 $ 871,447
Strategic capital income 42,025 — 303 42,328 308 — 42,636
Development management and other income 2,020 (453) — 1,567 — 453 2,020
Total revenues 462,847 (32,089) 148,181 578,939 305,075 32,089 916,103
Expenses:
Rental expenses 126,934 (9,368) 33,844 151,410 72,652 9,368 233,430
Strategic capital expenses 20,361 — 20,361 — 20,361
General and administrative expenses 56,288 (1,257) 10,598 65,629 20,672 1,257 87,558
Depreciation and amortization 169,808 (11,452) 47,307 205,663 98,719 11,452 315,834
Other expenses 5,575 — 3,196 8,771 4,203 — 12,974
Total expenses 378,966(22,077) 94,945 451,834 196,246 22,077 670,157
Operating income 83,881(10,012) 53,236 127,105 108,829 10,012 245,946
Earnings from unconsolidated co-investment ventures, net 30,236 (439) (29,797) — 439 439
Earnings from other unconsolidated joint ventures, net 806 — 806 — 806
Interest expense (68,761) 2,629 (16,402) (82,534) (39,064) (2,629) (124,227)
Gains on dispositions of development properties and land, net 831 60 (65) 826 (184) (60) 582
Gains on dispositions of other investments in real estate, net 276,884 — (1,014) 275,870 (967) — 274,903
Foreign currency and derivative gains (losses), related amortization
and other income (expense), net 45,615 1,729 (1,720) 45,624 (945) (1,729) 42,950
Losses on early extinguishment of debt, net (16,289) — (342) (16,631) (1,448) — (18,079)
Income tax expense (1,891) 1,597 (3,896) (4,190) (5,769) (1,597) (11,556)
Consolidated net earnings 351,312 (4,436) — 346,876 60,452 4,436 411,764
Net earnings attributable to noncontrolling interests (4,436) 4,436
Preferred stock dividends (1,670) — (1,670) — (1,670)
Net earnings attributable to common stockholders 345,206 — 345,206 60,452 4,436 410,094
Add (deduct) adjustments to arrive at FFO, as defined by Prologis:
Real estate related depreciation and amortization 164,251 (11,452) 47,307 200,106 98,719 11,452 310,277
Gains on dispositions of investments in real estate, net (276,884) (60) 65 (276,879) 184 60 (276,635)
Unrealized foreign currency and derivative losses (gains) and related amortization, net (32,860) (1,625) 1,896 (32,589) 1,155 1,625 (29,809)
Deferred income tax expense 1,052 57 53 1,162 298 (57) 1,403
Reconciling items related to noncontrolling interests (13,080) 13,080
Our share of reconciling items included in earnings from
unconsolidated co-investment ventures 49,321 - (49,321)
Our share of reconciling items included in earnings from other unconsolidated ventures 1,721 — 1,721 — 1,721
FFO, as defined by Prologis 238,727 — 238,727 160,808 17,516 417,051
Adjustments to arrive at Core FFO:
Gains on dispositions of development properties and land, net (3,234) (2,029) 1,014 (4,249) 967 2,029 (1,253)
Acquisition expenses 1,304—1,966 3,270 3,834—7,104
Losses on early extinguishment of debt, net 16,289—342 16,631 1,448—18,079
Reconciling items related to noncontrolling interests (2,029) 2,029
Our share of reconciling items unconsolidated co-investment ventures 3,322 - (3,322)
Core FFO $ 254,379 $—$—$ 254,379 $ 167,057 $ 19,545 $ 440,981
Copyright © 2015 Prologis
13
|
|
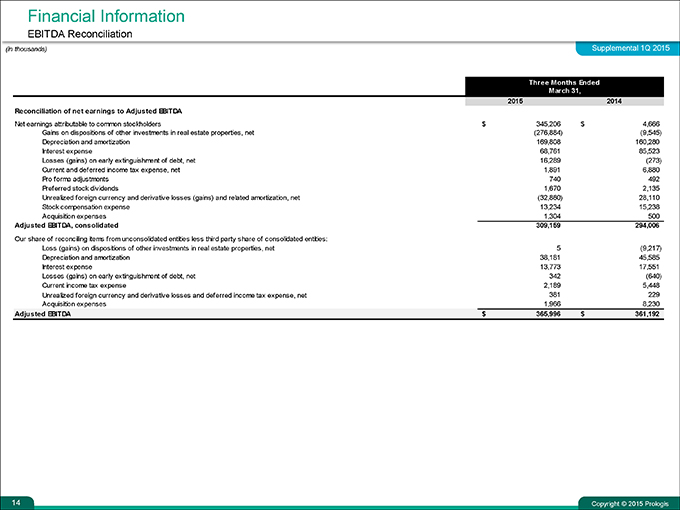
Financial Information
EBITDA Reconciliation
(in thousands) Supplemental 1Q 2015
Three Months Ended
March 31,
2015 2014
Reconciliation of net earnings to Adjusted EBITDA
Net earnings attributable to common stockholders $ 345,206 $ 4,666
Gains on dispositions of other investments in real estate properties, net (276,884) (9,545)
Depreciation and amortization 169,808 160,280
Interest expense 68,761 85,523
Losses (gains) on early extinguishment of debt, net 16,289 (273)
Current and deferred income tax expense, net 1,891 6,880
Pro forma adjustments 740 492
Preferred stock dividends 1,670 2,135
Unrealized foreign currency and derivative losses (gains) and related amortization, net (32,860) 28,110
Stock compensation expense 13,234 15,238
Acquisition expenses 1,304 500
Adjusted EBITDA, consolidated 309,159 294,006
Our share of reconciling items from unconsolidated entities less third party share of consolidated entities:
Loss (gains) on dispositions of other investments in real estate properties, net 5 (9,217)
Depreciation and amortization 38,181 45,585
Interest expense 13,773 17,551
Losses (gains) on early extinguishment of debt, net 342 (640)
Current income tax expense 2,189 5,448
Unrealized foreign currency and derivative losses and deferred income tax expense, net 381 229
Acquisition expenses 1,966 8,230
Adjusted EBITDA $ 365,996 $ 361,192
Copyright © 2015 Prologis
14
|
|
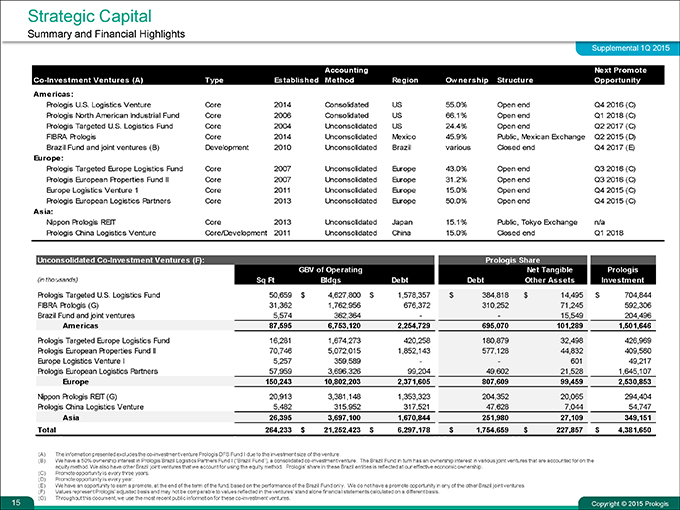
Strategic Capital
Summary and Financial Highlights
Supplemental 1Q 2015
Accounting Next Promote
Co-Investment Ventures (A) Type Established Method Region Ownership Structure Opportunity
Americas:
Prologis U.S. Logistics Venture Core 2014 Consolidated US 55.0% Open end Q4 2016 (C)
Prologis North American Industrial Fund Core 2006 Consolidated US 66.1% Open end Q1 2018 (C)
Prologis Targeted U.S. Logistics Fund Core 2004 Unconsolidated US 24.4% Open end Q2 2017 (C)
FIBRA Prologis Core 2014 Unconsolidated Mexico 45.9% Public, Mexican Exchange Q2 2015 (D)
Brazil Fund and joint ventures (B) Development 2010 Unconsolidated Brazil various Closed end Q4 2017 (E)
Europe:
Prologis Targeted Europe Logistics Fund Core 2007 Unconsolidated Europe 43.0% Open end Q3 2016 (C)
Prologis European Properties Fund II Core 2007 Unconsolidated Europe 31.2% Open end Q3 2016 (C)
Europe Logistics Venture 1 Core 2011 Unconsolidated Europe 15.0% Open end Q4 2015 (C)
Prologis European Logistics Partners Core 2013 Unconsolidated Europe 50.0% Open end Q4 2015 (C)
Asia:
Nippon Prologis REIT Core 2013 Unconsolidated Japan 15.1% Public, Tokyo Exchange n/a
Prologis China Logistics Venture Core/Development 2011 Unconsolidated China 15.0% Closed end Q1 2018
Unconsolidated Co-Investment Ventures (F): Prologis Share
GBV of Operating Net Tangible Prologis
(in thousands) Sq Ft Bldgs Debt Debt Other Assets Investment
Prologis Targeted U.S. Logistics Fund 50,659 $ 4,627,800 $ 1,578,357 $ 384,818 $ 14,495 $ 704,844
FIBRA Prologis (G) 31,362 1,762,956 676,372 310,252 71,245 592,306
Brazil Fund and joint ventures 5,574 362,364 — 15,549 204,496
Americas 87,595 6,753,120 2,254,729 695,070 101,289 1,501,646
Prologis Targeted Europe Logistics Fund 16,281 1,674,273 420,258 180,879 32,498 426,969
Prologis European Properties Fund II 70,746 5,072,015 1,852,143 577,128 44,832 409,560
Europe Logistics Venture I 5,257 359,589 — 601 49,217
Prologis European Logistics Partners 57,959 3,696,326 99,204 49,602 21,528 1,645,107
Europe 150,243 10,802,203 2,371,605 807,609 99,459 2,530,853
Nippon Prologis REIT (G) 20,913 3,381,148 1,353,323 204,352 20,065 294,404
Prologis China Logistics Venture 5,482 315,952 317,521 47,628 7,044 54,747
Asia 26,395 3,697,100 1,670,844 251,980 27,109 349,151
Total 264,233 $ 21,252,423 $ 6,297,178 $ 1,754,659 $ 227,857 $ 4,381,650
(A) The information presented excludes the co-investment venture Prologis DFS Fund I due to the investment size of the venture.
(B) We have a 50% ownership interest in Prologis Brazil Logistics Partners Fund I (“Brazil Fund”), a consolidated co-investment venture. The Brazil Fund in turn has an ownership interest in various joint ventures that are accounted for on the equity method. We also have other Brazil joint ventures that we account for using the equity method. Prologis’ share in these Brazil entities is reflected at our effective economic ownership.
(C) Promote opportunity is every three years. (D) Promote opportunity is every year.
(E) We have an opportunity to earn a promote, at the end of the term of the fund, based on the performance of the Brazil Fund only. We do not have a promote opportunity in any of the other Brazil joint ventures.
(F) Values represent Prologis’ adjusted basis and may not be comparable to values reflected in the ventures’ stand alone financial statements calculated on a different basis.
(G) Throughout this document, we use the most recent public information for these co-investment ventures.
Copyright © 2015 Prologis
15
|
|
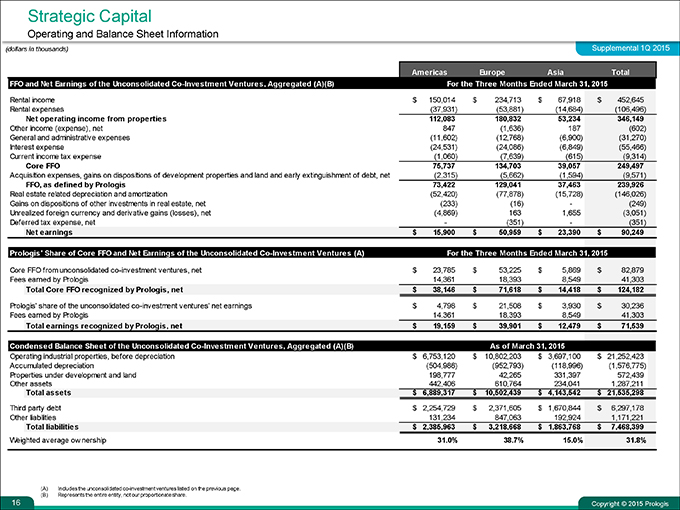
Strategic Capital
Operating and Balance Sheet Information
(dollars in thousands) Supplemental 1Q 2015
Americas Europe Asia Total
FFO and Net Earnings of the Unconsolidated Co-Investment Ventures, Aggregated (A)(B) For the Three Months Ended March 31, 2015
Rental income $ 150,014 $ 234,713 $ 67,918 $ 452,645
Rental expenses(37,931)(53,881)(14,684)(106,496)
Net operating income from properties 112,083 180,832 53,234 346,149
Other income (expense), net 847(1,636) 187(602)
General and administrative expenses(11,602)(12,768)(6,900)(31,270)
Interest expense(24,531)(24,086)(6,849)(55,466)
Current income tax expense(1,060)(7,639)(615)(9,314)
Core FFO 75,737 134,703 39,057 249,497
Acquisition expenses, gains on dispositions of development properties and land and early extinguishment of debt, net(2,315)(5,662)(1,594)(9,571)
FFO, as defined by Prologis 73,422 129,041 37,463 239,926
Real estate related depreciation and amortization(52,420)(77,878)(15,728)(146,026)
Gains on dispositions of other investments in real estate, net(233)(16) -(249)
Unrealized foreign currency and derivative gains (losses), net(4,869) 163 1,655(3,051)
Deferred tax expense, net -(351) -(351)
Net earnings $ 15,900 $ 50,959 $ 23,390 $ 90,249
Prologis’ Share of Core FFO and Net Earnings of the Unconsolidated Co-Investment Ventures (A) For the Three Months Ended March 31, 2015
Core FFO from unconsolidated co-investment ventures, net $ 23,785 $ 53,225 $ 5,869 $ 82,879
Fees earned by Prologis 14,361 18,393 8,549 41,303
Total Core FFO recognized by Prologis, net $ 38,146 $ 71,618 $ 14,418 $ 124,182
Prologis’ share of the unconsolidated co-investment ventures’ net earnings $ 4,798 $ 21,508 $ 3,930 $ 30,236
Fees earned by Prologis 14,361 18,393 8,549 41,303
Total earnings recognized by Prologis, net $ 19,159 $ 39,901 $ 12,479 $ 71,539
Condensed Balance Sheet of the Unconsolidated Co-Investment Ventures, Aggregated (A)(B) As of March 31, 2015
Operating industrial properties, before depreciation $ 6,753,120 $ 10,802,203 $ 3,697,100 $ 21,252,423
Accumulated depreciation(504,986)(952,793)(118,996)(1,576,775)
Properties under development and land 198,777 42,265 331,397 572,439
Other assets 442,406 610,764 234,041 1,287,211
Total assets $ 6,889,317 $ 10,502,439 $ 4,143,542 $ 21,535,298
Third party debt $ 2,254,729 $ 2,371,605 $ 1,670,844 $ 6,297,178
Other liabilities 131,234 847,063 192,924 1,171,221
Total liabilities $ 2,385,963 $ 3,218,668 $ 1,863,768 $ 7,468,399
Weighted average ow nership 31.0% 38.7% 15.0% 31.8%
(A) Includes the unconsolidated co-investment ventures listed on the previous page. (B) Represents the entire entity, not our proportionate share.
Copyright © 2015 Prologis
16
|
|
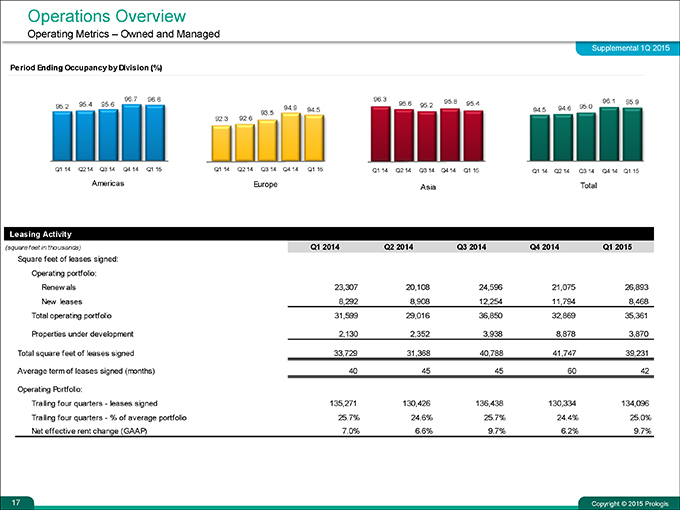
Operations Overview
Operating Metrics – Owned and Managed
Supplemental 1Q 2015
Period Ending Occupancy by Division (%)
Leasing Activity
(square feet in thousands) Q1 2014 Q2 2014 Q3 2014 Q4 2014 Q1 2015
Square feet of leases signed:
Operating portfolio:
Renew als 23,307 20,108 24,596 21,075 26,893
New leases 8,292 8,908 12,254 11,794 8,468
Total operating portfolio 31,599 29,016 36,850 32,869 35,361
Properties under development 2,130 2,352 3,938 8,878 3,870
Total square feet of leases signed 33,729 31,368 40,788 41,747 39,231
Average term of leases signed (months) 40 45 45 60 42
Operating Portfolio:
Trailing four quarters—leases signed 135,271 130,426 136,438 130,334 134,096
Trailing four quarters—% of average portfolio 25.7% 24.6% 25.7% 24.4% 25.0%
Net effective rent change (GAAP) 7.0% 6.6% 9.7% 6.2% 9.7%
Copyright © 2015 Prologis
17
|
|
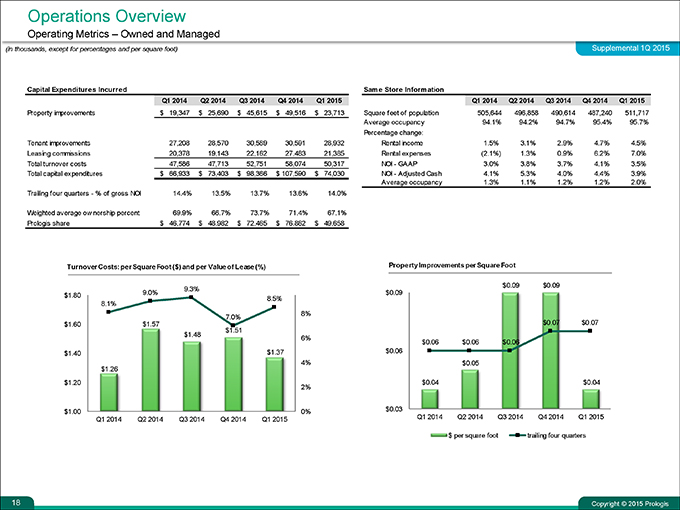
Operations Overview
Operating Metrics – Owned and Managed
(in thousands, except for percentages and per square foot) Supplemental 1Q 2015
Capital Expenditures Incurred
Q1 2014 Q2 2014 Q3 2014 Q4 2014 Q1 2015
Property improvements $ 19,347 $ 25,690 $ 45,615 $ 49,516 $ 23,713
Tenant improvements 27,208 28,570 30,589 30,591 28,932
Leasing commissions 20,378 19,143 22,162 27,483 21,385
Total turnover costs 47,586 47,713 52,751 58,074 50,317
Total capital expenditures $ 66,933 $ 73,403 $ 98,366 $ 107,590 $ 74,030
Trailing four quarters—% of gross NOI 14.4% 13.5% 13.7% 13.6% 14.0%
Weighted average ow nership percent 69.9% 66.7% 73.7% 71.4% 67.1%
Prologis share $ 46,774 $ 48,982 $ 72,465 $ 76,862 $ 49,658
Same Store Information
Q1 2014 Q2 2014 Q3 2014 Q4 2014 Q1 2015
Square feet of population 505,644 496,858 490,614 487,240 511,717
Average occupancy 94.1% 94.2% 94.7% 95.4% 95.7%
Percentage change:
Rental income 1.5% 3.1% 2.9% 4.7% 4.5%
Rental expenses(2.1%) 1.3% 0.9% 6.2% 7.0%
NOI—GAAP 3.0% 3.8% 3.7% 4.1% 3.5%
NOI—Adjusted Cash 4.1% 5.3% 4.0% 4.4% 3.9%
Average occupancy 1.3% 1.1% 1.2% 1.2% 2.0%
Turnover Costs: per Square Foot ($) and per Value of Lease (%)
Property Improvements per Square Foot
Copyright © 2015 Prologis
18
|
|
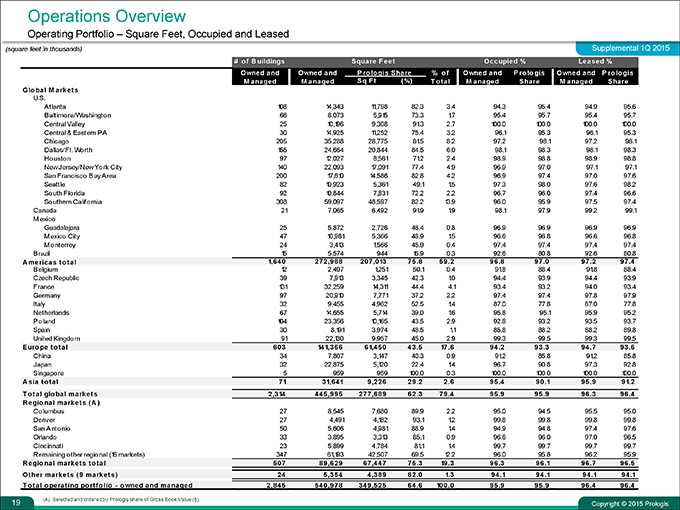
Operations Overview
Operating Portfolio – Square Feet, Occupied and Leased
(square feet in thousands) Supplemental 1Q 2015
# o f B uildings Square F eet Occupied % Leased %
Owned and Owned and P ro lo gis Share% o f Owned and P ro lo gis Owned and P ro lo gis
Managed M anaged Sq F t(%) T o tal M anaged Share M anaged Share
Global M arkets U.S.
Atlanta 108 14,343 11,798 82.3 3.4 94.3 95.4 94.9 95.6
Baltimore/Washington 66 8,073 5,915 73.3 1.7 95.4 95.7 95.4 95.7
Central Valley 25 10,196 9,308 91.3 2.7 100.0 100.0 100.0 100.0
Central & Eastern PA 30 14,925 11,252 75.4 3.2 96.1 95.3 96.1 95.3
Chicago 205 35,288 28,775 81.5 8.2 97.2 98.1 97.2 98.1
Dallas/Ft. Worth 155 24,664 20,844 84.5 6.0 98.1 98.3 98.1 98.3
Houston 97 12,027 8,561 71.2 2.4 98.9 98.8 98.9 98.8
New Jersey/New York City 140 22,093 17,091 77.4 4.9 96.9 97.0 97.1 97.1
San Francisco Bay Area 200 17,610 14,586 82.8 4.2 96.9 97.4 97.0 97.6
Seattle 82 10,923 5,361 49.1 1.5 97.3 98.0 97.6 98.2
South Florida 92 10,844 7,831 72.2 2.2 96.7 96.0 97.4 96.6
Southern California 308 59,097 48,597 82.2 13.9 96.0 95.9 97.5 97.4
Canada 21 7,065 6,492 91.9 1.9 98.1 97.9 99.2 99.1
Mexico Guadalajara 25 5,872 2,726 46.4 0.8 96.9 96.9 96.9 96.9
Mexico City 47 10,981 5,366 48.9 1.5 96.6 96.8 96.6 96.8
Monterrey 24 3,413 1,566 45.9 0.4 97.4 97.4 97.4 97.4
Brazil 15 5,574 944 16.9 0.3 92.6 80.8 92.6 80.8
Americas to tal 1,640 272,988 207,013 75 .8 59 .2 96 .8 97 .0 97 .2 97 .4
Belgium 12 2,497 1,251 50.1 0.4 91.8 88.4 91.8 88.4
Czech Republic 39 7,913 3,345 42.3 1.0 94.4 93.9 94.4 93.9
France 131 32,259 14,311 44.4 4.1 93.4 93.2 94.0 93.4
Germany 97 20,910 7,771 37.2 2.2 97.4 97.4 97.8 97.9
Italy 32 9,455 4,962 52.5 1.4 87.0 77.8 87.0 77.8
Netherlands 67 14,655 5,714 39.0 1.6 95.8 95.1 95.9 95.2
Poland 104 23,356 10,165 43.5 2.9 92.8 93.2 93.5 93.7
Spain 30 8,191 3,974 48.5 1.1 85.8 88.2 88.2 89.8
United Kingdom 91 22,130 9,957 45.0 2.9 99.3 99.5 99.3 99.5
Euro pe to tal 603 141,366 61,450 43 .5 17 .6 94 .2 93 .3 94 .7 93 .6
China 34 7,807 3,147 40.3 0.9 91.2 85.8 91.2 85.8
Japan 32 22,875 5,120 22.4 1.4 96.7 90.8 97.3 92.8
Singapore 5 959 959 100.0 0.3 100.0 100.0 100.0 100.0
Asia to tal 71 31,641 9,226 29 .2 2 .6 95 .4 90 .1 95 .9 91.2
Total global markets 2,314 445,995 277,689 62 .3 79 .4 95 .9 95 .9 96 .3 96 .4
Regional markets(A )
Columbus 27 8,545 7,680 89.9 2.2 95.0 94.5 95.5 95.0
Denver 27 4,491 4,182 93.1 1.2 99.8 99.8 99.8 99.8
San Antonio 50 5,606 4,981 88.9 1.4 94.9 94.8 97.4 97.6
Orlando 33 3,895 3,313 85.1 0.9 96.6 96.0 97.0 96.5
Cincinnati 23 5,899 4,784 81.1 1.4 99.7 99.7 99.7 99.7
Remaining other regional (16 markets) 347 61,193 42,507 69.5 12.2 96.0 95.8 96.2 95.9
Regio nal markets to tal 507 89,629 67,447 75 .3 19 .3 96 .3 96 .1 96 .7 96 .5
Other markets (9 markets) 24 5,354 4,389 82 .0 1.3 94 .1 94 .1 94 .1 94 .1
Total operating po rtfo lio—o wned and managed 2,845 540,978 349,525 64 .6 100 .0 95 .9 95 .9 96 .4 96 .4
(A) Selected and ordered by Prologis share of Gross Book Value ($).
Copyright © 2015 Prologis
19
|
|
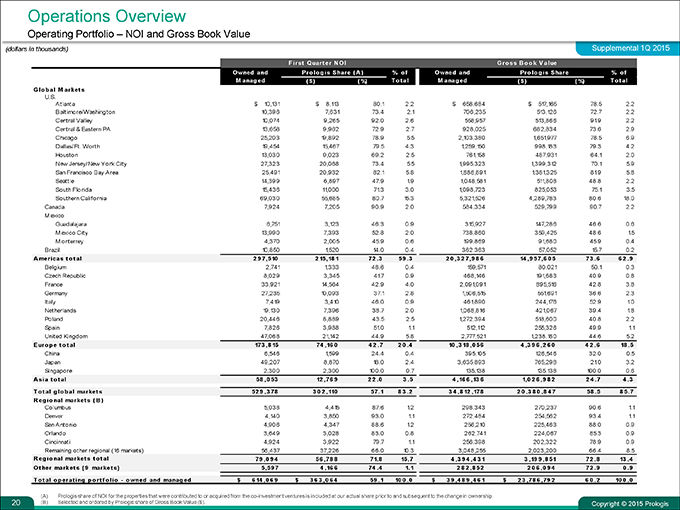
Operations Overview
Operating Portfolio – NOI and Gross Book Value
(dollars in thousands) Supplemental 1Q 2015
F irst Quart er N OI Gro ss B o o k V alue
Owned and Pro lo g is Share ( A )% o f Owned and Pro lo g is Share% o f
Managed( $)( %) Total Managed( $)( %) T o t al
Glob al Markets U.S.
Atlanta $ 10,131 $ 8,113 80.1 2.2 $ 658,684 $ 517,165 78.5 2.2
Baltimore/Washington 10,396 7,631 73.4 2.1 706,235 513,126 72.7 2.2
Central Valley 10,074 9,265 92.0 2.6 558,957 513,866 91.9 2.2
Central & Eastern PA 13,658 9,962 72.9 2.7 928,025 682,834 73.6 2.9
Chicago 25,203 19,892 78.9 5.5 2,103,380 1,651,977 78.5 6.9
Dallas/Ft. Worth 19,454 15,467 79.5 4.3 1,259,150 998,183 79.3 4.2
Houston 13,030 9,023 69.2 2.5 761,158 487,931 64.1 2.0
New Jersey/New York City 27,323 20,068 73.4 5.5 1,995,323 1,399,312 70.1 5.9
San Francisco Bay Area 25,491 20,932 82.1 5.8 1,686,891 1,381,325 81.9 5.8
Seattle 14,399 6,897 47.9 1.9 1,048,581 511,808 48.8 2.2
South Florida 15,436 11,000 71.3 3.0 1,098,723 825,053 75.1 3.5
Southern California 69,030 55,685 80.7 15.3 5,321,526 4,289,783 80.6 18.0
Canada 7,924 7,205 90.9 2.0 584,334 529,799 90.7 2.2
Mexico Guadalajara 6,751 3,123 46.3 0.9 315,927 147,286 46.6 0.6
Mexico City 13,990 7,393 52.8 2.0 738,860 359,425 48.6 1.5
Monterrey 4,370 2,005 45.9 0.6 199,869 91,680 45.9 0.4
Brazil 10,850 1,520 14.0 0.4 362,363 57,052 15.7 0.2
Americas t o t al 2 9 7,510 2 15,18 1 72 .3 59 .3 2 0 ,3 2 7,9 8 6 14 ,9 57,6 0 5 73 .6 6 2 .9
Belgium 2,741 1,333 48.6 0.4 159,571 80,021 50.1 0.3
Czech Republic 8,029 3,345 41.7 0.9 468,146 191,683 40.9 0.8
France 33,921 14,564 42.9 4.0 2,091,091 895,516 42.8 3.8
Germany 27,235 10,093 37.1 2.8 1,506,515 551,691 36.6 2.3
Italy 7,419 3,410 46.0 0.9 461,890 244,176 52.9 1.0
Netherlands 19,130 7,396 38.7 2.0 1,068,816 421,067 39.4 1.8
Poland 20,446 8,889 43.5 2.5 1,272,394 518,600 40.8 2.2
Spain 7,826 3,988 51.0 1.1 512,112 255,326 49.9 1.1
United Kingdom 47,068 21,142 44.9 5.8 2,777,521 1,238,180 44.6 5.2
Europe total 173 ,8 15 74 ,16 0 4 2 .7 2 0 .4 10 ,3 18 ,0 56 4 ,3 9 6 ,2 6 0 4 2 .6 18 .5
China 6,546 1,599 24.4 0.4 395,105 126,546 32.0 0.5
Japan 49,207 8,870 18.0 2.4 3,635,893 765,298 21.0 3.2
Singapore 2,300 2,300 100.0 0.7 135,138 135,138 100.0 0.6
Asia tot al 58 ,0 53 12 ,76 9 2 2 .0 3 .5 4 ,16 6 ,13 6 1,0 2 6 ,9 8 2 2 4 .7 4 .3
Total global market s 52 9 ,3 78 3 0 2 ,110 57.1 8 3 .2 3 4 ,8 12 ,178 2 0 ,3 8 0 ,8 4 7 58 .5 8 5.7
Regional markets ( B )
Columbus 5,038 4,415 87.6 1.2 298,343 270,237 90.6 1.1
Denver 4,140 3,850 93.0 1.1 272,484 254,562 93.4 1.1
San Antonio 4,906 4,347 88.6 1.2 256,210 225,463 88.0 0.9
Orlando 3,649 3,028 83.0 0.8 262,741 224,067 85.3 0.9
Cincinnati 4,924 3,922 79.7 1.1 256,398 202,322 78.9 0.9
Remaining other regional (16 markets) 56,437 37,226 66.0 10.3 3,048,255 2,023,200 66.4 8.5
Regional markets total 79 ,0 9 4 56 ,78 8 71.8 15.7 4 ,3 9 4 ,4 3 1 3 ,19 9 ,8 51 72 .8 13 .4
Other markets ( 9 market s) 5,59 7 4 ,16 6 74 .4 1.1 2 8 2 ,8 52 2 0 6 ,0 9 4 72 .9 0 .9
Total operating portfolio—owned and managed $ 6 14 ,0 6 9 $ 3 6 3 ,0 6 4 59 .1 10 0 .0 $ 3 9 ,4 8 9 ,4 6 1 $ 2 3 ,78 6 ,79 2 6 0 .2 10 0 .0
(A) Prologis share of NOI for the properties that were contributed to or acquired from the co-investment ventures is included at our actual share prior to and subsequent to the change in ownership.
(B) Selected and ordered by Prologis share of Gross Book Value ($).
Copyright © 2015 Prologis
20
|
|
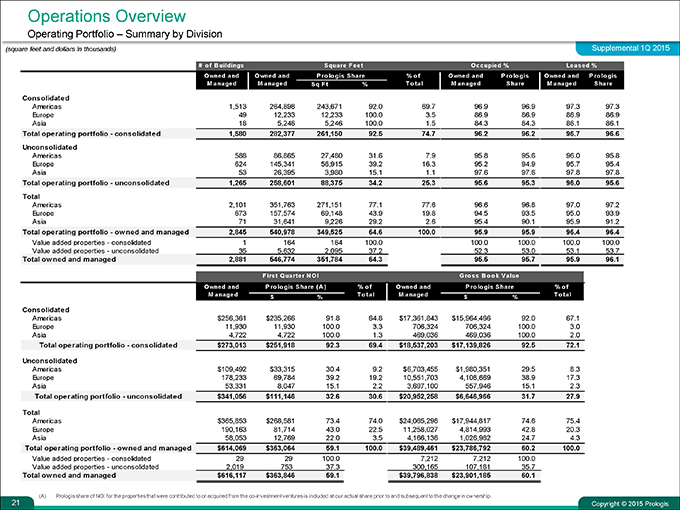
Operations Overview
Operating Portfolio – Summary by Division
(square feet and dollars in thousands) Supplemental 1Q 2015
# of Buildings Square Feet Occupied % Leased %
Owned and Owned and Prologis Share% o f Owned and Prologis Owned and Prologis
Managed Managed Sq Ft% Total Managed Share Managed Share
Consolidated Americas 1,513 264,898 243,671 92.0 69.7 96.9 96.9 97.3 97.3
Europe 49 12,233 12,233 100.0 3.5 86.9 86.9 86.9 86.9
Asia 18 5,246 5,246 100.0 1.5 84.3 84.3 86.1 86.1
Total operating portfolio—consolidated 1,580 282,377 261,150 92.5 74.7 96.2 96.2 96.7 96.6
Unconsolidated Americas 588 86,865 27,480 31.6 7.9 95.8 95.6 96.0 95.8
Europe 624 145,341 56,915 39.2 16.3 95.2 94.9 95.7 95.4
Asia 53 26,395 3,980 15.1 1.1 97.6 97.6 97.8 97.8
Total operating portfolio—unconsolidated 1,265 258,601 88,375 34.2 25.3 95.6 95.3 96.0 95.6
Total Americas 2,101 351,763 271,151 77.1 77.6 96.6 96.8 97.0 97.2
Europe 673 157,574 69,148 43.9 19.8 94.5 93.5 95.0 93.9
Asia 71 31,641 9,226 29.2 2.6 95.4 90.1 95.9 91.2
Total operating portfolio—owned and managed 2,845 540,978 349,525 64.6 100.0 95.9 95.9 96.4 96.4
Value added properties—consolidated 1 164 164 100.0 100.0 100.0 100.0 100.0
Value added properties—unconsolidated 35 5,632 2,095 37.2 52.3 53.0 53.1 53.7
Total ow ned and managed 2,881 546,774 351,784 64.3 95.5 95.7 95.9 96.1
F irst Quarter N OI Gross Book Value
Owned and Prologis Share (A)% of Owned and Prologis Share% o f
Managed Total Managed Total
$% $% Consolidated
Americas $256,361 $235,266 91.8 64.8 $17,361,843 $15,964,466 92.0 67.1
Europe 11,930 11,930 100.0 3.3 706,324 706,324 100.0 3.0
Asia 4,722 4,722 100.0 1.3 469,036 469,036 100.0 2.0
Total operating portfolio—consolidated $273,013 $251,918 92.3 69.4 $18,537,203 $17,139,826 92.5 72.1
Unconsolidated Americas $109,492 $33,315 30.4 9.2 $6,703,455 $1,980,351 29.5 8.3
Europe 178,233 69,784 39.2 19.2 10,551,703 4,108,669 38.9 17.3
Asia 53,331 8,047 15.1 2.2 3,697,100 557,946 15.1 2.3
Total operating portfolio—unconsolidated $341,056 $111,146 32.6 30.6 $20,952,258 $6,646,966 31.7 27.9
Total Americas $365,853 $268,581 73.4 74.0 $24,065,298 $17,944,817 74.6 75.4
Europe 190,163 81,714 43.0 22.5 11,258,027 4,814,993 42.8 20.3
Asia 58,053 12,769 22.0 3.5 4,166,136 1,026,982 24.7 4.3
Total operating portfolio—ow ned and managed $614,069 $363,064 59.1 100.0 $39,489,461 $23,786,792 60.2 100.0 Value added properties—consolidated 29 29 100.0 7,212 7,212 100.0
Value added properties—unconsolidated 2,019 753 37.3 300,165 107,181 35.7
Total ow ned and managed $616,117 $363,846 59.1 $39,796,838 $23,901,185 60.1
(A) Prologis share of NOI for the properties that were contributed to or acquired from the co-investment ventures is included at our actual share prior to and subsequent to the change in ownership.
Copyright © 2015 Prologis
21
|
|
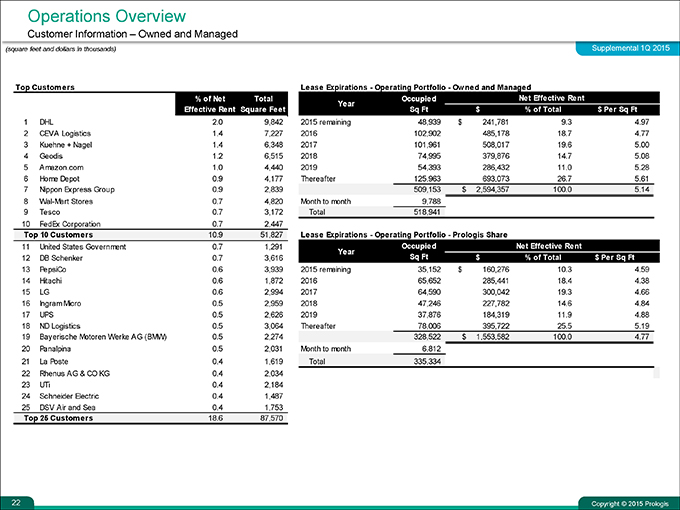
Operations Overview
Customer Information – Owned and Managed
(square feet and dollars in thousands) Supplemental 1Q 2015
Top Customers % of Net Total
Effective Rent Square Feet
1 DHL 2.0 9,842
2 CEVA Logistics 1.4 7,227
3 Kuehne + Nagel 1.4 6,348
4 Geodis 1.2 6,515
5 Amazon.com 1.0 4,440
6 Home Depot 0.9 4,177
7 Nippon Express Group 0.9 2,839
8 Wal-Mart Stores 0.7 4,820
9 Tesco 0.7 3,172
10 FedEx Corporation 0.7 2,447
Top 10 Customers 10.9 51,827
11 United States Government 0.7 1,291
12 DB Schenker 0.7 3,616
13 PepsiCo 0.6 3,939
14 Hitachi 0.6 1,872
15 LG 0.6 2,994
16 Ingram Micro 0.5 2,959
17 UPS 0.5 2,626
18 ND Logistics 0.5 3,064
19 Bayerische Motoren Werke AG (BMW) 0.5 2,274
20 Panalpina 0.5 2,031
21 La Poste 0.4 1,619
22 Rhenus AG & CO KG 0.4 2,034
23 UTi 0.4 2,184
24 Schneider Electric 0.4 1,487
25 DSV Air and Sea 0.4 1,753
Top 25 Customers 18.6 87,570
Lease Expirations—Operating Portfolio—Ow ned and Managed
Year Occupied Net Effective Rent
Sq Ft $% of Total $ Per Sq Ft
2015 remaining 48,939 $ 241,781 9.3 4.97
2016 102,902 485,178 18.7 4.77
2017 101,961 508,017 19.6 5.00
2018 74,995 379,876 14.7 5.08
2019 54,393 286,432 11.0 5.28
Thereafter 125,963 693,073 26.7 5.61
509,153 $ 2,594,357 100.0 5.14
Month to month 9,788 Total 518,941
Lease Expirations—Operating Portfolio—Prologis Share
Occupied Net Effective Rent
Year Sq Ft $% of Total $ Per Sq Ft
2015 remaining 35,152 $ 160,276 10.3 4.59
2016 65,652 285,441 18.4 4.38
2017 64,590 300,042 19.3 4.66
2018 47,246 227,782 14.6 4.84
2019 37,876 184,319 11.9 4.88
Thereafter 78,006 395,722 25.5 5.19
328,522 $ 1,553,582 100.0 4.77
Month to month 6,812 Total 335,334
Copyright © 2015 Prologis
22
|
|
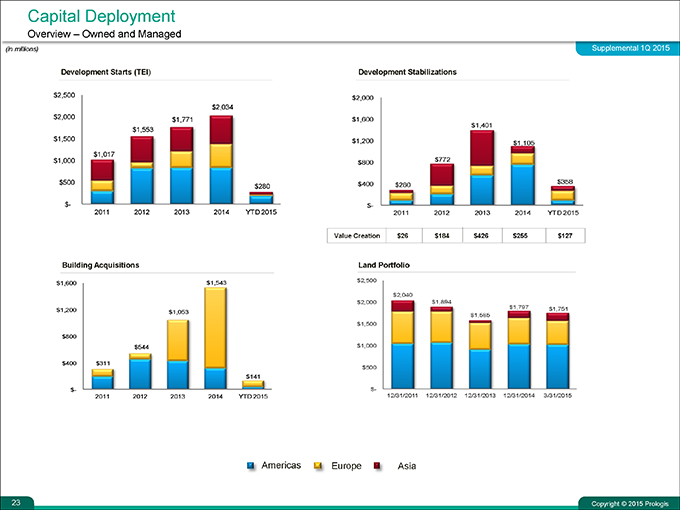
Capital Deployment
Overview – Owned and Managed
(in millions) Supplemental 1Q 2015
Development Starts (TEI) Development Stabilizations
Building Acquisitions Land Portfolio
Copyright © 2015 Prologis
23
|
|
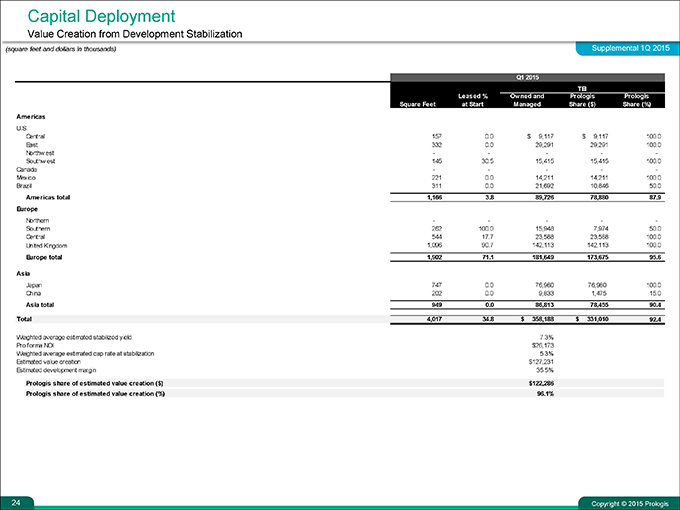
Capital Deployment
Value Creation from Development Stabilization
(square feet and dollars in thousands) Supplemental 1Q 2015
Q1 2015
TEI
Leased % Owned and Prologis Prologis
Square Feet at Start Managed Share ($) Share (%)
Americas
U.S.
Central 157 0.0 $ 9,117 $ 9,117 100.0
East 332 0.0 29,291 29,291 100.0
Northwest
Southwest 145 30.5 15,415 15,415 100.0
Canada
Mexico 221 0.0 14,211 14,211 100.0
Brazil 311 0.0 21,692 10,846 50.0
Americas total 1,166 3.8 89,726 78,880 87.9
Europe
Northern
Southern 262 100.0 15,948 7,974 50.0
Central 544 17.7 23,588 23,588 100.0
United Kingdom 1,096 90.7 142,113 142,113 100.0
Europe total 1,902 71.1 181,649 173,675 95.6
Asia
Japan 747 0.0 76,980 76,980 100.0
China 202 0.0 9,833 1,475 15.0
Asia total 949 0.0 86,813 78,455 90.4
Total 4,017 34.8 $ 358,188 $ 331,010 92.4
Weighted average estimated stabilized yield 7.3%
Pro forma NOI $26,173
Weighted average estimated cap rate at stabilization 5.3%
Estimated value creation $127,231
Estimated development margin 35.5%
Prologis share of estimated value creation ($) $122,286
Prologis share of estimated value creation (%) 96.1%
Copyright © 2015 Prologis
24
|
|
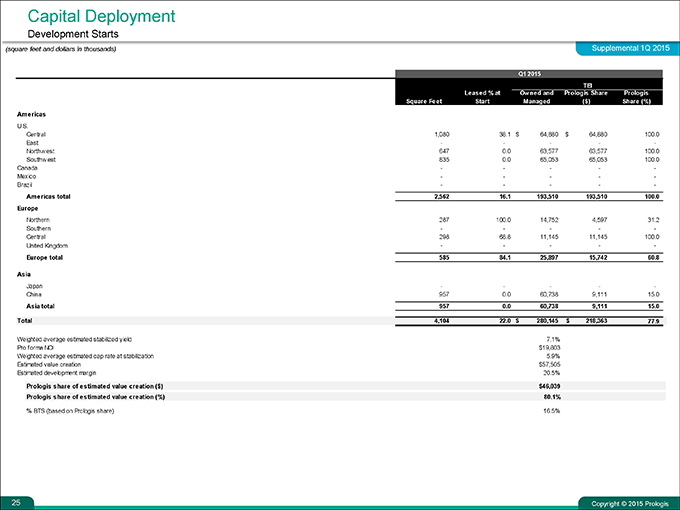
Capital Deployment
Development Starts
(square feet and dollars in thousands) Supplemental 1Q 2015
Q1 2015
TEI
Leased % at Owned and Prologis Share Prologis
Square Feet Start Managed($) Share (%)
Americas
U.S.
Central 1,080 38.1 $ 64,880 $ 64,880 100.0
East
Northw est 647 0.0 63,577 63,577 100.0
Southw est 835 0.0 65,053 65,053 100.0
Canada
Mexico
Brazil
Americas total 2,562 16.1 193,510 193,510 100.0
Europe
Northern 287 100.0 14,752 4,597 31.2
Southern
Central 298 68.8 11,145 11,145 100.0
United Kingdom
Europe total 585 84.1 25,897 15,742 60.8
Asia
Japan
China 957 0.0 60,738 9,111 15.0
Asia total 957 0.0 60,738 9,111 15.0
Total 4,104 22.0 $ 280,145 $ 218,363 77.9
Weighted average estimated stabilized yield 7.1%
Pro forma NOI $19,803
Weighted average estimated cap rate at stabilization 5.9%
Estimated value creation $57,505
Estimated development margin 20.5%
Prologis share of estimated value creation ($) $46,039
Prologis share of estimated value creation (%) 80.1%
% BTS (based on Prologis share) 16.5%
Copyright © 2015 Prologis
25
|
|
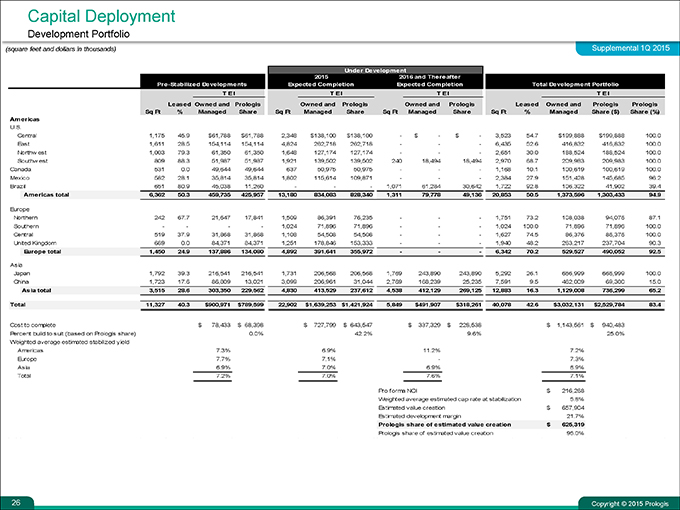
Capital Deployment
Development Portfolio
(square feet and dollars in thousands) Supplemental 1Q 2015
Under Development
2015 2016 and Thereafter
Pre-Stabilized Developments Expected Completion Expected Completion Total Development Portfolio
T E I T E I T E I T E I
Leased Owned and Prologis Owned and Prologis Owned and Prologis Leased Owned and Prologis Prologis
Sq Ft% Managed Share Sq Ft Managed Share Sq Ft Managed Share Sq Ft% Managed Share ($) Share (%)
Americas U.S.
Central 1,175 45.9 $61,788 $61,788 2,348 $138,100 $138,100—$—$—3,523 54.7 $199,888 $199,888 100.0
East 1,611 28.5 154,114 154,114 4,824 262,718 262,718 ——6,435 52.6 416,832 416,832 100.0
Northwest 1,003 79.3 61,350 61,350 1,648 127,174 127,174 ——2,651 30.0 188,524 188,524 100.0
Southwest 809 88.3 51,987 51,987 1,921 139,502 139,502 240 18,494 18,494 2,970 68.7 209,983 209,983 100.0
Canada 531 0.0 49,644 49,644 637 50,975 50,975 ——1,168 10.1 100,619 100,619 100.0
Mexico 582 28.1 35,814 35,814 1,802 115,614 109,871 ——2,384 27.9 151,428 145,685 96.2
Brazil 651 80.9 45,038 11,260 ——1,071 61,284 30,642 1,722 92.8 106,322 41,902 39.4
Americas total 6,362 50.3 459,735 425,957 13,180 834,083 828,340 1,311 79,778 49,136 20,853 50.5 1,373,596 1,303,433 94.9 Europe
Northern 242 67.7 21,647 17,841 1,509 86,391 76,235 ——1,751 73.2 108,038 94,076 87.1
Southern — — 1,024 71,896 71,896 ——1,024 100.0 71,896 71,896 100.0
Central 519 37.9 31,868 31,868 1,108 54,508 54,508 ——1,627 74.5 86,376 86,376 100.0
United Kingdom 689 0.0 84,371 84,371 1,251 178,846 153,333 ——1,940 48.2 263,217 237,704 90.3
Europe total 1,450 24.9 137,886 134,080 4,892 391,641 355,972 ——6,342 70.2 529,527 490,052 92.5
Asia Japan 1,792 39.3 216,541 216,541 1,731 206,568 206,568 1,769 243,890 243,890 5,292 26.1 666,999 666,999 100.0
China 1,723 17.6 86,809 13,021 3,099 206,961 31,044 2,769 168,239 25,235 7,591 9.5 462,009 69,300 15.0
Asia total 3,515 28.6 303,350 229,562 4,830 413,529 237,612 4,538 412,129 269,125 12,883 16.3 1,129,008 736,299 65.2
Total 11,327 40.3 $900,971 $789,599 22,902 $1,639,253 $1,421,924 5,849 $491,907 $318,261 40,078 42.6 $3,032,131 $2,529,784 83.4
Cost to complete $ 78,433 $ 68,398 $ 727,799 $ 643,547 $ 337,329 $ 228,538 $ 1,143,561 $ 940,483
Percent build to suit (based on Prologis share) 0.0% 42.2% 9.6% 25.0%
Weighted average estimated stabilized yield
Americas 7.3% 6.9% 11.2% 7.2%
Europe 7.7% 7.1%—7.3%
Asia 6.9% 7.0% 6.9% 6.9%
Total 7.2% 7.0% 7.6% 7.1%
Pro forma NOI $ 216,268
Weighted average estimated cap rate at stabilization 5.8%
Estimated value creation $ 657,904
Estimated development margin 21.7%
Prologis share of estim ated value creation $ 625,319
Prologis share of estimated value creation 95.0%
Copyright © 2015 Prologis
26
|
|
Capital Deployment
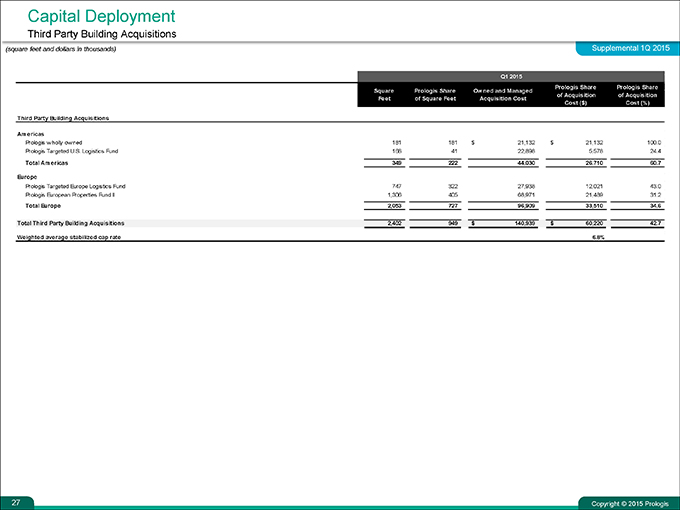
Third Party Building Acquisitions
(square feet and dollars in thousands) Supplemental 1Q 2015
Q1 2015
Square Prologis Share Owned and Managed Prologis Share Prologis Share
Feet of Square Feet Acquisition Cost of Acquisition of Acquisition
Cost ($) Cost (%)
Third Party Building Acquisitions
Americas
Prologis wholly ow ned 181 181 $ 21,132 $ 21,132 100.0
Prologis Targeted U.S. Logistics Fund 168 41 22,898 5,578 24.4
Total Americas 349 222 44,030 26,710 60.7
Europe
Prologis Targeted Europe Logistics Fund 747 322 27,938 12,021 43.0
Prologis European Properties Fund II 1,306 405 68,971 21,489 31.2
Total Europe 2,053 727 96,909 33,510 34.6
Total Third Party Building Acquisitions 2,402 949 $ 140,939 $ 60,220 42.7
Weighted average stabilized cap rate 6.8%
Copyright © 2015 Prologis
27
|
|
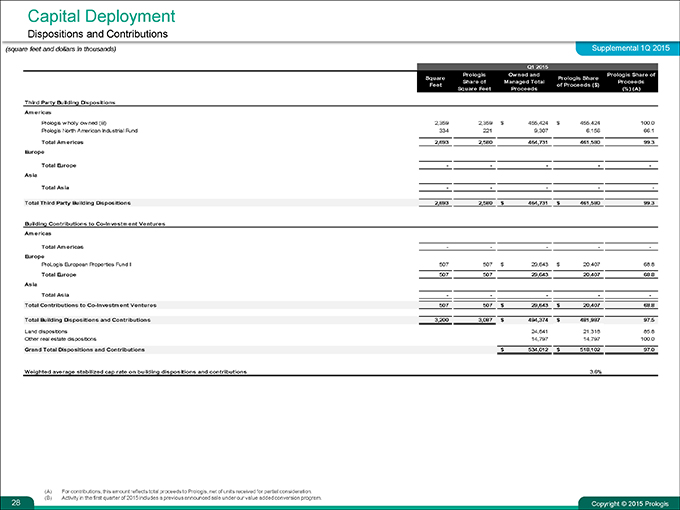
Capital Deployment
Dispositions and Contributions
(square feet and dollars in thousands) Supplemental 1Q 2015
Q1 2015
Prologis Ow ned and Prologis Share of
Square Prologis Share
Share of Managed Total Proceeds
Feet of Proceeds ($)
Square Feet Proceeds(%) (A)
Third Party Building Dispositions
Americas
Prologis w holly ow ned (B) 2,359 2,359 $ 455,424 $ 455,424 100.0
Prologis North American Industrial Fund 334 221 9,307 6,156 66.1
Total Americas 2,693 2,580 464,731 461,580 99.3
Europe
Total Europe
Asia
Total Asia
Total Third Party Building Dispositions 2,693 2,580 $ 464,731 $ 461,580 99.3
Building Contributions to Co-Investm ent Ventures
Americas
Total Americas
Europe
ProLogis European Properties Fund II 507 507 $ 29,643 $ 20,407 68.8
Total Europe 507 507 29,643 20,407 68.8
Asia
Total Asia
Total Contributions to Co-Investment Ventures 507 507 $ 29,643 $ 20,407 68.8
Total Building Dispositions and Contributions 3,200 3,087 $ 494,374 $ 481,987 97.5
Land dispositions 24,841 21,318 85.8
Other real estate dispositions 14,797 14,797 100.0
Grand Total Dispositions and Contributions $ 534,012 $ 518,102 97.0
Weighted average stabilized cap rate on building dispositions and contributions 3.6%
(A) For contributions, this amount reflects total proceeds to Prologis, net of units received for partial consideration. (B) Activity in the first quarter of 2015 includes a previous announced sale under our value added conversion program.
Copyright © 2015 Prologis
28
|
|
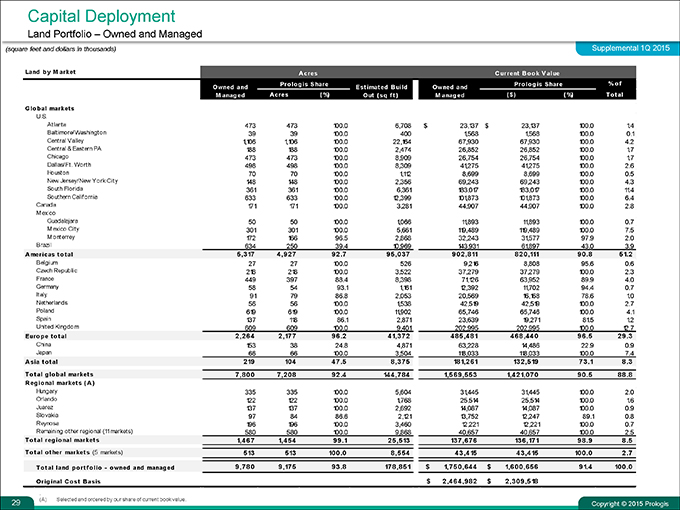
Capital Deployment
Land Portfolio – Owned and Managed
(square feet and dollars in thousands) Supplemental 1Q 2015
Land by Market Acres Current Book Value
Prolog is Share Prolog is Share% o f
Owned and Est imat ed B uild Owned and
Managed Acres(%) Out (sq ft) Managed($)( %) Total
Global markets
U.S.
Atlanta 473 473 100.0 6,708 $ 23,137 $ 23,137 100.0 1.4
Baltimore/Washington 39 39 100.0 400 1,568 1,568 100.0 0.1
Central Valley 1,106 1,106 100.0 22,164 67,930 67,930 100.0 4.2
Central & Eastern PA 188 188 100.0 2,474 26,852 26,852 100.0 1.7
Chicago 473 473 100.0 8,909 26,754 26,754 100.0 1.7
Dallas/Ft. Worth 498 498 100.0 8,309 41,275 41,275 100.0 2.6
Houston 70 70 100.0 1,112 8,699 8,699 100.0 0.5
New Jersey/New York City 148 148 100.0 2,356 69,243 69,243 100.0 4.3
South Florida 361 361 100.0 6,361 183,017 183,017 100.0 11.4
Southern California 633 633 100.0 12,399 101,873 101,873 100.0 6.4
Canada 171 171 100.0 3,281 44,907 44,907 100.0 2.8
Mexico
Guadalajara 50 50 100.0 1,066 11,893 11,893 100.0 0.7
Mexico City 301 301 100.0 5,661 119,489 119,489 100.0 7.5
Monterrey 172 166 96.5 2,868 32,243 31,577 97.9 2.0
Brazil 634 250 39.4 10,969 143,931 61,897 43.0 3.9
Americas t o t al 5,317 4,927 92 .7 95,037 902,811 820,111 90 .8 51.2
Belgium 27 27 100.0 526 9,216 8,808 95.6 0.6
Czech Republic 218 218 100.0 3,522 37,279 37,279 100.0 2.3
France 449 397 88.4 8,398 71,126 63,952 89.9 4.0
Germany 58 54 93.1 1,161 12,392 11,702 94.4 0.7
Italy 91 79 86.8 2,053 20,569 16,168 78.6 1.0
Netherlands 56 56 100.0 1,538 42,519 42,519 100.0 2.7
Poland 619 619 100.0 11,902 65,746 65,746 100.0 4.1
Spain 137 118 86.1 2,871 23,639 19,271 81.5 1.2
United Kingdom 609 609 100.0 9,401 202,995 202,995 100.0 12.7
Euro p e t o t al 2,264 2,177 96 .2 41,372 485,481 468,440 96 .5 29 .3
China 153 38 24.8 4,871 63,228 14,486 22.9 0.9
Japan 66 66 100.0 3,504 118,033 118,033 100.0 7.4
Asia total 219 104 47 .5 8,375 181,261 132,519 73 .1 8 .3
Total global market s 7,800 7,208 92 .4 144,784 1,569,553 1,421,070 90 .5 88 .8
Regional markets (A)
Hungary 335 335 100.0 5,604 31,445 31,445 100.0 2.0
Orlando 122 122 100.0 1,768 25,514 25,514 100.0 1.6
Juarez 137 137 100.0 2,692 14,087 14,087 100.0 0.9
Slovakia 97 84 86.6 2,121 13,752 12,247 89.1 0.8
Reynosa 196 196 100.0 3,460 12,221 12,221 100.0 0.7
Remaining other regional (11markets) 580 580 100.0 9,868 40,657 40,657 100.0 2.5
Total regional markets 1,467 1,454 99 .1 25,513 137,676 136,171 98 .9 8 .5
Total ot her markets (5 markets) 513 513 100 .0 8,554 43,415 43,415 100 .0 2 .7
Total land port folio—owned and managed 9,780 9,175 93 .8 178,851 $ 1,750,644 $ 1,600,656 91.4 100 .0
Original Cost Basis $ 2,464,982 $ 2,309,518
(A) Selected and ordered by our share of current book value.
Copyright © 2015 Prologis
29
|
|
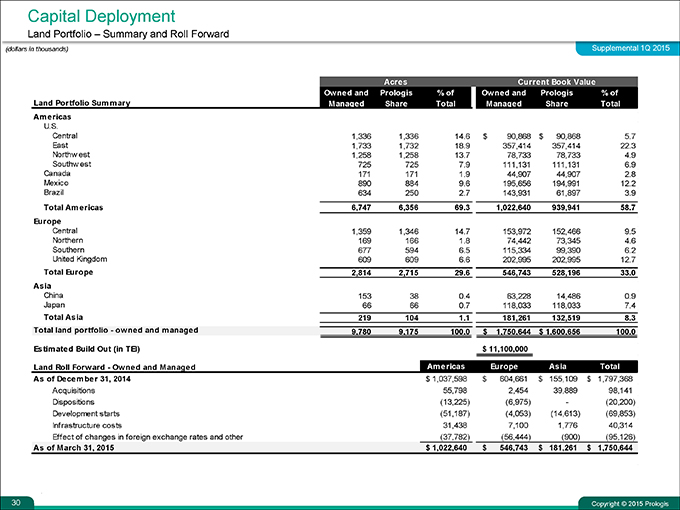
Capital Deployment
Land Portfolio – Summary and Roll Forward
(dollars in thousands) Supplemental 1Q 2015
Acres Current Book Value
Owned and Prologis % of Owned and Prologis % of
Land Portfolio Summary Managed Share Total Managed Share Total
Americas U.S.
Central 1,336 1,336 14.6 $ 90,868 $ 90,868 5.7
East 1,733 1,732 18.9 357,414 357,414 22.3
Northwest 1,258 1,258 13.7 78,733 78,733 4.9
Southwest 725 725 7.9 111,131 111,131 6.9
Canada 171 171 1.9 44,907 44,907 2.8
Mexico 890 884 9.6 195,656 194,991 12.2
Brazil 634 250 2.7 143,931 61,897 3.9
Total Americas 6,747 6,356 69.3 1,022,640 939,941 58.7
Europe
Central 1,359 1,346 14.7 153,972 152,466 9.5
Northern 169 166 1.8 74,442 73,345 4.6
Southern 677 594 6.5 115,334 99,390 6.2
United Kingdom 609 609 6.6 202,995 202,995 12.7
Total Europe 2,814 2,715 29.6 546,743 528,196 33.0
Asia
China 153 38 0.4 63,228 14,486 0.9
Japan 66 66 0.7 118,033 118,033 7.4
Total Asia 219 104 1.1 181,261 132,519 8.3
Total land portfolio—ow ned and managed 9,780 9,175 100.0 $ 1,750,644 $ 1,600,656 100.0
Estimated Build Out (in TEI) $ 11,100,000
Land Roll Forw ard—Ow ned and Managed Americas Europe Asia Total
As of December 31, 2014 $ 1,037,598 $ 604,661 $ 155,109 $ 1,797,368
Acquisitions 55,798 2,454 39,889 98,141
Dispositions(13,225)(6,975) -(20,200)
Development starts(51,187)(4,053)(14,613)(69,853)
Infrastructure costs 31,438 7,100 1,776 40,314
Effect of changes in foreign exchange rates and other(37,782)(56,444)(900)(95,126)
As of March 31, 2015 $ 1,022,640 $ 546,743 $ 181,261 $ 1,750,644
Copyright © 2015 Prologis
30
|
|
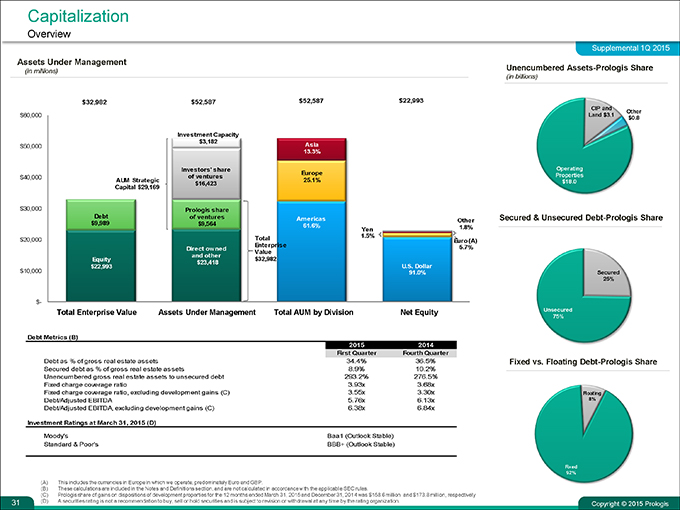
Capitalization Overview Supplemental 1Q 2015
Assets Under Management (in millions)
Debt Metrics (B) 2015 2014
First Quarter Fourth Quarter
Debt as % of gross real estate assets 34.4% 36.5%
Secured debt as % of gross real estate assets 8.9% 10.2%
Unencumbered gross real estate assets to unsecured debt 293.2% 276.5%
Fixed charge coverage ratio 3.93x 3.68x
Fixed charge coverage ratio, excluding development gains (C) 3.55x 3.30x
Debt/Adjusted EBITDA 5.76x 6.13x
Debt/Adjusted EBITDA, excluding development gains (C) 6.38x 6.84x
Investment Ratings at March 31, 2015 (D)
Moody’s Baa1 (Outlook Stable)
Standard & Poor’s BBB+ (Outlook Stable)
Unencumbered Assets-Prologis Share (in billions)
Secured & Unsecured Debt-Prologis Share
Fixed vs. Floating Debt-Prologis Share
(A) This includes the currencies in Europe in which we operate, predominately Euro and GBP.
(B) These calculations are included in the Notes and Definitions section, and are not calculated in accordance with the applicable SEC rules.
(C) Prologis share of gains on dispositions of development properties for the 12 months ended March 31, 2015 and December 31, 2014 was $158.6 million and $173.8 million, respectively
(D) A securities rating is not a recommendation to buy, sell or hold securities and is subject to revision or withdrawal at any time by the rating organization.
Copyright © 2015 Prologis
31
|
|
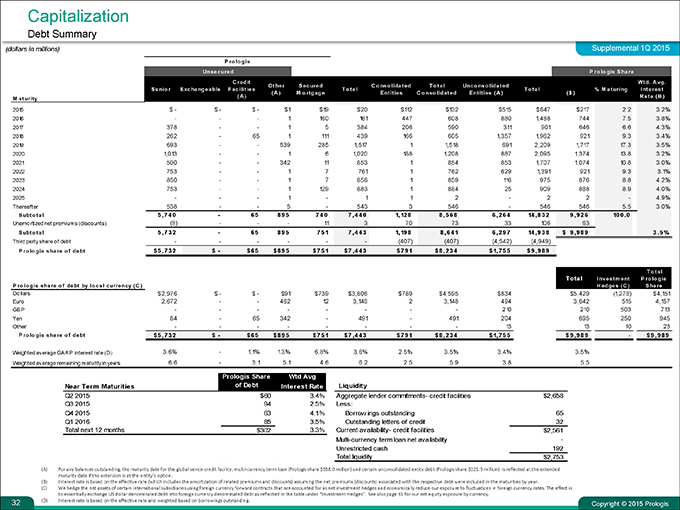
Capitalization Debt Summary
(dollars in millions) Supplemental 1Q 2015 Prologis
Unsecured Prologis Share Credit Wtd. A vg.
Other Secured C o nso lidated T o tal Unco nso lidated
Senio r Exchangeable F acilities T o tal T o tal% M aturing Interest
(A) Mortgage Entities Consolidated Entities (A)($) Maturity(A) Rate (B)
2015 $—$—$—$1 $19 $20 $112 $132 $515 $647 $217 2.2 3.2%
2016 ——1 160 161 447 608 880 1,488 744 7.5 3.8%
2017 378 — 1 5 384 206 590 311 901 646 6.6 4.3%
2018 262—65 1 111 439 166 605 1,357 1,962 921 9.3 3.4%
2019 693 — 539 285 1,517 1 1,518 691 2,209 1,717 17.3 3.5%
2020 1,013 — 1 6 1,020 188 1,208 887 2,095 1,374 13.8 3.2%
2021 500 — 342 11 853 1 854 853 1,707 1,074 10.8 3.0%
2022 753 — 1 7 761 1 762 629 1,391 921 9.3 3.1%
2023 850 — 1 7 858 1 859 116 975 876 8.8 4.2%
2024 753 — 1 129 883 1 884 25 909 888 8.9 4.0%
2025 ——1—1 1 2—2 2—4.9%
Thereafter 538 — 5—543 3 546—546 546 5.5 3.0%
Subtotal 5 ,7 4 0—6 5 8 9 5 7 4 0 7 ,4 4 0 1,12 8 8 ,5 6 8 6 ,2 6 4 14 ,8 3 2 9 ,9 2 6 10 0 . 0
Unamortized net premiums (discounts)(8) ——11 3 70 73 33 106 63
Subtotal 5 ,7 3 2—6 5 8 9 5 7 5 1 7 ,4 4 3 1,19 8 8 ,6 4 1 6 ,2 9 7 14 ,9 3 8 $ 9 ,9 8 9 3 . 5 %
Third party share of debt — — —(407) (407) (4,542) (4,949)
Prologis share o f debt $ 5 ,7 3 2 $—$ 6 5 $ 8 9 5 $ 7 5 1 $ 7 ,4 4 3 $ 7 9 1 $ 8 ,2 3 4 $ 1,7 5 5 $ 9 ,9 8 9
Total Total Investment Prologis
Prologis share o f debt by local currency (C) Hedges (C) Share
Dollars $2,976 $—$—$91 $739 $3,806 $789 $4,595 $834 $5,429(1,278) $4,151
Euro 2,672 — 462 12 3,146 2 3,148 494 3,642 515 4,157
GBP — — — — 210 210 503 713
Yen 84—65 342—491—491 204 695 250 945
Other — — — — 13 13 10 23
Prologis share o f debt $ 5,732 $—$ 65 $ 895 $ 751 $ 7,443 $ 791 $ 8,234 $ 1,755 $ 9 ,989—$ 9,98 9
Weighted average GAAP interest rate (D) 3.6%—1.1% 1.3% 6.8% 3.6% 2.5% 3.5% 3.4% 3.5%
Weighted average remaining maturity in years 6.6—3.1 5.1 4.6 6.2 2.5 5.9 3.8 5.5
Prologis Share Wtd Avg Near Term Maturities of Debt Interest Rate Liquidity
Q2 2015 $60 3.4% Aggregate lender commitments- credit facilities $2,658
Q3 2015 94 2.5% Less: Q4 2015 63 4.1% Borrow ings outstanding 65
Q1 2016 85 3.5% Outstanding letters of credit 32
Total next 12 months $302 3.3% Current availability- credit facilities $2,561
Multi-currency term loan net availability -
Unrestricted cash 192 Total liquidity $2,753
(A) For any balances outstanding, the maturity date for the global senior credit facility, multi-currency term loan (Prologis share $538.0 million) and certain unconsolidated entity debt (Prologis share $221.5 million) is reflected at the extended maturity date if the extension is at the entity’s option.
(B) Interest rate is based on the effective rate (which includes the amortization of related premiums and discounts) assuming the net premiums (discounts) associated with the respective debt were included in the maturities by year.
(C) We hedge the net assets of certain international subsidiaries using foreign currency forward contracts that are accounted for as net investment hedges and economically reduce our exposure to fluctuations in foreign currency rates. The effect is to essentially exchange US dollar denominated debt into foreign currency denominated debt as reflected in the table under “Investment Hedges”. See also page 31 for our net equity exposure by currency.
(D) Interest rate is based on the effective rate and weighted based on borrowings outstanding.
Copyright © 2015 Prologis
32
|
|
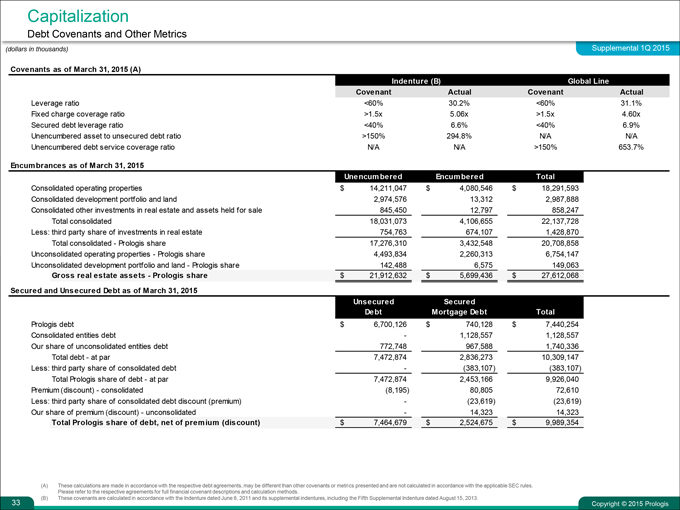
Capitalization
Debt Covenants and Other Metrics
(dollars in thousands) Supplemental 1Q 2015
Covenants as of March 31, 2015 (A)
Indenture (B) Global Line
Covenant Actual Covenant Actual
Leverage ratio <60% 30.2% <60% 31.1% Fixed charge coverage ratio >1.5x 5.06x >1.5x 4.60x Secured debt leverage ratio <40% 6.6% <40% 6.9% Unencumbered asset to unsecured debt ratio >150% 294.8% N/A N/A Unencumbered debt service coverage ratio N/A N/A >150% 653.7%
Encumbrances as of March 31, 2015
Unencumbered Encumbered Total
Consolidated operating properties $ 14,211,047 $ 4,080,546 $ 18,291,593 Consolidated development portfolio and land 2,974,576 13,312 2,987,888 Consolidated other investments in real estate and assets held for sale 845,450 12,797 858,247 Total consolidated 18,031,073 4,106,655 22,137,728 Less: third party share of investments in real estate 754,763 674,107 1,428,870 Total consolidated - Prologis share 17,276,310 3,432,548 20,708,858 Unconsolidated operating properties - Prologis share 4,493,834 2,260,313 6,754,147 Unconsolidated development portfolio and land - Prologis share 142,488 6,575 149,063 Gross real estate assets - Prologis share $ 21,912,632 $ 5,699,436 $ 27,612,068
Secured and Unsecured Debt as of March 31, 2015
Unsecured Secured
Debt Mortgage Debt Total
Prologis debt $ 6,700,126 $ 740,128 $ 7,440,254 Consolidated entities debt - 1,128,557 1,128,557 Our share of unconsolidated entities debt 772,748 967,588 1,740,336 Total debt - at par 7,472,874 2,836,273 10,309,147 Less: third party share of consolidated debt - (383,107) (383,107) Total Prologis share of debt - at par 7,472,874 2,453,166 9,926,040 Premium (discount) - consolidated (8,195) 80,805 72,610 Less: third party share of consolidated debt discount (premium) - (23,619) (23,619) Our share of premium (discount) - unconsolidated - 14,323 14,323
Total Prologis share of debt, net of premium (discount) $ 7,464,679 $ 2,524,675 $ 9,989,354
(A) These calculations are made in accordance with the respective debt agreements, may be different than other covenants or metrics presented and are not calculated in accordance with the applicable SEC rules. Please refer to the respective agreements for full financial covenant descriptions and calculation methods.
(B) These covenants are calculated in accordance with the Indenture dated June 8, 2011 and its supplemental indentures, including the Fifth Supplemental Indenture dated August 15, 2013.
33 Copyright © 2015 Prologis
|
|
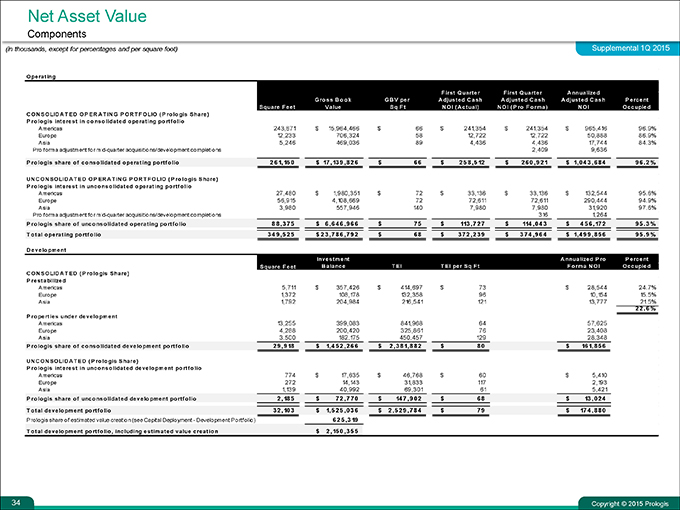
Net Asset Value Components
(in thousands, except for percentages and per square foot) Supplemental 1Q 2015
Operating
F irst Quarter F irst Quarter A nnualized
Gross Book GBV per Adjusted Cash Adjusted Cash Adjusted Cash Percent
Square Feet Value Sq Ft NOI (Actual) NOI (Pro Forma) NOI Occupied
CONSOLIDATED OPERATING PORTFOLIO (Prologis Share)
Prologis interest in consolidated operating portfolio
Americas 243,671 $ 15,964,466 $ 66 $ 241,354 $ 241,354 $ 965,416 96.9%
Europe 12,233 706,324 58 12,722 12,722 50,888 86.9%
Asia 5,246 469,036 89 4,436 4,436 17,744 84.3%
Proforma adjustment for mid-quarter acquisitions/development completions 2,409 9,636
Prologis share of consolidated operating portfolio 261,150 $ 17,139, 826 $ 66 $ 258,512 $ 260,921 $ 1,0 43,6849 6.2%
UNCONSOLIDATED OPERATING PORTFOLIO (Prologis Share)
Prologis interest in unconso lidated operating portfolio
Americas 27,480 $ 1,980,351 $ 72 $ 33,136 $ 33,136 $ 132,544 95.6%
Europe 56,915 4,108,669 72 72,611 72,611 290,444 94.9%
Asia 3,980 557,946 140 7,980 7,980 31,920 97.6%
Proforma adjustment for mid-quarter acquisitions/development completions 316 1,264
Prologis share of unconsolidated operating portfolio 88,375 $ 6,646,966 $ 75 $ 113 , 7 2 7 $ 114 , 0 4 3 $ 4 5 6 , 17 2 9 5 . 3 %
Total operating portfolio 3 4 9 , 5 2 5 $ 2 3 , 7 8 6 , 7 9 2 $ 6 8 $ 3 7 2 , 2 3 9 $ 3 7 4 , 9 6 4 $ 1, 4 9 9 , 8 5 6 9 5 .. 9 %
Development
Investment Annualized Pro Percent
Square Feet Balance TEI TEI per Sq Ft Forma NOI Occupied
CONSOLIDATED (Prologis Share)
Prestabilized
Americas 5,711 $ 357,426 $ 414,697 $ 73 $ 28,544 24.7%
Europe 1,372 108,178 132,358 96 10,154 15.5%
Asia 1,792 204,984 216,541 121 13,777 21.5% 22.6 %
Properties under development
Americas 13,255 399,083 841,968 64 57,625
Europe 4,288 200,420 325,861 76 23,408
Asia 3,500 182,175 450,457 129 28,348
Prologis share of consolidated development portfolio 29,918 $ 1, 4 5 2 , 2 6 6 $ 2 , 3 8 1, 8 8 2 $ 8 0 $ 16 1, 8 5 6
UNCONSOLIDATED (Prologis Share)
Prologis interest in unconsolidated development portfolio
Americas 774 $ 17,635 $ 46,768 $ 60 $ 5,410
Europe 272 14,143 31,833 117 2,193
Asia 1,139 40,992 69,301 61 5,421
Prologis share of unconsolidated development portfolio 2, 18 5 $ 7 2 , 7 7 0 $ 14 7 , 9 0 2 $ 6 8 $ 13 , 0 2 4
Total development portfolio 3 2 , 10 3 $ 1, 5 2 5 , 0 3 6 $ 2 , 5 2 9 , 7 8 4 $ 7 9 $ 17 4 , 8 8 0
Prologis share of estimated value creation (see Capital Deployment—Development Portfolio) 6 2 5 , 3 19
Total development portfolio, including estimated value creatio n $ 2 , 15 0 , 3 5 5
Copyright © 2015 Prologis
34
|
|
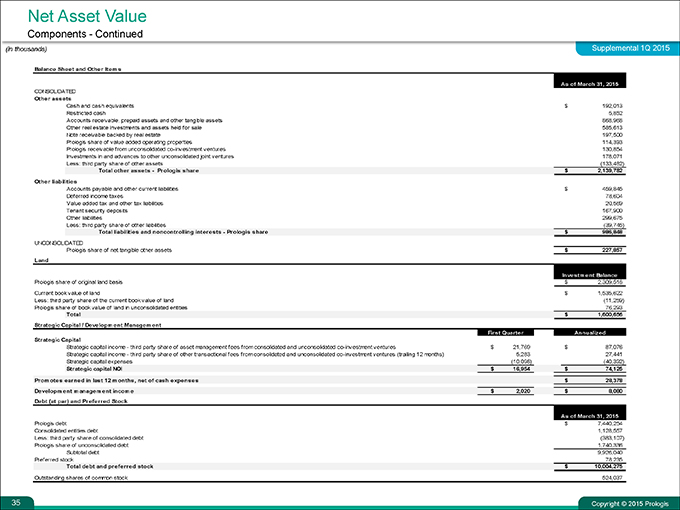
Net Asset Value
Components—Continued
(in thousands) Supplemental 1Q 2015
Balance Sheet and Other Items
As of March 31, 2015
CONSOLIDATED Other assets
Cash and cash equivalents $ 192,013
Restricted cash 5,852
Accounts receivable, prepaid assets and other tangible assets 868,968
Other real estate investments and assets held for sale 585,613
Note receivable backed by real estate 197,500
Prologis share of value added operating properties 114,393
Prologis receivable from unconsolidated co-investment ventures 130,854
Investments in and advances to other unconsolidated joint ventures 178,071
Less: third party share of other assets (133,482)
Total other assets—Prologis share $ 2,139,782
Other liabilities
Accounts payable and other current liabilities $ 459,845
Deferred income taxes 78,604
Value added tax and other tax liabilities 20,569
Tenant security deposits 167,900
Other liabilities 299,675
Less: third party share of other liabilities (39,745)
Total liabilities and noncontrolling interests—Prologis share $ 986,848
UNCONSOLIDATED
Prologis share of net tangible other assets $ 227,857 Land
Investment Balance
Prologis share of original land basis $ 2,309,518
Current book value of land $ 1,535,622
Less: third party share of the current book value of land (11,259)
Prologis share of book value of land in unconsolidated entities 76,293
Total $ 1,600,656 Strategic Capital / Development Management
First Quarter Annualized Strategic Capital
Strategic capital income—third party share of asset management fees from consolidated and unconsolidated co-investment ventures $ 21,769 $ 87,076
Strategic capital income—third party share of other transactional fees from consolidated and unconsolidated co-investment ventures (trailing 12 months) 5,283 27,441
Strategic capital expenses (10,098) (40,392)
Strategic capital NOI $ 16,954 $ 74,125
Promotes earned in last 12 months, net of cash expenses $ 28,378
Development management income $ 2,020 $ 8,080
Debt (at par) and Preferred Stock
As of March 31, 2015 Prologis debt $ 7,440,254
Consolidated entities debt 1,128,557
Less: third party share of consolidated debt (383,107)
Prologis share of unconsolidated debt 1,740,336
Subtotal debt 9,926,040
Preferred stock 78,235
Total debt and preferred stock $ 10,004,275
Outstanding shares of common stock 524,037
Copyright © 2015 Prologis
35
|
|
Notes and Definitions
|
|
Notes and Definitions
Supplemental 1Q 2015
Please refer to our annual and quarterly financial statements filed with the Securities and Exchange Commission on Forms 10-K and 10-Q and other public reports for further information about us and our business. Certain amounts from previous periods presented in the Supplemental Information have been reclassified to conform to the current presentation.
Acquisition cost, as presented for building acquisitions, represents the economic cost and not necessarily what is capitalized. It includes the initial purchase price; the effects of marking assumed debt to market, if applicable; all due diligence and lease intangibles; and estimated acquisition capital expenditures including leasing costs to achieve stabilization.
Adjusted EBITDA. We use Adjusted EBITDA to measure both our operating performance and liquidity. We calculate Adjusted EBITDA beginning with consolidated net earnings (loss) attributable to common stockholders and removing the effect of interest, income taxes, depreciation and amortization, impairment charges, third party acquisition expenses related to the acquisition of real estate, gains or losses from the acquisition or disposition of investments in real estate (other than from land and development properties), gains from the revaluation of equity investments upon acquisition of a controlling interest, gains or losses on early extinguishment of debt and derivative contracts (including cash charges), similar adjustments we make to our FFO measures (see definition below), and other non-cash charges or gains (such as stock based compensation and unrealized gains or losses on foreign currency and derivative activity and related amortization). We make adjustments to reflect our economic ownership in each entity, whether consolidated or unconsolidated.
We consider Adjusted EBITDA to provide investors relevant and useful information because it permits investors to view our operating performance on an unleveraged basis before the effects of income tax, non-cash depreciation and amortization expense and other items (outlined above), items that affect comparability, and other significant non-cash items. We also include a pro forma adjustment in Adjusted EBITDA to reflect a full period of NOI on the operating properties we acquire and stabilize and to remove NOI on properties we dispose of during the quarter assuming the transaction occurred at the beginning of the quarter. By excluding interest expense, Adjusted EBITDA allows investors to measure our operating performance independent of our capital structure and indebtedness and, therefore, allows for a more meaningful comparison of our operating performance to that of other companies, both in the real estate industry and in other industries. Gains and losses on the disposition of non-development properties and on the early extinguishment of debt generally include the costs of repurchasing debt securities. While not infrequent or unusual in nature, these items result from market fluctuations that can have inconsistent effects on our results of operations. The economics underlying these items reflect market and financing conditions in the short-term but can obscure our performance and the value of our long-term investment decisions and strategies.
We believe that Adjusted EBITDA helps investors to analyze our ability to meet interest payment obligations and to make quarterly preferred share dividends. We believe that investors should consider Adjusted EBITDA in conjunction with net earnings (the primary measure of our performance) and the other required Generally Accepted Accounting Principles (“GAAP”) measures of our performance and liquidity, to improve their understanding of our operating results and liquidity, and to make more meaningful comparisons of our performance against other companies. By using Adjusted EBITDA, an investor is assessing the earnings generated by our operations but not taking into account the eliminated expenses or gains incurred in connection with such operations. As a result, Adjusted EBITDA has limitations as an analytical tool and should be used in conjunction with our GAAP presentations. Adjusted EBITDA does not reflect our historical cash expenditures or future cash requirements for working capital, capital expenditures, distribution requirements or contractual commitments. Adjusted EBITDA, also does not reflect the cash required to make interest and principal payments on our outstanding debt.
While EBITDA is a relevant and widely used measure of operating performance, it does not represent net income or cash flow from operations as defined by GAAP and it should not be considered as an alternative to those indicators in evaluating operating performance or liquidity.
Further, our computation of Adjusted EBITDA may not be comparable to EBITDA reported by other companies. We compensate for the limitations of Adjusted EBITDA by providing investors with financial statements prepared according to GAAP, along with this detailed discussion of Adjusted EBITDA and a reconciliation of Adjusted EBITDA to consolidated net earnings (loss), a GAAP measurement.
Adjusted Cash NOI (Actual). A reconciliation of our rental income and rental expenses included in our Statement of Operations to adjusted cash NOI for the consolidated operating portfolio for purposes of the Net Asset Value calculation is as follows (in thousands):
Rental income $ 418,802 Rental expenses(126,934) NOI 291,868 Net termination fees and adjustments (a)(1,494) Less: actual NOI for development portfolio and other(13,774) Less: properties contributed or sold (b)(2,414) Less: third party share of NOI(22,268) Adjusted NOI for consolidated operating portfolio owned at March 31, 2015 251,918 Straight-lined rents (c)(9,662) Free rent (c) 10,583 Amortization of lease intangibles (c) 5,549 Less: third party share 124 First Quarter Adjusted Cash NOI (Actual) $ 258,512
(a) Net termination fees generally represent the gross fee negotiated at the time a customer is allowed to terminate its lease agreement offset by that customer’s rent leveling asset or liability, if any, that has been previously recognized. Removing the net termination fees from rental income allows for the calculation of Adjusted Cash NOI (Pro forma) to include only rental income that is indicative of the property’s recurring operating performance.
(b) The actual NOI for properties that were contributed or sold during the three-month period is removed.
(c) Straight-lined rents, free rent amount and amortization of lease intangibles (above and below market leases) are removed from rental income for the Operating Portfolio to allow for the calculation of a cash yield.
Adjusted Cash NOI (Pro forma) consists of Adjusted Cash NOI (Actual) for the properties in our Operating Portfolio adjusted to reflect NOI for a full quarter for operating properties that were acquired or stabilized during the quarter. Adjusted Cash NOI (Pro forma) for the properties in our Development Portfolio is based on current Total Expected Investment and an estimated stabilized yield.
Assets Under Management (“AUM”) represents the estimated value of the real estate we own or manage through both our consolidated and unconsolidated entities. We calculate AUM by adding the third party investors’ share of the estimated fair value of the assets in the co-investment ventures to our share of total market capitalization (calculated using the market price of our equity plus our share of total debt).
Copyright © 2015 Prologis
37
|
|
Notes and Definitions (continued) Supplemental 1Q 2015 Calculation of Per Share Amounts is as follows (in thousands, except per share amounts): Three Months Ended March 31, 2015 2014 Net earnings Net earnings $ 345,206 $ 4,666 Noncontrolling interest attributable to exchangeable limited partnership units 1,650 17
Gains, net of expenses, associated with exchangeable debt assumed exchanged(1,614) - Adjusted net earnings—Diluted $ 345,242 $ 4,683 Weighted average common shares outstanding—Basic 514,022 498,696
Incremental weighted average effect on exchange of limited partnership units 3,794 1,767
Incremental weighted average effect of stock awards 2,394 3,910 Incremental weighted average effect on exchangeable debt assumed exchanged (a) 8,812 - Weighted average common shares outstanding—Diluted 529,022 504,373 Net earnings per share—Basic $ 0.67 $ 0.01 Net earnings per share—Diluted $ 0.65 $ 0.01
Core FFO Core FFO $ 254,379 $ 217,555 Noncontrolling interest attributable to exchangeable limited partnership units 881 207 Interest expense on exchangeable debt assumed exchanged 3,506 4,246
Core FFO—Diluted $ 258,766 $ 222,008 Weighted average common shares outstanding—Basic 514,022 498,696 Incremental weighted average effect on exchange of limited partnership units 3,794 3,715
Incremental weighted average effect of stock awards 2,394 3,910 Incremental weighted average effect on exchangeable debt assumed exchanged (a) 8,812 11,879 Weighted average common shares outstanding—Diluted 529,022 518,200 Core FFO per share—Diluted $ 0.49 $ 0.43
(a) In March 2015, the exchangeable debt was settled primarily through the issuance of common
stock. The adjustment in 2015 assumes the exchange occurred on January 1, 2015.
Debt Metrics. See below for the detailed calculations for the respective period (dollars in thousands):
Three Months Ended Mar. 31 Dec. 31 2015 2014 Debt as a % of gross real estate assets:
Total Prologis share of debt—at par $ 9,926,040 $ 10,763,232
Less: Prologis share of outstanding foreign currency derivatives(171,605)(102,080)
Less: consolidated cash and cash equivalents(192,013)(350,692)
Add: consolidated cash and cash equivalents—third party share 38,821 45,236
Less: unconsolidated entities cash—Prologis share(91,462)(111,629)
Total Prologis share of debt, net of adjustments $ 9,509,781 $ 10,244,067
Gross real estate assets—Prologis share $ 27,612,068 $ 28,099,831
Debt as a % of gross real estate assets 34.4% 36.5% Secured debt as a % of gross real estate assets: Prologis share of secured debt—at par $ 2,453,166 $ 2,857,196 Gross real estate assets—Prologis share $ 27,612,068 $ 28,099,831 Secured debt as a % of gross real estate assets 8.9% 10.2% Unencumbered gross real estate assets to unsecured debt: Unencumbered gross real estate assets—Prologis share $ 21,912,632 $ 21,862,642
Prologis share of unsecured debt—at par $ 7,472,874 $ 7,906,036 Unencumbered gross real estate assets to unsecured debt 293.2% 276.5% Fixed Charge Coverage ratio: Adjusted EBITDA $ 365,996 $ 367,240
Adjusted EBITDA-annualized including 12 month rolling development gains $ 1,621,292 $ 1,642,814
Net promote for the twelve months ended 28,378 28,378 Adjusted EBITDA-annualized $ 1,649,670 $ 1,671,192
Pro forma adjustment for mid-quarter activity and NOI from disposed properties—annualized(2,960)(8,172)
Adjusted EBITDA, including NOI from disposed properties, annualized $ 1,646,710 $ 1,663,020
Interest expense $ 68,761 $ 74,092 Amortization and write-off of deferred loan costs(3,418)(3,669)
Amortization of debt premium (discount), net 9,837 8,902 Capitalized interest 16,284 16,132
Preferred stock dividends 1,670 1,678 Third party share of fixed charges from consolidated entities(5,215)(4,009)
Our share of fixed charges from unconsolidated entities 16,933 19,808 Total fixed charges $ 104,852 $ 112,934
Total fixed charges, annualized $ 419,408 $ 451,736 Fixed charge coverage ratio 3.93x 3.68x Debt to Adjusted EBITDA: Total Prologis share of debt, net of adjustments $ 9,509,781 $ 10,244,067 Adjusted EBITDA-annualized $ 1,649,670 $ 1,671,192 Debt to Adjusted EBITDA ratio 5.76x 6.13x
Development Margin is calculated on developed properties as the estimated value at Stabilization minus estimated total investment, before closing costs, the impact of any deferred rents, taxes or third party promotes net of deferred amounts on contributions, divided by the estimated total investment.
Development Portfolio includes industrial properties that are under development and properties that are developed but have not met Stabilization.
Estimated Build Out (TEI and sq ft)- represents the estimated TEI and finished square feet available for rent upon completion of an industrial building on existing parcels of land.
FFO, as defined by Prologis; Core FFO; AFFO (collectively referred to as “FFO”). FFO is a non-GAAP measure that is commonly used in the real estate industry. The most directly comparable GAAP measure to FFO is net earnings. Although the National Association of Real Estate Investment Trusts (“NAREIT”) has published a definition of FFO, modifications to the NAREIT calculation of FFO are common among REITs, as companies seek to provide financial measures that meaningfully reflect their business.
FFO is not meant to represent a comprehensive system of financial reporting and does not present, nor do we intend it to present, a complete picture of our financial condition and operating performance. We believe net earnings computed under GAAP remains the primary measure of performance and that FFO is only meaningful when it is used in conjunction with net earnings computed under GAAP. Further, we believe our consolidated financial statements, prepared in accordance with GAAP, provide the most meaningful picture of our financial condition and our operating performance.
Copyright © 2015 Prologis
38
|
|
Notes and Definitions (continued) Supplemental 1Q 2015
NAREIT’s FFO measure adjusts net earnings computed under GAAP to exclude historical cost depreciation and gains and losses from the sales, along with impairment charges, of previously depreciated properties. We agree that these NAREIT adjustments are useful to investors for the following reasons: (i) historical cost accounting for real estate assets in accordance with GAAP assumes, through depreciation charges, that the value of real estate assets diminishes predictably over time.
NAREIT stated in its White Paper on FFO “since real estate asset values have historically risen or fallen with market conditions, many industry investors have considered presentations of operating results for real estate companies that use historical cost accounting to be insufficient by themselves.” Consequently, NAREIT’s definition of FFO reflects the fact that real estate, as an asset class, generally appreciates over time and depreciation charges required by GAAP do not reflect the underlying economic realities.
(ii) REITs were created in order to encourage public ownership of real estate as an asset class through investment in firms that were in the business of long-term ownership and management of real estate. The exclusion, in NAREIT’s definition of FFO, of gains and losses from the sales, along with impairment charges, of previously depreciated operating real estate assets allows investors and analysts to readily identify the operating results of the long-term assets that form the core of a REIT’s activity and assists in comparing those operating results between periods. We include the gains and losses (including impairment charges) from dispositions of land and development properties, as well as our proportionate share of the gains and losses (including impairment charges) from dispositions of development properties recognized by our unconsolidated entities, in our definition of FFO. We exclude the gain on revaluation of equity investments upon acquisition of a controlling interest from our definition of FFO.
Our FFO Measures At the same time that NAREIT created and defined its FFO measure for the REIT industry, it also recognized that “management of each of its member companies has the responsibility and authority to publish financial information that it regards as useful to the financial community.” We believe stockholders, potential investors and financial analysts who review our operating results are best served by a defined FFO measure that includes other adjustments to net earnings computed under GAAP in addition to those included in the NAREIT defined measure of FFO. Our FFO measures are used by management in analyzing our business and the performance of our properties and we believe that it is important that stockholders, potential investors and financial analysts understand the measures management uses.
We use these FFO measures, including by segment and region, to: (i) evaluate our performance and the performance of our properties in comparison to expected results and results of previous periods, relative to resource allocation decisions; (ii) evaluate the performance of our management; (iii) budget and forecast future results to assist in the allocation of resources; (iv) assess our performance as
compared to similar real estate companies and the industry in general; and (v) evaluate how a specific potential investment will impact our future results. Because we make decisions with regard to our performance with a long-term outlook, we believe it is appropriate to remove the effects of short-term items that we do not expect to affect the underlying long-term performance of the properties. The long-term performance of our properties is principally driven by rental income. While not infrequent or unusual, these additional items we exclude in calculating FFO, as defined by Prologis, defined below, are subject to significant fluctuations from period to period that cause both positive and negative short-term effects on our results of operations in inconsistent and unpredictable directions that are not relevant to our long-term outlook.
We use our FFO measures as supplemental financial measures of operating performance. We do not use our FFO measures as, nor should they be considered to be, alternatives to net earnings computed under GAAP, as indicators of our operating performance, as alternatives to cash from operating activities computed under GAAP or as indicators of our ability to fund our cash needs.
FFO, as defined by Prologis To arrive at FFO, as defined by Prologis, we adjust the NAREIT defined FFO measure to exclude: (i) deferred income tax benefits and deferred income tax expenses recognized by our subsidiaries; (ii) current income tax expense related to acquired tax liabilities that were recorded as deferred tax liabilities in an acquisition, to the extent the expense is offset with a deferred income tax benefit in GAAP earnings that is excluded from our defined FFO measure; (iii) unhedged foreign currency exchange gains and losses resulting from debt transactions between us and our foreign consolidated subsidiaries and our foreign unconsolidated entities; (iv) foreign currency exchange gains and losses from the remeasurement (based on current foreign currency exchange rates) of certain third party debt of our foreign consolidated subsidiaries and our foreign unconsolidated entities; and (v) mark-to-market adjustments and related amortization of debt discounts associated with derivative financial instruments.
We calculate FFO, as defined by Prologis for our unconsolidated entities on the same basis as we calculate our FFO, as defined by Prologis. We believe investors are best served if the information that is made available to them allows them to align their analysis and evaluation of our operating results along the same lines that our management uses in planning and executing our business strategy.
Core FFO In addition to FFO, as defined by Prologis, we also use Core FFO. To arrive at Core FFO, we adjust FFO, as defined by Prologis, to exclude the following recurring and non-recurring items that we recognized directly or our share of these items recognized by our unconsolidated entities to the extent they are included in FFO, as defined by Prologis:
(i) gains or losses from contribution or sale of land or development properties;
(ii) income tax expense related to the sale of investments in real estate and third-party acquisition costs related to the acquisition of real estate; (iii) impairment charges recognized related to our investments in real estate generally as a result of our change in intent to contribute or sell these properties; (iv) gains or losses from the early extinguishment of debt and redemption and repurchase of preferred stock; (v) merger, acquisition and other integration expenses; and (vi) expenses related to natural disasters.
We believe it is appropriate to further adjust our FFO, as defined by Prologis for certain recurring items as they were driven by transactional activity and factors relating to the financial and real estate markets, rather than factors specific to the on-going operating performance of our properties or investments. The impairment charges we have recognized were primarily based on valuations of real estate, which had declined due to market conditions, that we no longer expected to hold for long-term investment. Over the last few years, we made it a priority to strengthen our financial position by reducing our debt, our investment in certain low yielding assets and our exposure to foreign currency exchange fluctuations. As a result, we changed our intent to sell or contribute certain of our real estate properties and recorded impairment charges when we did not expect to recover the costs of our investment. Also, we purchased portions of our debt securities when we believed it was advantageous to do so, which was based on market conditions, and in an effort to lower our borrowing costs and extend our debt maturities. As a result, we have recognized net gains or losses on the early extinguishment of certain debt due to the financial market conditions at that time. In addition, we and our co-investment ventures make acquisitions of real estate and we believe the costs associated with these transactions are transaction based and not part of our core operations.
Copyright © 2015 Prologis
39
|
|
Notes and Definitions (continued) Supplemental 1Q 2015
We analyze our operating performance primarily by the rental income of our real estate and the revenue driven by our strategic capital business, net of operating, administrative and financing expenses. This income stream is not directly impacted by fluctuations in the market value of our investments in real estate or debt securities. Although these items discussed above have had a material impact on our operations and are reflected in our financial statements, the removal of the effects of these items allows us to better understand the core operating performance of our properties over the long term.
We use Core FFO, including by segment and region, to: (i) evaluate our performance and the performance of our properties in comparison to expected results and results of previous periods, relative to resource allocation decisions; (ii) evaluate the performance of our management; (iii) budget and forecast future results to assist in the allocation of resources; (iv) provide guidance to the financial markets to understand our expected operating performance; (v) assess our operating performance as compared to similar real estate companies and the industry in general; and (vi) evaluate how a specific potential investment will impact our future results. Because we make decisions with regard to our performance with a long-term outlook, we believe it is appropriate to remove the effects of items that we do not expect to affect the underlying long-term performance of the properties we own. As noted above, we believe the long-term performance of our properties is principally driven by rental income. We believe investors are best served if the information that is made available to them allows them to align their analysis and evaluation of our operating results along the same lines that our management uses in planning and executing our business strategy.
AFFO To arrive at AFFO, we adjust Core FFO to include realized gains from the disposition of land and development properties and to exclude our share of the impact of; (i) straight-line rents; (ii) amortization of above- and below-market lease intangibles; (iii) recurring capital expenditures; (iv) amortization of management contracts; (v) amortization of debt premiums and discounts and financing costs, net of amounts capitalized, and; (vi) stock compensation expense.
We believe AFFO provides a meaningful indicator of our ability to fund cash needs, including cash distributions to our stockholders.
Limitations on Use of our FFO Measures While we believe our defined FFO measures are important supplemental measures, neither NAREIT’s nor our measures of FFO should be used alone because they exclude significant economic components of net earnings computed under GAAP and are, therefore, limited as an analytical tool. Accordingly, these are only a few of the many measures we use when analyzing our business. Some of these limitations are: · The current income tax expenses and acquisition costs that are excluded from our defined FFO measures represent the taxes and transaction costs that are payable. Depreciation and amortization of real estate assets are economic costs that are excluded from FFO. FFO is limited, as it does not reflect the cash requirements that may be necessary for future replacements of the real estate assets. Further, the amortization of capital expenditures and leasing costs necessary to maintain the operating performance of industrial properties are not reflected in FFO.
Gains or losses from non-development property acquisitions and dispositions or impairment charges related to expected dispositions represent changes in value of the properties. By excluding these gains and losses, FFO does not capture realized changes in the value of acquired or disposed properties arising from changes in market conditions.
The deferred income tax benefits and expenses that are excluded from our defined FFO measures result from the creation of a deferred income tax asset or liability that may have to be settled at some future point. Our defined FFO measures do not currently reflect any income or expense that may result from such settlement.
The foreign currency exchange gains and losses that are excluded from our defined FFO measures are generally recognized based on movements in foreign currency exchange rates through a specific point in time. The ultimate settlement of our foreign currency-denominated net assets is indefinite as to timing and amount. Our FFO measures are limited in that they do not reflect the current period changes in these net assets that result from periodic foreign currency exchange rate movements.
The gains and losses on extinguishment of debt that we exclude from our Core FFO, may provide a benefit or cost to us as we may be settling our debt at less or more than our future obligation.
· The merger, acquisition and other integration expenses and the natural disaster expenses that we exclude from Core FFO are costs that we have incurred.
We compensate for these limitations by using our FFO measures only in conjunction with net earnings computed under GAAP when making our decisions. This information should be read with our complete consolidated financial statements prepared under GAAP. To assist investors in compensating for these limitations, we reconcile our defined FFO measures to our net earnings computed under GAAP.
Fixed Charge Coverage is defined as Adjusted EBITDA divided by total fixed charges. Fixed charges consist of net interest expense adjusted for amortization of finance costs and debt discount (premium), capitalized interest, and preferred stock dividends. We use fixed charge coverage to measure our liquidity. We believe that fixed charge coverage is relevant and useful to investors because it allows fixed income investors to measure our ability to make interest payments on outstanding debt and make distributions/dividends to preferred unitholders/stockholders. Our computation of fixed charge coverage is not calculated in accordance with applicable SEC rules and may not be comparable to fixed charge coverage reported by other companies.
General and Administrative Expenses (“G&A”) were as follows (in thousands):
Three Months Ended March 31, 2015 2014 Gross overhead $ 108,705 $ 117,249
Allocated to rental expenses(7,984)(8,123) Allocated to strategic capital expenses(20,361)(24,163)
Capitalized amounts(24,072)(21,760) G&A expenses $ 56,288 $ 63,203
We capitalize certain costs directly related to our development and leasing activities. Capitalized
G&A expenses include salaries and related costs as well as other G&A costs. The capitalized
costs were as follows (in thousands):
Three Months Ended March 31, 2015 2014 Development activities $ 17,922 $ 16,861
Leasing activities 5,048 4,718 Costs related to internally developed software 1,102 181
Total capitalized G&A $ 24,072 $ 21,760 Copyright © 2015 Prologis
40
|
|
Notes and Definitions (continued) Supplemental 1Q 2015 G&A as a Percent of Assets Under Management (in thousands):
Net G&A - midpoint of 2015 guidance range (a) ................................................................................ $ 240,000 Add: estimated 2015 strategic capital expenses............................................................................... 91,000 Less: estimated 2015 strategic capital property management expenses......................................... (43,000) Adjusted G&A, using 2015 guidanceamounts. $ 288,000 Carrying value at period end: Operating properties ... $ 39,796,838 Development portfolio - TEI.. 3,032,131 Land portfolio 1,750,644 Other real estate investments and assets held for sale 585,613 Total assets under management. $ 45,165,226
G&A as % of assets under management 0.64%
(a) This amount represents the 2015 guidance provided in this Supplemental Package.
Interest Expense consisted of the following (in thousands):
Three Months Ended March 31, 2015 2014
Gross interest expense $ 91,464 $ 102,464 Amortization of discount (premium), net..................................................... (9,837) (5,835) Amortization of deferred loan costs............................................................ 3,418 3,467 Interest expense before capitalization........................................................ 85,045 100,096 Capitalized amounts ................................................................................... (16,284) (14,573)
Interest expense $ 68,761 $ 85,523 Investment Capacity is our estimate of the gross real estate, which could be acquired by our co-investment ventures through the use of existing equity commitments from us and our partners up to the ventures maximum leverage limits. Market Classification • Global Markets feature large population centers with high per-capita consumption and are located near major seaports, airports, and ground transportation systems. • Regional Markets benefit from large population centers but typically are not as tied to the global supply chain, but rather serve local consumption and are often less supply constrained. Markets included as regional markets include: Austin, Charlotte, Cincinnati, Columbus, Denver, Hungary, Indianapolis, Juarez, Las Vegas, Louisville, Memphis, Nashville, Orlando, Phoenix, Portland, Reno, Reynosa, San Antonio, Slovakia, Sweden and Tijuana.
• Other Markets represent a small portion of our portfolio that is located outside global and regional markets. These markets include: Austria, Boston, El Paso, Jacksonville, Kansas City, Norfolk, Romania, Salt Lake City, Savannah and St Louis.
Net Asset Value (“NAV”). We consider NAV to be a useful supplemental measure of our operating performance because it enables both management and investors to estimate the fair value of our business. The assessment of the fair value of a particular segment of our business is subjective in that it involves estimates and can be calculated using various methods. Therefore, we have presented the financial results and investments related to our business segments that we believe are important in calculating our NAV but have not presented any specific methodology nor provided any guidance on the assumptions or estimates that should be used in the calculation.
The components of NAV do not consider the potential changes in rental and fee income streams or the franchise value associated with our global operating platform, strategic capital platform, or development platform.
Net Effective Rent is calculated at the beginning of the lease using the estimated total cash to be received over the term of the lease (including base rent and expense reimbursements) and annualized. Amounts derived in a currency other than the U.S. Dollar have been translated using the average rate from the previous twelve months. The per square foot number is calculated by dividing the annualized net effective rent by the occupied square feet of the lease.
Net Effective Rent Change (GAAP) represents the change on operating portfolio properties in net effective rental rates (average rate over the lease term) on new and renewed leases signed during the period as compared with the previous effective rental rates in that same space. Net Operating Income (“NOI”) represents rental income less rental expenses.
Noncontrolling Interest. The following table includes information for each entity we consolidate and in which we own less than 100% (dollars in thousands): Ownership Noncontrolling Percentage Interest Real Estate Debt Brazil Fund............................................................... 50.0% $ 56,897 $ - $ -Prologis U.S. Logistics Venture ............................... 55.0% 423,401 1,008,793 - Prologis North American Industrial Fund................. 66.1% 537,996 2,749,785 1,180,409 Other consolidated entities ...................................... various 103,707 1,013,008 17,511 Limited partners in the Operating Partnership ........ 55,833 - -
Noncontrolling interests $ 1,177,834 $ 4,771,586 $ 1,197,920
Operating Portfolio includes stabilized industrial properties in our owned and managed portfolio. A developed property moves into the Operating Portfolio when it meets Stabilization. Pro-Rata Balance Sheet and Operating Information. The consolidated amounts shown are derived from and prepared on a consistent basis with our consolidated financial statements and are adjusted to remove the amounts attributable to non-controlling interests. The Prologis share of unconsolidated co-investment ventures column was derived on an entity-by-entity basis by applying our ownership percentage to each line item to calculate our share of that line item. For purposes of balance sheet data, we used our ownership percentage at the end of the period and for operating information, we used our average ownership percentage for the period, consistent with how we calculate our share of net earnings (loss) during the period. We used a similar calculation to derive the noncontrolling interests’ share of each line item. In order to present the total owned and managed portfolio, we added our investors’ share of each line item in the unconsolidated co-investment ventures and the noncontrolling interests share of each line item to the Prologis Total Share.
Prologis Share represents our proportionate economic ownership of each entity included in our total owned and managed portfolio.
Copyright © 2015 Prologis 41
|
|
Notes and Definitions (continued) Supplemental 1Q 2015 Rental Income included the following (in thousands):
Three Months Ended March 31, 2015 2014 Rental income $ 319,715 $ 295,506
Amortization of lease intangibles(5,853)(7,694) Rental expense recoveries 94,255 87,362
Straight-lined rents 10,685 13,066 $ 418,802 $ 388,240
Same Store. We evaluate the operating performance of the operating properties we own and manage using a “Same Store” analysis because the population of properties in this analysis is consistent from period to period, thereby eliminating the effects of changes in the composition of the portfolio on performance measures. We include the properties included in our owned and managed portfolio that were in operation at January 1, 2014 and throughout the full periods in both 2014 and 2015. We have removed all properties that were disposed of to a third party from the population for both periods. We believe the factors that impact rental income, rental expenses and NOI in the Same Store portfolio are generally the same as for the total operating portfolio. In order to derive an appropriate measure of period-to-period operating performance, we remove the effects of foreign currency exchange rate movements by using the current exchange rate to translate from local currency into U.S. dollars, for both periods.
Our same store measures are non-GAAP measures that are commonly used in the real estate industry and are calculated beginning with rental income and rental expenses from the financial statements prepared in accordance with GAAP. It is also common in the real estate industry and expected from the analyst and investor community that these numbers be further adjusted to remove certain non-cash items included in the financial statements prepared in accordance with GAAP to reflect a cash same store number. In order to clearly label these metrics, we call one Same Store NOI- GAAP and one Same Store NOI-Adjusted Cash. As these are non-GAAP measures they have certain limitations as an analytical tool and may vary among real estate companies. As a result, we provide a reconciliation from our financial statements prepared in accordance with GAAP to Same Store NOI-GAAP and then to Same Store NOI-Adjusted Cash with explanations of how these metrics are calculated and adjusted.
The following is a reconciliation of our consolidated rental income, rental expenses and NOI, as included in the Consolidated Statements of Operations, to the respective amounts in our Same Store portfolio analysis (dollars in thousands): Three Months Ended
March 31, Change 2015 2014(%) Rental Income:
Per the Consolidated Statements of Operations $ 418,802 $ 388,240
Properties not included and other adjustments (a)(37,028)(47,052)
Unconsolidated Co-Investment Ventures 415,666 422,070
Same Store—Rental Income $ 797,440 $ 763,258 4.5%
Rental Expense:
Per the Consolidated Statements of Operations $ 126,934 $ 110,517
Properties not included and other adjustments (b)(5,521)(7,138)
Unconsolidated Co-Investment Ventures 97,385 101,053
Same Store—Rental Expense $ 218,798 $ 204,432 7.0%
NOI-GAAP:
Per the Consolidated Statements of Operations $ 291,868 $ 277,723
Properties not included and other adjustments(31,507)(39,914)
Unconsolidated Co-Investment Ventures 318,281 321,017
Same Store—NOI—GAAP $ 578,642 $ 558,826 3.5%
NOI-Adjusted Cash:
Same store- NOI—GAAP $ 578,642 $ 558,826 Adjustments (c)(7,964)(9,830)
Same Store—NOI- Adjusted Cash $ 570,678 $ 548,996 3.9%
(a) To calculate Same Store rental income, we exclude the net termination and renegotiation fees to allow us to evaluate the growth or decline in each property’s rental income without regard to items that are not indicative of the property’s recurring operating performance.
(b) To calculate Same Store rental expense, we include an allocation of the property management expenses for our consolidated properties based on the property management fee that is provided for in the individual management agreements under which our wholly owned management companies provide property management services (generally the fee is based on a percentage of revenue). On consolidation, the management fee income and expenses are eliminated and the actual cost of providing property management services is recognized.
(c) In order to derive Same Store- NOI—Adjusted Cash, we adjust Same Store- NOI- GAAP to exclude non-cash items included in our rental income in our GAAP financial statements, including straight line rent adjustments and adjustments related to purchase accounts to reflect leases at fair value at the time of acquisition.
Same Store Average Occupancy represents the average occupied percentage of the Same Store portfolio for the period.
Stabilization is defined when a property that was developed has been completed for one year or is 90% occupied. Upon stabilization, a property is moved into our Operating Portfolio.
Strategic Capital NOI represents strategic capital income less strategic capital expenses.
Copyright © 2015 Prologis
42
|
|
Notes and Definitions (continued)
Supplemental 1Q 2015
Tenant Retention is the square footage of all leases rented by existing tenants divided by the square footage of all expiring and rented leases during the reporting period, excluding the square footage of tenants that default or buy-out prior to expiration of their lease, short-term tenants and the square footage of month-to-month leases.
Total Expected Investment (“TEI”) represents total estimated cost of development or expansion, including land, development and leasing costs. TEI is based on current projections and is subject to change. Non-U.S. dollar investments are translated to U.S. dollars using the exchange rate at period end or the date of development start for purposes of calculating development starts in any period.
Turnover Costs represent the costs incurred in connection with the signing of a lease, including leasing commissions and tenant improvements. Tenant improvements include costs to prepare a space for a new tenant and for a lease renewal with the same tenant. It excludes costs to prepare a space that is being leased for the first time (i.e. in a new development property).
Value-Added Acquisitions are properties we acquire for which we believe the discount in pricing attributed to the operating challenges could provide greater returns post-stabilization than the returns of stabilized properties that are not Value-Added Acquisitions. Value Added Acquisitions must have one or more of the following characteristics: (i) existing vacancy in excess of 20%; (ii) short term lease roll-over, typically during the first two years of ownership; (iii) significant capital improvement requirements in excess of 10% of the purchase price and must be invested within the first two years of ownership.
Value-Added Conversions represent the repurposing of industrial properties to a higher and better use, including office, residential, retail, research and development, data center, self storage or manufacturing with the intent to ultimately sell the property once repositioned. Activities required to prepare the property for conversion to a higher and better use may include such activities as re-zoning, re-designing, re-constructing, and re-tenanting. The economic gain on sales of value added conversions represents the amount by which the sales proceeds exceeds the amount included in NAV for the disposed property.
Value Creation represents the value that we will create through our development and leasing activities. We calculate value creation by estimating the NOI that the property will generate at Stabilization and applying an estimated stabilized capitalization rate applicable to that property. The value creation is calculated as the amount by which the estimated value exceeds our total expected investment and does not include any fees or promotes we may earn. This can also include realized economic gains from value-added conversion properties.
Weighted Average Estimated Stabilized Yield is calculated as NOI assuming stabilized occupancy divided by Acquisition Cost or TEI, as applicable.
Copyright © 2015 Prologis
43