 Unaudited
Fourth Quarter 2013
Earnings Release and Supplemental Information
Exhibit 99.1 |
| Unaudited
Fourth Quarter 2013
Earnings Release and Supplemental Information
Exhibit 99.1 |
 Copyright ©
2014 Prologis
Supplemental 4Q 2013
Table of Contents
Prologis
Park
Iwanuma,
Miyagi,
Japan
Douglas
Hill
Park
Distribution
Center,
Atlanta,
Georgia,
USA
Cover:
Prologis Park 275,
Hebron, Kentucky, USA
Prologis
Park
Nove
Mesto,
Bratislava,
Slovakia
Overview
Press Release
1
Highlights
Company Profile
4
Company Performance
5
Financial Information
Consolidated Balance Sheets
6
Consolidated Statements of Operations
7
Reconciliation of Net Earnings (Loss) to FFO
8
EBITDA Reconciliation
9
Pro-rata Information
10
Operations Overview
Operating Portfolio
12
Operating Metrics
15
Customer Information
17
Capital Deployment
Overview
18
Dispositions and Contributions
19
Third Party Building Acquisitions and Equity Invested in
Co-Investment Ventures
20
Development Starts
21
Value Creation from Development Stabilization
22
Development Portfolio
23
Land Portfolio
24
Co-Investment Ventures
Summary and Financial Highlights
26
Operating and Balance Sheet Information
27
Capitalization
Debt and Equity Summary
28
Debt Covenants and Other Metrics
29
Assets Under Management
30
Net Asset Value
Components
31
Notes and Definitions
33 |
 Copyright ©
2014 Prologis
1
Prologis, Inc. Announces Fourth Quarter 2013 Earnings Results
-
Leased record 43.7 million square feet in Q4 and 152 million square
feet in 2013 - -
Occupancy increased to 95.1 percent at year end -
-
$426 million in estimated value creation with estimated margin of 30.4
percent from 2013 stabilizations- -
Raised record $4.1 billion of third-party equity in 2013 -
SAN FRANCISCO (Jan. 30, 2014) – Prologis, Inc. (NYSE: PLD), the leading
global owner, operator and developer of industrial real estate, today reported
results for the fourth quarter and full year 2013.
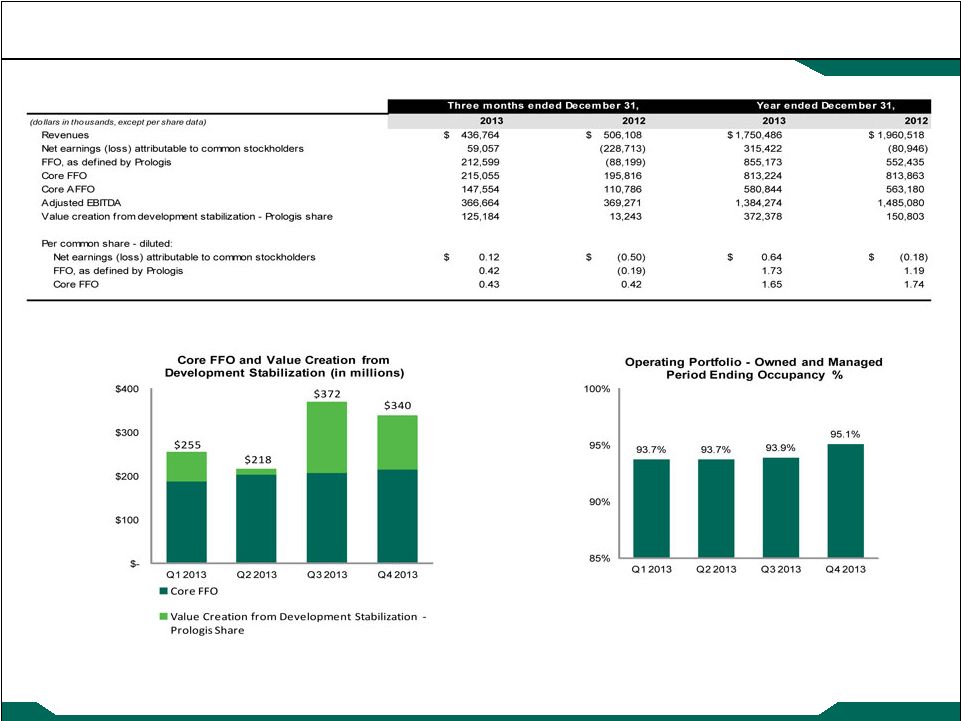
Core funds from operations (Core FFO) per fully diluted share was $0.43 for
the fourth quarter 2013 compared to $0.42 for the same period in 2012. Core
FFO per fully diluted share in 2013 was $1.65 compared to $1.74 for 2012.
Net earnings per fully diluted share was $0.12 for the fourth quarter 2013
compared to a net loss of $0.50 for the same period in 2012. Net earnings per
share was $0.64 for 2013 compared to a net loss of $0.18 in 2012. The year-
over-year increase was primarily due to gains on the disposition of assets.
“Our financial and operating results for the fourth quarter and full year reflect
the strong market fundamentals that continued throughout 2013,” said Hamid
R. Moghadam, chairman and CEO, Prologis. “We significantly increased
occupancy with solid rent growth, exceeded our value creation objectives with
above-average development margins, and substantially grew our Investment
Management business.”
“As we look forward, the combination of rental growth, the profitable build-out of
our land bank, and improvements in efficiencies resulting from our global scale
sets us up well for an extended period of robust earnings growth,” Moghadam
added.
Operating Portfolio Metrics
The company leased a record 43.7 million square feet (4.1 million square
meters) in its combined operating and development portfolios in the fourth
quarter, and 152 million square feet (14.1 million square meters) in 2013.
Prologis ended the quarter with 95.1 percent occupancy in its operating
portfolio, up 120 basis points over the prior quarter.
Tenant retention in the quarter was 86.8 percent, with tenant renewals totaling
27.4 million square feet (2.5 million square meters). GAAP rental rates on
leases signed in the quarter increased 5.9 percent from prior rents compared to
a decrease of 2.1 percent in the same period in 2012.
In the fourth quarter, GAAP same-store net operating income (NOI) increased
2.7 percent, and 3.0 percent on an adjusted cash basis.
Investment Management
During the fourth quarter, Prologis raised $1.8 billion in third-party equity,
leading to a record $4.1 billion in 2013. With the closing of Prologis U.S.
Logistics Venture (USLV), the company has $26.4 billion in assets under
management in 15 ventures.
Capital Deployment
The company increased its total assets owned and under management to
$48.2 billion, up from $44.8 billion at December 31, 2012, an increase of 7.8
percent.
Acquisitions & Equity Investments in Co-investment Ventures
During the fourth quarter, the company invested $539 million ($351 million
Prologis’ share) in building acquisitions and equity in Prologis SGP Mexico.
The stabilized capitalization rate on building acquisitions was 6.7 percent. In
2013, the company invested $2.4 billion ($1.8 billion Prologis’ share) in building
acquisitions and equity in six of its co-investments. The stabilized capitalization
rate on building acquisitions was 6.5 percent.
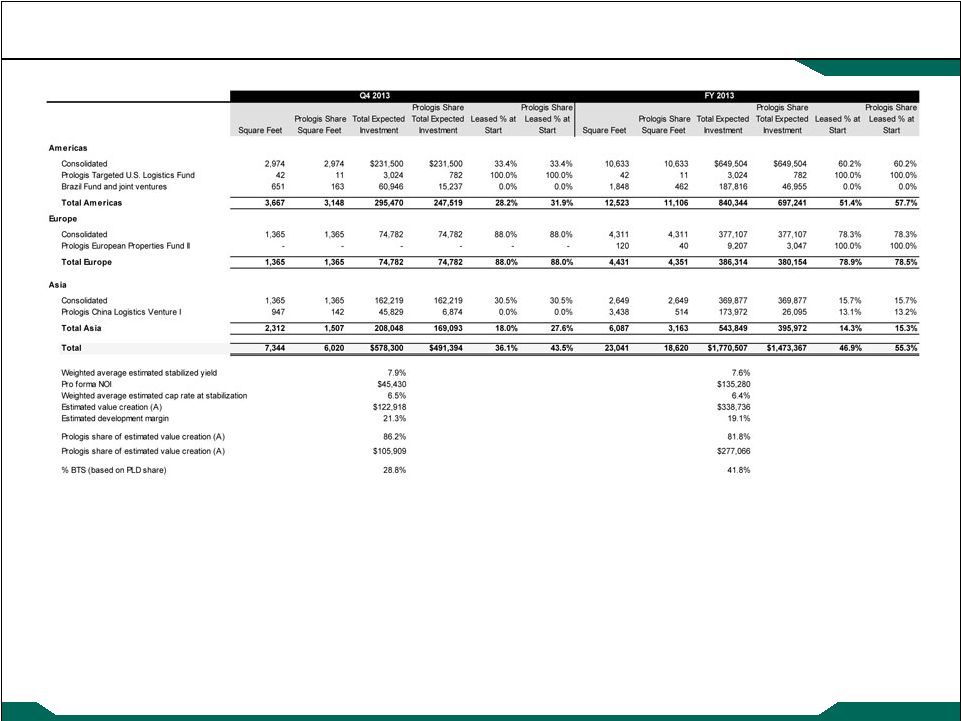
Development Starts and Pipeline
During the quarter, the company started $578 million ($491 million Prologis’
share) of new development projects, 29 percent of which were build-to-suits. In
2013, the company initiated $1.8 billion ($1.5 billion Prologis’ share) of new
development projects, 42 percent of which were build-to-suits. The starts had
an estimated weighted average yield at stabilization of 7.6 percent and an
estimated development margin of 19.1 percent. With these projects, the
company monetized $450 million of land, and its estimated share of value
creation on these starts was $277 million.
The company stabilized $514 million ($429 million Prologis’ share) in
development projects during the fourth quarter, with an estimated margin of
27.9 percent and $143 million ($125 million Prologis’ share) in estimated value
creation. For 2013, the company stabilized $1.4 billion ($1.2 billion Prologis’
|
 Copyright ©
2014 Prologis
2 |
 Copyright ©
2014 Prologis
3 |
 Copyright ©
2014 Prologis
Supplemental 4Q 2013
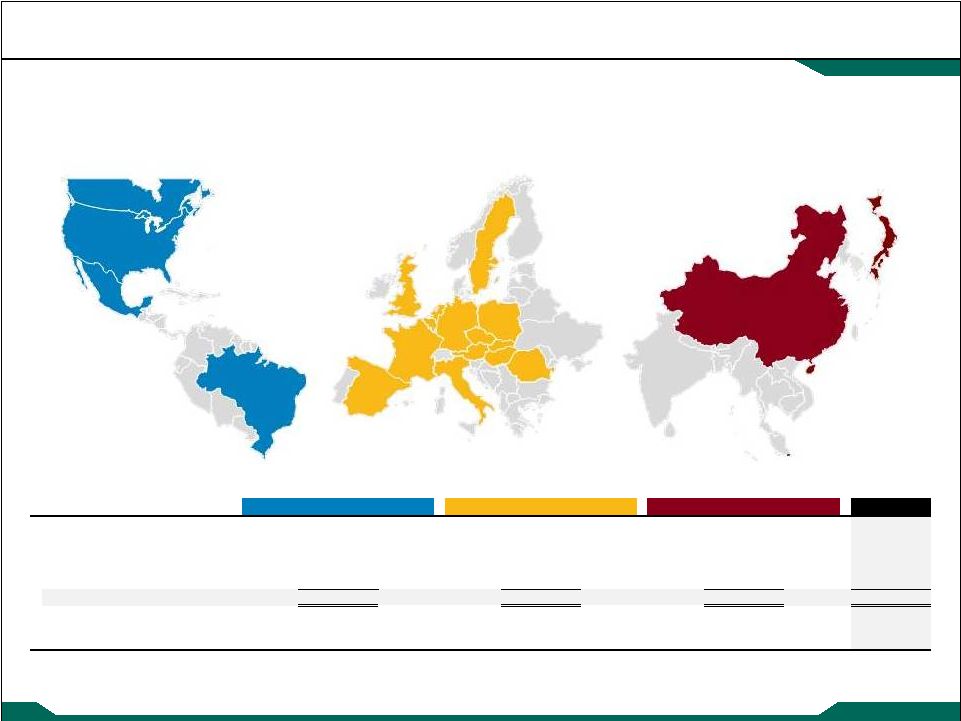
Prologis
is
the
leading
owner,
operator
and
developer
of
industrial
real
estate,
focused
on
global
and
regional
markets
across
the
Americas,
Europe
and
Asia.
As
of
December
31,
2013,
Prologis
owned
or
had
investments
in,
on
a
wholly
owned
basis
or
through
co-investment
ventures,
properties
and
development
projects
totaling
569
million
square
feet
(52.9
million
square
meters)
in
21
countries.
These properties are leased to more than 4,500 customers, including
third-party logistics providers, transportation companies, retailers,
manufacturers and other enterprises. Highlights
Company Profile
4
(A)
Generally represents properties in which Prologis has an ownership interest but does
not manage (6 msf) and other properties owned by Prologis (4 msf), which includes value added
properties (2 msf).
(B)
Original cost basis for the total land portfolio is $2.5 billion.
Number of operating portfolio buildings
2,238
611
72
357
142
30
17
5
8
7
2
1
Total (msf)
381
149
39
$1,228
$433
$709
6,997
2,949
138
$914
$612
$59
TOTAL
529
$1,585
$2,370
10
30
569
10,084
2,921
Land (acres)
Land book value (millions) (B)
AMERICAS (4 countries)
ASIA (3 countries)
EUROPE (14 countries)
Operating Portfolio (msf)
Development Portfolio (msf)
Other (msf) (A)
Development portfolio TEI (millions) |
 Copyright ©
2014 Prologis
Supplemental 4Q 2013
Highlights
Company Performance
5 |
 Copyright ©
2014 Prologis
Supplemental 4Q 2013
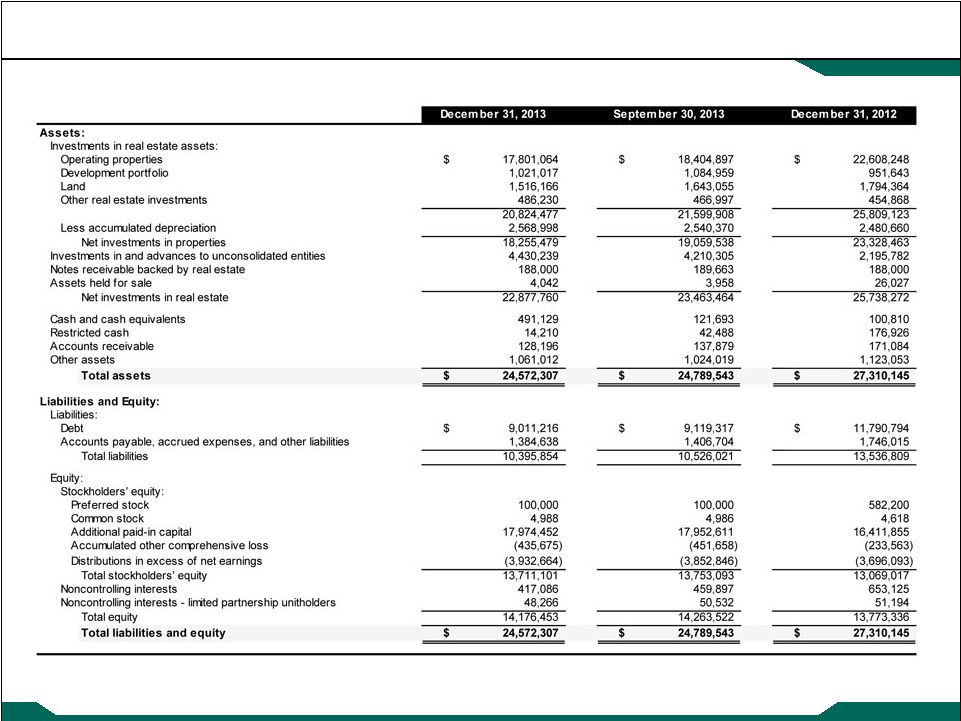
Financial Information
Consolidated Balance Sheets
6
(in thousands) |
 Copyright ©
2014 Prologis
Supplemental 4Q 2013
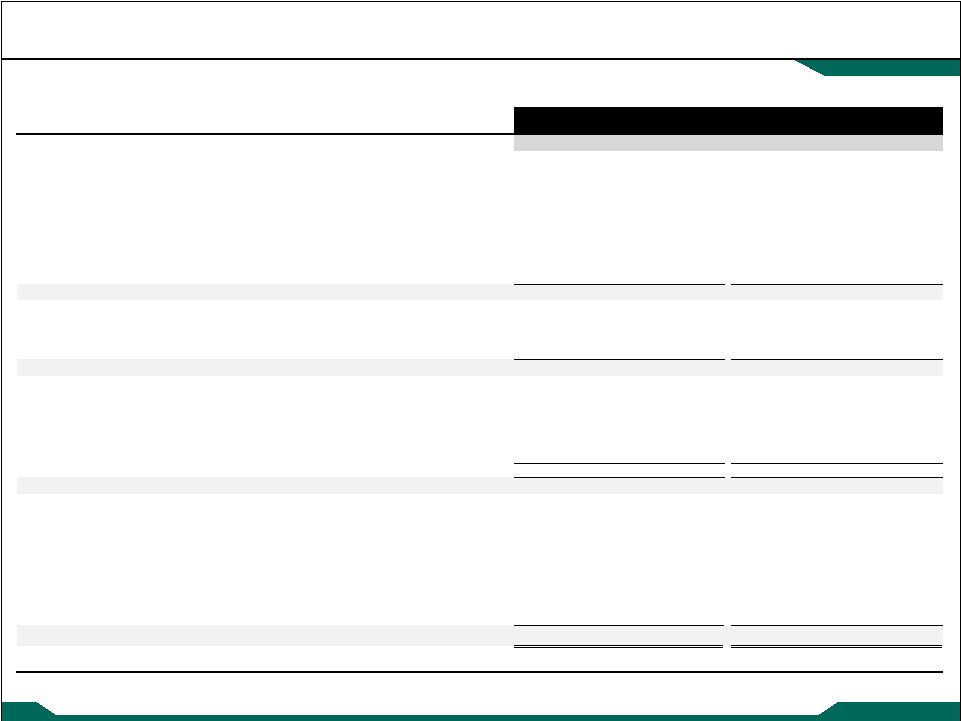
Financial Information
Consolidated Statements of Operations
7
(A) See Calculation of Per Share Amounts in the Notes and Definitions.
(in thousands, except per share amounts)
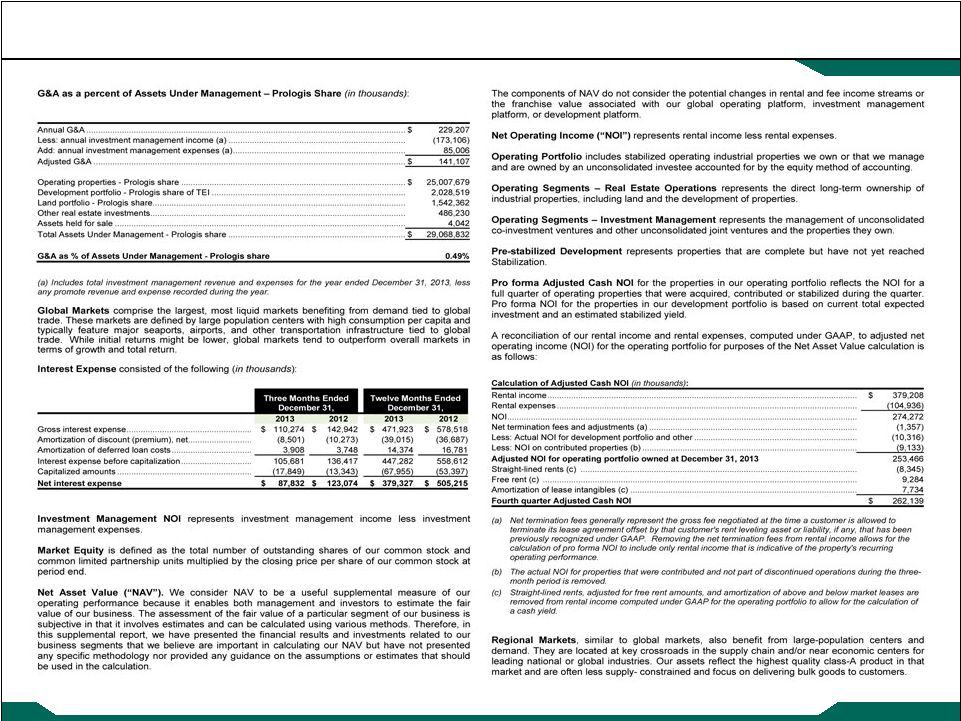
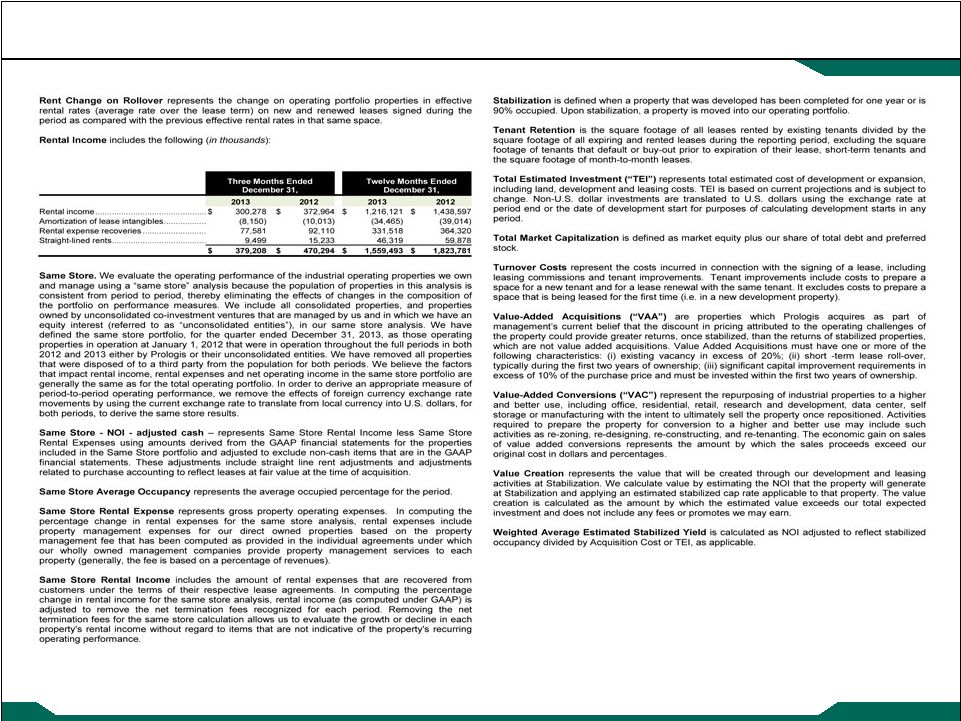
379,208
$
470,294
$
1,559,493
$
1,823,781
$
53,907
31,715
179,472
126,779
3,649
4,099
11,521
9,958
436,764
506,108
1,750,486
1,960,518
104,936
127,916
451,938
491,239
22,341
16,134
89,279
63,820
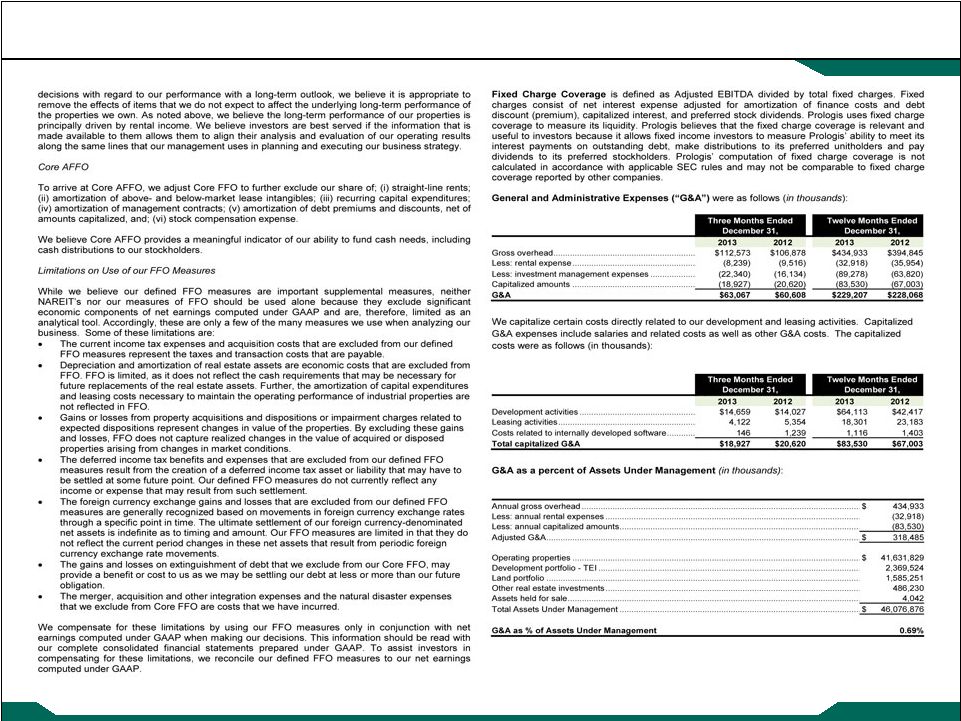
63,067
60,608
229,207
228,068
165,453
183,338
648,668
724,262
9,488
9,414
26,982
26,556
-
28,103
-
80,676
-
243,138
-
252,914
365,285
668,651
1,446,074
1,867,535
71,479
(162,543)
304,412
92,983
37,666
11,229
97,220
31,676
4,147
5,107
17,549
22,299
(87,832)
(123,074)
(379,327)
(505,215)
151,702
24,639
597,656
305,607
(32,619)
(2,567)
(24,234)
(19,918)
(112,859)
(19,033)
(277,014)
(14,114)
-
-
-
(16,135)
(39,795)
(103,699)
31,850
(195,800)
31,684
(266,242)
336,262
(102,817)
22,199
3,364
106,733
3,580
9,485
(269,606)
229,529
(106,397)
1,832
5,646
6,970
40,827
56,952
48,620
116,550
35,098
58,784
54,266
123,520
75,925
68,269
(215,340)
353,049
(30,472)
(7,077)
(3,068)
(10,128)
(9,248)
61,192
(218,408)
342,921
(39,720)
(2,135)
(10,305)
(18,391)
(41,226)
-
-
(9,108)
-
59,057
$
(228,713)
$
315,422
$
(80,946)
$
503,760
462,346
491,546
461,848
0.12
$
(0.50)
$
0.64
$
(0.18)
$
2013
2012
Twelve Months Ended
December 31,
Expenses:
2013
2012
Revenues:
Rental income
Investment management income
Development management and other income
Total revenues
Three Months Ended
December 31,
Interest expense
Rental expenses
Investment management expenses
General and administrative expenses
Impairment of real estate properties
Depreciation and amortization
Merger, acquisition and other integration expenses
Total expenses
Operating income (loss)
Other income (expense):
Earnings from unconsolidated entities, net
Interest income
Other expenses
Discontinued operations:
Impairment of other assets
Gains on acquisitions and dispositions of investments in real estate, net
Foreign currency and derivative gains (losses) and other income (expenses), net
Losses on early extinguishment of debt, net
Total other income (expense)
Earnings (loss) before income taxes
Income tax expense - current and deferred
Earnings (loss) from continuing operations
Income attributable to disposed properties and assets held for sale
Net gains on dispositions, including related impairment charges and taxes
Consolidated net earnings (loss)
Net earnings attributable to noncontrolling interests
Net earnings (loss) attributable to controlling interests
Preferred stock dividends
Net earnings (loss) attributable to common stockholders
Total discontinued operations
Net earnings (loss) per share attributable to common stockholders - Diluted
Weighted average common shares outstanding - Diluted (A)
Loss on preferred stock redemption |
 Copyright ©
2014 Prologis
Supplemental 4Q 2013
Financial Information
Reconciliations of Net Earnings (Loss) to FFO
8
59,057
$
(228,713)
$
315,422
$
(80,946)
$
159,489
177,702
624,573
705,717
-
13,141
-
34,801
(76,751)
(61,434)
(271,315)
(207,033)
(1,310)
(5,592)
(8,993)
(27,680)
42,107
20,740
153,710
115,790
1,738
2,292
6,082
11,533
184,330
(81,864)
819,479
552,182
33,457
(666)
32,870
14,892
1,704
(2,162)
656
(8,804)
(6,892)
(3,507)
2,168
(5,835)
212,599
(88,199)
855,173
552,435
(117,887)
(5,835)
(336,815)
(121,303)
112,859
19,033
286,122
14,114
Our share of reconciling items included in earnings from unconsolidated entities
7,484
12,717
8,744
23,097
-
229,997
-
264,844
-
28,103
-
80,676
2,456
284,015
(41,949)
261,428
215,055
$
195,816
$
813,224
$
813,863
$
(5,011)
(5,543)
(22,968)
(27,753)
(31,445)
(36,037)
(93,841)
(90,144)
(28,076)
(26,970)
(102,138)
(95,566)
(18,632)
(19,481)
(64,094)
(56,629)
Amortization of management contracts
1,332
1,805
5,726
6,419
Amortization of debt discounts (premiums) and financing costs, net of capitalization
(4,528)
(6,877)
(19,387)
(19,688)
Cash received on net investment hedges
1,804
-
7,848
-
Stock compensation expense
17,055
8,073
56,474
32,678
Core AFFO
147,554
$
110,786
$
580,844
$
563,180
$
Common stock dividends
141,127
$
131,624
$
554,242
$
522,986
$
2012
Twelve Months Ended
December 31,
2013
2012
Three Months Ended
December 31,
Unrealized foreign currency and derivative losses (gains) and related amortization, net
Deferred income tax expense (benefit)
Our share of reconciling items included in earnings from unconsolidated co-investment
ventures Impairment charges on certain real estate properties
2013
Our share of reconciling items included in earnings from other unconsolidated joint ventures
Straight-lined rents and amortization of lease intangibles
Property improvements
Tenant improvements
Leasing commissions
Reconciliation of net earnings (loss) to FFO
Subtotal-NAREIT defined FFO
FFO, as defined by Prologis
Reconciling items related to noncontrolling interests
Core FFO
Net earnings (loss) attributable to common stockholders
Add (deduct) NAREIT defined adjustments:
Add (deduct) our defined adjustments:
Real estate related depreciation and amortization
Net gains on non-FFO acquisitions and dispositions
Our share of reconciling items included in earnings from unconsolidated co-investment
ventures Adjustments to arrive at Core Adjusted FFO ("Core AFFO"), including our share
of unconsolidated entities: Adjustments to arrive at Core FFO, including our share of
unconsolidated entities: Adjustments to arrive at Core FFO
Impairment charges
Merger, acquisition and other integration expenses
Losses on early extinguishment of debt and redemption of preferred stock, net
Net gains on acquisitions and dispositions of investments in real estate, net of expenses
(in thousands) |
 Copyright ©
2014 Prologis
Supplemental 4Q 2013
Financial Information
EBITDA Reconciliation
9
Reconciliation of net earnings (loss) to Adjusted EBITDA
59,057
$
(228,713)
$
315,422
$
(80,946)
$
(208,654)
(73,259)
(714,206)
(371,301)
165,453
183,338
648,668
724,262
87,832
123,074
379,327
505,215
112,859
19,033
277,014
14,114
22,199
3,364
106,733
3,580
-
-
(29,533)
12,352
(1,832)
(5,646)
(6,970)
(40,827)
-
(113)
-
(431)
7,077
3,068
10,128
9,248
2,135
10,305
27,499
41,226
33,457
(666)
32,870
14,892
Stock compensation expense (B)
17,055
8,073
59,474
32,678
1,992
-
2,977
-
-
243,138
-
299,645
-
28,103
-
80,676
298,630
313,099
1,109,403
1,244,383
(6,004)
(2,330)
(14,963)
1,993
50,293
32,101
172,975
129,547
19,186
22,659
89,269
92,381
1,086
5,674
2,222
11,673
4,411
1,271
14,898
6,738
(6,892)
(3,507)
2,168
(5,835)
5,954
-
8,302
-
-
304
-
4,200
366,664
$
369,271
$
1,384,274
$
1,485,080
$
Depreciation and amortization from continuing operations
Pro forma adjustment (A)
2012
2013
Interest expense from continuing operations
Current and deferred income tax expense from continuing operations
Twelve Months Ended
December 31,
2013
2012
Net gains on acquisitions and dispositions of investments in real estate, net
Net earnings (loss) attributable to common stockholders
Three Months Ended
December 31,
Losses on early extinguishment of debt
Adjusted EBITDA
Interest expense
Current income tax expense
Depreciation and amortization
Unrealized losses (gains) and deferred income tax expense (benefit), net
Income attributable to disposal properties and assets held for sale
Net losses (gains) on dispositions of investments in real estate, net
Adjusted EBITDA, prior to our share of unconsolidated entities
Unrealized foreign currency and derivative losses (gains) and related amortization, net
Net earnings attributable to noncontrolling interest
Preferred stock dividends and loss on preferred stock redemption
NOI attributable to assets held for sale
Impairment charges
Merger, acquisition and other integration expenses
Acquisition expenses
Acquisition expenses
Our share of reconciling items from unconsolidated entities:
Losses on early extinguishment of debt
Impairment of real estate properties and other assets
(in thousands)
(A)
Adjustments during 2013 include the effects of Nippon Prologis REIT, Inc.
(“NPR”) and Prologis European Logistics Partners Sarl (“PELP”) as if we made the first quarter contribution at the
beginning of the year (i.e. removing actual NOI recognized and replacing with an
estimate of our share of NOI and fees). Adjustments during 2012 include the effects of Prologis North
American Industrial Fund II and Prologis California to reflect NOI for the full
period. (B)
The twelve months ended December 31, 2013 include an adjustment for investment
management expense related to the promote earned in the second quarter as the promote revenue is not
included in Adjusted EBITDA. |
  Copyright ©
2014 Prologis
Supplemental 4Q 2013
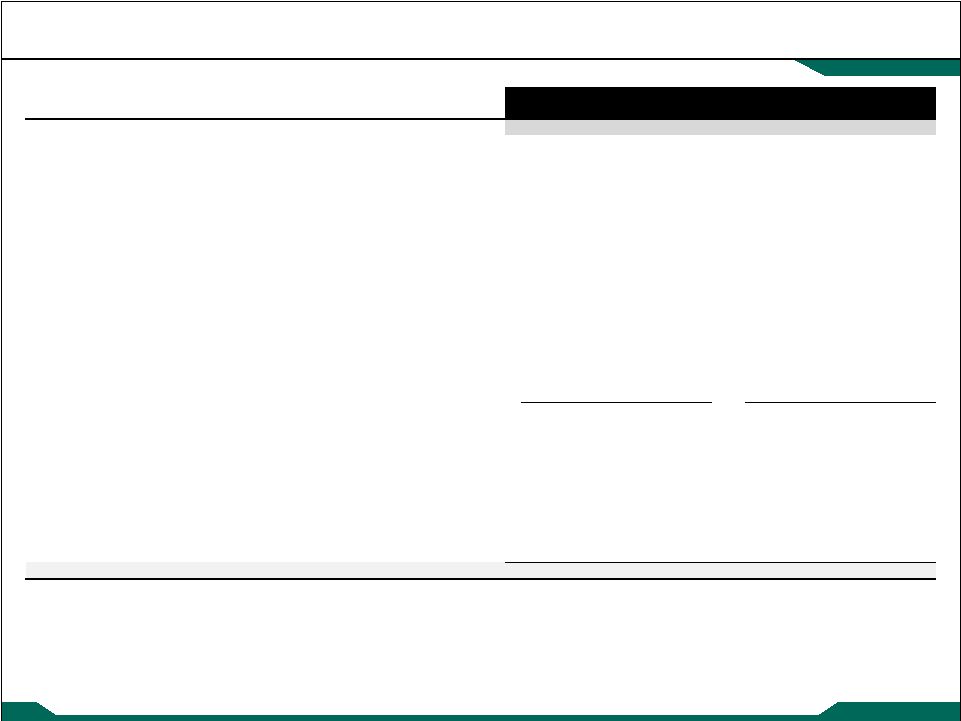
Financial Information
Pro-rata Balance Sheet Information
10
(in thousands)
Investments in real estate assets:
17,801,064
$
(497,512)
$
7,206,615
$
24,510,167
$
17,121,662
$
41,631,829
3,023,413
(25,665)
118,680
3,116,428
241,146
3,357,574
(2,568,998)
23,756
(501,377)
(3,046,619)
(1,266,800)
(4,313,419)
18,255,479
(499,421)
6,823,918
24,579,976
16,096,008
40,675,984
4,430,239
(84,321)
(4,345,918)
-
84,321
84,321
1,886,589
(114,545)
176,634
1,948,678
839,944
2,788,622
Total assets
24,572,307
$
(698,287)
$
2,654,634
$
26,528,654
$
17,020,273
$
43,548,927
Liabilities:
9,011,216
$
(175,211)
$
2,107,076
$
10,943,081
$
5,780,648
$
16,723,729
1,384,638
(57,724)
547,558
1,874,472
1,029,239
2,903,711
Total liabilities
10,395,854
(232,935)
2,654,634
12,817,553
6,809,887
19,627,440
Equity:
13,711,101
-
-
13,711,101
10,210,386
23,921,487
465,352
(465,352)
-
-
-
-
Total equity
14,176,453
(465,352)
-
13,711,101
10,210,386
23,921,487
Total liabilities and equity
$
24,572,307
$
(698,287)
$
2,654,634
$
26,528,654
$
17,020,273
$
43,548,927
Noncontrolling interests
Debt
Other liabilities
Stockholders' / partners' equity
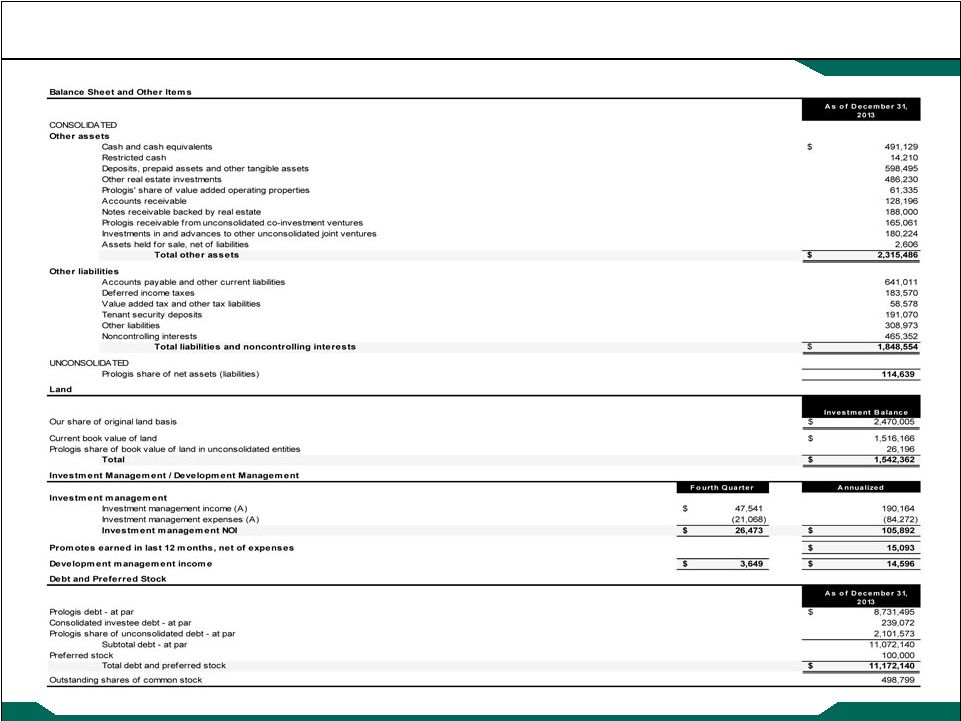
On this page and the following page, we present balance sheet and income statement information on a
pro-rata basis reflecting our proportionate economic ownership of each entity included in
our Total Owned and Managed portfolio. The consolidated amounts shown are derived from, and
prepared on a consistent basis with, our consolidated financial statements. The PLD Share of
Unconsolidated Co-Investment Ventures column was derived on an entity-by-entity basis by
applying our ownership percentage to each line item to calculate our share of that line item.
For purposes of balance sheet data, we used our ownership percentage at the end of the period and for operating information, we used
our average ownership percentage for the period, consistent with how we calculate our share of net
earnings (loss) during the period. We used a similar calculation to derive the
noncontrolling interests’ share of each line item. In order to present the Total Owned and Managed portfolio, we added our investors’
share of each line item in the unconsolidated co-investment ventures and the noncontrolling
interests share of each line item to the PLD Total Share. PLD Total
Share
Investors'
Share of
Ventures
Total Owned
and Managed
Assets:
Plus PLD Share of
Unconsolidated
Co-Investment
Ventures
Net investments in properties
Pro-rata Balance Sheet Information as of
December 31, 2013
Consolidated
Less Non
Controlling
Interest
Liabilities and Equity:
Gross operating properties
Other real estate
Less accumulated depreciation
Investments in unconsolidated entities
Other assets |
 Copyright ©
2014 Prologis
Supplemental 4Q 2013
Financial Information
Pro-rata Operating Information
11
(in thousands)
379,208
$
(11,396)
$
139,395
$
507,207
$
329,627
$
836,834
$
53,907
-
-
53,907
-
53,907
3,649
(295)
1,244
4,598
2,014
6,612
436,764
(11,691)
140,639
565,712
331,641
897,353
104,936
(2,514)
30,159
132,581
76,424
209,005
22,341
-
-
22,341
-
22,341
63,067
-
8,898
71,965
17,980
89,945
165,453
(2,539)
48,009
210,923
118,236
329,159
9,488
(351)
7,727
16,864
21,476
38,340
365,285
(5,404)
94,793
454,674
234,116
688,790
-
-
71,479
(6,287)
45,846
111,038
97,525
208,563
36,802
(218)
(36,584)
-
-
-
864
-
-
864
-
864
4,147
-
428
4,575
569
5,144
(87,832)
1,605
(18,117)
(104,344)
(54,086)
(158,430)
151,702
(1,418)
6,795
157,079
20,294
177,373
(32,619)
437
2,633
(29,549)
3,560
(25,989)
(112,859)
109
(1,021)
(113,771)
(1,446)
(115,217)
(22,199)
705
20
(21,474)
408
(21,066)
58,784
(2,010)
-
56,774
2,010
58,784
68,269
(7,077)
-
61,192
68,834
130,026
(7,077)
7,077
-
-
-
-
(2,135)
-
-
(2,135)
-
(2,135)
59,057
-
-
59,057
68,834
127,891
159,489
(2,962)
48,006
204,533
118,646
323,179
(76,751)
2,077
(6,534)
(81,208)
(20,712)
(101,920)
(1,310)
1,310
-
-
-
-
33,457
(425)
(1,952)
31,080
(3,384)
27,696
1,704
-
(4,305)
(2,601)
(6,931)
(9,532)
35,215
-
(35,215)
-
-
-
1,738
-
-
1,738
-
1,738
212,599
-
-
212,599
156,453
369,052
(117,887)
-
6,398
(111,489)
15,255
(96,234)
112,859
-
1,086
113,945
1,272
115,217
7,484
-
(7,484)
-
-
-
215,055
$
-
$
-
$
215,055
$
172,980
$
388,035
$
Foreign currency and derivative gains (losses) and other income (expenses),
net Net earnings (loss) attributable to common stockholders
FFO, as defined by Prologis
Net losses (gains) on acquisitions and dispositions of investments in real estate,
net of expenses Our share of reconciling items included in earnings from
unconsolidated entities Losses (gains)
on
early
extinguishment
of
debt
and
redemption
of
preferred
stock,
net
Core FFO
Gains (losses) on early extinguishment of debt, net
Income
tax
benefit
(expense)
-
current
and
deferred
Discontinued operations income (loss)
Net loss (earnings) attributable to noncontrolling interests
Preferred stock dividends
Consolidated net earnings (loss)
Deferred income tax expense (benefit)
Our share of reconciling items included in earnings from other unconsolidated joint
ventures Add (deduct) adjustments to arrive at FFO, as defined by
Prologis: Our share of reconciling items included in earnings from
unconsolidated co-investment ventures Real estate related depreciation and
amortization Net losses (gains) on non-FFO acquisitions and
dispositions Reconciling items related to noncontrolling interests
Unrealized foreign currency, derivative losses (gains) and related amortization,
net Earnings from other unconsolidated joint ventures, net
Total Owned
and Managed
Plus PLD Share of
Unconsolidated
Co-Investment
Ventures
PLD Total
Share
Less Non
Controlling
Interest
Total revenues
Pro-rata Operating Information for
Three Months Ended December 31, 2013
Consolidated
General and administrative expenses
Adjustments to arrive at Core FFO, including our share of unconsolidated
entities: Interest expense
Gains on acquisitions and dispositions of investments in real estate, net
Investors'
Share of
Ventures
Development management and other income
Expenses:
Rental expenses
Investment management expenses
Revenues:
Rental income
Investment management income
Depreciation and amortization
Other expenses
Total expenses
Operating income (loss)
Interest income
Earnings from unconsolidated co-investment ventures, net
|
 Copyright ©
2014 Prologis
Supplemental 4Q 2013
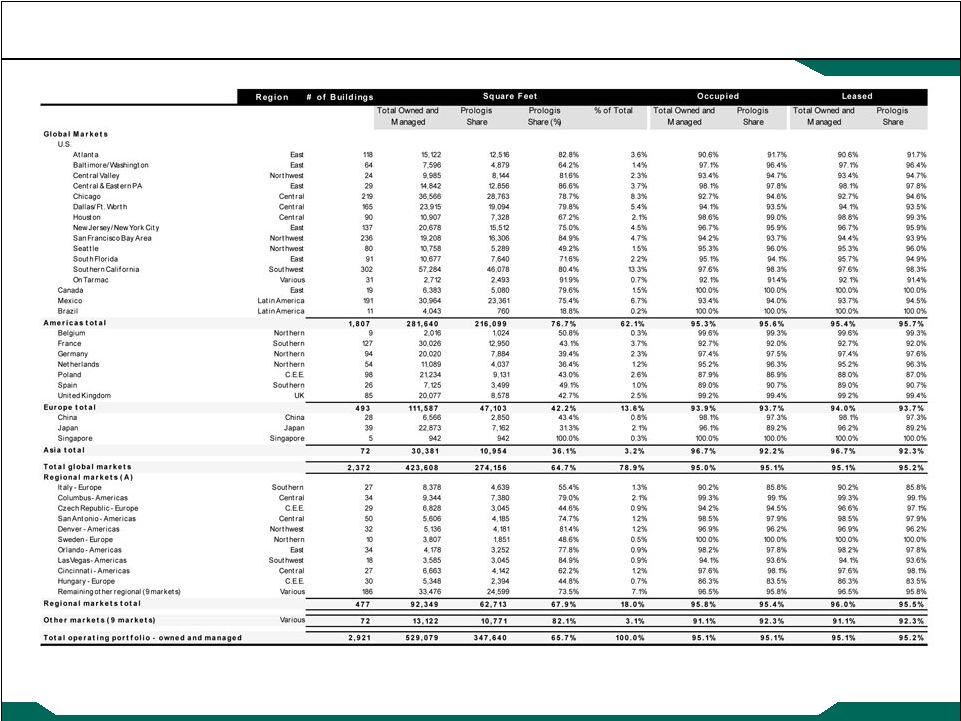
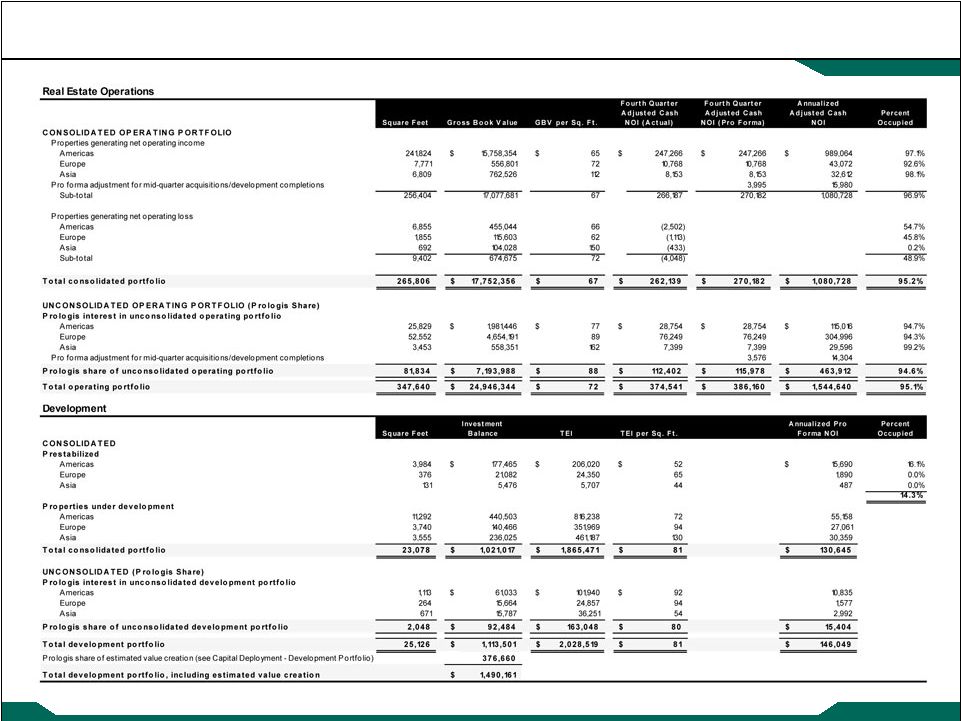
Operations Overview
Operating Portfolio –
Square Feet, Occupied and Leased
12
(A) Selected and ordered by Prologis share of NOI ($).
(square feet in thousands) |
 Copyright ©
2014 Prologis
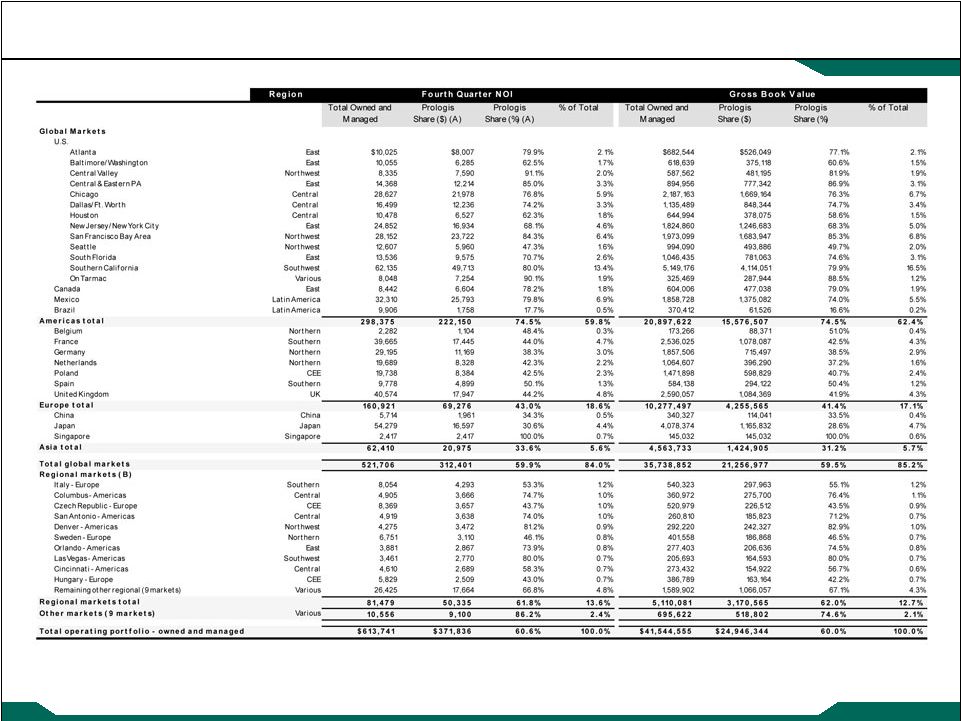
Supplemental 4Q 2013
Operations Overview
Operating Portfolio –
NOI and Gross Book Value
13
(A)
Prologis’
share of NOI for the properties that were contributed to the co-investment
ventures includes 100% of the NOI until the contribution date and then Prologis’
share subsequent to the
contribution.
(B)
Selected and ordered by Prologis share of NOI ($).
(dollars in thousands) |
 Copyright ©
2014 Prologis
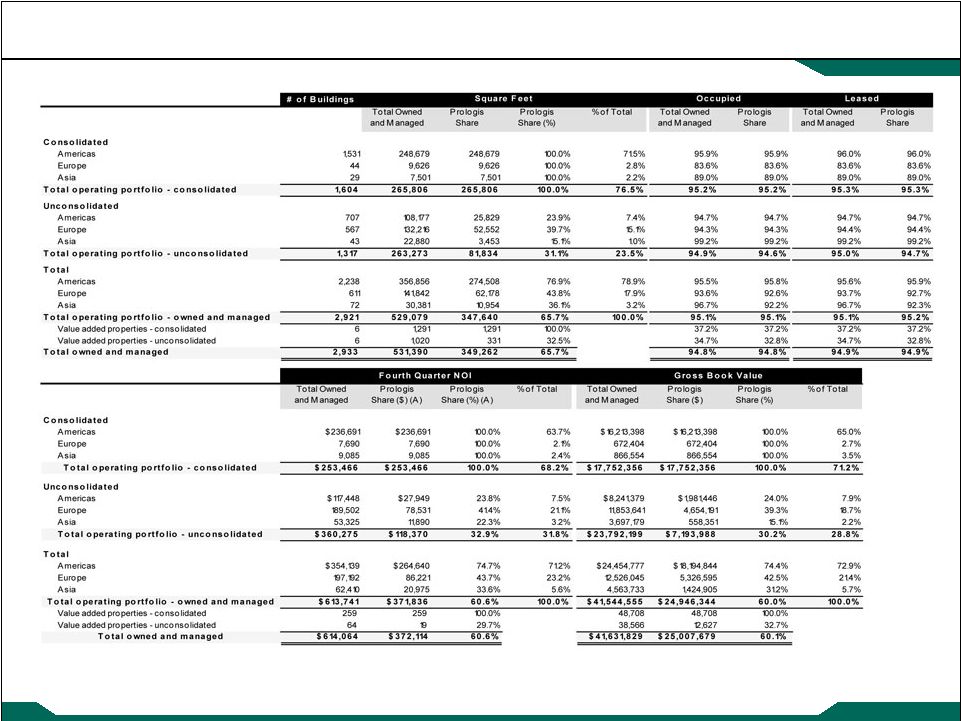
Supplemental 4Q 2013
14
(A)
Prologis’
share of NOI for the properties that were contributed to the co-investment
ventures includes 100% of the NOI until the contribution date and then Prologis’
share subsequent to the
contribution.
Operations Overview
Operating Portfolio –
Summary by Division
(square feet and dollars in thousands) |
 Copyright ©
2014 Prologis
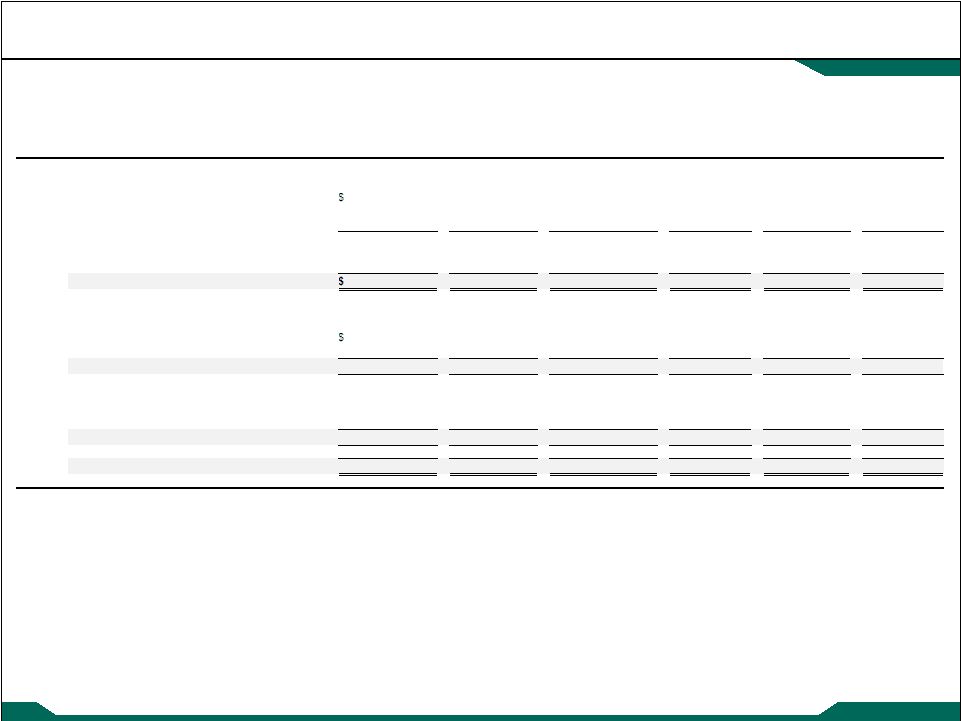
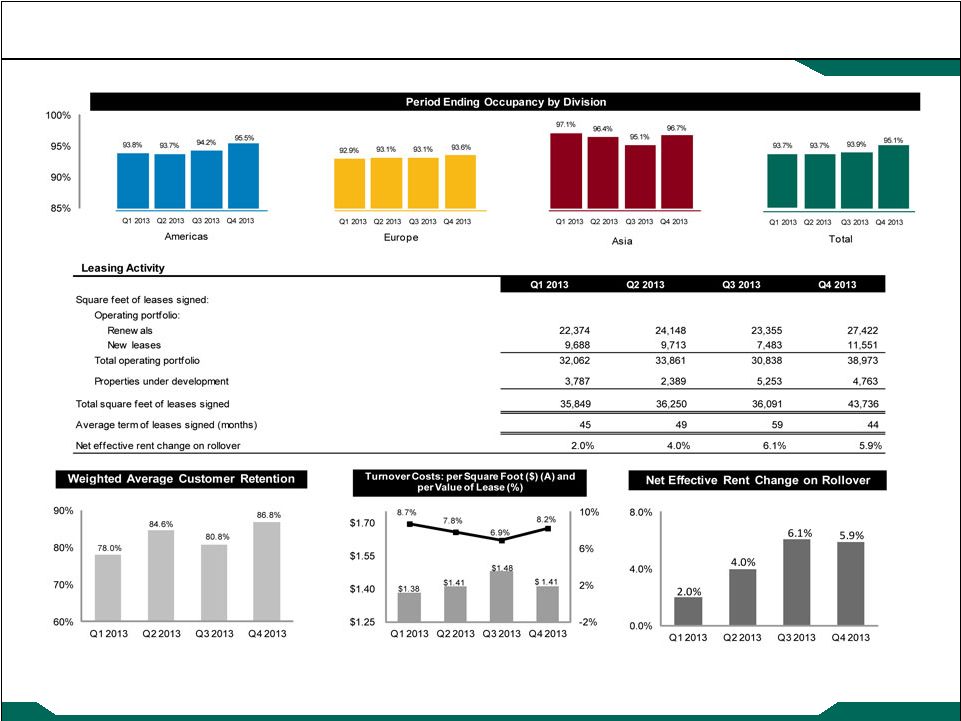
Supplemental 4Q 2013
Operations Overview
Operating Metrics –
Owned and Managed
15
(A) Turnover costs per foot represent expected costs based on the leases
signed during the quarter. (square feet and dollars in thousands)
|
 Copyright ©
2014 Prologis
Supplemental 4Q 2013
Operations Overview
Operating Metrics –
Owned and Managed
16
(A)
Turnover costs represent costs incurred during the quarter.
(B)
See the Notes and Definitions for further explanations.
(square feet and dollars in thousands)
Q1 2013
Q2 2013
Q3 2013
Q4 2013
Q1 2013
Q2 2013
Q3 2013
Q4 2013
18,264
$
25,046
$
35,668
$
44,020
$
510,295
508,242
494,941
489,808
0.03
$
0.05
$
0.07
$
0.08
$
Rental income
2.7%
1.4%
1.9%
0.8%
27,241
34,915
32,213
36,116
Rental expenses
9.1%
3.5%
3.2%
(4.2%)
18,344
26,827
17,992
26,450
Net operating income - GAAP
0.3%
0.7%
1.4%
2.7%
Total turnover costs (A)
45,585
61,742
50,205
62,566
Net operating income - adjusted cash
1.8%
(0.4%)
1.8%
3.0%
63,849
$
86,788
$
85,873
$
106,586
$
Average occupancy
1.6%
1.9%
0.9%
0.7%
Trailing four quarters - % of gross NOI
14.0%
14.8%
14.9%
14.5%
75.3%
75.9%
79.1%
73.3%
48,076
$
65,895
$
67,949
$
78,153
$
`
Don’t Delete this cell
Same Store Information (B)
Prologis share
Weighted average ownership percent
$ per square foot
Total capital expenditures
Leasing commissions
Property improvements
Tenant improvements
Capital Expenditures Incurred
Square feet of population
Percentage change:
$0.06
$0.06
$0.06
$0.06
$0.02
$0.04
$0.06
$0.08
Q1 2013
Q2 2013
Q3 2013
Q4 2013
Property Improvements by Square Foot
(trailing four quarters) |
 Copyright ©
2014 Prologis
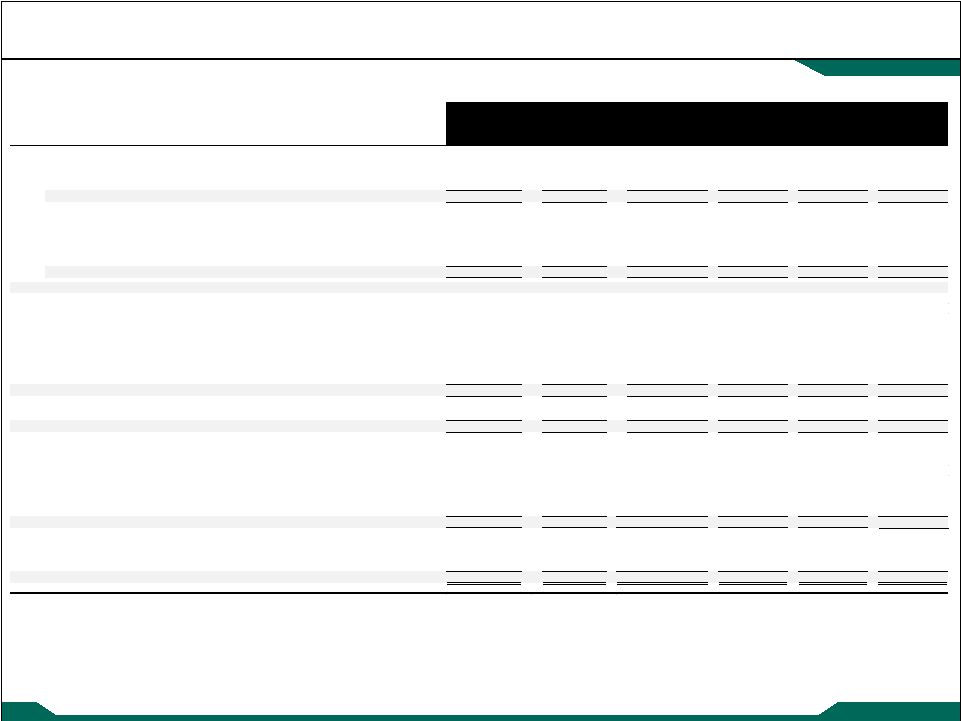
Supplemental 4Q 2013
Operations Overview
Customer Information –
Owned and Managed
17
1
DHL
1.8%
10,687
Month to month customers
$
38,313
1.3%
10,797
2.2%
2
CEVA Logistics
1.3%
6,670
2014
388,995
13.8%
72,618
14.4%
3
Kuehne + Nagel
1.2%
5,963
2015
517,194
18.3%
97,248
19.3%
4
Amazon.com, Inc.
1.0%
4,658
2016
468,076
16.6%
89,187
17.7%
5
Geodis
0.9%
5,698
2017
390,485
13.8%
70,801
14.1%
6
Home Depot, Inc.
0.9%
4,177
2018
327,404
11.6%
54,622
10.9%
7
Hitachi Ltd
0.8%
2,208
Thereafter
695,635
24.6%
107,715
21.4%
8
United States Government
0.8%
1,477
Total
$
2,826,102
100.0%
502,988
100.0%
9
FedEx Corporation
0.8%
2,263
10
Tesco PLC
0.7%
2,693
10.2%
46,494
11
PepsiCo
0.7%
4,883
12
Panasonic Co., Ltd.
0.6%
1,678
Month to month customers
$
28,256
1.6%
8,312
2.5%
13
Wal-Mart Stores, Inc.
0.5%
3,236
2014
242,074
13.8%
47,617
14.4%
14
Panalpina, Inc.
0.5%
2,421
2015
321,192
18.3%
63,610
19.3%
15
Bayerische Motoren Werke Ag (BMW)
0.5%
2,273
2016
296,390
16.8%
59,237
17.9%
16
UPS SCS (United Parcel Service Inc.)
0.5%
2,244
2017
244,241
13.9%
46,549
14.1%
17
Ingram Mico
0.5%
3,018
2018
203,322
11.6%
34,828
10.5%
18
Nippon Express Group
0.4%
1,328
Thereafter
421,640
24.0%
70,438
21.3%
19
National Distribution Centers LP
0.4%
3,720
Total
$
1,757,115
100.0%
330,591
100.0%
20
ND Logistics
0.4%
2,167
21
DB Schenker
0.4%
2,474
22
LG Electronics, Inc.
0.4%
2,540
23
Con-Way (Menlo)
0.4%
2,794
24
La Poste
0.4%
1,278
25
Schneider Electric SA
0.4%
1,640
17.2%
84,188
Top 10 Customers
Top 25 Customers
Lease Expirations - Operating Portfolio - Prologis Share
Year
Annual Base
Rent
Percentage
of Total
Occupied
Square Feet
Percentage
of Total
Percentage
of Total
Top Customers
Lease Expirations - Operating Portfolio - Owned and Managed
Year
Percentage
of Total
% of Annual
Base Rent
Total Square
Feet
Occupied
Square Feet
Annual Base
Rent
(square feet and dollars in thousands) |
 Copyright ©
2014 Prologis
Supplemental 4Q 2013
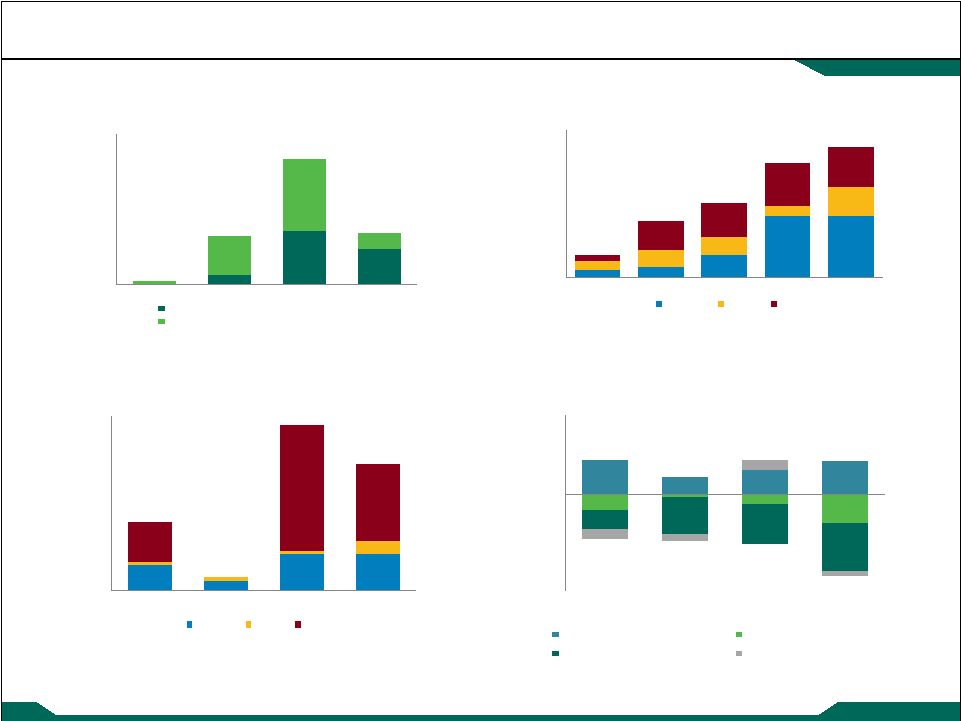
Capital Deployment
Overview –
Owned and Managed
18
(A) Includes acquisitions and infrastructure costs.
$-
$400
$800
$1,200
$1,600
$2,000
2009
2010
2011
2012
2013
Americas
Europe
Asia
$314
$759
$1,017
$1,553
$1,771
Development
Starts
(TEI)
(in
millions)
Building
Acquisitions
and
Equity
Investments
(in
millions)
Value
Creation
from
Development
Stabilizations
(in
millions)
Land
Activity
(in
millions) $-
$400
$800
$1,200
$1,600
Q1 2013
Q2 2013
Q3 2013
Q4 2013
Third Party Building Acquisitions
Equity Invested in Co-Investment Ventures
$34
$512
$1,322
$-
$40
$80
$120
$160
$200
Q1 2013
Q2 2013
Q3 2013
Q4 2013
Americas
Europe
Asia
$78
$15
$190
$(300)
$(200)
$(100)
$-
$100
$200
Acquisitions (A)
Dispositions
Development Starts
Foreign currency and other
Q1 2013 Q2
2013 Q3 2013
Q4 2013 ($27)
($89)
($43)
$539
($149)
$143 |
 Copyright ©
2014 Prologis
Supplemental 4Q 2013
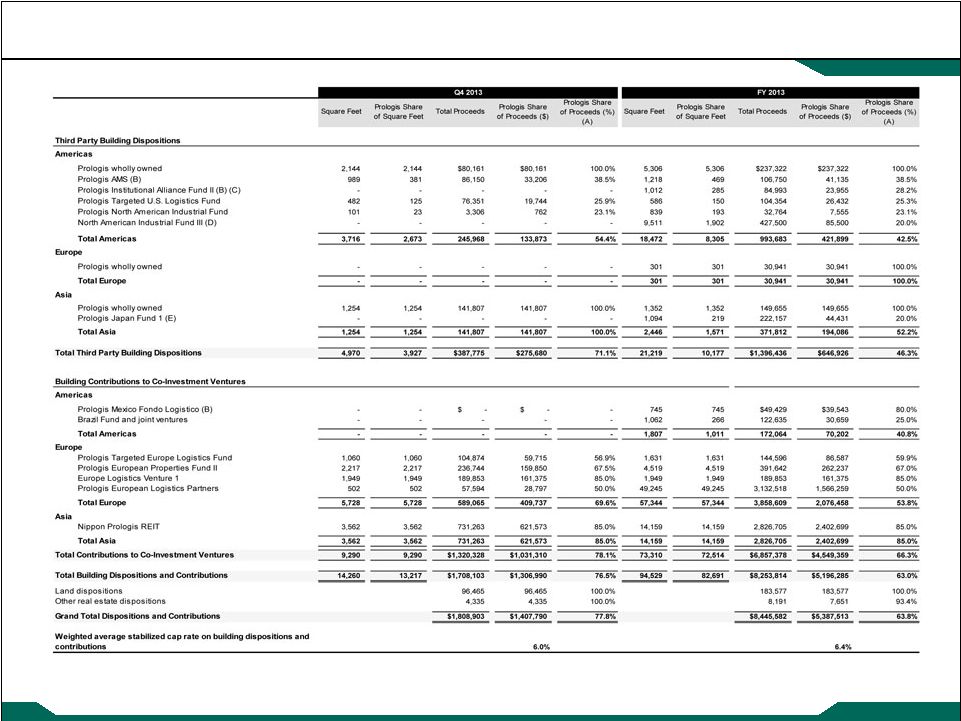
Capital Deployment
Dispositions and Contributions
19
(A)
Prologis share reflects our effective ownership. For contributions, this amount
reflects net cash proceeds to Prologis (net of units received for partial consideration).
(B) This is a consolidated co-investment
venture. (C)
During the second quarter of 2013, Prologis acquired the noncontrolling interest in
this venture. (D)
In connection with the dissolution of this co-investment venture in August 2013,
we acquired the remaining properties of this venture. (E)
In connection with the wind down of this co-investment venture in June 2013, all
the properties owned by this co-investment venture were acquired by Prologis or NPR.
(square feet and dollars in thousands) |
 Copyright ©
2014 Prologis
Supplemental 4Q 2013
Capital Deployment
Third Party Building Acquisitions and Equity Invested in Co-Investment
Ventures Prologis Share of
Prologis Share of
Acquisition
Cost (%) (A)
Acquisition
Cost (%) (A)
Third Party Building Acquisitions
Prologis wholly owned
2,128
2,128
99,456
$
99,456
$
100.0%
3,262
3,262
152,747
$
152,747
$
100.0%
Prologis Targeted U.S. Logistics Fund
875
226
65,426
16,919
25.9%
4,369
1,139
282,034
74,108
26.3%
Total Americas
3,003
2,354
164,882
116,375
70.6%
7,631
4,401
434,781
226,855
52.2%
Prologis Targeted Europe Logistics Fund
-
-
-
-
-
72
36
6,915
3,404
49.2%
Prologis European Properties Fund II
2,301
748
206,676
67,129
32.5%
2,569
832
227,975
73,805
32.4%
Prologis European Logistics Partners
-
-
-
-
-
2,584
1,293
383,379
191,689
50.0%
Total Europe
2,301
748
206,676
67,129
32.5%
5,225
2,161
618,269
268,898
43.5%
Asia
-
-
-
-
-
-
-
-
-
-
5,304
3,102
371,558
$
183,504
$
49.4%
12,856
6,562
1,053,050
$
495,753
$
47.1%
6.7%
6.5%
Before
After (B)
Prologis Institutional Alliance Fund II (C)
-
-
-
$
274,326
$
Prologis SGP Mexico
21.6%
100.0%
167,634
167,634
Prologis North American Industrial Fund III
-
-
-
423,781
Prologis Targeted U.S. Logistics Fund
-
-
-
100,000
Prologis Targeted Europe Logistics Fund
-
-
-
209,465
Prologis European Properties Fund II
-
-
-
178,574
167,634
$
1,353,780
$
FY 2013
Total Equity
Invested
Weighted average stabilized cap rate
Q4 2013
Total Equity Invested in Co-Investment Ventures
Equity Invested in Co-Investment Ventures
Ownership
Total Equity
Invested
Q4 2013
Total Third Party Building Acquisitions
Europe
Americas
FY 2013
Prologis Share of
Acquisition Cost ($)
Prologis Share
of Square Feet
Square Feet
Acquisition Cost
Prologis Share of
Acquisition Cost ($)
Acquisition Cost
Square Feet
Prologis Share
of Square
Feet
(square feet and dollars in thousands)
(A)
Prologis share reflects our effective ownership.
(B)
May include the impact of other equity investments by our partners.
(C)
This
was
a
consolidated
co-investment
venture
before
we
acquired
our
partners’
interest
in
the
second
quarter
of
2013.
20 |
 Copyright ©
2014 Prologis
Supplemental 4Q 2013
Capital Deployment
Development Starts
21
(in thousands, except percent)
(A)
Value Creation excludes fees or promotes that we may earn. See complete definition
in the Notes and Definitions section. |
 Copyright ©
2014 Prologis
Supplemental 4Q 2013
Capital Deployment
Value Creation from Development Stabilization
22
(A)
Value Creation excludes fees or promotes that we may earn. See complete definition
in the Notes and Definitions section. (in thousands, except percent)
Square Feet
Prologis Share
of Square Feet
Total Expected
Investment
Prologis Share
of Total
Expected
Square Feet
Prologis Share of
Square Feet
Total Expected
Investment
Prologis Share
of Total
Expected
Americas
1,793
1,793
$155,522
$155,522
4,909
4,909
$341,937
$341,937
Prologis Targeted U.S. Logistics Fund
-
-
-
-
272
73
29,730
8,026
Prologis Mexico Fondo Logistico
235
47
13,080
2,616
235
47
13,080
2,616
Brazil Fund and joint ventures
564
141
53,794
13,449
1,893
474
180,180
45,046
Total Americas
2,592
1,981
222,396
171,587
7,309
5,503
564,927
397,625
Europe
564
564
55,407
55,407
2,128
2,128
165,428
165,428
Prologis Targeted Europe Logistics Fund
47
20
5,955
2,564
47
20
5,955
2,564
611
584
61,362
57,971
2,175
2,148
171,383
167,992
Asia
1,591
1,591
194,198
194,198
5,156
5,156
628,659
628,659
Prologis China Logistics Venture I
585
88
35,706
5,356
585
88
35,706
5,356
2,176
1,679
229,904
199,554
5,741
5,244
664,365
634,015
Total
5,379
4,244
$513,662
$429,112
15,225
12,895
$1,400,675
$1,199,632
Weighted average estimated stabilized yield
8.2%
8.1%
$41,884
$113,589
Weighted average estimated cap rate at stabilization
6.1%
6.1%
$143,382
$426,205
Estimated development margin
27.9%
30.4%
Prologis share of estimated value creation (A)
87.3%
87.4%
Prologis share of estimated value creation (A)
$125,184
$372,378
Total Europe
Consolidated
Pro forma NOI
Estimated value creation (A)
Total Asia
Consolidated
Q4 2013
FY 2013
Consolidated |
 Copyright ©
2014 Prologis
Supplemental 4Q 2013
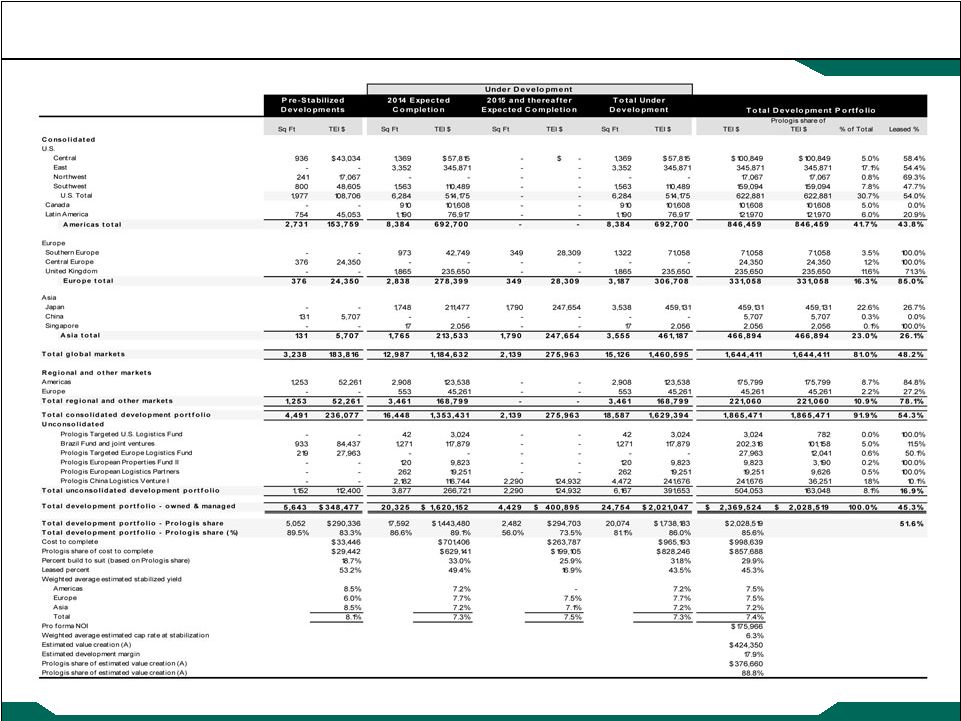
Capital Deployment
Development Portfolio
23
(in thousands, except percent)
(A) Value creation excludes fees or promotes that we may earn. See complete
definition in the Notes and Definitions section. |
 Copyright ©
2014 Prologis
Supplemental 4Q 2013
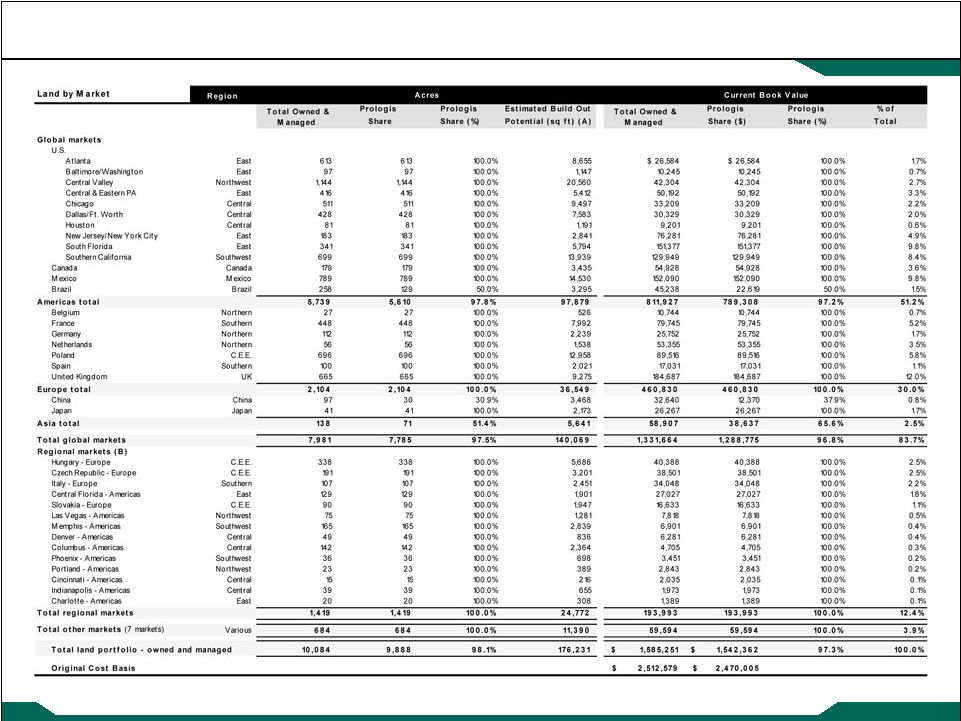
Capital Deployment
Land Portfolio –
Owned and Managed
24
(A)
Represents estimated finished square feet available for rent upon completion of an
industrial building on existing parcels of land. (B)
Ordered by our share of current book value.
(square feet and dollars in thousands) |
 Copyright ©
2014 Prologis
Supplemental 4Q 2013
Capital Deployment
Land Portfolio –
Summary and Roll Forward
25
Investment at
Acres
% of Total
December 31, 2013
% of Total
6,739
66.8%
868,470
$
54.8%
Brazil Fund and joint ventures
258
2.6%
45,238
2.9%
Total Americas
6,997
69.4%
913,708
57.7%
2,949
29.2%
612,636
38.6%
59
0.6%
35,060
2.2%
Prologis China Logistics Venture 1
79
0.8%
23,847
1.5%
Total Asia
138
1.4%
58,907
3.7%
10,084
100.0%
1,585,251
$
100.0%
Americas
Europe
Asia
Total
996,654
$
629,730
$
108,060
$
1,734,444
$
Acquisitions
33,547
19,471
5,489
58,507
Dispositions
(50,547)
(34,526)
(3,246)
(88,319)
Development starts
(88,075)
(10,638)
(48,336)
(147,049)
Infrastructure costs
29,188
14,026
1,407
44,621
Effect of changes in foreign exchange rates and other
(7,059)
(5,427)
(4,467)
(16,953)
913,708
$
612,636
$
58,907
$
1,585,251
$
Land Portfolio Summary
Consolidated
Americas
Total land portfolio - owned and managed
Consolidated
Europe
Asia
Consolidated
As of December 31, 2013
Land Roll Forward - Owned and Managed
As of September 30, 2013
(dollars in thousands)
. |
 Copyright ©
2014 Prologis
Supplemental 4Q 2013
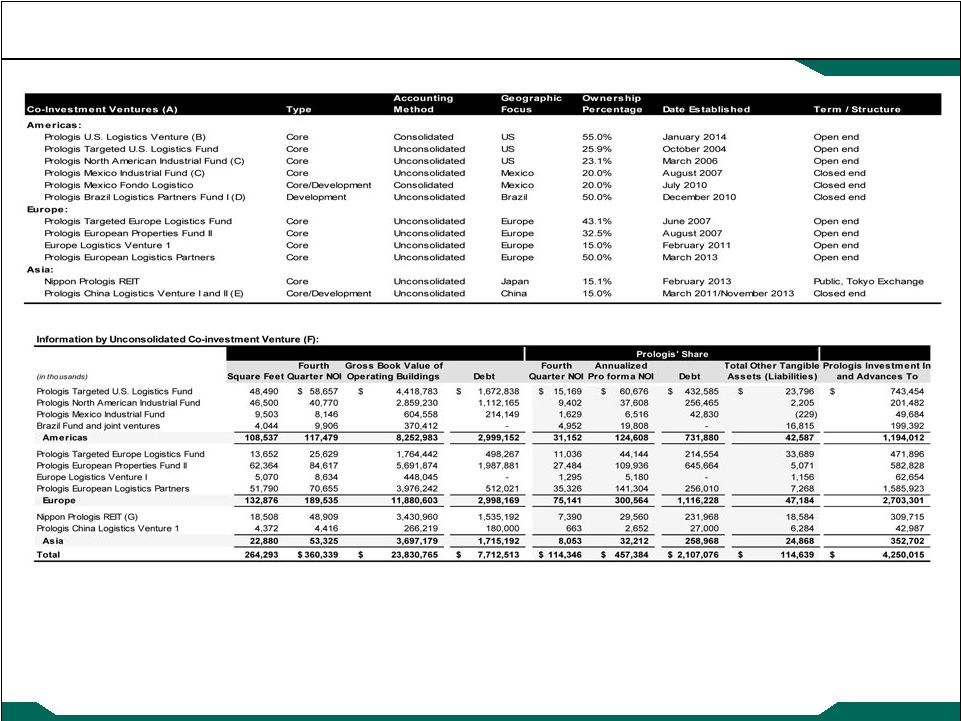
Co-Investment Ventures
Summary and Financial Highlights
26
(A)
The
information
presented
excludes
two
ventures-
Prologis
AMS
and
Prologis
DFS
Fund
I,
due
to
the
investment
size
of
the
ventures.
(B)
An investment agreement for Prologis U.S. Logistics Venture was executed in December
2013; the venture closed January 2014. (C)
These co-investment ventures do not expect to be actively investing in new
properties. (D)
We have a 50% ownership interest in and consolidate an entity that in turn owns 50%
of various entities that are accounted for on the equity method (“Brazil Fund”). The Brazil Fund develops
industrial properties in Brazil and has sold properties to an entity in which it
maintains an equity interest. We also have other Brazil joint ventures that we account for using the equity method. We
show our ownership in these Brazil entities at our effective ownership and include
the properties in our owned and managed pool. (E)
The Prologis China Logistics Venture II was formed during the fourth quarter of
2013. (F)
Values
represent
Prologis’
stepped
up
basis
and
may
not
be
comparable
to
values
reflected
in
the
entities’
stand
alone
financial
statements
calculated
on
a
different
basis.
Prologis
U.S.
Logistics
Venture
and
Prologis
China
Logistics
Venture
II
are
not
included
as
they
did
not
own
properties
or
other
net
assets
(liabilities)
for
the
period
ended
December
31,
2013.
(G)
Throughout
this
document,
we
use
the
most
recent
public
information
for
this
co-investment
venture.
If
the
co-investment
venture
acquires
properties
during
the
period
that
is
reported,
we
estimate
the
entire
quarter
of
NOI
based
on
the
results
of
the
properties
while
owned
by
Prologis. |
 Copyright ©
2014 Prologis
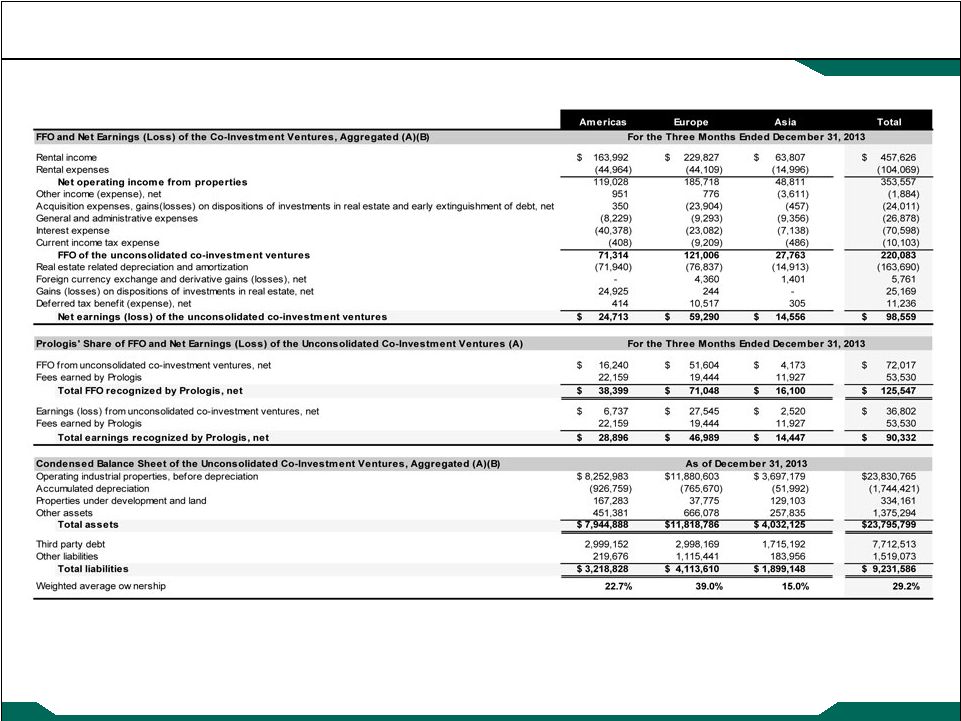
Supplemental 4Q 2013
Co-Investment Ventures
Operating and Balance Sheet Information
27
(A)
Includes the unconsolidated co-investment ventures listed on the previous
page. (B)
Represents the entire entity, not our proportionate share.
(dollars in thousands) |
 Copyright ©
2014 Prologis
Supplemental 4Q 2013
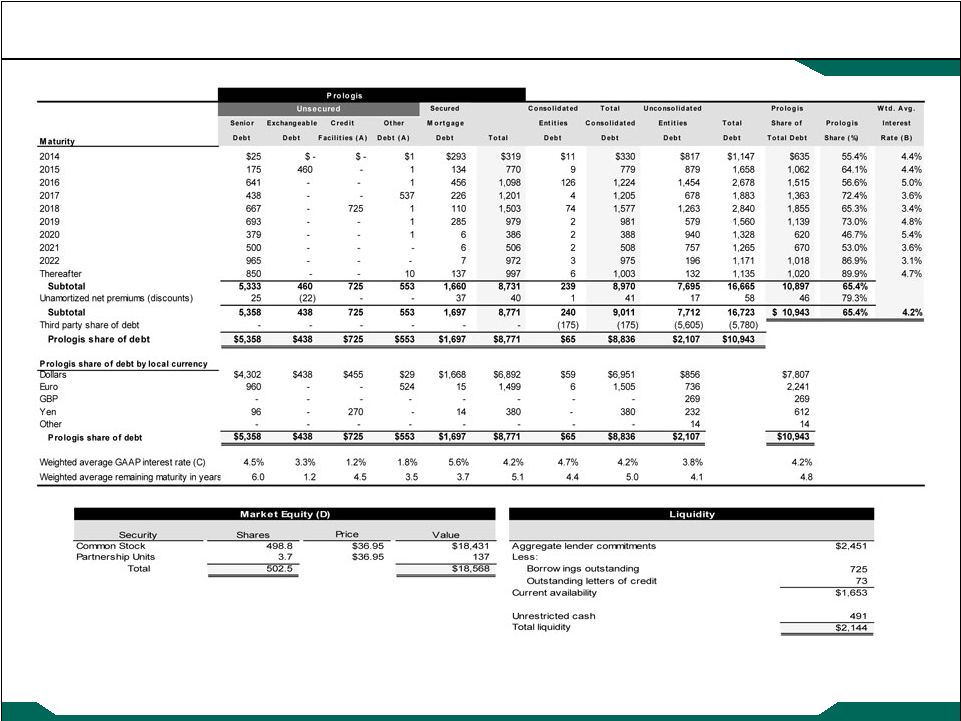
Capitalization
Debt and Equity Summary
28
(A)
The maturity date for the global senior credit facility and senior term loan is
reflected at maturity assuming we extend the term. (B)
Based on Prologis share of the total debt. Interest rate is based on the
effective rate (which includes the amortization of related premiums and discounts) assuming the net premiums
(discounts) associated with the respective debt were included in the
maturities by year. (C)
Interest rate is based on the effective rate and weighted based on borrowings
outstanding. (D)
In addition to our common stock and partnership units, we have two million shares
of preferred stock outstanding with a liquidation preference of $100 million at December 31, 2013.
(dollars and shares in millions) |
 Copyright ©
2014 Prologis
Supplemental 4Q 2013
Capitalization
Debt Covenants and Other Metrics
29
(A)
These calculations are made in accordance with the respective debt agreements, may
be different than other covenants or metrics presented and are not calculated in accordance with the
applicable SEC rules. Please refer to the respective agreements for full financial
covenant descriptions and calculation methods. (B)
These covenants are calculated in accordance with the Indenture dated June 8, 2011
and its supplemental indentures, including the Fifth Supplemental Indenture dated August 15, 2013.
(C)
All metrics include both consolidated and Prologis share of unconsolidated
entities. (D)
See Notes and Definitions for calculation of amounts.
(dollars in thousands)
Covenant
Actual
Covenant
Actual
<60%
32.9%
<60%
32.0%
>1.5x
3.95x
>1.5x
3.58x
<40%
7.0%
< 35%
7.0%
Unencumbered asset to unsecured debt ratio
>150%
259.0%
N/A
N/A
N/A
N/A
>150%
421.0%
2013
2013
Fourth Quarter
Third Quarter
36.8%
37.9%
11.8%
12.5%
263.7%
267.9%
2.75x
2.58x
3.55x
3.09x
7.14x
7.68x
5.51x
6.39x
6.07x
6.38x
Unencumbered
Encumbered
Total
13,240,375
$
4,560,689
$
17,801,064
$
2,501,153
36,030
2,537,183
471,555
206,717
678,272
Total consolidated
16,213,083
4,803,436
21,016,519
4,069,321
3,137,294
7,206,615
113,959
4,721
118,680
Gross real estate assets
20,396,363
$
7,945,451
$
28,341,814
$
Unsecured
Secured
Debt
Mortgage Debt
Total
7,071,503
$
1,659,992
$
8,731,495
$
-
239,072
239,072
664,192
1,437,381
2,101,573
Total debt
-
at
par
7,735,695
3,336,445
11,072,140
-
(174,642)
(174,642)
Total
Prologis
share
of
debt
-
at
par
7,735,695
3,161,803
10,897,498
3,123
37,526
40,649
-
(569)
(569)
-
5,503
5,503
Total Prologis share of debt, net of premium (discount)
7,738,818
$
3,204,263
$
10,943,081
$
Global Line
Indenture (B)
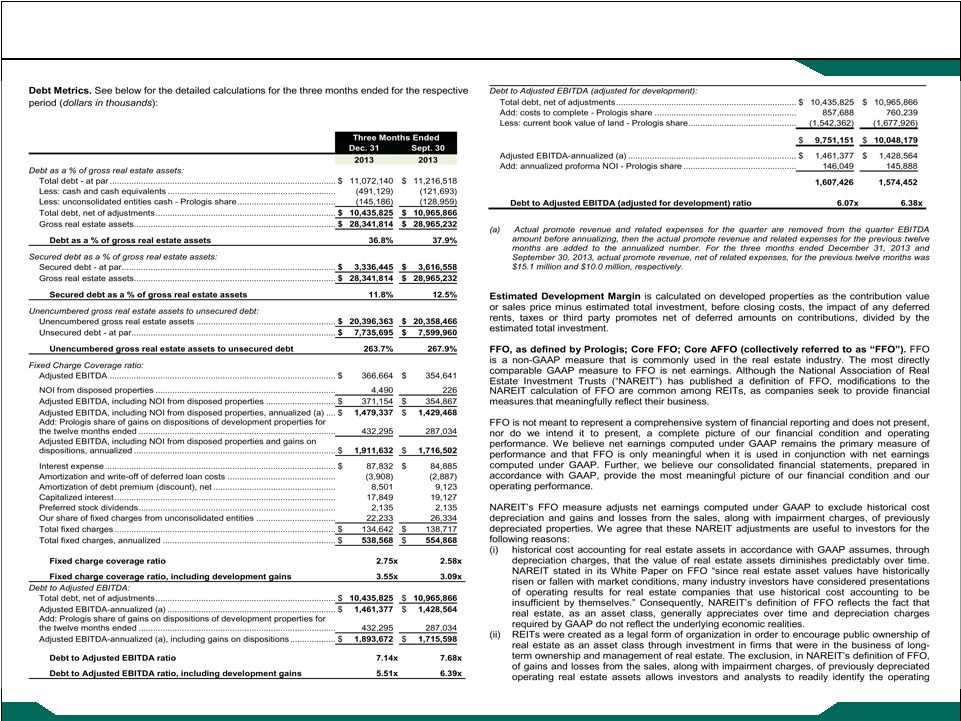
Debt as % of gross real estate assets
Debt/Adjusted EBITDA
Leverage ratio
Debt Metrics (A) (C) (D)
Fixed charge coverage ratio
Fixed charge coverage ratio, including development gains
Covenants as of December 31, 2013 (A)
Fixed charge coverage ratio
Secured debt leverage ratio
Unencumbered debt service coverage ratio
Unconsolidated
development
portfolio
and
land
-
Prologis'
share
Consolidated operating properties
Unconsolidated
operating
properties
-
Prologis'
share
Encumbrances as of December 31, 2013
Secured debt as % of gross real estate assets
Unencumbered gross real estate assets to unsecured debt
Consolidated development portfolio and land
Debt/Adjusted EBITDA (adjusted for development)
Consolidated other investments in real estate
Debt/Adjusted EBITDA, including development gains
Our
share
of
premium
(discount)
-
unconsolidated
Premium
(discount)
-
consolidated
Secured and Unsecured Debt as of December 31, 2013
Prologis debt
Consolidated entities debt
Our share of unconsolidated entities debt
Less: third party share of consolidated debt discount (premium)
Less: third party share of consolidated debt |
 Copyright ©
2014 Prologis
Supplemental 4Q 2013
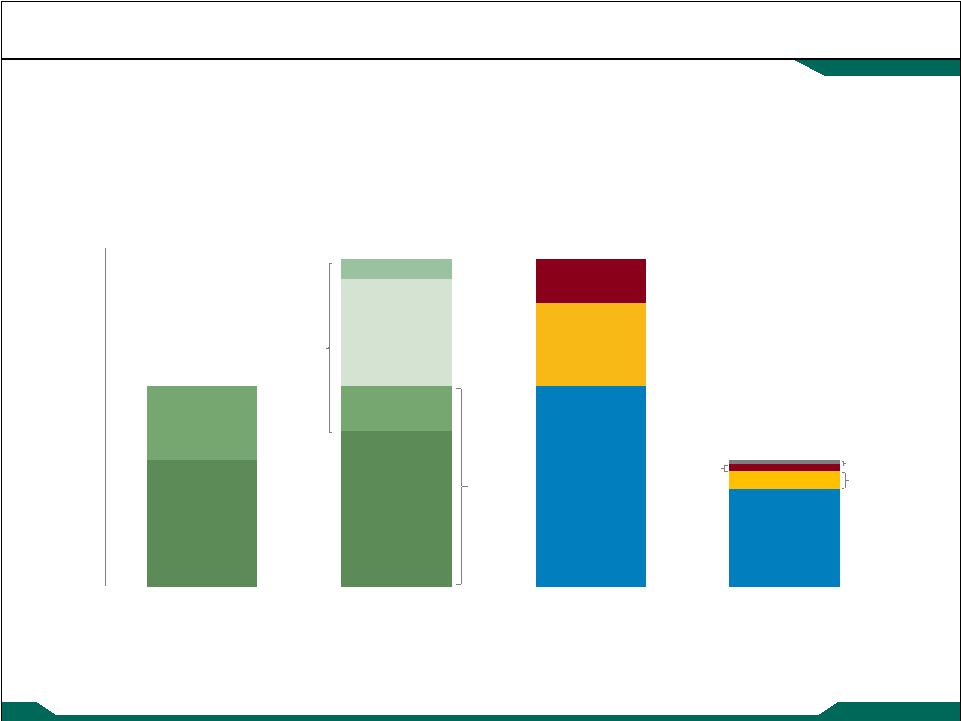
Capitalization
Assets Under Management
30
U.S. Dollar
77%
Euro
14%
Yen
6%
$-
$5,000
$10,000
$15,000
$20,000
$25,000
$30,000
$35,000
$40,000
$45,000
$50,000
Europe
25.5%
Asia
13.2%
$ 29,611
$ 48,241
Debt
$10,943
Committed
Equity/Investment
$2,823
Americas
61.3%
$ 48,241
Direct owned
and other
assets
$22,878
Equity
Cap and
Preferred Shares
$18,668
AUM
Investment
Management
$25,363
Investors' share of
assets in JVs/funds
$15,807
Prologis share of
assets in JVs/funds
$6,733
Total
Enterprise
Value
$29,611
$ 18,668
Other
3%
Total Enterprise Value
Total AUM by Division
Assets Under Management
(in millions)
Net Equity |
 Copyright ©
2014 Prologis
Supplemental 4Q 2013
Net Asset Value
Components
31
(in thousands, except for percentages and per square foot)
|
 Copyright ©
2014 Prologis
Supplemental 4Q 2013
Net Asset Value
Components -
Continued
32
(in thousands)
(A) Excludes revenue and expenses related to the promotes earned during
the fourth quarter of 2013. |
 Copyright ©
2014 Prologis
Supplemental 4Q 2013
Notes and Definitions
33 |
 Copyright ©
2014 Prologis
Supplemental 4Q 2013
Notes and Definitions
34 |
 Copyright ©
2014 Prologis
Supplemental 4Q 2013
Notes and Definitions
35 |
 Copyright ©
2014 Prologis
Supplemental 4Q 2013
Notes and Definitions
36 |
 Copyright ©
2014 Prologis
Supplemental 4Q 2013
Notes and Definitions
37 |
 Copyright ©
2014 Prologis
Supplemental 4Q 2013
Notes and Definitions
38 |
 Copyright ©
2014 Prologis
Supplemental 4Q 2013
39
Notes and Definitions |