  Exhibit
99.1 Second Quarter 2013
Unaudited
Earnings Release and Supplemental Information |
| Exhibit
99.1 Second Quarter 2013
Unaudited
Earnings Release and Supplemental Information |
 Copyright ©
2013 Prologis
Supplemental 2Q 2013
Table of Contents
Overview
Press Release
1
Highlights
Company Profile
4
Company Performance
5
Financial Information
Consolidated Balance Sheets
6
Consolidated Statements of Operations
7
Reconciliation of Net Earnings (Loss) to FFO
8
EBITDA Reconciliation
9
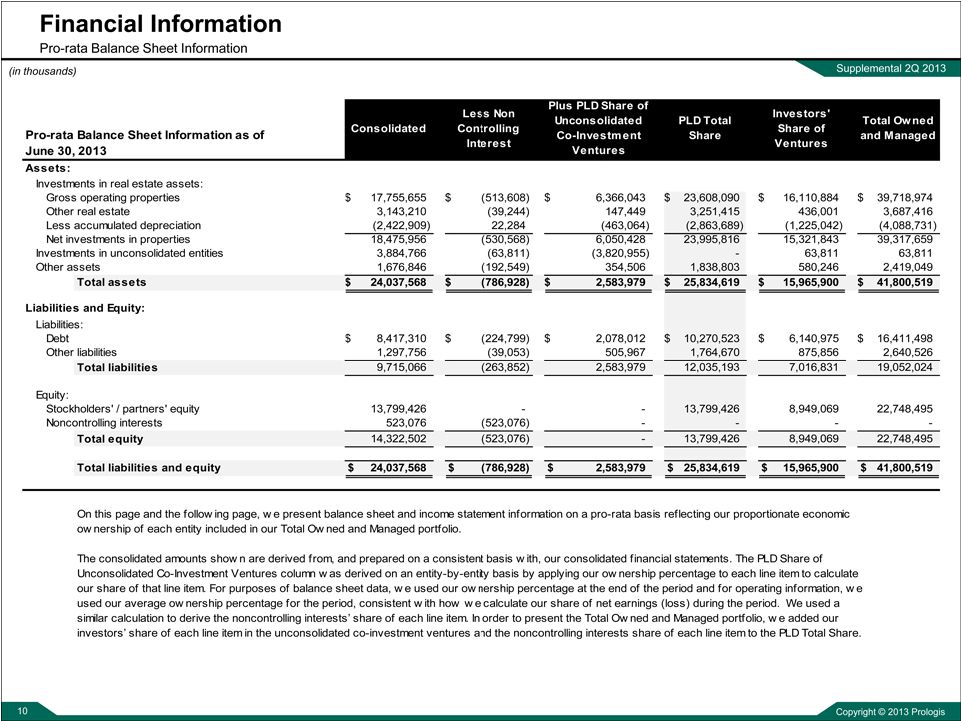
Pro-rata Information
10
Operations Overview
Operating Portfolio
12
Operating Metrics
15
Customer Information
17
Capital Deployment
Dispositions and Contributions
18
Third Party Building Acquisitions and Equity Invested in
Co-Investment Ventures
19
Development Starts
20
Development Portfolio
22
Land Portfolio
23
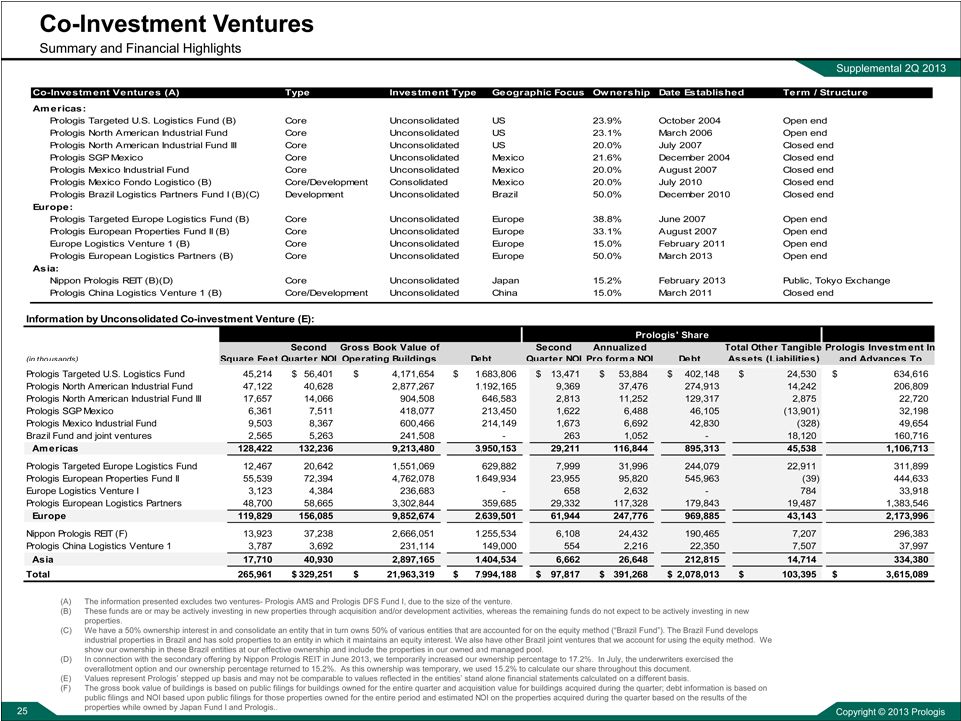
Co-Investment Ventures
Summary and Financial Highlights
25
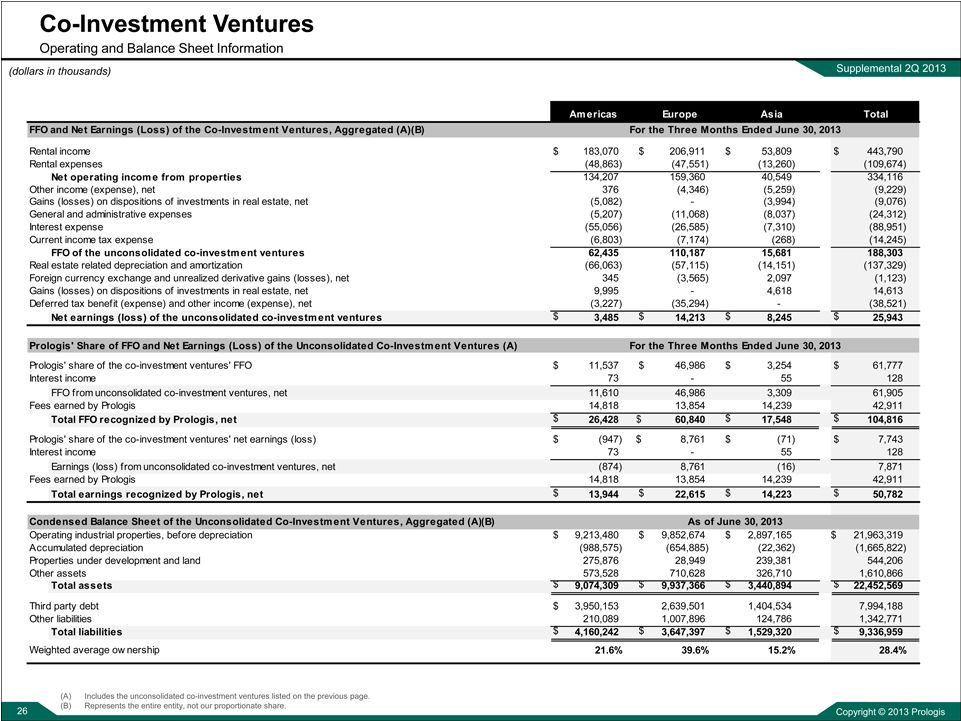
Operating and Balance Sheet Information
26
Capitalization
Debt and Equity Summary
27
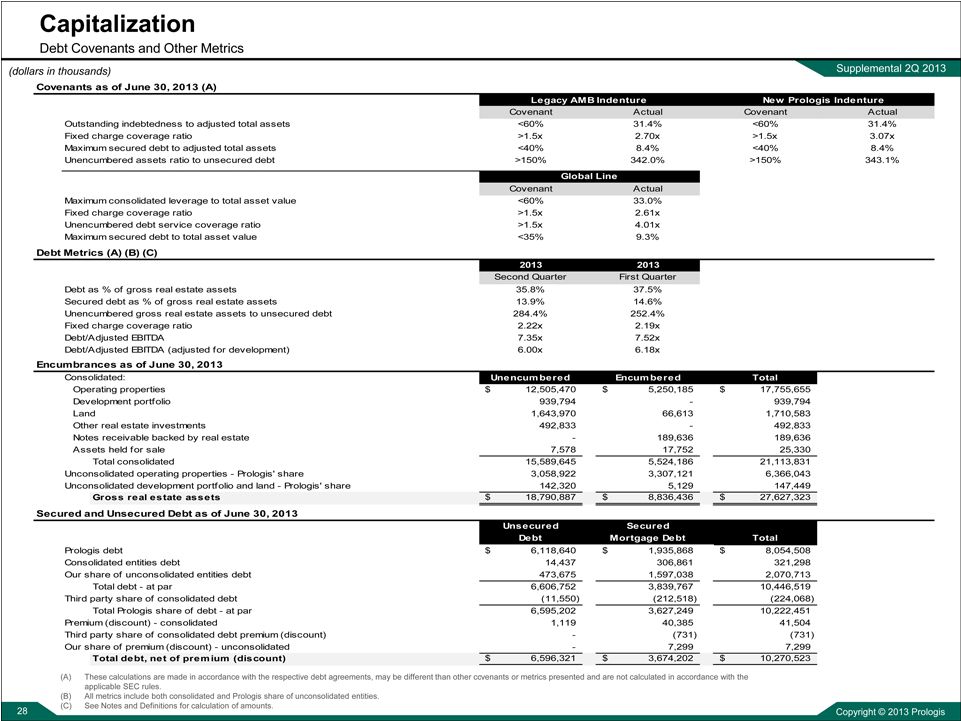
Debt Covenants and Other Metrics
28
Assets Under Management
29
Net Asset Value
Components
30
Notes and Definitions
32
Guangzhou Phase II, Guangzhou, China
Prologis Park Redlands, CA, United States
Prologis Park Budapest Gyal, Budapest, Hungary
Cover: Prologis Park Piotrkow, DC1, Warsaw, Poland
|
 Copyright ©
2013 Prologis
1
Prologis, Inc. Announces Second Quarter 2013 Earnings Results
-
Rents on rollover increased 4.0 percent -
-
Leased 36.3 million square feet -
-
Increasing deployment guidance by $1.7 billion -
SAN FRANCISCO (July 24, 2013) – Prologis, Inc. (NYSE: PLD), the
leading global owner, operator and developer of industrial real estate,
today reported results for the second quarter 2013.
Core funds from operations (Core FFO) per fully diluted share was
$0.41 for the second quarter compared to $0.43 for the same period in
2012. Net loss per fully diluted share was less than $0.01 for the second
quarter compared to a net loss per share of $0.02 for the same period in
2012. The net loss in the quarter was principally due to costs associated
with the early extinguishment of debt, as well as from depreciation on
real estate.
Operating Portfolio Metrics
The company leased 36.3 million square feet (3.4 million square
meters) in its combined operating and development portfolios in the
second quarter. Prologis ended the quarter with 93.7 percent
occupancy in its operating portfolio, consistent with the prior quarter.
Tenant retention in the second quarter was 84.6 percent. GAAP rental
rates on leases signed in the quarter increased 4.0 percent from prior
rents compared to a decrease of 3.8 percent in the same period in
2012.
During the second quarter, same-store net operating income (NOI)
increased 0.7 percent and decreased 0.4 percent on an adjusted cash
basis.
“With our accomplishments in the quarter we are closing out our 10
quarter plan ahead of schedule,” said Hamid R. Moghadam, chairman
and CEO, Prologis. “Our efforts have simplified the company and built a
strong foundation for sustainable growth.”
Capital Deployment
Invested capital during the second quarter totaled $922.2 million, of
which
$796.7 million was Prologis' share, including:
Development starts of $385.3 million with a weighted average
estimated yield of 7.1% and an estimated development margin
of 13.9 percent. Prologis’ share was $301.4 million and the
company’s estimated share of value creation upon stabilization
is expected to be $42.7 million;
Acquisitions of $127.2 million of buildings and land, of which
$85.6 million was Prologis’ share. The stabilized capitalization
rate on building acquisitions was 7.2 percent.
$409.7 million of investments in our co-investment ventures,
including Prologis Targeted Europe Logistics Fund, Prologis
European Properties Fund II, and Prologis Institutional Alliance
Fund II, with a stabilized capitalization rate of 6.4 percent.
Subsequent to quarter end, Prologis European Logistics Partners Sàrl,
the company’s joint venture with Norges Bank Investment Management,
acquired a portfolio in the United Kingdom for $380 million, of which
$190 million was Prologis’ share.
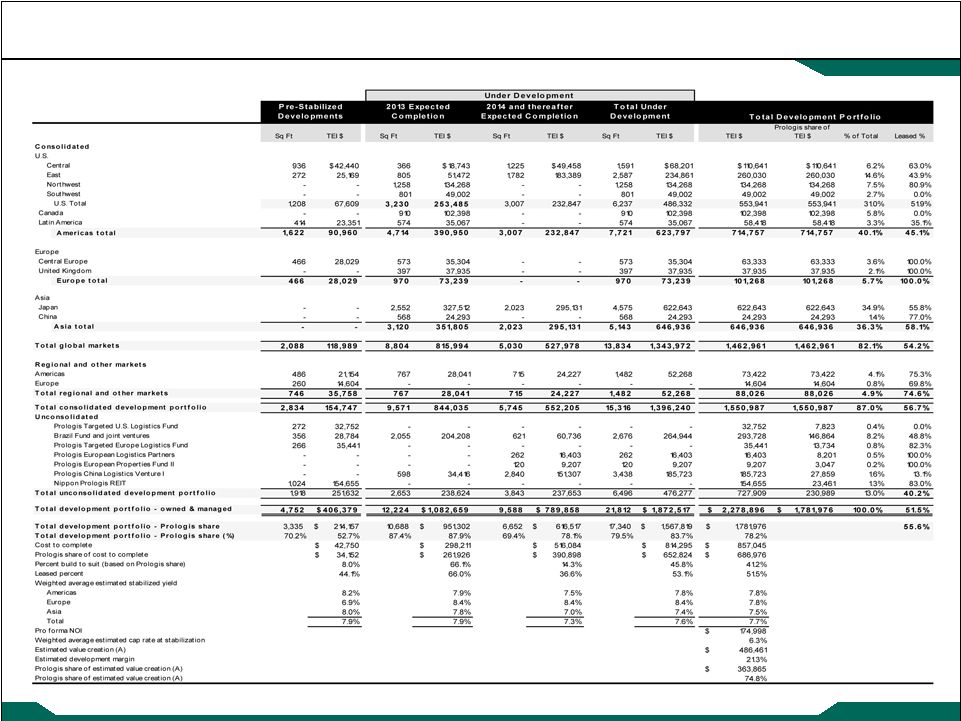
At quarter end, Prologis' global development pipeline comprised 26.6
million square feet (2.5 million square meters), with a total expected
investment of $2.3 billion, of which Prologis' share was $1.8 billion. The
company’s share of estimated value creation at stabilization is expected
to be $363.9 million, with a weighted average estimated stabilized yield
expected to be 7.7 percent and a margin of approximately 21.3 percent.
|
 Copyright ©
2013 Prologis
2
Dispositions and Contributions
Prologis completed $567.2 million in contributions and dispositions in
the second quarter, of which $347.7 million was the company’s share,
with a stabilized capitalization rate of 5.6 percent, including:
$282.0 million in contributions to Nippon Prologis REIT and
Prologis Mexico Fondo Logistico, of which $237.3 million was
the company’s share; and
$285.2 million of third-party building and land dispositions, of
which $110.4 million was the company’s share.
Investment Management
During the second quarter, the company further streamlined its co-
investment ventures by rationalizing two funds:
Prologis Japan Fund 1, the assets of which were acquired by
Nippon Prologis REIT and Prologis; and
Prologis Institutional Alliance Fund II, in which the company
acquired its outside partners' interests and the assets are now
wholly-owned by Prologis.
At quarter end, Prologis had $22.8 billion in combined assets under
management in 15 funds.
Capital Markets
During the second quarter, Prologis completed approximately $4.3
billion in capital markets transactions, including:
$1.5 billion from its follow-on equity offering, including the over-
allotment;
$2.3 billion in debt financings, re-financings, and pay-downs;
and
$482.5 million in preferred stock redemptions.
The company also established an at-the-market equity offering program
to sell up to $750 million of its common stock.
Subsequent to quarter end, Prologis recast and upsized its global line of
credit by $350 million to $2.0 billion, extended the initial term to 2017,
and achieved a 40 basis point reduction in interest rate.
“Our capital markets activity in the quarter provides us with enhanced
financial flexibility,” said Thomas S. Olinger, chief financial officer,
Prologis. “We have a strong balance sheet and the proven ability to
access multiple sources of capital to fund our growth opportunities.”
Guidance for 2013
Prologis narrowed its full-year 2013 Core FFO guidance range to $1.63
to $1.67 per diluted share. The company also expects to recognize net
earnings, for GAAP purposes, of $0.58 to $0.62 per share.
In addition, the company increased its full-year deployment guidance
range by $1.7 billion, to $3.5 billion to $4.1 billion.
The Core FFO and earnings guidance reflected above excludes any
potential future gains (losses) recognized from real estate transactions.
In reconciling from net earnings to Core FFO, Prologis makes certain
adjustments, including but not limited to real estate depreciation and
amortization expense, gains (losses) recognized from real estate
transactions and early extinguishment of debt or redemption of
preferred stock, impairment charges, deferred taxes, and unrealized
gains or losses on foreign currency or derivative activity.
The difference between the company's Core FFO and net earnings
guidance for 2013 predominantly relates to real estate depreciation and
recognized gains on real estate transactions.
Webcast and Conference Call Information
The company will host a webcast /conference call to discuss quarterly
results, current market conditions and future outlook today, July 24, at
12:00 p.m. U.S. Eastern Time. Interested parties are encouraged to
access the live webcast by clicking the microphone icon located near
the top of the opening page of the Prologis Investor Relations website
|
 Copyright ©
2013 Prologis
3
(http://ir.prologis.com). Interested parties also can participate
via conference call by dialing +1 877-256-7020 (from the U.S.
and Canada toll free) or +1 973-409-9692 (from all other
countries) and enter conference code 97107173.
A telephonic replay will be available from July 24 through
August 23 at +1 855-859-2056 (from the U.S. and Canada) or
+1 404-537-3406 (from all other countries), with conference
code 97107173. The webcast replay will be posted when
available in the "Events & Presentations" section of Investor
Relations on the Prologis website.
About Prologis
Prologis, Inc., is the leading owner, operator and developer of
industrial real estate, focused on global and regional markets
across the Americas, Europe and Asia. As of June 30, 2013,
Prologis owned or had investments in, on a wholly owned basis
or through co-investment ventures, properties and development
projects expected to total approximately 563 million square feet
(52.3 million square meters) in 21 countries. The company
leases modern distribution facilities to more than 4,500
customers, including manufacturers, retailers, transportation
companies, third-party logistics providers and other enterprises.
The statements in this release
that are not historical facts are forward-looking statements within the meaning
of Section 27A of the Securities Act of 1933, as amended, and Section 21E of
the Securities Exchange Act of 1934, as amended. These
forward-looking statements are based on current expectations,
estimates and projections about the industry and markets in
which Prologis operates, management's beliefs and
assumptions made by management. Such statements involve
uncertainties that could significantly impact Prologis' financial
results. Words such as "expects," "anticipates," "intends,"
"plans," "believes," "seeks," "estimates," variations of such
words and similar expressions are intended to identify such
forward-looking statements, which generally are not historical in
nature. All statements that address operating performance,
events or developments that we expect or anticipate will occur
in the future — including statements relating to rent and
occupancy growth, development activity and changes in sales
or contribution volume of developed properties, disposition
activity, general conditions in the geographic areas where we
operate, synergies to be realized from our recent merger
transaction, our debt and financial
position, our ability to form new property funds and the availability of capital in
existing or new property funds — are forward-looking statements. These
statements are not guarantees of future performance and
involve certain risks, uncertainties and assumptions that are
difficult to predict. Although we believe the expectations
reflected in any forward-looking statements are based on
reasonable assumptions, we can give no assurance that our
expectations will be attained and therefore, actual outcomes
and results may differ materially from what is expressed or
forecasted in such forward-looking statements. Some of the
factors that may affect outcomes and results include, but are
not limited to: (i) national, international, regional and local
economic climates, (ii) changes in financial markets, interest
rates and foreign currency exchange rates, (iii) increased or
unanticipated competition for our properties, (iv) risks
associated with acquisitions, dispositions and development of
properties, (v) maintenance of real estate investment trust
("REIT") status and tax structuring, (vi) availability of financing
and capital, the levels of debt that we maintain and our credit
ratings, (vii) risks related to our investments in our co-
investment ventures and funds, including our ability to establish
new co-investment ventures and funds, (viii) risks of doing
business internationally, including currency risks, (ix)
environmental uncertainties, including risks of natural disasters,
and (x) those additional factors discussed in reports filed with
the Securities and Exchange Commission by Prologis under the
heading "Risk Factors." Prologis undertakes no duty to update
any forward-looking statements appearing in this release
Media Contacts
Tracy Ward, Tel: +1 415 733 9565,
tward@prologis.com, San Francisco Atle
Erlingsson, Tel: +1 415 733 9495, aerlingsson@prologis.com, San Francisco |
 Copyright ©
2013 Prologis
Supplemental 2Q 2013
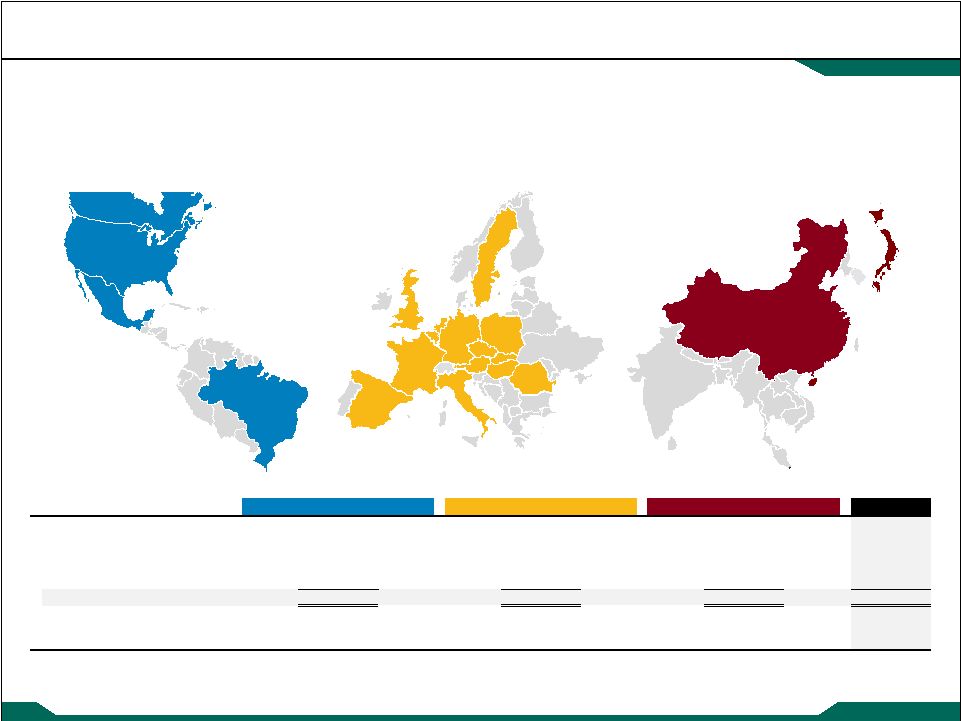
Prologis, Inc. is the leading owner, operator and developer of industrial real
estate, focused on global and regional markets across the Americas, Europe and Asia.
As of June 30, 2013, Prologis owned or had investments in, on a wholly owned basis
or through co-investment ventures, properties and development projects
totaling
563
million
square
feet
(52.3
million
square
meters)
in
21
countries.
The
company
leases
modern
distribution
facilities
to
more
than
4,500
customers,
including manufacturers, retailers, transportation companies, third-party
logistics providers and other enterprises. Highlights
Company Profile
4
(A)
Generally represents properties in which Prologis has an ownership interest but does
not manage (6 msf) and other properties owned by Prologis (4 msf), which includes value added
properties (3 msf).
(B)
Original cost basis for the total land portfolio is $2.8
billion. Number of operating portfolio buildings
2,324
588
74
363
136
27
15
2
10
8
1
1
Total (msf)
386
139
38
$1,115
$177
$987
7,151
3,401
178
$1,009
$677
$91
TOTAL
526
$1,777
$2,279
10
27
563
10,730
2,986
Land (acres)
Land book value (millions) (B)
AMERICAS (4 countries)
ASIA (3 countries)
EUROPE (14 countries)
Operating Portfolio (msf)
Development Portfolio (msf)
Other (msf) (A)
Development portfolio TEI (millions)
|
 Copyright ©
2013 Prologis
Supplemental 2Q 2013
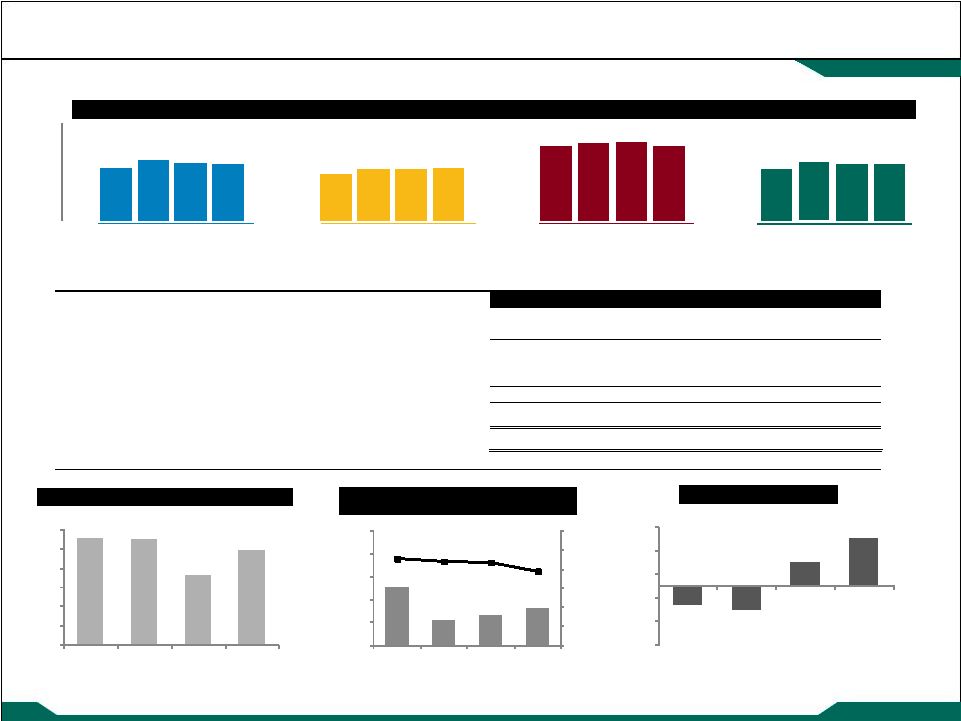
Highlights
Company Performance
5
2013
2012
2013
2012
419,474
$
501,181
$
908,684
$
979,049
$
(1,517)
(8,120)
263,899
194,293
202,238
172,671
560,038
434,743
203,337
201,320
391,274
386,085
143,302
148,569
283,979
282,392
334,004
382,688
675,582
757,309
Net earnings (loss) attributable to common stockholders
0.00
$
(0.02)
$
0.55
$
0.42
$
FFO, as defined by Prologis
0.41
0.37
1.16
0.93
Core FFO
0.41
0.43
0.82
0.83
Six months ended June 30,
Revenues
Net earnings (loss) attributable to common stockholders
(dollars in thousands, except per share data)
Three months ended June 30,
Per
common
share
-
diluted:
FFO, as defined by Prologis
Core FFO
AFFO
Adjusted EBITDA
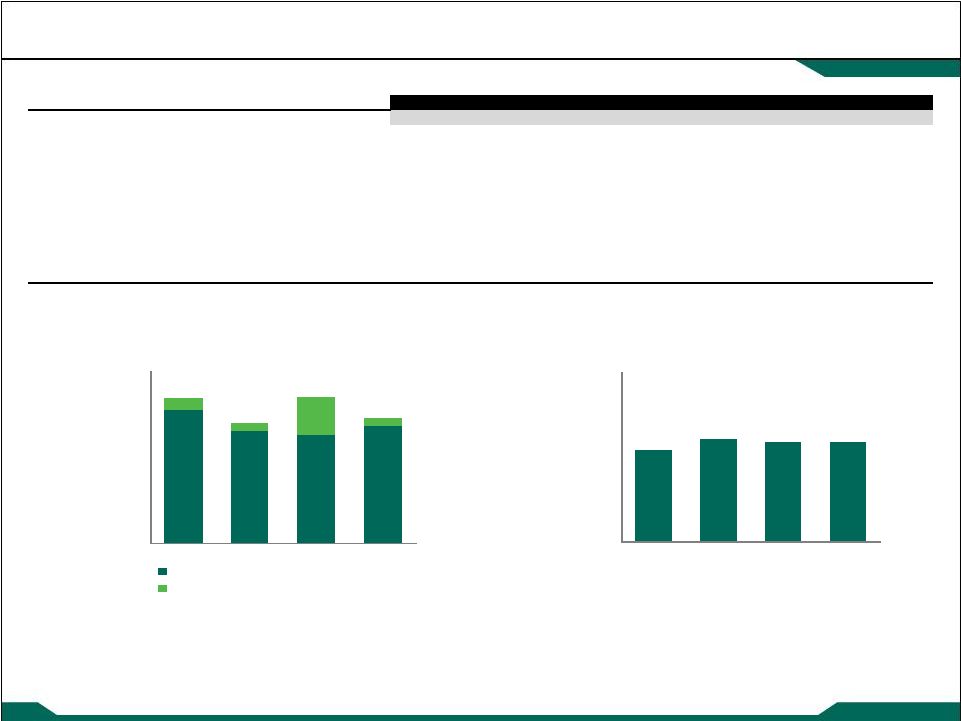
$252
$209
$255
$218
$0
$50
$100
$150
$200
$250
$300
Q3 2012
Q4 2012
Q1 2013
Q2 2013
Core FFO and Development Value
Creation (in millions)
Core FFO
Development
Value
Creation
-
Prologis
Share
93.1%
94.0%
93.7%
93.7%
85%
90%
95%
100%
Q3 2012
Q4 2012
Q1 2013
Q2 2013
Operating Portfolio -
Owned and Managed
Period Ending Occupancy % |
 Copyright ©
2013 Prologis
Supplemental 2Q 2013
Financial Information
Consolidated Balance Sheets
6
(in thousands)
$
17,755,655
$
17,521,075
$
22,608,248
939,794
884,352
951,643
1,710,583
1,754,053
1,794,364
492,833
436,328
454,868
20,898,865
20,595,808
25,809,123
2,422,909
2,292,946
2,480,660
Net investments in properties
18,475,956
18,302,862
23,328,463
3,884,766
3,635,214
2,195,782
189,636
188,000
188,000
25,330
25,391
26,027
Net investments in real estate
22,575,688
22,151,467
25,738,272
385,424
785,359
100,810
26,642
48,605
176,926
124,980
139,691
171,084
924,834
950,177
1,123,053
Total assets
$
24,037,568
$
24,075,299
$
27,310,145
$
8,417,310
$
9,074,123
$
11,790,794
-
482,500
-
1,297,756
1,308,143
1,746,015
Total liabilities
9,715,066
10,864,766
13,536,809
100,000
100,000
582,200
4,986
4,624
4,618
17,939,829
16,461,486
16,411,855
(541,355)
(503,786)
(233,563)
(3,704,034)
(3,561,429)
(3,696,093)
Total stockholders' equity
13,799,426
12,500,895
13,069,017
470,995
658,871
653,125
52,081
50,767
51,194
Total equity
14,322,502
13,210,533
13,773,336
Total liabilities and equity
$
24,037,568
$
24,075,299
$
27,310,145
December 31, 2012
Investments in and advances to unconsolidated entities
Land
Assets held for sale
Operating properties
Development portfolio
Notes receivable backed by real estate
June 30, 2013
Investments in real estate assets:
March 31, 2013
Assets:
Other real estate investments
Other assets
Liabilities:
Less accumulated depreciation
Restricted cash
Accounts receivable
Cash and cash equivalents
Liabilities and Equity:
Noncontrolling interests - limited partnership unitholders
Preferred stock
Accounts payable, accrued expenses, and other liabilities
Debt
Distributions in excess of net earnings
Equity:
Common stock
Additional paid-in capital
Accumulated other comprehensive loss
Noncontrolling interests
Stockholders' equity:
Preferred stock at redemption value |
 Copyright ©
2013 Prologis
Supplemental 2Q 2013
Financial Information
Consolidated Statements of Operations
7
(A) See Calculation of Per Share Amounts in the Notes and Definitions.
(in thousands, except per share amounts)
$
372,737
$
468,459
$
826,120
$
910,857
43,608
30,993
77,243
63,350
3,129
1,729
5,321
4,842
419,474
501,181
908,684
979,049
112,581
125,918
245,907
244,151
25,006
15,075
44,915
31,956
54,909
51,415
111,106
111,574
158,965
178,756
335,454
358,315
6,771
7,227
11,124
11,562
-
21,186
-
31,914
-
-
-
3,185
358,232
399,577
748,506
792,657
61,242
101,604
160,178
186,392
8,421
3,889
33,189
17,884
4,577
5,366
8,790
10,793
(92,508)
(127,582)
(207,498)
(260,551)
61,035
520
399,880
268,291
(7,829)
13,299
469
(13,802)
(32,608)
(500)
(49,959)
4,919
-
-
-
(16,135)
(58,912)
(105,008)
184,871
11,399
2,330
(3,404)
345,049
197,791
20,488
8,075
72,354
20,199
(18,158)
(11,479)
272,695
177,592
(294)
6,273
(49)
19,051
13,467
9,874
19,301
21,123
13,173
16,147
19,252
40,174
(4,985)
4,668
291,947
217,766
7,284
(2,739)
(4,819)
(2,857)
2,299
1,929
287,128
214,909
(3,816)
(10,049)
(14,121)
(20,616)
-
-
(9,108)
-
$
(1,517)
$
(8,120)
$
263,899
$
194,293
486,032
459,878
478,116
464,696
$
0.00
$
(0.02)
$
0.55
$
0.42
Preferred stock dividends
Net earnings (loss) attributable to common stockholders
Total discontinued operations
Net earnings (loss) per share attributable to common stockholders - Diluted
Weighted average common shares outstanding - Diluted (A)
Loss on preferred stock redemption
Income (loss) attributable to disposed properties and assets held for sale
Net gains on dispositions
Consolidated net earnings (loss)
Net loss (earnings) attributable to noncontrolling interests
Net earnings attributable to controlling interests
Discontinued operations:
Impairment of other assets
Gains on acquisitions and dispositions of investments in real estate, net
Foreign currency and derivative gains (losses) and other income (expenses), net
Gains (losses) on early extinguishment of debt, net
Total other income (expense)
Earnings (loss) before income taxes
Income tax expense - current and deferred
Earnings (loss) from continuing operations
Interest expense
Rental expenses
Investment management expenses
General and administrative expenses
Impairment of real estate properties
Depreciation and amortization
Merger, acquisition and other integration expenses
Total expenses
Operating income
Other income (expense):
Earnings from unconsolidated entities, net
Interest income
Other expenses
2013
2012
Six Months Ended
June 30,
Expenses:
2013
2012
Revenues:
Rental income
Investment management income
Development management and other income
Total revenues
Three Months Ended
June 30, |
 Copyright ©
2013 Prologis
Supplemental 2Q 2013
Financial Information
Reconciliations of Net Earnings (Loss) to FFO
8
$
(1,517)
$
(8,120)
$
263,899
$
194,293
153,229
174,516
323,469
349,965
(8,010)
(2,210)
(109,690)
(164,234)
(719)
(3,950)
(3,660)
(16,004)
37,931
34,444
63,414
68,982
180,914
194,680
537,432
433,002
8,133
(14,519)
7,495
9,717
(4,350)
(5,809)
(2,216)
(4,758)
17,541
(1,681)
17,327
(3,218)
202,238
172,671
560,038
434,743
(33,806)
838
(226,222)
(103,893)
32,608
500
59,067
(4,919)
Our share of reconciling items included in earnings from unconsolidated entities
2,297
6,125
(1,609)
8,920
-
-
-
19,320
-
21,186
-
31,914
1,099
28,649
(168,764)
(48,658)
$
203,337
$
201,320
$
391,274
$
386,085
(4,906)
(6,646)
(12,790)
(17,993)
(19,318)
(14,755)
(33,606)
(28,169)
(27,353)
(22,150)
(47,741)
(46,137)
(19,224)
(12,784)
(32,624)
(23,117)
Amortization of management contracts
1,393
1,792
3,008
3,008
Amortization of debt discounts (premiums) and financing costs, net of capitalization
(3,839)
(6,063)
(10,841)
(7,452)
Stock compensation expense
13,212
7,855
27,299
16,167
AFFO
$
143,302
$
148,569
$
283,979
$
282,392
Common stock dividends
$
141,083
$
131,513
$
271,836
$
261,593
2012
Six Months Ended
June 30,
2013
2012
Three Months Ended
June 30,
Unrealized foreign currency and derivative losses (gains), net
Deferred income tax benefit
Our share of reconciling items included in earnings from unconsolidated entities
2013
Straight-lined rents and amortization of lease intangibles
Property improvements
Tenant improvements
Leasing commissions
Reconciliation of net earnings (loss) to FFO
Subtotal-NAREIT defined FFO
FFO, as defined by Prologis
Reconciling items related to noncontrolling interests
Core FFO
Net earnings (loss) attributable to common stockholders
Add (deduct) NAREIT defined adjustments:
Add (deduct) our defined adjustments:
Real estate related depreciation and amortization
Net gains on non-FFO dispositions and acquisitions
Our share of reconciling items included in earnings from unconsolidated entities
Adjustments to arrive at Adjusted FFO ("AFFO"), including our share of unconsolidated
entities: Adjustments to arrive at Core FFO, including our share of unconsolidated
entities: Adjustments to arrive at Core FFO
Impairment charges
Merger, acquisition and other integration expenses
Losses (gains) on early extinguishment of debt and redemption of preferred stock, net
Net losses (gains) on acquisitions and dispositions of investments in real estate, net of related
income taxes (in thousands) |
 Copyright ©
2013 Prologis
Supplemental 2Q 2013
Financial Information
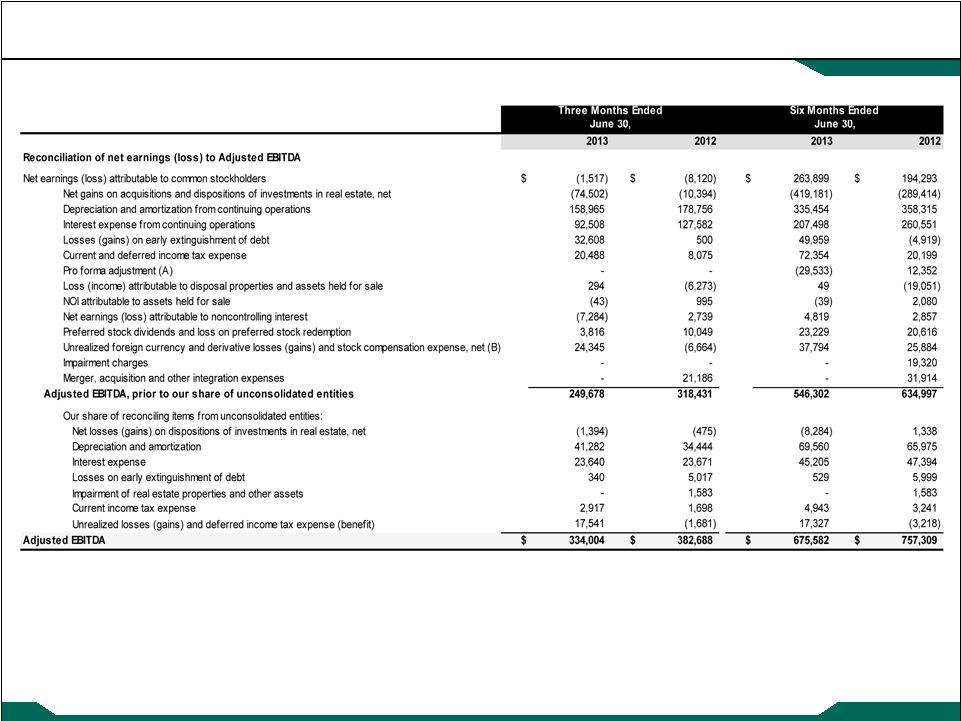
EBITDA Reconciliation
9
(in thousands)
(A)
Adjustments during 2013 include the effects of Nippon Prologis REIT, Inc.
(“NPR”) and Prologis European Logistics Partners Sarl (“PELP”) as if we made the first quarter contribution at the
beginning of the year (i.e. removing actual NOI recognized and replacing with an
estimate of our share of NOI and fees). Adjustments during 2012 include the effects of Prologis North
American Industrial Fund II and Prologis California to reflect NOI for the full
period. (B)
Second quarter 2013 includes the investment management expense related to the
promote earned as the promote revenue is not included in Adjusted EBITDA. |
 Copyright ©
2013 Prologis |
 |
 Copyright ©
2013 Prologis
Supplemental 2Q 2013
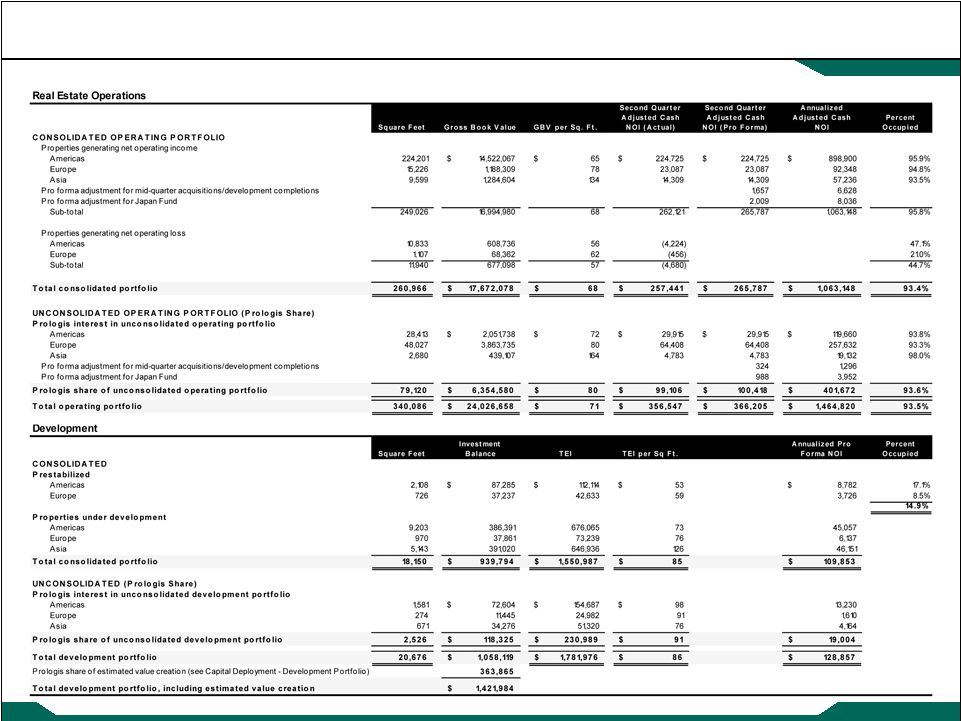
Operations Overview
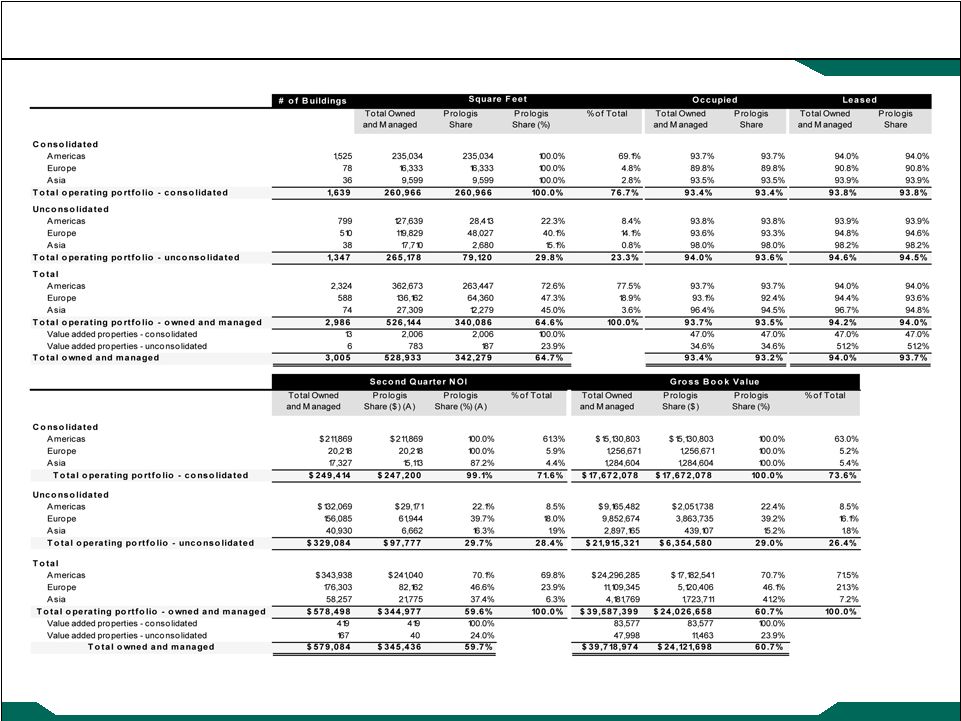
Operating Portfolio –
Square Feet, Occupied and Leased
12
(A) Selected and ordered by Prologis share of NOI ($).
(square feet in thousands) |
 Copyright ©
2013 Prologis
Supplemental 2Q 2013
Operations Overview
Operating Portfolio –
NOI and Gross Book Value
13
(A)
Prologis’
share of NOI for the properties acquired from Japan Fund I by Prologis and NPR
reflect NOI at the time it was earned, based on our share of the actual ownership during the quarter.
We estimate NOI on the properties acquired by NPR based on the results of the
properties while owned by Japan Fund I and Prologis. (B)
Selected and ordered by Prologis share of NOI ($).
(dollars in thousands) |
 Copyright ©
2013 Prologis
Supplemental 2Q 2013
14
(A)
Prologis’
share of NOI for the properties acquired from Japan Fund I by Prologis and NPR
reflect NOI at the time it was earned, based on our share of the actual ownership during the quarter.
We estimate NOI on the properties acquired by NPR based on the results of the
properties while owned by Japan Fund I and Prologis. Operations Overview
Operating Portfolio –
Summary by Division
(square feet and dollars in thousands) |
 Copyright ©
2013 Prologis
Supplemental 2Q 2013
Copyright ©
2013 Prologis
Supplemental 2Q 2013
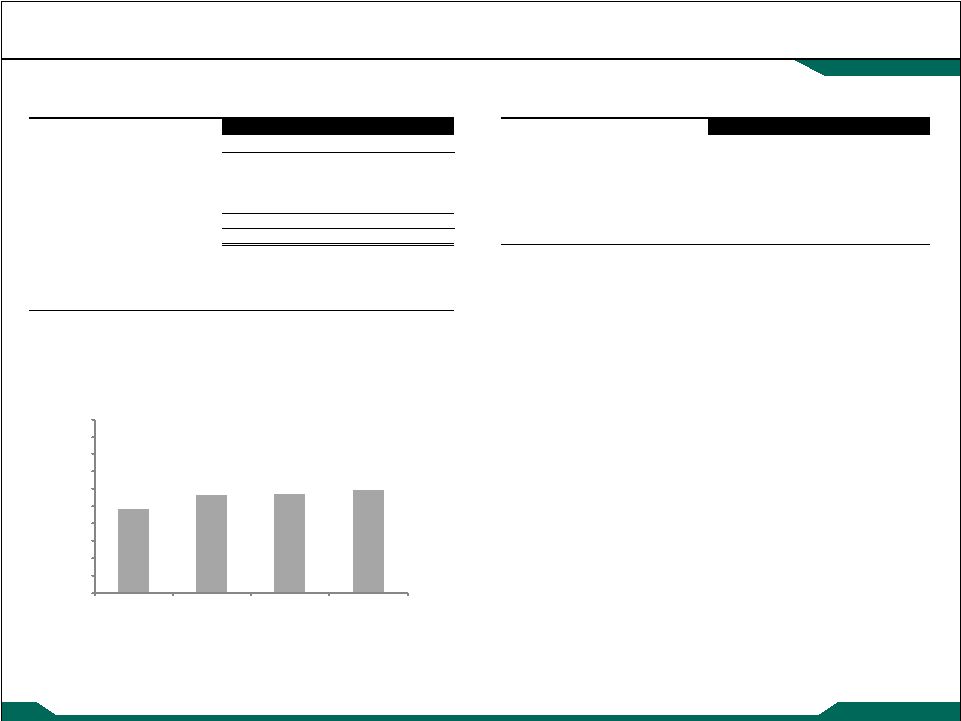
Operations Overview
Operating Metrics –
Owned and Managed
15
(A) Turnover costs per foot represent expected costs based on the leases
signed during the quarter. (square feet and dollars in thousands)
End
Q3 2012
Q4 2012
Q1 2013
Q2 2013
a
2,279
3,772
3,787
2,389
New leases
12,102
11,571
9,688
9,713
Renewals
24,599
25,118
22,374
24,148
36,701
36,689
32,062
33,861
38,980
40,461
35,849
36,250
45
44
45
49
Rent change on rollover
(1.7%)
(2.1%)
2.0%
4.0%
Don’t Delete This
Square feet of leases signed:
Leasing Activity
Total square feet of leases signed
Properties under development
Operating portfolio:
Square feet of leases signed in the operating porfolio
Average term of leases signed (months)
93.3%
92.0%
96.5%
93.1%
94.2%
93.0%
96.9%
94.0%
93.8%
92.9%
97.1%
93.7%
93.7%
93.1%
96.4%
93.7%
85%
90%
95%
100%
Total
Asia
Americas
Europe
Q3 2012 Q4 2012 Q1 2013 Q2 2013
Q3 2012 Q4 2012 Q1 2013 Q2 2013
Q3 2012 Q4 2012 Q1 2013 Q2 2013
Q3 2012 Q4 2012 Q1 2013 Q2 2013
60%
65%
70%
75%
80%
85%
90%
Q3 2012
Q4 2012
Q1 2013
Q2 2013
Weighted Average Customer Retention
87.5%
87.3%
78.0%
84.6%
9.1%
8.8%
8.7%
7.8%
0%
2%
4%
6%
8%
10%
12%
$1.25
$1.35
$1.45
$1.55
$1.65
$1.75
Q3 2012
Q4 2012
Q1 2013
Q2 2013
$1.50
$ 1.41
$1.38
$1.36
-1.7%
-2.1%
2.0%
4.0%
-5.0%
-3.0%
-1.0%
1.0%
3.0%
5.0%
Q3 2012
Q4 2012
Q1 2013
Q2 2013
Rent Change on Rollover
Turnover Costs (per square foot) (A) -
Value of Lease (%)
Period Ending Occupancy by Division |
 Copyright ©
2013 Prologis
Supplemental 2Q 2013
Operations Overview
Operating Metrics –
Owned and Managed
16
(A) See the Notes and Definitions for further explanations.
(B) Turnover costs represent costs incurred during the quarter.
(square feet and dollars in thousands)
Q3 2012
Q4 2012
Q1 2013
Q2 2013
Q3 2012
Q4 2012
Q1 2013
Q2 2013
33,704
$
47,517
$
18,264
$
25,046
$
514,031
501,957
510,295
508,242
0.06
$
0.09
$
0.03
$
0.05
$
Rental income
2.3%
1.8%
2.7%
1.4%
31,515
36,715
27,241
34,915
Rental expenses
1.1%
6.8%
9.1%
3.5%
21,483
25,166
18,344
26,827
Net operating income - GAAP
2.7%
0.1%
0.3%
0.7%
Total turnover costs (B)
52,998
61,881
45,585
61,742
Net operating income - adjusted cash
3.0%
0.8%
1.8%
(0.4%)
86,702
$
109,398
$
63,849
$
86,788
$
Average occupancy
2.3%
2.1%
1.6%
1.9%
Trailing four quarters - % of gross NOI
12.7%
13.9%
14.0%
14.8%
72.0%
75.4%
75.3%
75.9%
62,428
$
82,488
$
48,076
$
65,895
$
`
Don’t Delete this cell
Same Store Information (A)
Prologis share
Weighted average ownership percent
$ per square foot
Total capital expenditures
Leasing commissions
Property improvements
Tenant improvements
Capital Expenditures Incurred
Square feet of population
Percentage change:
$0.05
$0.06
$0.06
$0.06
$-
$0.01
$0.02
$0.03
$0.04
$0.05
$0.06
$0.07
$0.08
$0.09
$0.10
Q3 2012
Q4 2012
Q1 2013
Q2 2013
Property Improvements by Square Foot
(trailing four quarters) |
 Copyright ©
2013 Prologis
Supplemental 2Q 2013
Operations Overview
Customer Information –
Owned and Managed
17
1
DHL
1.8%
11,882
Month to month customers
$
52,029
1.9%
10,437
2.1%
2
CEVA Logistics
1.3%
6,686
2013
147,264
5.5%
29,316
5.9%
3
Kuehne + Nagel
1.1%
5,871
2014
439,166
16.4%
84,326
17.1%
4
Amazon.com, Inc.
1.1%
4,678
2015
470,998
17.6%
90,142
18.3%
5
Geodis
0.9%
5,517
2016
398,726
14.9%
77,213
15.7%
6
Home Depot, Inc.
0.9%
4,177
2017
349,745
13.1%
64,197
13.0%
7
FedEx Corporation
0.8%
2,372
Thereafter
818,138
30.6%
137,417
27.9%
8
Hitachi Ltd
0.8%
2,148
Total
$
2,676,066
100%
493,048
100%
9
United States Government
0.8%
1,483
10
PepsiCo
0.7%
4,883
10.2%
49,697
11
Tesco PLC
0.6%
2,693
12
Panasonic Co., Ltd.
0.6%
2,192
Month to month customers
$
38,494
2.3%
7,299
2.3%
13
Panalpina, Inc.
0.6%
2,457
2013
97,579
5.9%
19,205
6.0%
14
Sagawa Express
0.5%
1,120
2014
275,517
16.5%
55,881
17.6%
15
Wal-Mart Stores, Inc.
0.5%
2,655
2015
292,330
17.5%
58,171
18.3%
16
ND Logistics
0.5%
2,481
2016
255,952
15.4%
51,539
16.2%
17
Nippon Express Group
0.5%
1,359
2017
218,254
13.1%
40,777
12.8%
18
APL (Neptune Orient Lines)
0.5%
3,805
Thereafter
488,249
29.3%
85,027
26.8%
19
National Distribution Centers LP
0.4%
3,361
Total
$
1,666,375
100%
317,899
100%
20
LG Electronics, Inc.
0.4%
2,540
21
UPS SCS (United Parcel Service Inc.)
0.4%
2,139
22
La Poste
0.4%
1,278
23
DB Schenker
0.4%
2,397
24
Bayerische Motoren Werke Ag (BMW)
0.4%
1,916
25
Cal Cartage/Brookvale
0.4%
1,266
17.3%
83,356
Top 10 Customers
Top 25 Customers
Lease Expirations - Operating Portfolio - Prologis Share
Year
Annual Base
Rent
Percentage
of Total
Occupied
Square Feet
Percentage
of Total
Percentage
of Total
Top Customers
Lease Expirations - Operating Portfolio - Owned and Managed
Year
Percentage
of Total
% of Annual
Base Rent
Total Square
Feet
Occupied
Square Feet
Annual Base
Rent
(square feet and dollars in thousands) |
 Copyright ©
2013 Prologis
Supplemental 2Q 2013
Capital Deployment
Dispositions and Contributions
18
(A)
Prologis share reflects our effective ownership. For contributions, this amount
reflects net cash proceeds to Prologis (net of units received for partial consideration).
(B) This is a consolidated fund.
(C)
During the second quarter of 2013, Prologis acquired the noncontrolling interest in
this venture. As of June 30, 2013, all remaining assets and liabilities are wholly owned.
(D)
In connection with the wind down of this fund, in June 2013 all the properties owned
by this fund were acquired by Prologis or NPR. As of June 30, 2013, there are no more properties
remaining in this venture.
(square feet and dollars in thousands)
Prologis wholly owned
150
150
$12,083
$12,083
100.0%
346
346
$27,452
$27,452
100.0%
Prologis AMS (B)
-
-
-
-
-
229
88
20,600
7,929
38.5%
Prologis Institutional Alliance Fund II (B) (C)
1,012
285
84,993
23,955
28.2%
1,012
285
84,993
23,955
28.2%
Prologis North American Industrial Fund
218
50
7,050
1,626
23.1%
218
50
7,050
1,626
23.1%
Prologis Targeted U.S. Logistics Fund
104
25
28,003
6,688
23.9%
104
25
28,003
6,688
23.9%
Total Americas
1,484
510
132,129
44,352
33.6%
1,909
794
168,098
67,650
40.2%
Prologis wholly owned
301
301
30,941
30,941
100.0%
301
301
30,941
30,941
100.0%
Total Europe
301
301
30,941
30,941
100.0%
301
301
30,941
30,941
100.0%
Asia
Prologis wholly owned
-
-
-
-
-
-
-
-
-
-
Prologis Japan Fund 1 (D)
543
109
108,117
21,623
20.0%
1,094
219
222,157
44,431
20.0%
Total Asia
543
109
108,117
21,623
20.0%
1,094
219
222,157
44,431
20.0%
Total Third Party Building Dispositions
2,328
920
$271,187
$96,916
35.7%
3,304
1,314
$421,196
$143,022
34.0%
Brazil Fund and joint ventures
-
-
$0
$0
-
823
206
$97,383
$24,346
25.0%
Prologis Mexico Fondo Logistico
745
745
49,429
39,543
80.0%
745
745
49,429
39,543
80.0%
Total Americas
745
745
49,429
39,543
80.0%
1,568
951
146,812
63,889
43.5%
Prologis Targeted Europe Logistics Fund
-
-
-
-
-
571
571
39,722
26,872
67.7%
Prologis European Logistics Partners (PELP)
-
-
-
-
-
48,743
48,743
3,074,924
1,537,462
50.0%
Total Europe
-
-
-
-
0.0%
49,314
49,314
3,114,646
1,564,334
50.2%
Asia
Nippon Prologis REIT (NPR)
1,024
1,024
232,609
197,718
85.0%
10,597
10,597
2,095,442
1,781,126
85.0%
Total Asia
1,024
1,024
232,609
197,718
85.0%
10,597
10,597
2,095,442
1,781,126
85.0%
1,769
1,769
$282,038
$237,261
84.1%
61,479
60,862
$5,356,900
$3,409,349
63.6%
4,097
2,689
$553,225
$334,177
60.4%
64,783
62,176
$5,778,096
$3,552,371
61.5%
10,866
10,866
100.0%
62,955
62,955
100.0%
3,151
2,611
82.9%
3,856
3,316
86.0%
$567,242
$347,654
61.3%
$5,844,907
$3,618,642
61.9%
5.6%
6.5%
Weighted average stabilized cap rate on building dispositions and
contributions
Grand Total Dispositions and Contributions
Europe
Square Feet
Q2 2013
Land dispositions
Other real estate dispositions
Americas
Europe
Total Contributions and Dispositions to Co-Investment Ventures
Total Building Dispositions and Contributions
Building Contributions and Dispositions to Co-Investment Ventures
Third Party Building Dispositions
Americas
YTD 2013
Prologis Share
of Proceeds (%)
(A)
Prologis Share
of Square Feet
Prologis Share
of Proceeds (%)
(A)
Total Proceeds
Prologis Share
of Proceeds ($)
Square Feet
Prologis Share
of Square Feet
Prologis Share
of Proceeds ($)
Total Proceeds |
 Copyright ©
2013 Prologis
Supplemental 2Q 2013
Capital Deployment
Third Party Building Acquisitions and Equity Invested in Co-Investment
Ventures Prologis Share of
Prologis Share of
Acquisition
Cost (%) (A)
Acquisition
Cost (%) (A)
Third Party Building Acquisitions
Prologis wholly owned
1,083
1,083
$ 50,168
$ 50,168
100.0%
1,134
1,134
$ 53,291
$ 53,291
100.0%
Prologis Targeted U.S. Logistics Fund
889
212
41,384
9,882
23.9%
889
212
41,384
9,882
23.9%
Total Americas
1,972
1,295
91,552
60,050
65.6%
2,023
1,346
$ 94,675
$ 63,173
66.7%
Prologis European Properties Fund II
137
45
10,331
3,419
33.1%
268
84
21,299
6,676
31.3%
Total Europe
137
45
10,331
3,419
33.1%
268
84
21,299
6,676
31.3%
Asia
-
-
-
-
-
-
-
-
-
-
2,109
1,340
$ 101,883
$ 63,469
62.3%
2,291
1,430
$ 115,974
$ 69,849
60.2%
7.2%
7.4%
Before
After (B)
Before
After (B)
Prologis Institutional Alliance Fund II
$ 274,326
28.2%
100.0%
$ 274,326
28.2%
100.0%
Prologis Targeted Europe Logistics Fund
65,565
32.4%
38.8%
65,565
32.4%
38.8%
Prologis European Properties Fund II
69,823
30.7%
33.1%
89,974
29.7%
33.1%
$ 409,714
$ 429,865
Total Equity Invested in Co-Investment
Ventures
Q2 2013
YTD 2013
Prologis Share of
Acquisition Cost ($)
Prologis Share
of Square
Feet
Square Feet
Acquisition Cost
Prologis Share of
Acquisition Cost ($)
Acquisition Cost
Square Feet
Americas
Weighted average stabilized cap rate
Prologis Share
of Square
Feet
Total Third Party Building Acquisitions
Europe
YTD 2013
Total Equity
Invested
Ownership
Q2 2013
Ownership
Total Equity
Invested
Equity Invested in Co-Investment Ventures
(square feet and dollars in thousands)
(A)
Prologis share reflects our effective ownership.
(B)
May include the impact of other equity investments by our partners.
19 |
 Copyright ©
2013 Prologis
Supplemental 2Q 2013
Capital Deployment
Development Starts –
Current Quarter
20
Square Feet
Total Expected
Investment
Cost Per
Square Foot
Leased % at
Start
Square Feet
Total Expected
Investment
Cost Per
Square Foot
Leased % at
Start
Square Feet
Total Expected
Investment
Americas
1,619
$105,857
$65
44.2%
1,619
$105,857
$65
44.2%
100.0%
100.0%
Total Americas
1,619
105,857
65
44.2%
1,619
105,857
65
44.2%
100.0%
100.0%
Europe
573
35,304
62
100.0%
573
35,304
62
100.0%
100.0%
100.0%
Prologis European Properties Fund II
120
9,207
77
100.0%
40
3,047
77
100.0%
33.1%
33.1%
693
44,511
64
100.0%
613
38,351
63
100.0%
88.5%
86.2%
Asia
838
143,412
171
0.0%
838
143,412
171
0.0%
100.0%
100.0%
Prologis China Logistics Venture I
1,762
91,545
52
25.7%
264
13,732
52
25.7%
15.0%
15.0%
2,600
234,957
90
17.4%
1,102
157,144
143
6.2%
42.4%
66.9%
Total
4,912
$385,325
$78
37.9%
3,334
$301,352
$90
41.9%
67.9%
78.2%
Weighted average estimated stabilized yield
7.1%
$27,377
Weighted average estimated cap rate at stabilization
6.2%
$53,724
Estimated development margin
13.9%
Prologis share of value creation on development starts (B)
79.4%
Prologis share of value creation on development starts (B)
$42,670
Prologis share of value creation realized on VACs (B)
$72,330
Total Prologis share of estimated and realized value creation
this quarter
Pro forma NOI
Estimated value creation (B)
Total Asia
Total Q2 2013
Consolidated
Prologis Share - Q2
Prologis Share (%) - Q2 (A)
Consolidated
Total Europe
Consolidated
(in thousands, except percent and per square foot)
(A)
Prologis share reflects our effective ownership.
(B)
Value Creation excludes fees or promotes that we may earn. See complete definition
in the Notes and Definitions section. |
 Copyright ©
2013 Prologis
Supplemental 2Q 2013
$-
$200,000
$400,000
$600,000
$800,000
$1,000,000
$1,200,000
$1,400,000
$1,600,000
$1,800,000
2009
2010
2011
2012
YTD 2013
Americas
Europe
Asia
Capital Deployment
Development Starts –
Year to Date
21
(A)
Prologis share reflects our effective ownership.
(B)
Value Creation excludes fees or promotes that we may earn. See complete definition
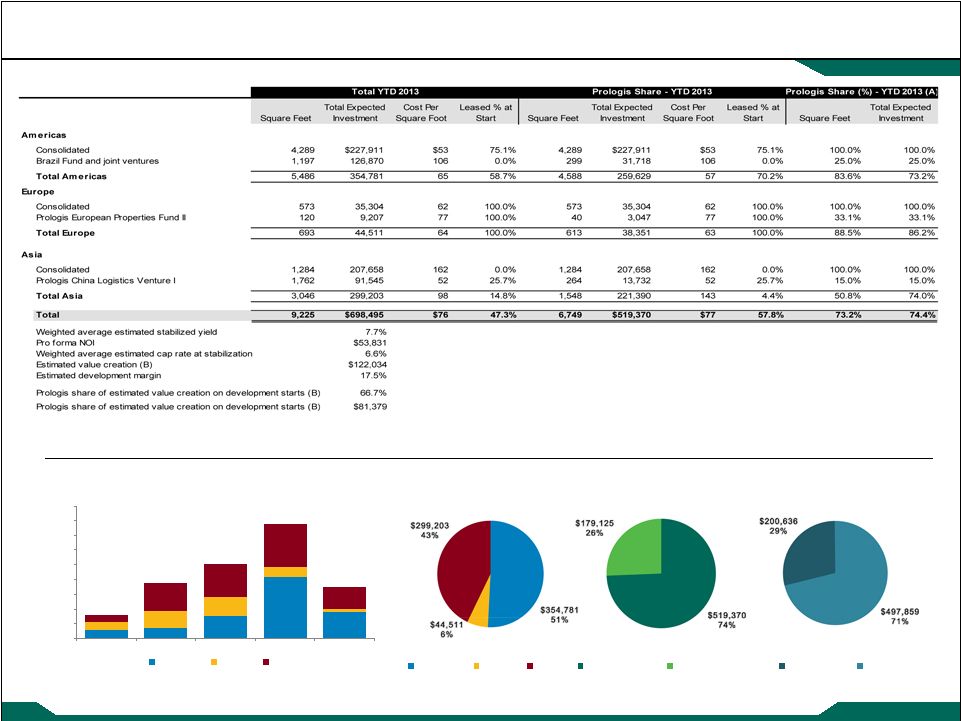
in the Notes and Definitions section. Year to Date 2013 Development
Starts Historical Development Starts (TEI)
(in thousands, except percent and per square foot)
$313,877
$758,905
$1,016,763
$1,552,785
Speculative
Build to Suit
$698,495
Partners’
Share
Prologis Share
Europe
Americas
Asia |
 Copyright ©
2013 Prologis
Supplemental 2Q 2013
Capital Deployment
Development Portfolio
22
(in thousands, except percent)
(A) Value creation excludes fees or promotes that we may earn. See complete
definition in the Notes and Definitions section. |
 Copyright ©
2013 Prologis
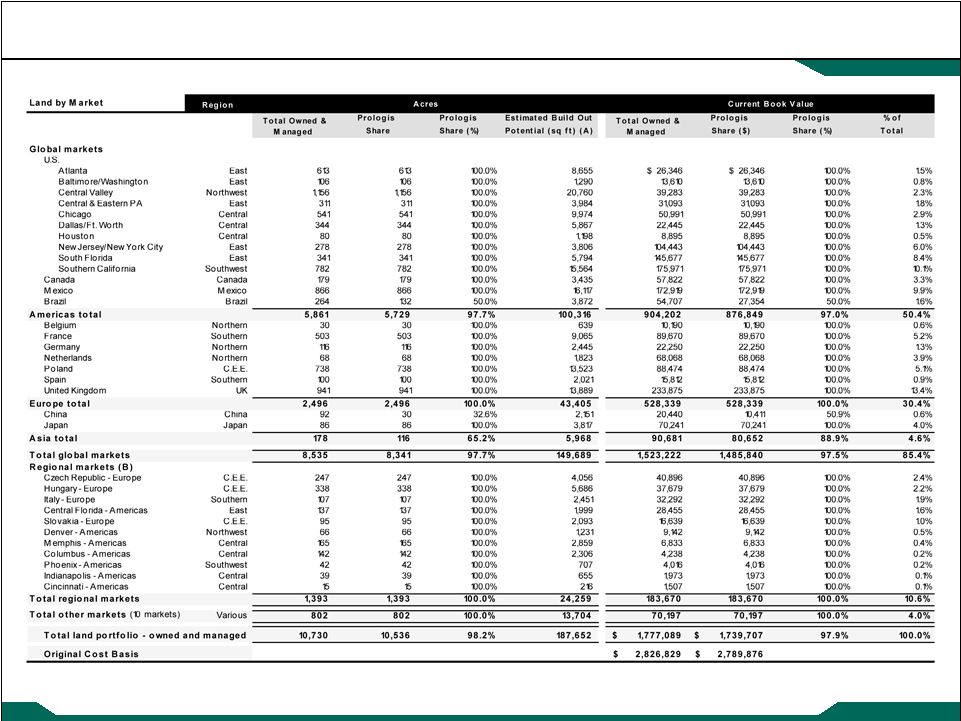
Supplemental 2Q 2013
Capital Deployment
Land Portfolio –
Owned and Managed
23
(A)
Represents estimated finished square feet available for rent upon completion of an
industrial building on existing parcels of land. (B)
Ordered by our share of current book value.
(square feet and dollars in thousands) |
 Copyright ©
2013 Prologis
Supplemental 2Q 2013
Capital Deployment
Land Portfolio –
Summary and Roll Forward
24
Investment at
Acres
% of Total
June 30, 2013
% of Total
6,887
64.1%
954,824
$
53.7%
Brazil Fund and joint ventures
264
2.5%
54,707
3.1%
Total Americas
7,151
66.6%
1,009,531
56.8%
3,401
31.7%
676,877
38.1%
104
1.0%
78,882
4.4%
Prologis China Logistics Venture 1
74
0.7%
11,799
0.7%
Total Asia
178
1.7%
90,681
5.1%
10,730
100.0%
1,777,089
$
100.0%
Americas
Europe
Asia
Total
1,061,206
$
669,696
$
135,621
$
1,866,523
$
Acquisitions
4,472
-
20,814
25,286
Dispositions
(3,488)
(4,218)
-
(7,706)
Development starts
(45,135)
(6,682)
(63,554)
(115,371)
Infrastructure costs
20,646
6,916
1,543
29,105
Reclasses
(16,559)
-
-
(16,559)
Effect of changes in foreign exchange rates and other
(11,611)
11,165
(3,743)
(4,189)
1,009,531
$
676,877
$
90,681
$
1,777,089
$
Land Portfolio Summary
Consolidated
Americas
Total land portfolio - owned and managed
Consolidated
Europe
Asia
Consolidated
As of June 30, 2013
Land Roll Forward - Owned and Managed
As of March 31, 2013
(dollars in thousands)
. |
 |
 |
  Copyright ©
2013 Prologis
Supplemental 2Q 2013
Capitalization
Debt and Equity Summary
27
(A)
Based on Prologis share of the total debt. Interest rate is based on the
effective rate (which includes the amortization of related premiums and discounts) assuming the net premiums
(discounts) associated with the respective debt were included in the
maturities by year. (B)
Interest rate is based on the effective rate and weighted based on borrowings
outstanding. $92
$0
$0
$0
$41
$133
$42
$175
$612
$787
$308
39.1%
4.1%
557
-
322
638
475
1,992
36
2,028
1,727
3,755
2,572
68.5%
3.3%
175
460
309
1
149
1,094
25
1,119
836
1,955
1,365
69.8%
3.7%
640
-
-
1
312
953
126
1,079
1,377
2,456
1,294
52.7%
5.3%
700
-
-
1
264
965
4
969
518
1,487
1,084
72.9%
5.3%
900
-
-
1
113
1,014
74
1,088
701
1,789
1,175
65.7%
5.5%
647
-
-
1
294
942
2
944
463
1,407
1,051
74.7%
6.1%
662
-
-
1
9
672
2
674
953
1,627
907
55.7%
5.8%
-
-
-
1
135
136
2
138
445
583
243
41.7%
3.5%
-
-
-
-
7
7
2
9
200
209
51
24.4%
4.8%
-
-
-
10
137
147
6
153
140
293
172
58.7%
6.6%
Subtotal
4,373
460
631
655
1,936
8,055
321
8,376
7,972
16,348
10,222
62.5%
64
(63)
-
-
39
40
1
41
22
63
48
76.2%
Subtotal
4,437
397
631
655
1,975
8,095
322
8,417
7,994
16,411
$10,270
62.6%
4.6%
-
-
-
-
-
-
(225)
(225)
(5,916)
(6,141)
Prologis share of debt
$4,437
$397
$631
$655
$1,975
$8,095
$97
$8,192
$2,078
$10,270
$3,790
$397
$263
$29
$1,794
$6,273
$76
$6,349
$918
9,395
$
$7,267
545
-
38
626
-
1,209
18
1,227
796
2,887
2,023
-
-
8
-
-
8
-
8
160
533
168
102
-
322
-
181
605
-
605
190
1,617
795
-
-
-
-
-
-
3
3
14
35
17
Prologis share of debt
$4,437
$397
$631
$655
$1,975
$8,095
$97
$8,192
$2,078
$10,270
5.6%
3.3%
1.6%
1.8%
5.1%
4.7%
4.5%
4.7%
4.5%
5.0%
4.6%
4.3
1.7
1.3
1.0
4.2
3.6
4.2
3.6
3.3
4.1
3.6
Weighted average interest rate (B)
Weighted average remaining maturity in year
Unamortized net premiums (discounts)
Third party share of debt
Prologis share of debt by local currency
Dollars
Euro
GBP
2019
2020
2021
Yen
Other
Thereafter
2022
2018
Entities
Consolidated
Entities
2016
Debt
Debt
Debt
Maturity
Debt
Debt
2013
2014
2015
Total
Mortgage
2017
Facilities
Debt
Senior
Exchangeable
Credit
Other
Prologis
Debt
Total Debt
Unsecured
Consolidated
Total
Unconsolidated
Secured
Debt
Prologis
Total
Share of
Wtd. Avg.
Interest
Rate (A)
Prologis
Share (%)
Security
Shares
Value
Common Stock
498.6
$37.72
$18,807
$2,026
Partnership Units
3.8
$37.72
143
Total
502.4
$18,950
Borrowings outstanding
631
Outstanding letters of credit
68
Current availability
$1,327
Unrestricted cash
385
Total liquidity
$1,712
Less:
Market Equity
Liquidity
Price
Aggregate lender commitments
(dollars and shares in millions) |
 |
 Copyright ©
2013 Prologis
Supplemental 2Q 2013
Capitalization
Assets Under Management
29
Total Enterprise Value
Total AUM by Division
Assets Under Management
(dollars in millions)
0
5,000
10,000
15,000
20,000
25,000
30,000
35,000
40,000
45,000
50,000
Europe
23.1%
Asia
12.8%
$ 29,320
$ 46,243
Debt
$10,270
Committed Equity/Investment
$2,257
Americas
64.1%
$ 46,243
Direct
owned
and
other
assets
$23,469
Equity Cap and Preferred
Shares
$19,050
AUM
Investment
Management
$22,774
Investors' share of assets
in JVs/funds
$14,666
Prologis share of assets in
JVs/funds $5,851
Total
Enterprise
Value
$29,320 |
 Copyright ©
2013 Prologis
Supplemental 2Q 2013
Net Asset Value
Components
30
(in thousands, except for percentages and per square foot)
|
 Copyright ©
2013 Prologis
Supplemental 2Q 2013
Net Asset Value
Components -
Continued
31
(in thousands) |
 Copyright ©
2013 Prologis
Supplemental 2Q 2013
Notes and Definitions
32 |
 |
 |
 Copyright ©
2013 Prologis
Supplemental 2Q 2013
Notes and Definitions
35 |
 |
 Copyright ©
2013 Prologis
Supplemental 2Q 2013
Notes and Definitions
37 |
 Copyright ©
2013 Prologis
Supplemental 2Q 2013
38
Notes and Definitions |