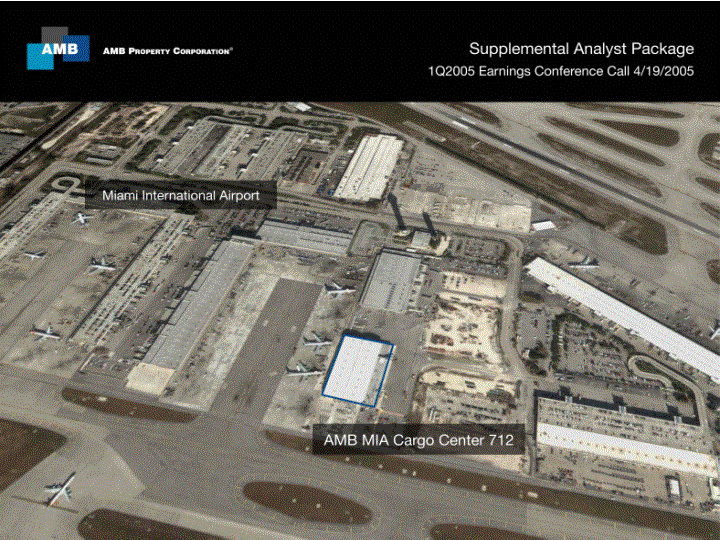
| TABLE OF CONTENTS i Cover: AMB MIA Cargo Center 712 is a 117,245 square foot on-airport cargo facility located at Miami International Airport, ranked first in the U.S. for international cargo volumes and fourth for total freight handled, according to Airports Council International. The property was acquired in February 2005 and is 100% leased to Arrow Cargo, a provider of scheduled air cargo logistics services. |
| FINANCIAL HIGHLIGHTS (dollars in thousands, except share data) (1) See the footnotes to the Adjusted EBITDA and Coverage Ratios. (2) See the footnotes to the Consolidated Statements of Funds from Operations. (3) See Supplemental Financial Measures Disclosures for a discussion of why management believes the Company's share of total debt is a useful supplemental measure for its management and investors, of ways to use this measure when assessing the Company's financial performance, and the limitations of the measure as a measurement tool. (4) See Reporting Definitions for definition of "AMB's share of total debt-to-AMB's share of total book capitalization." (5) See Reporting Definition for definition of "AMB's share of total debt-to-AMB's share of total market capitalization." 1 |
| SUPPLEMENTAL ANALYST PACKAGE First Quarter Earnings Conference Call |
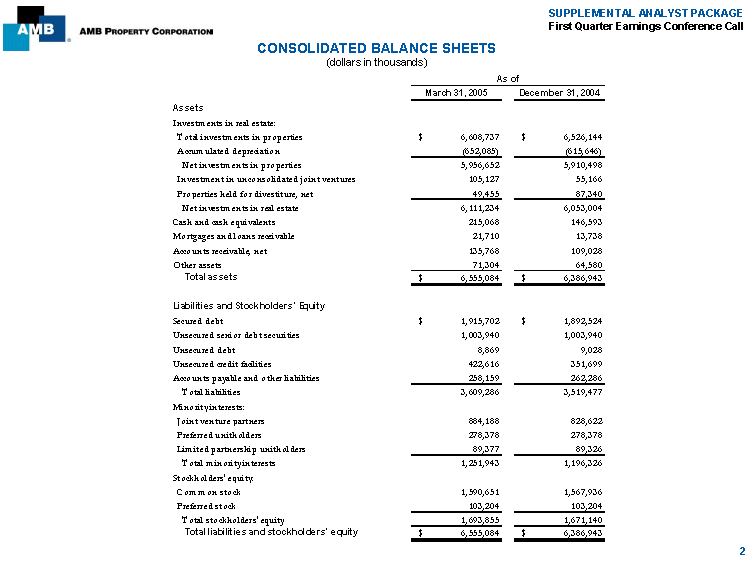
| CONSOLIDATED BALANCE SHEETS |
| (dollars in thousands) |
| As of |
| March 31, 2005 December 31, 2004 Assets |
| Investments in real estate: Total investments in properties $ 6,608,737 $ 6,526,144 Accumulated depreciation (652,085) (615,646) Net investments in properties 5,956,652 5,910,498 Investment in unconsolidated joint ventures 105,127 55,166 Properties held for divestiture, net 49,455 87,340 Net investments in real estate 6,111,234 6,053,004 Cash and cash equivalents 215,068 146,593 Mortgages and loans receivable 21,710 13,738 Accounts receivable, net 135,768 109,028 Other assets 71,304 64,580 Total assets $ 6,555,084 $ 6,386,943 |
| Liabilities and Stockholders’ Equity Secured debt $ 1,915,702 $ 1,892,524 Unsecured senior debt securities 1,003,940 1,003,940 Unsecured debt 8,869 9,028 Unsecured credit facilities 422,616 351,699 Accounts payable and other liabilities 258,159 262,286 Total liabilities 3,609,286 3,519,477 Minority interests: Joint venture partners 884,188 828,622 Preferred unitholders 278,378 278,378 Limited partnership unitholders 89,377 89,326 Total minority interests 1,251,943 1,196,326 Stockholders’ equity: Common stock 1,590,651 1,567,936 Preferred stock 103,204 103,204 Total stockholders’ equity 1,693,855 1,671,140 Total liabilities and stockholders’ equity $ 6,555,084 $ 6,386,943 |
| 2 |
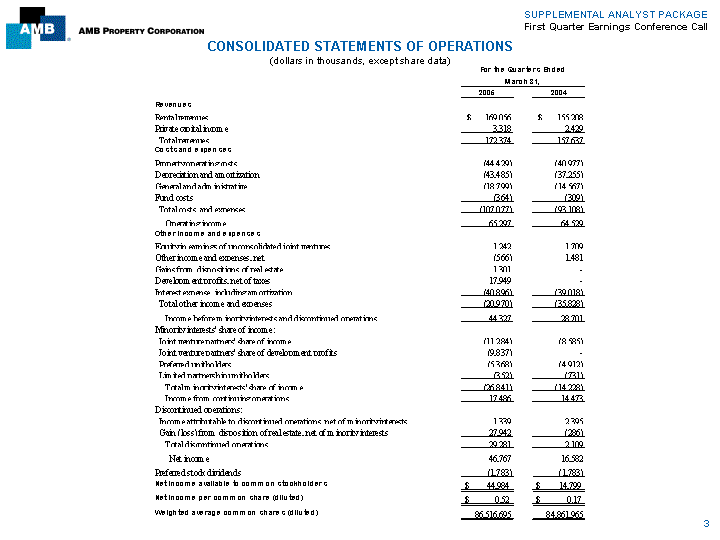
| CONSOLIDATED STATEMENTS OF OPERATIONS (dollars in thousands, except share data) 3 |
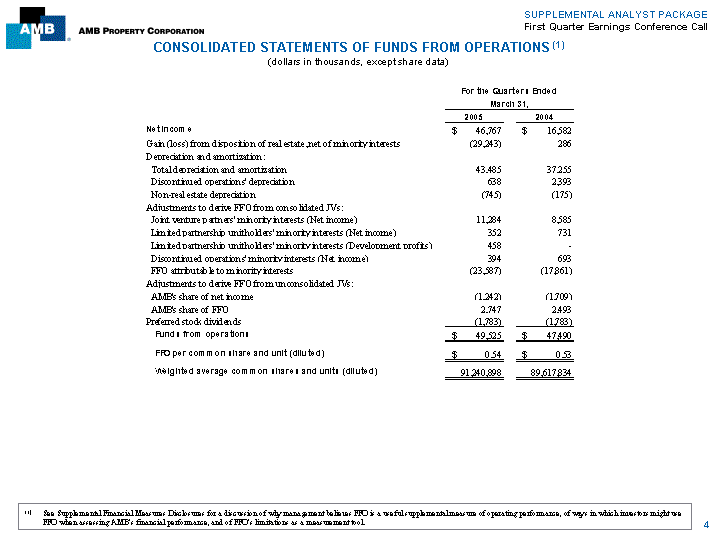
| CONSOLIDATED STATEMENTS OF FUNDS FROM OPERATIONS (1) (dollars in thousands, except share data) 4 (1) See Supplemental Financial Measures Disclosures for a discussion of why management believes FFO is a useful supplemental measure of operating performance, of ways in which investors might use FFO when assessing AMB's financial performance, and of FFO's limitations as a measurement tool. |
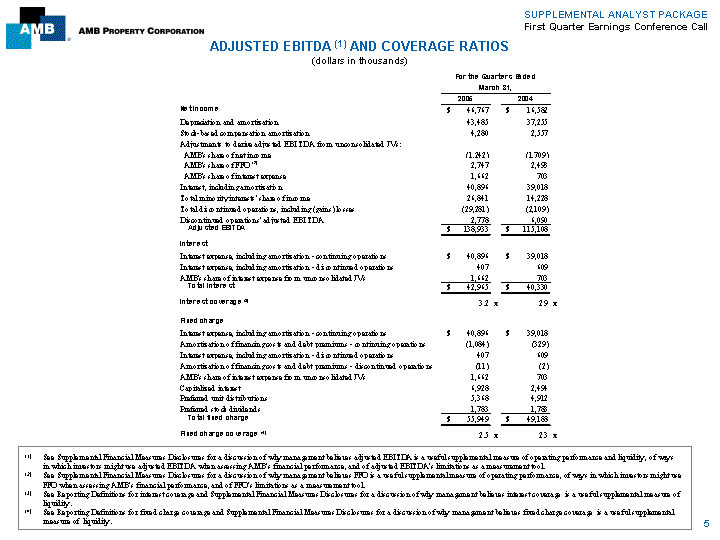
| ADJUSTED EBITDA (1) AND COVERAGE RATIOS (dollars in thousands) 5 (1) See Supplemental Financial Measures Disclosures for a discussion of why management believes adjusted EBITDA is a useful supplemental measure of operating performance and liquidity, of ways in which investors might use adjusted EBITDA when assessing AMB's financial performance, and of adjusted EBITDA's limitations as a measurement tool. (2) See Supplemental Financial Measures Disclosures for a discussion of why management believes FFO is a useful supplemental measure of operating performance, of ways in which investors might use FFO when assessing AMB's financial performance, and of FFO's limitations as a measurement tool. (3) See Reporting Definitions for interest coverage and Supplemental Financial Measures Disclosures for a discussion of why management believes interest coverage is a useful supplemental measure of liquidity. (4) See Reporting Definitions for fixed charge coverage and Supplemental Financial Measures Disclosures for a discussion of why management believes fixed charge coverage is a useful supplemental measure of liquidity. |
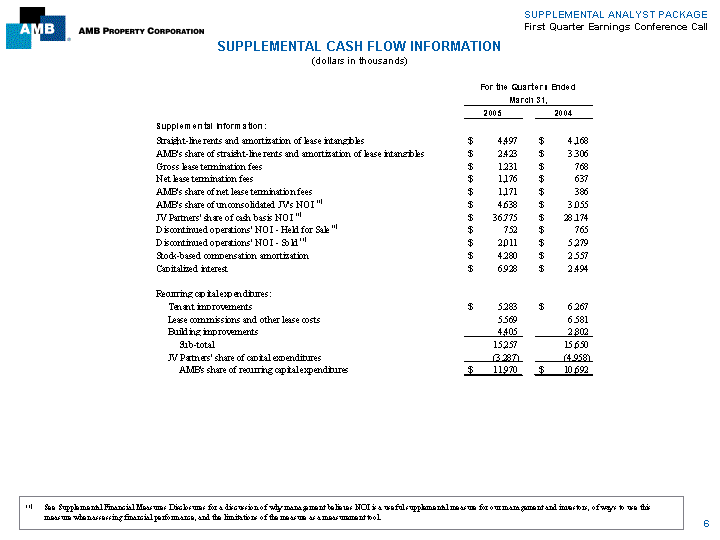
| SUPPLEMENTAL CASH FLOW INFORMATION (dollars in thousands) 6 (1) See Supplemental Financial Measures Disclosures for a discussion of why management believes NOI is a useful supplemental measure for our management and investors, of ways to use this measure when assessing financial performance, and the limitations of the measure as a measurement tool. |
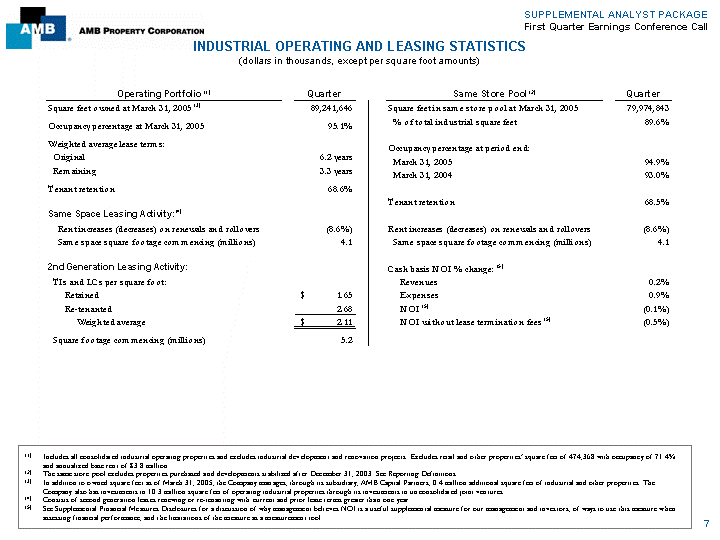
| INDUSTRIAL OPERATING AND LEASING STATISTICS (dollars in thousands, except per square foot amounts) (1) Includes all consolidated industrial operating properties and excludes industrial development and renovation projects. Excludes retail and other properties' square feet of 474,368 with occupancy of 71.4% and annualized base rent of $3.8 million. (2) The same store pool excludes properties purchased and developments stabilized after December 31, 2003. See Reporting Definitions. (3) In addition to owned square feet as of March 31, 2005, the Company manages, through its subsidiary, AMB Capital Partners, 0.4 million additional square feet of industrial and other properties. The Company also has investments in 10.3 million square feet of operating industrial properties through its investments in unconsolidated joint ventures. (4) Consists of second generation leases renewing or re-tenanting with current and prior lease terms greater than one year. (5) See Supplemental Financial Measures Disclosures for a discussion of why management believes NOI is a useful supplemental measure for our management and investors, of ways to use this measure when assessing financial performance, and the limitations of the measure as a measurement tool. 7 |
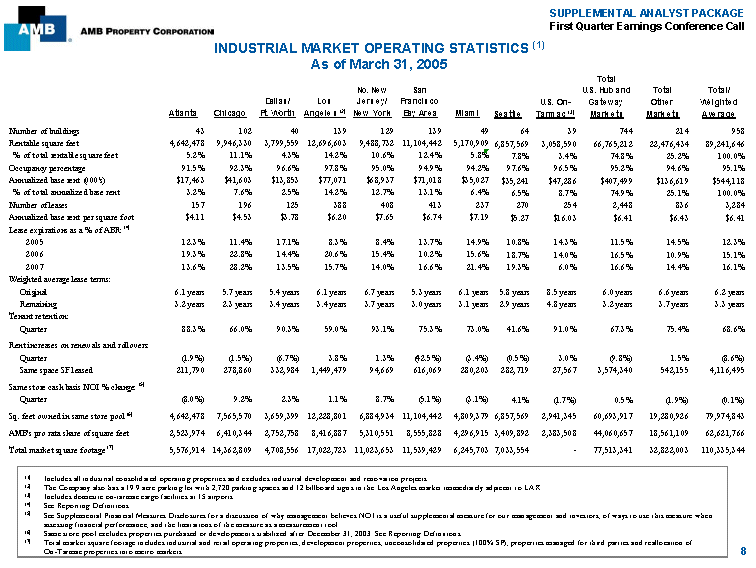
| SUPPLEMENTAL ANALYST PACKAGE First Quarter Earnings Conference Call INDUSTRIAL MARKET OPERATING STATISTICS (1) As of March 31, 2005 Total No. NewSanU.S. Hub andTotalTotal/ Dallas/LosJersey/ FranciscoU.S. On-GatewayOtherWeighted Atlanta Chicago Ft. Worth Angeles (2) New York Bay Area Miami Seattle Tarmac (3) MarketsMarketsAverage Number of buildings4310240139129139496439744214958 Rentable square feet4,642,478 9,946,330 3,799,559 12,696,603 9,488,732 11,104,442 5,170,909 6,857,569 3,058,590 66,765,212 22,476,434 89,241,646 % of total rentable square feet5.2%11.1%4.3%14.2%10.6%12.4%5.8%7.8%3.4%74.8%25.2%100.0% Occupancy percentage91.5%92.3%96.6%97.8%95.0%94.9%94.2% 97.6%96.5%95.2%94.6%95.1% Annualized base rent (000’s)$17,463 $41,603 $13,853 $77,071 $68,937 $71,018 $35,027 $35,241 $47,286 $407,499 $136,619 $544,118 % of total ann ualized base rent3.2%7.6%2.5%14.2%12.7%13.1%6.4%6.5%8.7%74.9%25.1%100.0% Number of leases 157 196 125 388 408 413 237 270 254 2,448 836 3,284 Annualized base rent per square foot$4.11 $4.53 $3.78 $6.20 $7.65 $6.74 $7.19 $5.27 $16.03 $6.41 $6.43 $6.41 Lease expirations as a % of ABR: (4) 200512.3%11.4%17.1%8.3%8.4%13.7%14.9% 10.8%14.3%11.5%14.5%12.3% 200619.3%22.8%14.4%20.6%15.4%10.2%15.6% 18.7%14.0%16.5%10.9%15.1% 200713.6%28.2%13.5%15.7%14.0%16.6%21.4% 19.3%6.0%16.6%14.4%16.1% Weighted average lease t erms: Original6.1 years 5.7 years 5.4 years 6.1 years 6.7 years 5.3 years 6.1 years 5.8 years 8.5 years6.0 years6.6 years6.2 years Remaining3.2 years 2.3 years 3.4 years 3.4 years 3.7 years 3.0 years 3.1 years 2.9 years 4.8 years3.2 years3.7 years3.3 years Tenant retention: Quarter88.3%66.0%90.3%59.0%93.1%75.3%73.0% 41. 6%91.0%67.3%75.4%68.6% Rent increases on renewals and rollovers: Quarter(1.9%)(1.5%)(6.7%)3.8% 1.3%(42.5%)(3.4%) (0.5%)3.0% (9.8%)1.5% (8.6%) Same space SF leased211,790278,860332,984 1,449,47994,669616,069280,203 282,71927,5673,574,340542,1554,116,495 Same store cash basis NOI % change: (5) Quarter(8.0%)9.2%2.3%1.1%8.7%(5.1%)(3.1%)4.1%(1.7%)0.5%(1.9%)(0.1%) Sq. feet owned in same store pool (6) 4,642,478 7,565,570 3,659,399 12,228,801 6,884,934 11,104,442 4,809,379 6,857,569 2,941,345 60,693,917 19,280,926 79,974,843 AMB’s pro rata share of square feet2,523,974 6,410,344 2,752,758 8,416,887 5,310,551 8,555,828 4,296,915 3,409,892 2,383,508 44,060,657 18,561,109 62,621,766 Total market square footage (7) 5,576,914 14,362,809 4,708,556 17,022,723 11,023,653 11,539,429 6,245,703 7,033,554 — 77,513,341 32,822,003 110,335,344 (1) Includes all industrial consolidated operating properties and excludes industrial development and renovation projects. (2) The Company also has a 19.9 acre parking lot with 2,720 parking spaces and 12 billboard signs in the Los Angeles market immediately adjacent to LAX. (3) Includes domestic on-tarmac cargo facilities at 15 airports. (4) See Reporting Definitions. (5) See Supplemental Financial Measures Disclosures for a discussion of why management believes NOI is a useful supplemental measure for our management and investors, of ways to use this measure when assessing financial performance, and the limitations of the measure as a measurement tool. (6) Same store pool excludes properties purchased or developments stabilized after December 31, 2003. See Reporting Definitions. (7) Total market square footage includes industrial and retail operating properties, development properties, unconsolidated properties (100% SF), properties managed for third parties and reallocation of On-Tarmac properties into metro markets.8 |

| SUPPLEMENTAL ANALYST PACKAGE First Quarter Earnings Conference Call INDUSTRIAL PORTFOLIO OVERVIEW As of March 31, 2005 NumberRentable% of TotalAnnualized % of TotalAnnualized ofSquareRentableOccupancyBase Rent AnnualizedNumberBase Rent per BuildingsFeetSquare FeetPercentage(000’s)Base Rentof LeasesSquare Foot Domestic Hub Markets74466,765,21274.8 %95.2 % $ 407,499 74.9 %2,448 $ 6.41 Other Markets Domestic Target Markets Austin101,656,2541.998.4 11,046 2.035 6.78 Baltimore/Washington DC543,846,5674.397.0 28,869 5.3264 7.74 Boston364,308,8374.890.7 27,305 5.099 6.99 Minneapolis283,426,5983.898.6 14,542 2.7144 4.31 Subtotal/Weighted Average12813,238,25614.895.5 81,762 15.0542 6.47 Domestic Non-Target Markets Charlotte211,317,8641.585.7 5,802 1.167 5.14 Columbus1240,0000.3100.0 594 0.13 2.48 Houston1410,0000.5100.0 2,172 0.41 5.30 Memphis171,883,8452.187.4 8,346 1.547 5.07 New Orleans5410,8390.5100.0 2,025 0.453 4.93 Newport News160,2150.176.8 583 0.12 12.61 Orlando161,424,7481.599.2 6,012 1.175 4.25 Portland5676,1040.897.4 3,091 0.68 4.70 San Diego5276,1670.391.4 1,973 0.420 7.82 Subtotal/Weighted Average726,699,7827.692.6 30,598 5.6276 4.93 International Target Markets (1) Amsterdam, Netherlands2302,0910.3100.0 3,417 0.62 11.31 Frankfurt, Germany1166,9170.2100.0 2,166 0.41 12.98 Mexico City, Mexico1131,9240.20.0 — 0.0 — — Paris, France41,022,0631.1100.0 7,794 1.44 7.63 Tokyo, Japan6915,4011.0100.0 10,882 2.111 11.89 Subtotal/Weighted Average (2)142,538,3962.894.8 24,259 4.518 10.08 Total Other Markets21422,476,43425.294.6 136,619 25.1836$ 6.43 Total/Weighted Average95889,241,646100.0 %95.1 % $ 544,118 100.0 %3,284$ 6.41 (1) Annualized base rent for leases denominated in foreign currencies is translated using the currency exchange rate at March 31, 2005. (2) Total market square footage in international markets increases to 4.0 million square feet and the percentage of total annualized base rent increases to 6.1% when industrial operating properties in Mexico and Singapore owned in unconsolidated co-investment joint ventures are included.9 |
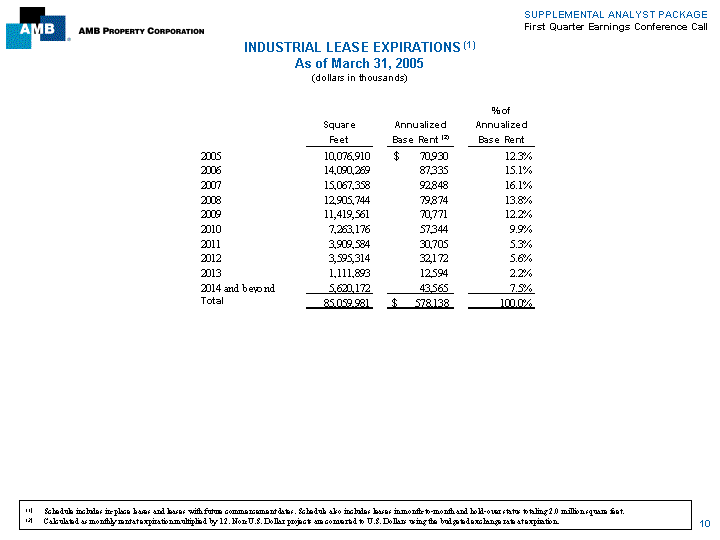
| INDUSTRIAL LEASE EXPIRATIONS (1) As of March 31, 2005 (dollars in thousands) (1) Schedule includes in-place leases and leases with future commencement dates. Schedule also includes leases in month-to-month and hold-over status totaling 2.0 million square feet. (2) Calculated as monthly rent at expiration multiplied by 12. Non-U.S. Dollar projects are converted to U.S. Dollars using the budgeted exchange rate at expiration. 10 |
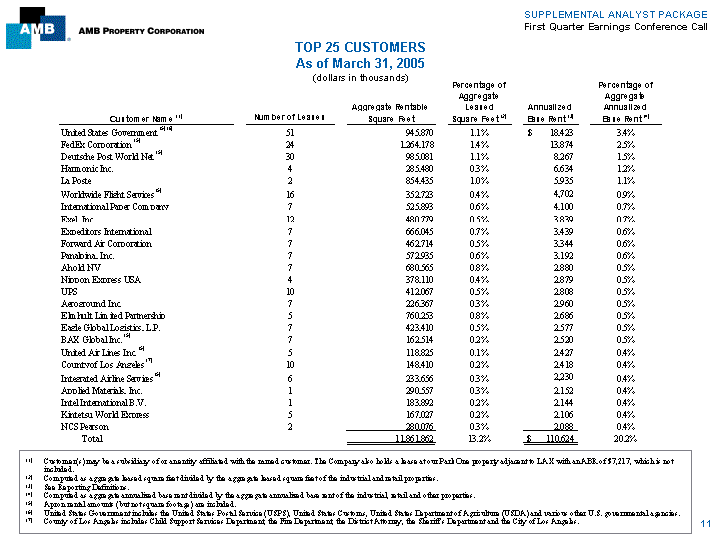
| TOP 25 CUSTOMERS As of March 31, 2005 (dollars in thousands) (1) Customer(s) may be a subsidiary of or an entity affiliated with the named customer. The Company also holds a lease at our Park One property adjacent to LAX with an ABR of $7,217, which is not included. (2) Computed as aggregate leased square feet divided by the aggregate leased square feet of the industrial and retail properties. (3) See Reporting Definitions. (4) Computed as aggregate annualized base rent divided by the aggregate annualized base rent of the industrial, retail and other properties. (5) Apron rental amounts (but not square footage) are included. (6) United States Government includes the United States Postal Service (USPS), United States Customs, United States Department of Agriculture (USDA) and various other U.S. governmental agencies. (7) County of Los Angeles includes Child Support Services Department, the Fire Department, the District Attorney, the Sheriff's Department and the City of Los Angeles. 11 |
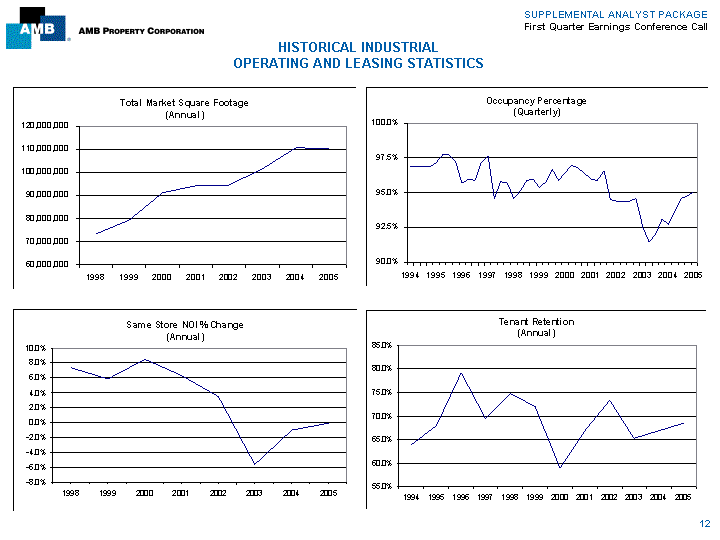
| HISTORICAL INDUSTRIAL OPERATING AND LEASING STATISTICS 12 |
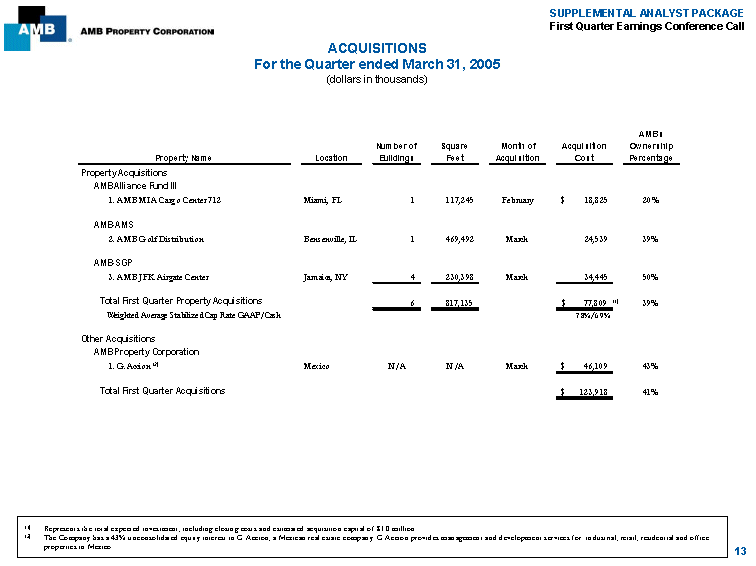
| SUPPLEMENTAL ANALYST PACKAGE First Quarter Earnings Conference Call ACQUISITIONS For the Quarter ended March 31, 2005 (dollars in thousands) AMB’s Number ofSquareMonth ofAcquisitionOwnership Property NameLocationBuildingsFeetAcquisitionCostPercentage Property Acquisitions AMB Alliance Fund III 1. AMB MIA Cargo Center 712Miami, FL 1 117,245 February $ 18,825 20% AMB-AMS 2. AMB Golf Distribution Bensenville, IL 1 469,492 March 24,539 39% AMB-SGP 3. AMB JFK Airgate Center Jamaica, NY 4 230,398 March 34,445 50% Total First Quarter Property Acquisitions 6 817,135$ 77,809 (1)39% Weighted Average Stabilized Cap Rate GAAP/Cash7.8%/6.9% Other Acquisitions AMB Property Corporation 1. G.Accion (2)Mexico N/A N/A March $ 46,109 43% Total First Quarter Acquisitions $ 123,918 41% (1) Represents the total expected investment, including closing costs and estimated acquisition capital of $1.0 million. (2) The Company has a 43% unconsolidated equity interest in G.Accion, a Mexican real estate company. G.Accion provides management and development services for industrial, retail, residential and office properties in Mexico. 13 |
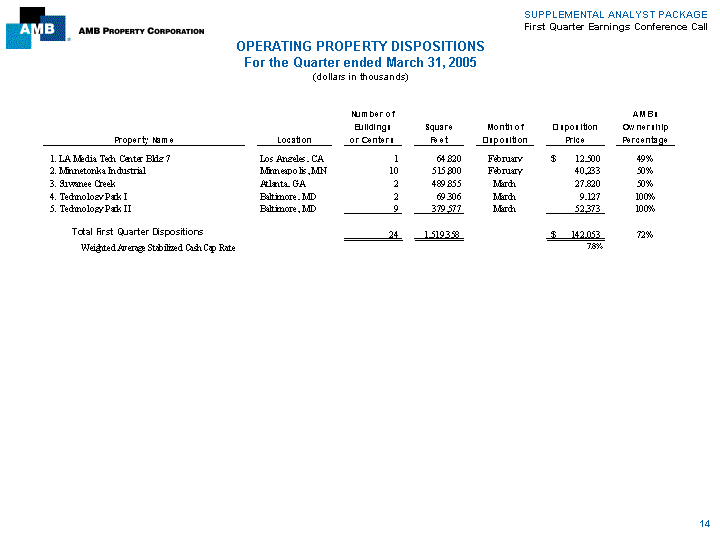
| OPERATING PROPERTY DISPOSITIONS For the Quarter ended March 31, 2005 (dollars in thousands) 14 |
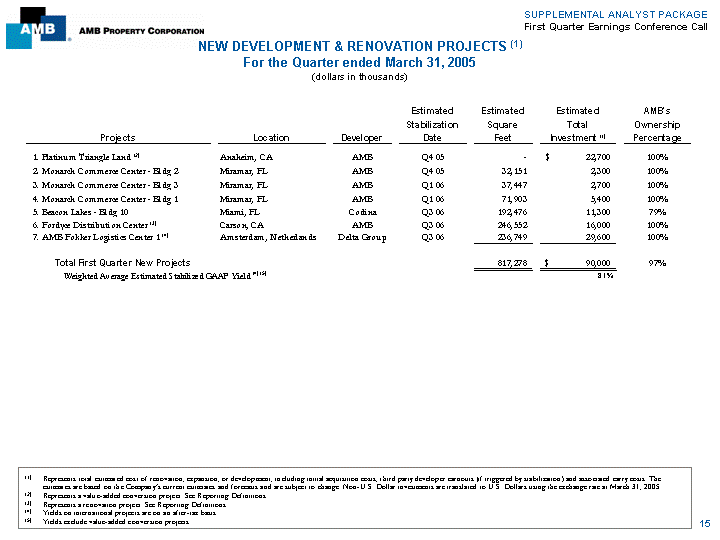
| NEW DEVELOPMENT & RENOVATION PROJECTS (1) For the Quarter ended March 31, 2005 (dollars in thousands) 15 (1) Represents total estimated cost of renovation, expansion, or development, including initial acquisition costs, third party developer earnouts (if triggered by stabilization) and associated carry costs. The estimates are based on the Company's current estimates and forecasts and are subject to change. Non-U.S. Dollar investments are translated to U.S. Dollars using the exchange rate at March 31, 2005. (2) Represents a value-added conversion project. See Reporting Definitions. (3) Represents a renovation project. See Reporting Definitions. (4) Yields on international projects are on an after-tax basis. (5) Yields exclude value-added conversion projects. |
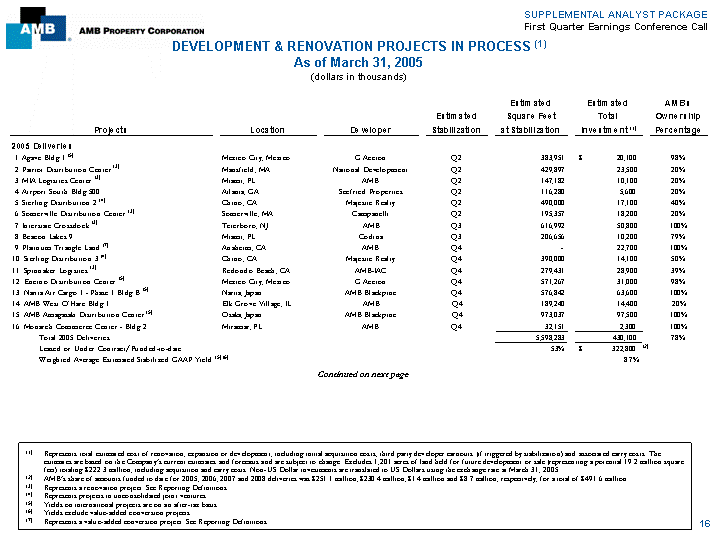
| DEVELOPMENT & RENOVATION PROJECTS IN PROCESS (1) As of March 31, 2005 (dollars in thousands) 16 Continued on next page (1) Represents total estimated cost of renovation, expansion or development, including initial acquisition costs, third party developer earnouts (if triggered by stabilization) and associated carry costs. The estimates are based on the Company's current estimates and forecasts and are subject to change. Excludes 1,201 acres of land held for future development or sale (representing a potential 19.2 million square feet) totaling $222.3 million, including acquisition and carry costs. Non-US Dollar investments are translated to US Dollars using the exchange rate at March 31, 2005. (2) AMB's share of amounts funded to date for 2005, 2006, 2007 and 2008 deliveries was $251.1 million, $230.4 million, $1.4 million and $8.7 million, respectively, for a total of $491.6 million. (3) Represents a renovation project. See Reporting Definitions. (4) Represents projects in unconsolidated joint ventures. (5) Yields on international projects are on an after-tax basis. (6) Yields exclude value-added conversion projects. (7) Represents a value-added conversion project. See Reporting Definitions. |
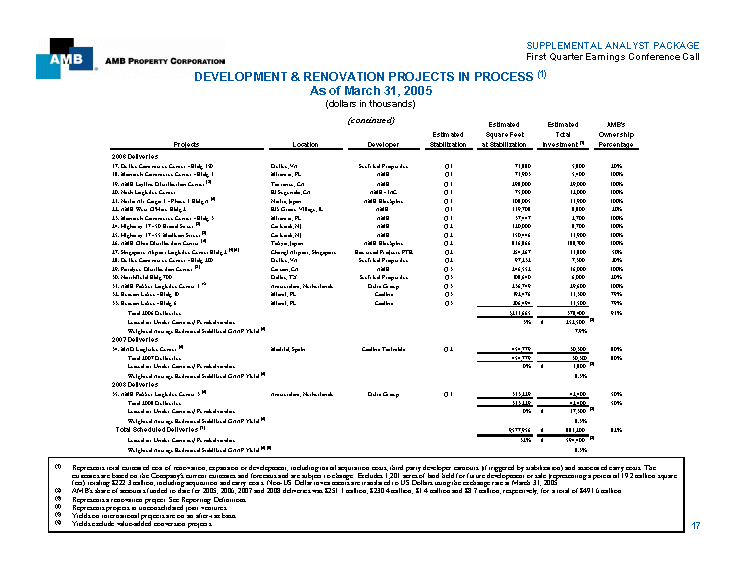
| SUPPLEMENTAL ANALYST PACKAGE First Quarter Earnings Conference Call DEVELOPMENT & RENOVATION PROJECTS IN PROCESS (1) As of March 31, 2005 (dollars in thousands) (continued) EstimatedEstimatedAMB’s EstimatedSquare FeetTotalOwnership ProjectsLocationDeveloper Stabilization at Stabilization Investment (1) Percentage 2006 Deliveries 17. Dulles Commerce Center — Bldg 150 Dulles, VASeefried PropertiesQ171,880 5,800 20% 18. Monarch Commerce Center — Bldg 1 Miramar, FLAMBQ171,903 5,400 100% 19. AMB Layline Distribution Center (3)Torrance, CAAMBQ1298,000 29,000 100% 20. Nash Logistics CenterEl Segundo, CAAMB — IACQ175,000 12,000 100% 21. Narita Air Cargo 1 — Phase 1 Bldg A (5) Narita, JapanAMB BlackpineQ1108,005 11,900 100% 22. AMB West O’Hare Bldg 2 Elk Grove Village, ILAMB Q1119,708 8,800 20% 23. Monarch Comm erce Center — Bldg 3 Miramar, FLAMBQ137,447 2,700 100% 24. Highway 17 — 50 Broad Street (3)Carlstadt, NJAMBQ2120,000 8,700 100% 25. Highway 17 — 55 Madison Street (3)Carlstadt, NJAMBQ2150,446 11,900 100% 26. AMB Ohta Distribution Center (5) Tokyo, JapanAMB BlackpineQ2816,866 188,700 100% 27. Singapore Airport Logistics Center Bldg 2 (4) (5) Changi Airport, SingaporeBoustead Projects PTEQ2254,267 11,800 50% 28. Dulles Commerce Center — Bldg 200Dulles, VASeefried PropertiesQ297,2 32 7,300 20% 29. Fordyce Distribution Center (3)Carson, CAAMBQ3246,552 16,000 100% 30. Northfield Bldg 700Dallas, TXSeefried PropertiesQ3108,640 6,000 20% 31. AMB Fokker Logistics Center 1 (5)Amsterdam, NetherlandsDelta GroupQ3236,749 29,600 100% 32. Beacon Lakes — Bldg 10Miami, FLCodina Q3192,476 11,300 79% 33. Beacon Lakes — Bldg 6Miami, FLCodina Q3206,494 11,500 79% Total 2006 Deliveries3,211,665 378,400 91% Leased or Under Contract/Funded-to-date3% $ 252,500 (2) Weighted Average Estimated Stabilized GAAP Yield (5) 7.9% 2007 Deliveries 34. MAD Logistics Center (5)Madrid, SpainCodina TorimbiaQ2454,779 30,300 80% Total 2007 Deliveries454,77930,30080% Leased or Under Contract/Funded-to-date0% $ 1,800 (2) Weighted Average Estimated Stabilized GAAP Yield (5) 8.3% 2008 Deliveries 35. AMB Fokker Logistics Center 3 (5)Amsterdam, NetherlandsDelta GroupQ1313,229 42,400 50% Total 2008 Deliveries313,229 42,400 50% Leased or Under Contract/Funded-to-date0% $ 17,300 (2) Weighted Average Estimated Stabilized GAAP Yield (5) 8.3% Total Scheduled Deliveries (1)9,577,956 $ 881,200 82% Leased or Under Contract/Funded-to-date32% $ 594,400 (2) Weighted Average Estimated Stabilized GAAP Yield (5) (6)8.3% (1) Represents total estimated cost of renovation, expansion or development, including initial acquisition costs, third party developer earnouts (if triggered by stabilization) and associated carry costs. The estimates are based on the Company’s current estimates and forecasts and are subject to change. Excludes 1,201 acres of land held for future development or sale (representing a potential 19.2 million square feet) totaling $222.3 million, including acquisition and carry costs. Non-US Dollar investments are translated to US Dollars using the exchange rate at March 31, 2005. (2) AMB’s share of amounts funded to date for 2005, 2006, 2007 and 2008 deliveries was $251.1 million, $230.4 million, $1.4 million and $8.7 million, respectively, for a total of $491.6 million. (3) Represents a renovation project. See Reporting Definitions. (4) Represents projects in unconsolidated joint ventures. (5) Yields on international projects are on an after-tax basis. (6) Yields exclude value-added conversion projects.17 |
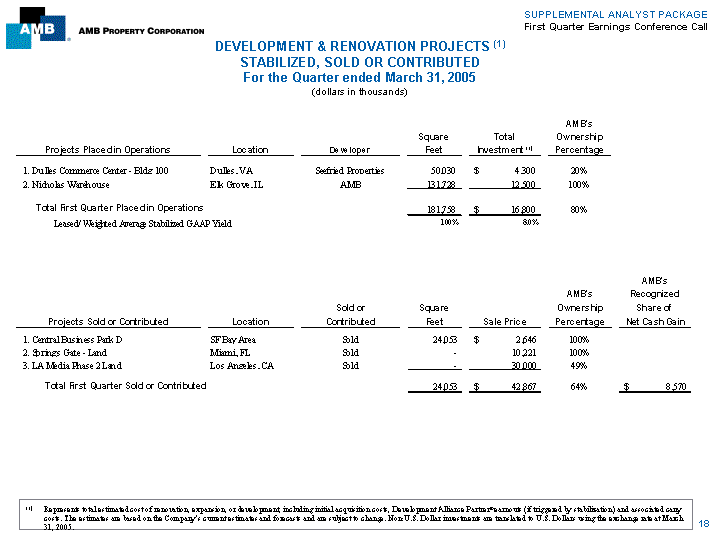
| DEVELOPMENT & RENOVATION PROJECTS (1) STABILIZED, SOLD OR CONTRIBUTED For the Quarter ended March 31, 2005 (dollars in thousands) 18 (1) Represents total estimated cost of renovation, expansion, or development, including initial acquisition costs, Development Alliance Partner(r) earnouts (if triggered by stabilization) and associated carry costs. The estimates are based on the Company's current estimates and forecasts and are subject to change. Non-U.S. Dollar investments are translated to U.S. Dollars using the exchange rate at March 31, 2005. |
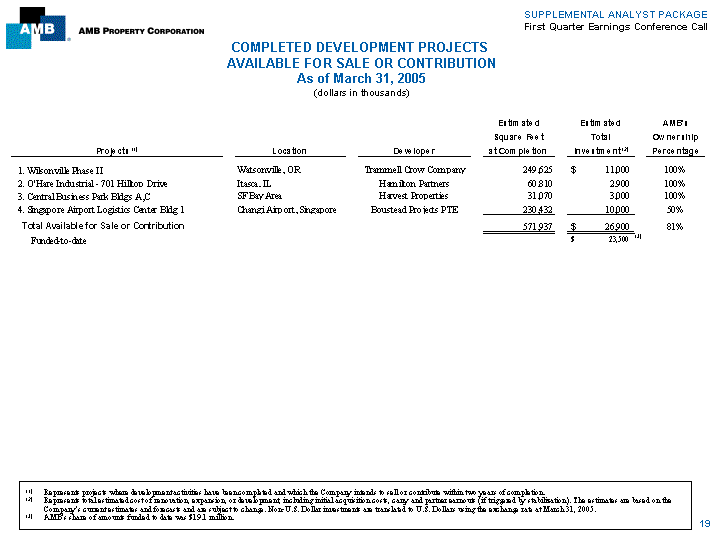
| (1) Represents projects where development activities have been completed and which the Company intends to sell or contribute within two years of completion. (2) Represents total estimated cost of renovation, expansion, or development, including initial acquisition costs, carry and partner earnouts (if triggered by stabilization). The estimates are based on the Company's current estimates and forecasts and are subject to change. Non-U.S. Dollar investments are translated to U.S. Dollars using the exchange rate at March 31, 2005. (3) AMB's share of amounts funded to date was $19.1 million. COMPLETED DEVELOPMENT PROJECTS AVAILABLE FOR SALE OR CONTRIBUTION As of March 31, 2005 (dollars in thousands) 19 |
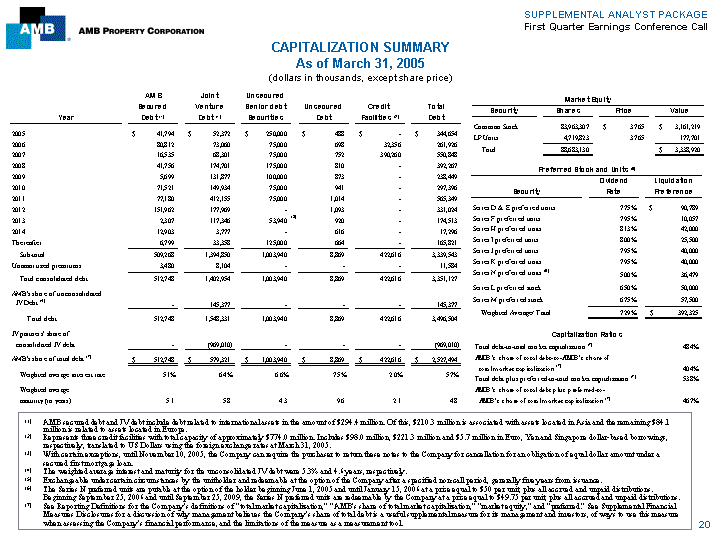
| CAPITALIZATION SUMMARY As of March 31, 2005 (dollars in thousands, except share price) 20 (1) AMB secured debt and JV debt include debt related to international assets in the amount of $294.4 million. Of this, $210.3 million is associated with assets located in Asia and the remaining $84.1 million is related to assets located in Europe. (2) Represents three credit facilities with total capacity of approximately $774.0 million. Includes $98.0 million, $221.3 million and $5.7 million in Euro, Yen and Singapore dollar-based borrowings, respectively, translated to US Dollars using the foreign exchange rates at March 31, 2005. (3) With certain exceptions, until November 10, 2005, the Company can require the purchaser to return these notes to the Company for cancellation for an obligation of equal dollar amount under a secured first mortgage loan. (4) The weighted average interest and maturity for the unconsolidated JV debt were 5.3% and 4.6 years, respectively. (5) Exchangeable under certain circumstances by the unitholder and redeemable at the option of the Company after a specified non-call period, generally five years from issuance. (6) The Series N preferred units are putable at the option of the holder beginning June 1, 2005 and until January 15, 2006 at a price equal to $50 per unit, plus all accrued and unpaid distributions. Beginning September 25, 2006 and until September 25, 2009, the Series N preferred units are redeemable by the Company at a price equal to $49.75 per unit, plus all accrued and unpaid distributions. (7) See Reporting Definitions for the Company's definitions of "total market capitalization," "AMB's share of total market capitalization," "market equity," and "preferred." See Supplemental Financial Measures Disclosures for a discussion of why management believes the Company's share of total debt is a useful supplemental measure for its management and investors, of ways to use this measure when assessing the Company's financial performance, and the limitations of the measure as a measurement tool. |
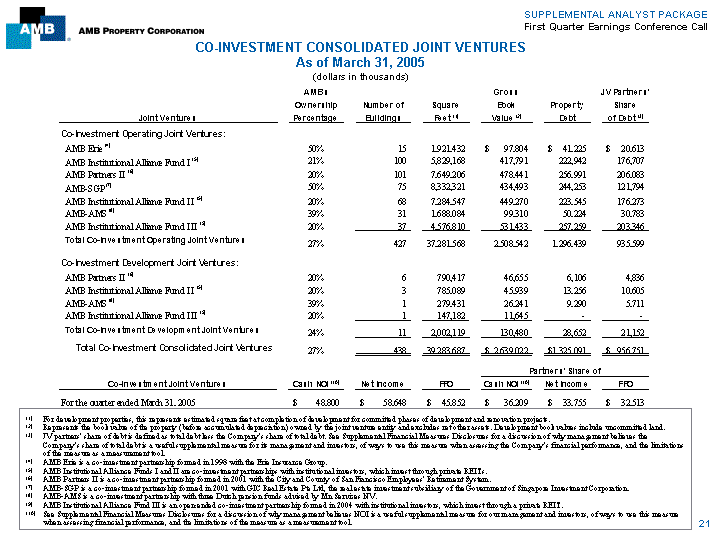
| CO-INVESTMENT CONSOLIDATED JOINT VENTURES As of March 31, 2005 (dollars in thousands) (1) For development properties, this represents estimated square feet at completion of development for committed phases of development and renovation projects. (2) Represents the book value of the property (before accumulated depreciation) owned by the joint venture entity and excludes net other assets. Development book values include uncommitted land. (3) JV partners' share of debt is defined as total debt less the Company's share of total debt. See Supplemental Financial Measures Disclosures for a discussion of why management believes the Company's share of total debt is a useful supplemental measure for its management and investors, of ways to use this measure when assessing the Company's financial performance, and the limitations of the measure as a measurement tool. (4) AMB Erie is a co-investment partnership formed in 1998 with the Erie Insurance Group. (5) AMB Institutional Alliance Funds I and II are co-investment partnerships with institutional investors, which invest through private REITs. (6) AMB Partners II is a co-investment partnership formed in 2001 with the City and County of San Francisco Employees' Retirement System. (7) AMB-SGP is a co-investment partnership formed in 2001 with GIC Real Estate Pte Ltd, the real estate investment subsidiary of the Government of Singapore Investment Corporation. (8) AMB-AMS is a co-investment partnership with three Dutch pension funds advised by Mn Services NV. (9) AMB Institutional Alliance Fund III is an open-ended co-investment partnership formed in 2004 with institutional investors, which invest through a private REIT. (10) See Supplemental Financial Measures Disclosures for a discussion of why management believes NOI is a useful supplemental measure for our management and investors, of ways to use this measure when assessing financial performance, and the limitations of the measure as a measurement tool. 21 |
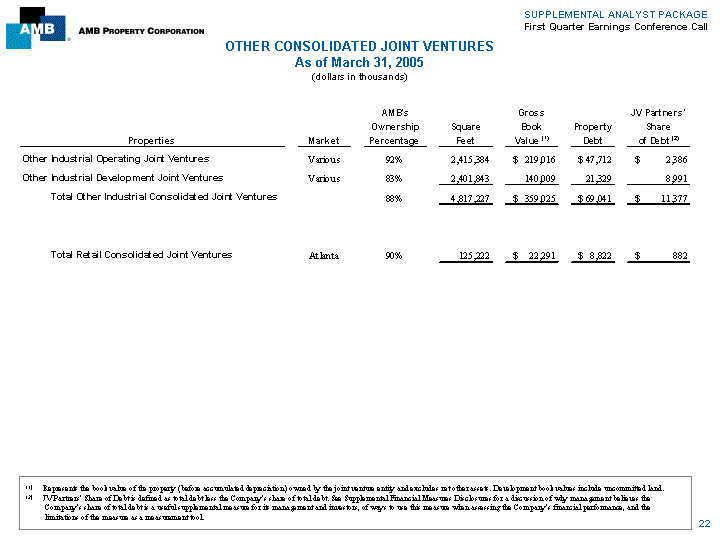
| OTHER CONSOLIDATED JOINT VENTURES As of March 31, 2005 (dollars in thousands) (1) Represents the book value of the property (before accumulated depreciation) owned by the joint venture entity and excludes net other assets. Development book values include uncommitted land. (2) JV Partners' Share of Debt is defined as total debt less the Company's share of total debt. See Supplemental Financial Measures Disclosures for a discussion of why management believes the Company's share of total debt is a useful supplemental measure for its management and investors, of ways to use this measure when assessing the Company's financial performance, and the limitations of the measure as a measurement tool. 22 |
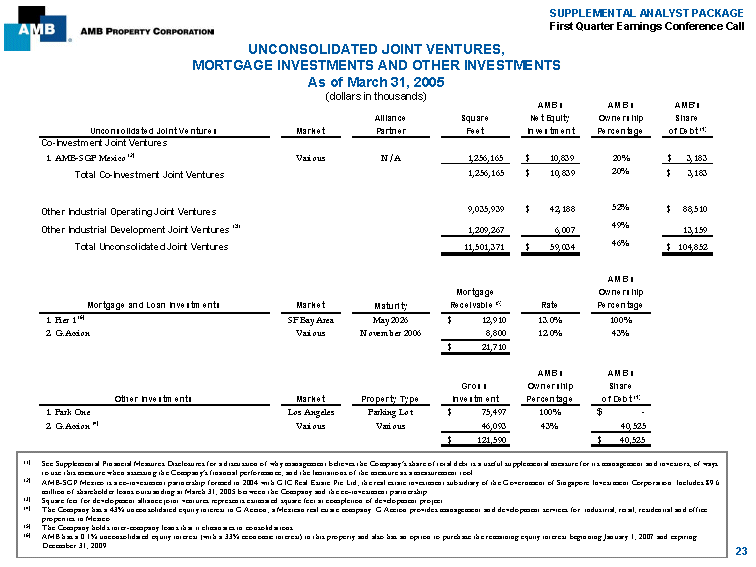
| SUPPLEMENTAL ANALYST PACKAGE First Quarter Earnings Conference Call UNCONSOLIDATED JOINT VENTURES, MORTGAGE INVESTMENTS AND OTHER INVESTMENTS As of March 31, 2005 (dollars in thousands) AMB’s AMB’s AMB’s AllianceSquareNet EquityOwnershipShare Unconsolidated Joint VenturesMarketPartnerFeetInvestmentPercentageof Debt (1) Co-Investment Joint Ventures 1. AMB-SGP Mexico (2)VariousN/A 1,256,165$ 10,83920%$ 3,183 1,256,165 $ 10,839 20% $ 3,183 Total Co-Investment Joint Ventures 9,035,939 $ 42,188 52% $ 88,510 Other Industrial Operating Joint Ventures 49% Other Industrial Development Joint Ventures (3) 1,209,267 6,007 13,159 Total Unconsolidated Joint Ventures 11,501,371 $ 59,034 46% $ 104,852 AMB’s MortgageOwnership Mortgage and Loan InvestmentsMarketMaturityReceivable (5)RatePercentage 1. Pier 1 (6)SF Bay AreaMay 2026 $ 12,910 13.0%100% 2. G.Accion VariousNovember 2006 8,800 12.0%43% $21,710 AMB’sAMB’s GrossOwnershipShare Other InvestmentsMarketProperty TypeInvestmentPercentageof Debt (1) 1. Park OneLos AngelesParking Lot $ 75,497 100%$ — 2. G.Accion (4)VariousVarious 46,093 43% 40,525 $121,590 $ 40,525 (1) See Supplemental Financial Measures Disclosures for a discussion of why management believes the Company’s share of total debt is a useful supplemental measure for its management and investors, of ways to use this measure when assessing the Company’s financial performance, and the limitations of the measure as a measurement tool. (2) AMB-SGP Mexico is a co-investment partnership formed in 2004 with GIC Real Estate Pte Ltd, the real estate investment subsidiary of the Government of Singapore Investment Corporation. Includes $9.6 million of shareholder loans outstanding at March 31, 2005 between the Company and the co-investment partnership. (3) Square feet for development alliance joint ventures represents estimated square feet at completion of development project. (4) The Company has a 43% unconsolidated equity interest in G.Accion, a Mexican real estate company. G.Accion provides management and development services for industrial, retail, residential and office properties in Mexico. (5) The Company holds inter-company loans that it eliminates in consolidations. (6) AMB has a 0.1% unconsolidated equity interest (with a 33% economic interest) in this property and also has an option to purchase the remaining equity interest beginning January 1, 2007 and expiring December 31, 2009. 23 |
| REPORTING DEFINITIONS 24 Acquisition/non-recurring capex includes immediate building improvements that were taken into consideration when underwriting the purchase of a building or which are incurred to bring a building up to "operating standard" or to stabilization. Also includes incremental building improvements and leasing costs that are incurred in an effort to substantially increase the revenue potential of an existing building. AMB's share of total debt-to-AMB's share of total book capitalization is calculated using the following definitions: AMB's share of total debt is the pro rata portion of the total debt based on the Company's percentage of equity interest in each of the consolidated or unconsolidated ventures holding the debt. AMB's share of total book capitalization is defined as the Company's share of total debt plus minority interests to preferred unitholders and limited partnership unitholders plus stockholders' equity. AMB's share of total debt-to-AMB's share of total market capitalization is calculated using the following definitions: AMB's share of total debt is the pro rata portion of the total debt based on the Company's percentage of equity interest in each of the consolidated or unconsolidated ventures holding the debt. The Company's definition of "total market capitalization" is total debt plus preferred equity liquidation preferences plus market equity. The Company's definition of "AMB's share of total market capitalization" is the Company's share of total debt plus preferred equity liquidation preferences plus market equity. The Company's definition of "market equity" is the total number of outstanding shares of the Company's common stock and common limited partnership units multiplied by the closing price per share of its common stock as of March 31, 2005. AMB's share of total market capitalization is defined by the Company as the Company's share of total debt plus preferred equity liquidation preferences plus market equity. Annualized base rent (ABR) is calculated as monthly base rent (cash basis) per the lease, as of a certain date, multiplied by 12. If free rent is granted, then the first positive rent value is used. Completion/Stabilization is generally defined as properties that are 90% leased or properties for which we have held a certificate of occupancy or building has been substantially complete for at least 12 months. Development and renovation GAAP yields are calculated from estimated annual NOI following occupancy stabilization (including straight-line rents) divided by the estimated total investment, including Development Alliance Partner(r) earnouts (if triggered by stabilization) and associated carrying costs. Fixed charge coverage is adjusted EBITDA divided by total interest expense (including capitalized interest) plus preferred dividends and distributions. Interest coverage is adjusted EBITDA divided by total GAAP interest expense. Market equity is defined by the Company as the total number of outstanding shares of the Company's common stock and common limited partnership units multiplied by the closing price per share of its common stock as of March 31, 2005. Occupancy percentage represents the percentage of total rentable square feet owned, which is leased, including month-to-month leases, as of the date reported. Space is considered leased when the tenant has either taken physical or economic occupancy. Percentage pre-leased represents the percentage of signed leases only. Preferred is defined by the Company, with respect to its capitalization ratios, as preferred equity liquidation preferences. Renovation projects represent projects where the acquired buildings are less than 75% leased and require significant capital expenditures (generally more than 10% - 25% of acquisition cost) to bring the buildings up to operating standards and stabilization (generally 90% occupancy). Recurring capital expenditures represents non-incremental building improvements and leasing costs required to maintain current revenues. Recurring capital expenditures do not include acquisition capital that was taken into consideration when underwriting the purchase of a building or which are incurred to bring a building up to "operating standard." Rent increases on renewals and rollovers are calculated as the difference, weighted by square feet, of the net ABR due the first month after a term commencement date and the net ABR due the last month prior to the termination date of the former tenant's term. If free rent is granted, then the first positive full rent value is used as a point of comparison. The rental amounts exclude base stop amounts, holdover rent and premium rent charges. If either the previous or current lease terms are under 12 months, then they are excluded from this calculation. If the lease is the first in the unit (first generation) and there is no prior lease for comparison, then it is excluded from this calculation. Same store NOI growth is the change in the NOI (excluding straight-line rents) of the same store properties from the prior year reporting period to the current year reporting period. Same store properties include all properties that were owned as of the end of both the current and prior year reporting periods and excludes development properties for both the current and prior reporting periods. The same store pool is set annually and excludes properties purchased and developments stabilized after December 31, 2003. Same store pool includes Park One parking lot in Los Angeles, California. Second generation TIs and LCs per square foot are total tenant improvements, lease commissions and other leasing costs incurred during leasing of second generation space divided by the total square feet leased. Costs incurred prior to leasing available space are not included until such space is leased. Second generation space excludes newly developed square footage or square footage vacant at acquisition. Square feet owned represents 100% of the square footage of properties either owned directly by the Company or which the Company has a controlling interest in (e.g. consolidated joint ventures) and excludes square footage of development properties prior to completion. Stabilized GAAP cap rates rates are calculated as NOI, including straight-line rents, stabilized to market occupancy (generally 95%) divided by total acquisition cost. The total acquisition cost basis includes the initial purchase price, the effects of marking assumed debt to market, all due diligence and closing costs, SFAS 141 adjustments, planned immediate capital expenditures, leasing costs necessary to achieve stabilization and, if applicable, any estimated costs required to buy-out AMB's joint venture partners. Tenant retention is the square footage of all leases renewed by existing tenants divided by the square footage of all expiring and renewed leases during the reporting period, excluding the square footage of tenants that default or buy-out prior to expiration of their lease, short-term tenants and the square footage of month-to-month leases. Total market capitalization is defined by the Company as total debt plus preferred equity liquidation preferences plus market equity. Value-added conversion project represents the repurposing of land or a building site for more valuable uses and may include such activities as rezoning, redesigning, reconstructing and retenanting. |
| SUPPLEMENTAL FINANCIAL MEASURES DISCLOSURES Adjusted EBITDA. The Company uses adjusted earnings before interest, tax, depreciation and amortization, or adjusted EBITDA, to measure both its operating performance and liquidity. The Company considers adjusted EBITDA to provide investors relevant and useful information because it permits fixed income investors to view income from its operations on an unleveraged basis before the effects of non-cash depreciation and amortization expense. By excluding interest expense, adjusted EBITDA allows investors to measure the Company's operating performance independent of its capital structure and indebtedness and, therefore, allows for a more meaningful comparison of its operating performance between quarters as well as annual periods and to compare its operating performance to that of other companies, both in the real estate industry and in other industries. The Company considers adjusted EBITDA to be a useful supplemental measure for reviewing its comparative performance with other companies because, by excluding non-cash depreciation expense, adjusted EBITDA can help the investing public compare the performance of a real estate company to that of companies in other industries. As a liquidity measure, the Company believes that adjusted EBITDA helps fixed income and equity investors to analyze its ability to meet debt service obligations and to make quarterly preferred share and unit distributions. Management uses adjusted EBITDA in the same manner as the Company expects investors to when measuring the Company's operating performance and liquidity; specifically when assessing its operating performance, and comparing that performance to other companies, both in the real estate industry and in other industries, and when evaluating its ability to meet debt service obligations and to make quarterly preferred share and unit distributions. The Company believes investors should consider adjusted EBITDA, in conjunction with net income (the primary measure of the Company's performance) and the other required GAAP measures of its performance and liquidity, to improve their understanding of the Company's operating results and liquidity, and to make more meaningful comparisons of the performance of its assets between periods and as against other companies. By excluding interest, taxes, depreciation and amortization when assessing the Company's financial performance, an investor is assessing the earnings generated by the Company's operations, but not taking into account the eliminated expenses incurred in connection with such operations. As a result, adjusted EBITDA has limitations as an analytical tool and should be used in conjunction with the Company's required GAAP presentations. Adjusted EBITDA does not reflect the Company's historical cash expenditures or future cash requirements for working capital, capital expenditures or contractual commitments. Adjusted EBITDA also does not reflect the cash required to make interest and principal payments on the Company's outstanding debt. While adjusted EBITDA is a relevant and widely used measure of operating performance and liquidity, it does not represent net income or cash flow from operations as defined by GAAP and it should not be considered as an alternative to those indicators in evaluating operating performance or liquidity. Further, the Company's computation of adjusted EBITDA may not be comparable to EBITDA reported by other companies. Company's share of total debt. The Company's share of total debt is the pro rata portion of the total debt based on its percentage of equity interest in each of the consolidated or unconsolidated ventures holding the debt. The Company believes that its share of total debt is a meaningful supplemental measure, which enables both management and investors to analyze its leverage and to compare its leverage to that of other companies. In addition, it allows for a more meaningful comparison of its debt to that of other companies that do not consolidate their joint ventures. The Company's share of total debt is not intended to reflect its actual liability should there be a default under any or all of such loans or a liquidation of the joint ventures. Interest coverage. The Company uses interest coverage to measure its liquidity. The Company considers interest coverage to provide investors relevant and useful information because it permits fixed income investors to measure the Company's ability to meet its interest payments on outstanding debt. The Company's computation of interest coverage may not be comparable to interest coverage reported by other companies. Fixed charge coverage. The Company uses fixed charge coverage to measure its liquidity. The Company considers fixed charge coverage to provide investors relevant and useful information because it permits fixed income investors to measure the Company's ability to meet its interest payments on outstanding debt, make distributions to its preferred unitholders and pay dividends to its preferred shareholders. The Company's computation of fixed charge coverage may not be comparable to fixed charge coverage reported by other companies. Funds From Operations ("FFO"). The Company believes that net income, as defined by GAAP, is the most appropriate earnings measure. However, the Company considers funds from operations, or FFO, as defined by NAREIT, to be a useful supplemental measure of its operating performance. FFO is defined as net income, calculated in accordance with GAAP, less gains (or losses) from dispositions of real estate held for investment purposes and real estate-related depreciation, and adjustments to derive the Company's pro rata share of FFO of consolidated and unconsolidated joint ventures. Further, the Company does not adjust FFO to eliminate the effects of non-recurring charges. The Company believes that FFO, as defined by NAREIT, is a meaningful supplemental measure of its operating performance because historical cost accounting for real estate assets in accordance with GAAP implicitly assumes that the value of real estate assets diminishes predictably over time, as reflected through depreciation and amortization expenses. However, since real estate values have historically risen or fallen with market and other conditions, many industry investors and analysts have considered presentation of operating results for real estate companies that use historical cost accounting to be insufficient. Thus, NAREIT created FFO as a supplemental measure of operating performance for real estate investment trusts that excludes historical cost depreciation and amortization, among other items, from net income, as defined by GAAP. The Company believes that the use of FFO, combined with the required GAAP presentations, has been beneficial in improving the understanding of operating results of real estate investment trusts among the investing public and making comparisons of operating results among such companies more meaningful. The Company considers FFO to be a useful measure for reviewing comparative operating and financial performance because, by excluding gains or losses related to sales of previously depreciated operating real estate assets and real estate depreciation and amortization, FFO can help the investing public compare the operating performance of a company's real estate between periods or as compared to other companies. While FFO is a relevant and widely used measure of operating performance of real estate investment trusts, it does not represent cash flow from operations or net income as defined by GAAP and should not be considered as an alternative to those measures in evaluating the Company's liquidity or operating performance. FFO also does not consider the costs associated with capital expenditures related to the Company's real estate assets nor is FFO necessarily indicative of cash available to fund the Company's future cash requirements. Further, the Company's computation of FFO may not be comparable to FFO reported by other real estate investment trusts that do not define the term in accordance with the current NAREIT definition or that interpret the current NAREIT definition differently than the Company does. Net Operating Income ("NOI"). Net operating income is defined as rental revenue, including reimbursements, less property operating expenses, which excludes depreciation, amortization, general and administrative expenses and interest expense. The Company considers NOI to be an appropriate supplemental performance measure because NOI reflects the operating performance of the real estate portfolio. However, NOI should not be viewed as an alternative measure of financial performance since it does not reflect general and administrative expenses, interest expense, depreciation and amortization costs, capital expenditures and leasing costs, or trends in development and construction activities that could materially impact results from operations. Further, NOI may not be comparable to that of other real estate investment trusts, as they may use different methodologies for calculating NOI. 25 |
| AMB PROPERTY CORPORATION CONTACTS 26 |
| Some of the information included in this supplemental analyst package and the conference call to be held in connection therewith contains forward- looking statements, such as those related to development and renovation projects (including stabilization dates, square feet at stabilization or completion, and total investment amounts), lease expirations and future business plans (such as property divestitures and financings), which are made pursuant to the safe-harbor provisions of Section 21E of the Securities Exchange Act of 1934, as amended, and Section 27A of the Securities Act of 1933, as amended. Because these forward-looking statements involve risks and uncertainties, there are important factors that could cause our actual results to differ materially from those in the forward-looking statements, and you should not rely on the forward-looking statements as predictions of future events. The events or circumstances reflected in forward-looking statements might not occur. You can identify forward-looking statements by the use of forward-looking terminology such as "believes," "expects," "may," "will," "should," "seeks," "approximately," "intends," "plans," "pro forma," "estimates" or "anticipates" or the negative of these words and phrases or similar words or phrases. You can also identify forward-looking statements by discussions of strategy, plans or intentions. Forward-looking statements are necessarily dependent on assumptions, data or methods that may be incorrect or imprecise and we may not be able to realize them. We caution you not to place undue reliance on forward-looking statements, which reflect our analysis only and speak only as of the date of this report or the dates indicated in the statements. We assume no obligation to update or supplement forward-looking statements. The following factors, among others, could cause actual results and future events to differ materially from those set forth or contemplated in the forward-looking statements: defaults on or non-renewal of leases by tenants, increased interest rates and operating costs, our failure to obtain necessary outside financing, difficulties in identifying properties to acquire and in effecting acquisitions, our failure to successfully integrate acquired properties and operations, our failure to divest properties we have contracted to sell or to timely reinvest proceeds from any divestitures, risks and uncertainties affecting property development and construction (including construction delays, cost overruns, our inability to obtain necessary permits and public opposition to these activities), our failure to qualify and maintain our status as a real estate investment trust, environmental uncertainties, risks related to natural disasters, financial market fluctuations, changes in real estate and zoning laws, risks related to doing business internationally and increases in real property tax rates. Our success also depends upon economic trends generally, including interest rates, income tax laws, governmental regulation, legislation, population changes and certain other matters discussed under the heading "Management's Discussion and Analysis of Financial Condition and Results of Operations--Business Risks" and elsewhere in our annual report on Form 10-K for the year ended December 31, 2004. |