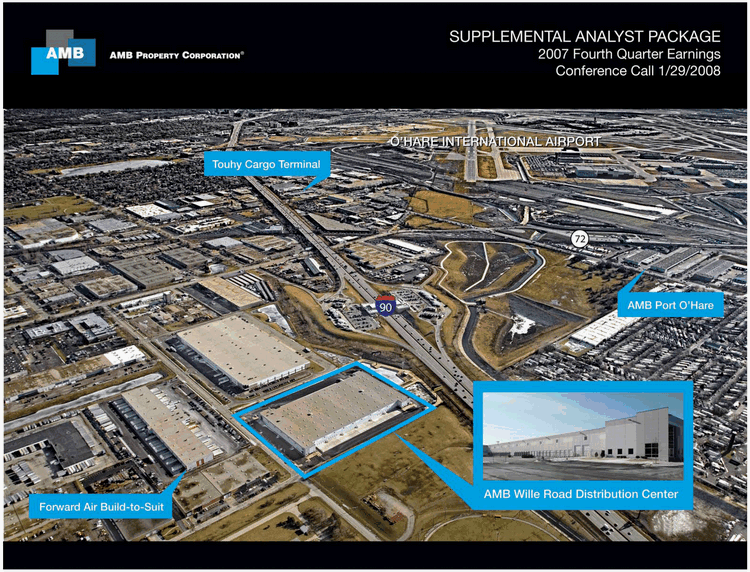
| AMB PROPERTY CORPORATION SUPPLEMENTAL ANALYST PACKAGE 2007 Fourth Quarter Earnings Conference Call 1/29/2008 O’HARE INTERNATIONAL AIRPORT Touhy Cargo Terminal AMB Port O’Hare Forward Air Build-to-Suit AMB Wille Road Distribution Center |
| AMB PROPERTY CORPORATION SUPPLEMENTAL ANALYST PACKAGE 2007 Fourth Quarter Earnings Conference Call 1/29/2008 O’HARE INTERNATIONAL AIRPORT Touhy Cargo Terminal AMB Port O’Hare Forward Air Build-to-Suit AMB Wille Road Distribution Center |

|
Company Profile |
SUPPLEMENTAL ANALYST PACKAGE 2007 Fourth Quarter Earnings Conference Call |
||
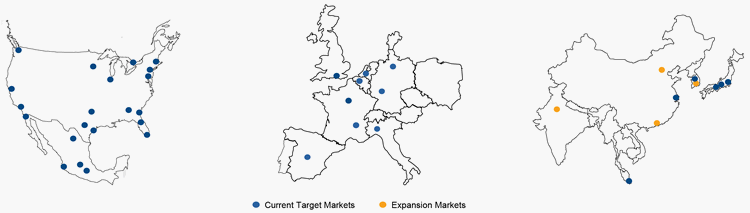
The Americas |
Europe |
Asia |
||||||||||
Operating Portfolio
|
109.1 msf | Operating Portfolio | 8.5 msf | Operating Portfolio | 8.1 msf | |||||||
Development Pipeline(1)
|
13.8 msf | Development Pipeline(1) | 3.1 msf | Development Pipeline(1) | 5.1 msf | |||||||
Land Inventory
|
2,296 acres | Land Inventory | 199 acres | Land Inventory | 40 acres | |||||||
Offices
|
11 | Offices | 3 | Offices | 10 | |||||||
| (1) | Includes development properties available for sale or contribution. |
| Overview | Financial Results | Operations | Capital Deployment | Private Capital | Capitalization | NAV | Reporting Definitions | 1 |
|
|
Highlights (dollars in thousands, except share data) |
SUPPLEMENTAL ANALYST PACKAGE 2007 Fourth Quarter Earnings Conference Call |
||
| For the Quarters ended December 31, | For the Years ended December 31, | |||||||||||||||||||||||
| 2007 | 2006 | % Change | 2007 | 2006 | % Change | |||||||||||||||||||
Revenues |
$ | 171,569 | $ | 185,439 | (7.5 | %) | $ | 669,671 | $ | 711,321 | (1) | (5.9 | %) | |||||||||||
Adjusted EBITDA(2) |
155,588 | 142,594 | 9.1 | % | 502,374 | 471,210 | 6.6 | % | ||||||||||||||||
Net income available to common stockholders |
93,249 | 83,738 | 11.4 | % | 295,524 | 209,420 | 41.1 | % | ||||||||||||||||
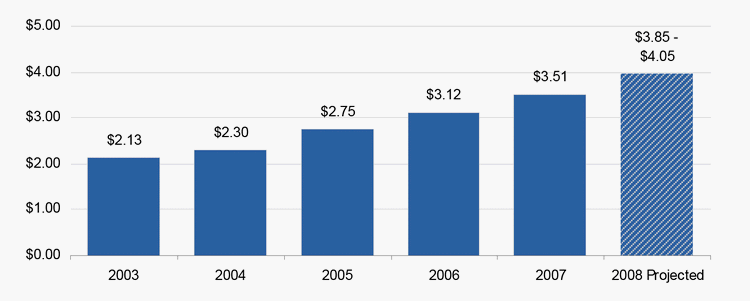
FFO(2) |
125,910 | 98,532 | 27.8 | % | 365,492 | 297,912 | 22.7 | % | ||||||||||||||||
Per diluted share and unit |
||||||||||||||||||||||||
EPS |
$ | 0.92 | $ | 0.91 | 1.1 | % | $ | 2.96 | $ | 2.30 | 28.7 | % | ||||||||||||
FFO(2) |
1.20 | 1.01 | 18.8 | % | 3.51 | 3.12 | 12.5 | % | ||||||||||||||||
Dividends per common share |
0.50 | 0.46 | 8.7 | % | 2.00 | 1.84 | 8.7 | % | ||||||||||||||||
Financial
|
||||
| • | 12.5% year-over-year FFO per share growth(2) | |||
| • | 28.7% year-over-year EPS per share growth | |||
| • | Strong balance sheet with over $1.0 billion potential capacity from lines of credit | |||
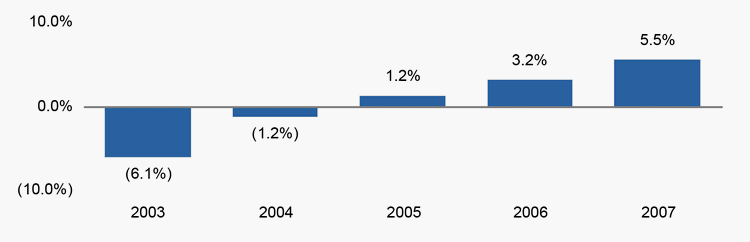
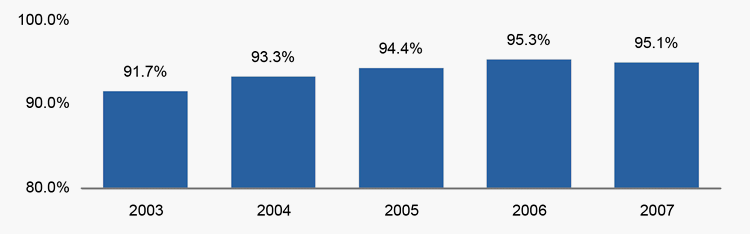
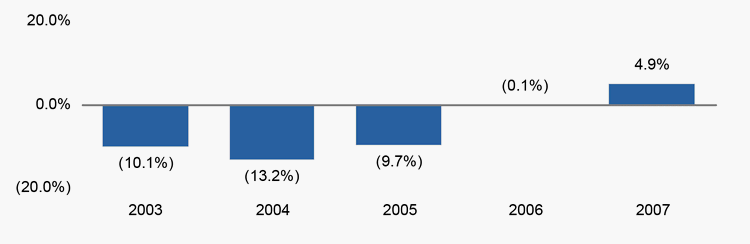
Operations(3)
|
• | 5.5% annual Same Store NOI growth(2)(4); 4.8% in the fourth quarter, up for the ninth consecutive quarter | ||
| • | 95.6% average annual occupancy; year end occupancy 96.0% | |||
| • | Rent changes on renewals and rollover increased 4.9% for 2007 and 4.3% in the fourth quarter marking six consecutive quarters of rent increases | |||
Capital Deployment(3)
|
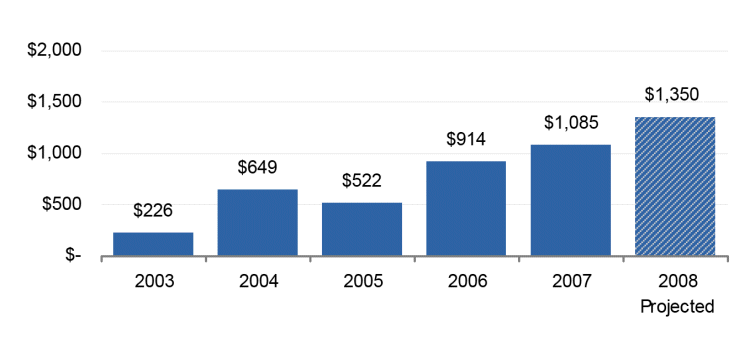
• | Acquired over $1.0 billion of properties in 2007 | ||
| • | Commenced approximately $1.1 billion of development in 2007 | |||
| • | Development pipeline is a record $1.7 billion with an estimated margin of 20% and 2008 deliveries 40% pre-leased | |||
Private Capital
|
• | Ten active co-investment ventures | ||
| • | Added over $2.0 billion in properties in 2007 | |||
| • | Raised over $600 million in third party equity in 2007 | |||
| (1) | Effective October 1, 2006, AMB deconsolidated AMB Alliance Fund III on a prospective basis. Pro forma revenues for the year ended December 31, 2006 would have been $631,161 if AMB Institutional Alliance Fund III had been deconsolidated as of January 1, 2006. | |
| (2) | See reporting definitions and supplemental financial measures disclosures. | |
| (3) | Owned and managed portfolio. | |
| (4) | Without lease termination fees. |
| Overview | Financial Results | Operations | Capital Deployment | Private Capital | Capitalization | NAV | Reporting Definitions | 2 |
|
|
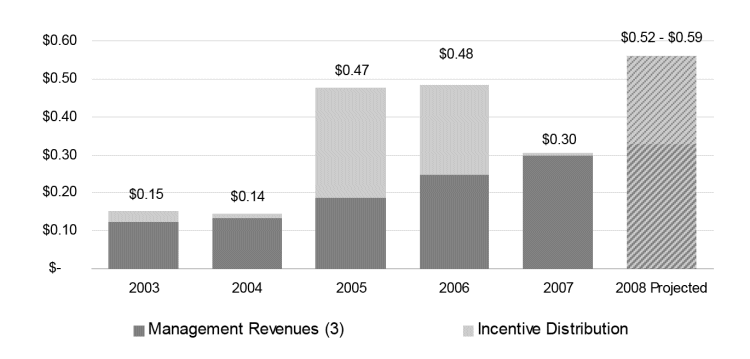
Funds From Operations(1) Overview |
SUPPLEMENTAL ANALYST PACKAGE 2007 Fourth Quarter Earnings Conference Call |
||
| For the Years ended December 31, | 2008 Projected | |||||||||||
| 2006 | 2007 | (Midpoint) | ||||||||||
Real estate operations FFO |
$ | 1.80 | $ | 2.05 | $ | 2.04 | ||||||
% of reported FFO |
57.7 | % | 58.3 | % | 51.7 | % | ||||||
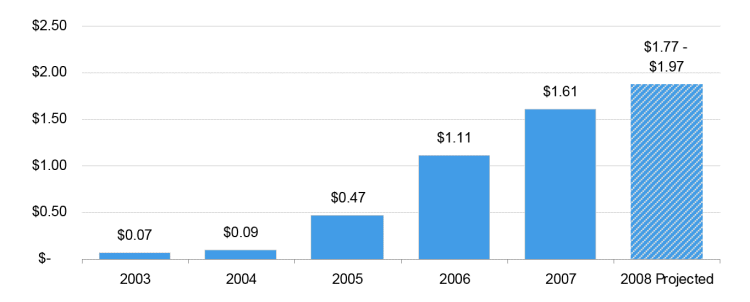
Development FFO |
$ | 0.98 | $ | 1.29 | $ | 1.49 | ||||||
% of reported FFO |
31.4 | % | 36.7 | % | 37.7 | % | ||||||
Private Capital FFO |
$ | 0.34 | $ | 0.17 | $ | 0.42 | ||||||
% of reported FFO |
10.9 | % | 5.0 | % | 10.6 | % | ||||||
Total FFO |
$ | 3.12 | $ | 3.51 | $ | 3.95 | ||||||
| (1) | See reporting definitions and supplemental financial measures disclosures. | |
| (2) | For a reconciliation of FFO from net income for the years ended December 31, 2005, 2004 and 2003, refer to our annual report on Form 10-K for the year ended December 31, 2006, as amended. | |
| (3) | Management revenues consist of asset management, acquisition and development fees as well as priority distributions. | |
| (4) | Excludes co-investment venture partners’ share of development gains. |
| Overview | Financial Results | Operations | Capital Deployment | Private Capital | Capitalization | NAV | Reporting Definitions | 3 |
|
|
Consolidated
Statements of Operations(1) (in thousands, except per share data) |
SUPPLEMENTAL ANALYST PACKAGE 2007 Fourth Quarter Earnings Conference Call |
||
| For the Quarters ended December 31, | For the Years ended December 31, | |||||||||||||||
| 2007 | 2006 | 2007 | 2006 | |||||||||||||
Revenues |
||||||||||||||||
Rental revenues(1) |
$ | 161,869 | $ | 156,876 | $ | 637,964 | $ | 665,219 | ||||||||
Private capital revenues |
9,700 | 28,563 | 31,707 | 46,102 | ||||||||||||
Total revenues |
171,569 | 185,439 | 669,671 | 711,321 | ||||||||||||
Costs and expenses |
||||||||||||||||
Property operating costs(1) |
(44,887 | ) | (42,064 | ) | (174,065 | ) | (173,047 | ) | ||||||||
Depreciation and amortization |
(40,093 | ) | (42,079 | ) | (161,925 | ) | (174,721 | ) | ||||||||
General and administrative |
(34,251 | ) | (30,431 | ) | (129,510 | ) | (104,069 | ) | ||||||||
Fund costs |
(297 | ) | (503 | ) | (1,076 | ) | (2,091 | ) | ||||||||
Impairment losses |
(900 | ) | (918 | ) | (1,157 | ) | (6,312 | ) | ||||||||
Other expenses |
(2,117 | ) | (1,486 | ) | (5,112 | ) | (2,620 | ) | ||||||||
Total costs and expenses |
(122,545 | ) | (117,481 | ) | (472,845 | ) | (462,860 | ) | ||||||||
Other income and expenses |
||||||||||||||||
Development gains, net of taxes |
34,802 | 36,500 | 124,288 | 106,389 | ||||||||||||
(Losses) gains from sale or contribution of real estate interests, net |
(1,407 | ) | — | 73,436 | — | |||||||||||
Equity in earnings of unconsolidated co-investment ventures |
181 | 10,635 | 7,467 | 23,240 | ||||||||||||
Other income |
2,318 | 3,133 | 22,331 | 11,849 | ||||||||||||
Interest expense, including amortization |
(30,551 | ) | (37,600 | ) | (126,945 | ) | (165,087 | ) | ||||||||
Total other income and expenses |
5,343 | 12,668 | 100,577 | (23,609 | ) | |||||||||||
Income from operations before minority interests |
54,367 | 80,626 | 297,403 | 224,852 | ||||||||||||
Minority interests’ share of income |
||||||||||||||||
Co-investment venture partners’ share of income |
(6,599 | ) | (7,878 | ) | (27,748 | ) | (37,190 | ) | ||||||||
Co-investment venture partners’ and limited partnership unitholders’ share of development gains |
(8,835 | ) | (2,843 | ) | (13,934 | ) | (5,613 | ) | ||||||||
Preferred unitholders |
(1,432 | ) | (3,646 | ) | (8,042 | ) | (16,462 | ) | ||||||||
Limited partnership unitholders |
(33 | ) | (1,434 | ) | (5,121 | ) | (2,367 | ) | ||||||||
Total minority interests’ share of income |
(16,899 | ) | (15,801 | ) | (54,845 | ) | (61,632 | ) | ||||||||
Income from continuing operations |
37,468 | 64,825 | 242,558 | 163,220 | ||||||||||||
Discontinued operations |
||||||||||||||||
Income attributable to discontinued operations, net of minority interests |
2,049 | 4,618 | 9,689 | 18,217 | ||||||||||||
Development gains, net of taxes and minority interests |
49,905 | — | 49,905 | — | ||||||||||||
Gains from disposition of real estate, net of minority interests |
7,777 | 18,312 | 12,108 | 42,635 | ||||||||||||
Total discontinued operations |
59,731 | 22,930 | 71,702 | 60,852 | ||||||||||||
Net income |
97,199 | 87,755 | 314,260 | 224,072 | ||||||||||||
Preferred stock dividends |
(3,950 | ) | (3,951 | ) | (15,806 | ) | (13,582 | ) | ||||||||
Preferred unit redemption (issuance costs) discount |
— | (66 | ) | (2,930 | ) | (1,070 | ) | |||||||||
Net income available to common stockholders |
$ | 93,249 | $ | 83,738 | $ | 295,524 | $ | 209,420 | ||||||||
Net income per common share (diluted) |
$ | 0.92 | $ | 0.91 | $ | 2.96 | $ | 2.30 | ||||||||
Weighted average common shares (diluted) |
101,121 | 92,252 | 99,809 | 91,107 | ||||||||||||
| (1) | Effective October 1, 2006, AMB deconsolidated AMB Alliance Fund III (Fund III) on a prospective basis. Pro forma rental revenues and operating expense for the year ended December 31, 2006 would have been $585,059 and $154,368, respectively, if Fund III had been deconsolidated as of January 1, 2006. |
| Overview | Financial Results | Operations | Capital Deployment | Private Capital | Capitalization | NAV | Reporting Definitions | 4 |
|
|
Consolidated Statements of Funds from Operations(1) (in thousands, except per share data) |
SUPPLEMENTAL ANALYST PACKAGE 2007 Fourth Quarter Earnings Conference Call |
||
| For the Quarters ended December 31, | For the Years ended December 31, | |||||||||||||||
| 2007 | 2006 | 2007 | 2006 | |||||||||||||
Net income available to common stockholders |
$ | 93,249 | $ | 83,738 | $ | 295,524 | $ | 209,420 | ||||||||
Gains from sale or contribution of real estate, net of minority interests |
(6,370 | ) | (18,312 | ) | (85,544 | ) | (42,635 | ) | ||||||||
Depreciation and amortization |
||||||||||||||||
Total depreciation and amortization |
40,093 | 42,079 | 161,925 | 174,721 | ||||||||||||
Discontinued operations’ depreciation |
139 | 1,468 | 1,801 | 5,256 | ||||||||||||
Non-real estate depreciation |
(1,658 | ) | (1,477 | ) | (5,623 | ) | (4,546 | ) | ||||||||
Adjustments to derive FFO from consolidated co-investment ventures |
||||||||||||||||
Co-investment venture partners’ minority interests (Net income) |
6,599 | 7,878 | 27,748 | 37,190 | ||||||||||||
Limited partnership unitholders’ minority interests (Net income) |
33 | 1,434 | 5,121 | 2,367 | ||||||||||||
Limited partnership unitholders’ minority interests (Development profits) |
3,384 | 1,653 | 7,148 | 4,948 | ||||||||||||
Discontinued operations’ minority interests (Net income) |
94 | 210 | 370 | 1,254 | ||||||||||||
FFO attributable to minority interests |
(15,555 | ) | (16,207 | ) | (62,902 | ) | (82,861 | ) | ||||||||
Adjustments to derive FFO from unconsolidated co-investment ventures |
||||||||||||||||
AMB’s share of net income |
(181 | ) | (10,635 | ) | (7,467 | ) | (23,240 | ) | ||||||||
AMB’s share of FFO |
6,083 | 6,703 | 27,391 | 16,038 | ||||||||||||
Funds from operations |
$ | 125,910 | $ | 98,532 | $ | 365,492 | $ | 297,912 | ||||||||
FFO per common share and unit (diluted) |
$ | 1.20 | $ | 1.01 | $ | 3.51 | $ | 3.12 | ||||||||
Weighted average common share and unit (diluted) |
105,130 | 97,088 | 104,169 | 95,444 | ||||||||||||
| (1) | See reporting definitions and supplemental financial measures disclosures. |
| Overview | Financial Results | Operations | Capital Deployment | Private Capital | Capitalization | NAV | Reporting Definitions | 5 |
|
|
Consolidated Balance Sheets (dollars in thousands) |
SUPPLEMENTAL ANALYST PACKAGE 2007 Fourth Quarter Earnings Conference Call |
||
| As of | ||||||||
| December 31, 2007 | December 31, 2006 | |||||||
Assets |
||||||||
Investments in real estate |
||||||||
Total investments in properties |
$ | 6,709,545 | $ | 6,575,733 | ||||
Accumulated depreciation |
(916,686 | ) | (789,693 | ) | ||||
Net investments in properties |
5,792,859 | 5,786,040 | ||||||
Investments in unconsolidated co-investment ventures |
356,194 | 274,381 | ||||||
Properties held for contribution, net |
488,339 | 154,036 | ||||||
Properties held for divestiture, net |
40,513 | 20,916 | ||||||
Net investments in real estate |
6,677,905 | 6,235,373 | ||||||
Cash and cash equivalents and restricted cash |
250,416 | 195,878 | ||||||
Accounts receivable, net |
184,270 | 133,998 | ||||||
Other assets |
149,812 | 148,263 | ||||||
Total assets |
$ | 7,262,403 | $ | 6,713,512 | ||||
Liabilities and stockholders’ equity |
||||||||
Secured debt |
$ | 1,471,087 | $ | 1,395,354 | ||||
Unsecured senior debt |
1,003,123 | 1,101,874 | ||||||
Unsecured credit facilities |
876,105 | 852,033 | ||||||
Other debt |
144,529 | 88,154 | ||||||
Accounts payable and other liabilities |
306,196 | 271,880 | ||||||
Total liabilities |
3,801,040 | 3,709,295 | ||||||
Minority interests |
||||||||
Co-investment venture partners |
517,572 | 555,201 | ||||||
Preferred unitholders |
77,561 | 180,298 | ||||||
Limited partnership unitholders |
102,278 | 102,061 | ||||||
Total minority interests |
697,411 | 837,560 | ||||||
Stockholders’ equity |
||||||||
Common equity |
2,540,540 | 1,943,240 | ||||||
Preferred equity |
223,412 | 223,417 | ||||||
Total stockholders’ equity |
2,763,952 | 2,166,657 | ||||||
Total liabilities and stockholders’ equity |
$ | 7,262,403 | $ | 6,713,512 | ||||
| Overview | Financial Results | Operations | Capital Deployment | Private Capital | Capitalization | NAV | Reporting Definitions | 6 |
|
|
Operations Overview(1) (dollars in thousands) |
SUPPLEMENTAL ANALYST PACKAGE 2007 Fourth Quarter Earnings Conference Call |
||
| Square | ||||||||||||||||
| Customer | Feet | ABR | % of ABR | |||||||||||||
| 1 | Deutsche Post World Net (DHL) |
3,545,830 | $ | 27,489 | 3.5 | % | ||||||||||
| 2 | United States Government |
1,392,586 | 20,483 | 2.6 | % | |||||||||||
| 3 | FedEx Corporation |
1,517,523 | 15,589 | 2.0 | % | |||||||||||
| 4 | Nippon Express |
967,039 | 10,111 | 1.3 | % | |||||||||||
| 5 | BAX Global Inc/Schenker/Deutsche Bahn |
904,210 | 9,908 | 1.3 | % | |||||||||||
| 6 | Sagaw a Express |
729,141 | 9,694 | 1.2 | % | |||||||||||
| 7 | La Poste |
902,391 | 8,014 | 1.0 | % | |||||||||||
| 8 | Caterpillar Inc |
668,297 | 6,908 | 0.9 | % | |||||||||||
| 9 | Panalpina |
1,016,825 | 6,706 | 0.9 | % | |||||||||||
| 10 | Expeditors International |
1,238,693 | 6,192 | 0.8 | % | |||||||||||
Subtotal |
12,882,535 | $ | 121,094 | 15.5 | % | |||||||||||
Top 11-20 Customers |
6,115,538 | 44,400 | 5.7 | % | ||||||||||||
Total |
18,998,073 | $ | 165,494 | 21.2 | % | |||||||||||
| (1) | Owned and managed portfolio. | |
| (2) | See reporting definitions and supplemental financial measures disclosures. |
| Overview | Financial Results | Operations | Capital Deployment | Private Capital | Capitalization | NAV | Reporting Definitions | 7 |
|
|
Operating Statistics(1) |
SUPPLEMENTAL ANALYST PACKAGE 2007 Fourth Quarter Earnings Conference Call |
||
| Owned & Managed Portfolio(2) | Same Store Pool(2) | |||||||||||||||
| Quarter ended | Quarter ended | Quarter ended | Quarter ended | |||||||||||||
| December 31, 2007 | September 30, 2007 | December 31, 2007 | September 30, 2007 | |||||||||||||
Square feet |
118,180,295 | 114,030,439 | 85,192,781 | 85,480,766 | ||||||||||||
Percentage of Owned & Managed square feet |
72.1 | % | 75.0 | % | ||||||||||||
Occupancy |
||||||||||||||||
Occupancy percentage at period end(2) |
96.0 | % | 95.5 | % | 96.4 | % | 96.2 | % | ||||||||
Occupancy percentage at period end (prior year) |
96.1 | % | 95.9 | % | 96.7 | % | 96.1 | % | ||||||||
Average occupancy percentage(2) |
95.6 | % | 95.4 | % | 95.9 | % | 95.9 | % | ||||||||
Average occupancy percentage (prior year) |
95.3 | % | 94.8 | % | 95.9 | % | 95.5 | % | ||||||||
Weighted average lease terms (years) |
||||||||||||||||
Original |
6.2 | 6.1 | 6.1 | 6.1 | ||||||||||||
Remaining |
3.5 | 3.5 | 3.1 | 3.1 | ||||||||||||
Trailing four quarters statistics |
||||||||||||||||
Tenant retention(2) |
74.0 | % | 72.8 | % | 73.4 | % | 72.3 | % | ||||||||
Rent change on renewals and rollovers(2) |
||||||||||||||||
Percentage |
4.9 | % | 4.4 | % | 5.0 | % | 4.3 | % | ||||||||
Same space square footage commencing (millions) |
19.2 | 18.0 | 17.6 | 16.3 | ||||||||||||
Second generation TIs and LCs per square foot(2) |
||||||||||||||||
Retained |
$ | 1.19 | $ | 1.20 | ||||||||||||
Re-tenanted |
$ | 3.25 | $ | 3.38 | ||||||||||||
Weighted average |
$ | 2.03 | $ | 2.12 | ||||||||||||
Second generation square footage commmencing (millions) |
22.8 | 21.7 | ||||||||||||||
Gross operating margin(2) |
73.5 | % | 73.6 | % | 73.0 | % | 73.1 | % | ||||||||
| Same Store Pool(2) | ||||||||||||||||
| Quarter ended | Year ended | |||||||||||||||
| Cash Basis NOI % change(2) | December 31, 2007 | December 31, 2007 | ||||||||||||||
Revenues without lease termination fees(3) |
5.7 | % | 5.8 | % | ||||||||||||
Expenses(3) |
7.9 | % | 6.7 | % | ||||||||||||
NOI without lease termination fees(2)(3) |
4.8 | % | 5.5 | % | ||||||||||||
NOI with lease termination fees(2)(3) |
3.3 | % | 5.1 | % | ||||||||||||
| (1) | Owned and managed portfolio. | |
| (2) | See reporting definitions and supplemental financial measures disclosures. | |
| (3) | For the quarter ended December 31, 2007, on a consolidated basis, the % change was 5.6%, 6.3%, 5.3% and 5.0%, respectively, for revenues, expenses, NOI without lease termination fees and NOI with lease termination fees. For the year ended December 31, 2007, on a consolidated basis, the % change was 6.1%, 6.2%, 6.0% and 5.5%, respectively, for revenues, expenses, NOI without lease termination fees and NOI with lease termination fees. |
| Overview | Financial Results | Operations | Capital Deployment | Private Capital | Capitalization | NAV | Reporting Definitions | 8 |
|
Portfolio Overview |
SUPPLEMENTAL ANALYST PACKAGE 2007 Fourth Quarter Earnings Conference Call |
||
| Annualized | Year-to-Date | |||||||||||||||||||||||||||||||||||||||
| Placed in | AMB share of | Year-to-Date | Base Rent | Same Store NOI | Rent Change | |||||||||||||||||||||||||||||||||||
| Square Feet as | Acquired | Operations | Disposed | Square Feet as | Square Feet as | Average | psf as of | Growth Without Lease | on Renewals | |||||||||||||||||||||||||||||||
| of 9/30/2007 | Square Feet | Square Feet(1) | Square Feet | of 12/31/2007 | of 12/31/2007 | Occupancy | 12/31/2007 | Termination Fees(2) | and Rollovers(2) | |||||||||||||||||||||||||||||||
Southern California |
15,966,939 | 1,547,488 | 130 | — | 17,514,557 | 57.1 | % | 96.5 | % | $ | 6.53 | 4.9 | % | 10.2 | % | |||||||||||||||||||||||||
Chicago |
12,423,064 | 516,884 | — | — | 12,939,948 | 53.3 | % | 91.0 | % | 5.30 | 4.9 | % | 0.8 | % | ||||||||||||||||||||||||||
No. New Jersey/New York |
11,115,945 | — | — | — | 11,115,945 | 50.1 | % | 98.6 | % | 7.21 | 7.9 | % | 3.1 | % | ||||||||||||||||||||||||||
San Francisco Bay Area |
10,147,211 | 112,312 | 2,920 | — | 10,262,443 | 72.6 | % | 96.2 | % | 6.42 | 3.8 | % | -5.5 | % | ||||||||||||||||||||||||||
Seattle |
7,891,551 | — | — | — | 7,891,551 | 49.7 | % | 96.3 | % | 5.17 | 6.0 | % | 18.6 | % | ||||||||||||||||||||||||||
South Florida |
6,119,659 | 156,632 | — | — | 6,276,291 | 70.5 | % | 97.5 | % | 7.49 | 10.6 | % | 12.0 | % | ||||||||||||||||||||||||||
U.S. On-Tarmac |
2,679,328 | — | (500 | ) | (49,715 | ) | 2,629,113 | 92.6 | % | 94.2 | % | 18.69 | 0.9 | % | 1.4 | % | ||||||||||||||||||||||||
Other U.S. Markets |
27,931,772 | 100,000 | (1,766 | ) | (240,000 | ) | 27,790,006 | 64.8 | % | 94.4 | % | 5.49 | 3.9 | % | 1.8 | % | ||||||||||||||||||||||||
U.S. Subtotal / Wtd Avg |
94,275,469 | 2,433,316 | 784 | (289,715 | ) | 96,419,854 | 60.9 | % | 95.3 | % | $ | 6.42 | 5.0 | % | 4.1 | % | ||||||||||||||||||||||||
Canada |
304,353 | — | — | — | 304,353 | 100.0 | % | 87.0 | % | $ | 7.89 | 0.0 | % | n/a | ||||||||||||||||||||||||||
Mexico City |
2,134,089 | — | — | — | 2,134,089 | 20.0 | % | 95.9 | % | 6.34 | -6.9 | % | 0.0 | % | ||||||||||||||||||||||||||
Other Mexico Markets |
2,769,507 | — | — | — | 2,769,507 | 20.0 | % | 93.2 | % | 4.83 | -0.2 | % | 0.1 | % | ||||||||||||||||||||||||||
Mexico Subtotal / Wtd Avg |
4,903,596 | — | — | — | 4,903,596 | 20.0 | % | 94.4 | % | $ | 5.51 | -3.8 | % | 0.1 | % | |||||||||||||||||||||||||
The Americas Total / Wtd Avg |
99,483,418 | 2,433,316 | 784 | (289,715 | ) | 101,627,803 | 59.0 | % | 95.2 | % | $ | 6.38 | 4.9 | % | 4.1 | % | ||||||||||||||||||||||||
France |
3,371,164 | — | — | 3,371,164 | 20.0 | % | 94.4 | % | $ | 8.61 | 16.5 | % | 10.6 | % | ||||||||||||||||||||||||||
Germany |
1,700,870 | — | 415,433 | — | 2,116,303 | 19.8 | % | 99.8 | % | 9.36 | 10.4 | % | -1.2 | % | ||||||||||||||||||||||||||
Benelux |
1,980,667 | 633,154 | 221,392 | — | 2,835,213 | 21.2 | % | 99.5 | % | 10.35 | 10.1 | % | n/a | |||||||||||||||||||||||||||
Other Europe Markets |
— | — | 178,282 | — | 178,282 | 100.0 | % | 100.0 | % | 14.39 | 0.0 | % | n/a | |||||||||||||||||||||||||||
Europe Subtotal / Wtd Avg |
7,052,701 | 633,154 | 815,107 | — | 8,500,962 | 22.0 | % | 97.6 | % | $ | 9.53 | 13.4 | % | 7.6 | % | |||||||||||||||||||||||||
Tokyo |
4,374,922 | — | 541,595 | — | 4,916,517 | 28.9 | % | 94.2 | % | $ | 12.24 | 24.0 | % | 1.0 | % | |||||||||||||||||||||||||
Osaka |
1,018,875 | — | — | — | 1,018,875 | 20.0 | % | 92.1 | % | 9.32 | 0.0 | % | n/a | |||||||||||||||||||||||||||
Other Japan Markets |
— | — | — | — | — | 0.0 | % | 0.0 | % | — | 0.0 | % | n/a | |||||||||||||||||||||||||||
Japan Subtotal / Wtd Avg |
5,393,797 | — | 541,595 | — | 5,935,392 | 27.4 | % | 93.8 | % | $ | 11.77 | 24.0 | % | 1.0 | % | |||||||||||||||||||||||||
Shanghai |
1,382,817 | — | — | — | 1,382,817 | 69.9 | % | 99.9 | % | $ | 4.03 | 38.6 | % | 48.7 | % | |||||||||||||||||||||||||
Singapore |
717,706 | — | 15,615 | — | 733,321 | 82.9 | % | 95.5 | % | 9.86 | 0.0 | % | 2.7 | % | ||||||||||||||||||||||||||
Other Asia Markets |
— | — | — | — | — | 0.0 | % | 0.0 | % | — | 0.0 | % | n/a | |||||||||||||||||||||||||||
Asia Total / Wtd Avg |
7,494,320 | — | 557,210 | — | 8,051,530 | 39.7 | % | 95.0 | % | $ | 10.21 | 24.7 | % | 19.5 | % | |||||||||||||||||||||||||
Owned and Managed Total / Wtd Avg(2) |
114,030,439 | 3,066,470 | 1,373,101 | (289,715 | ) | 118,180,295 | 55.0 | % | 95.1 | % | $ | 6.87 | 5.5 | % | 4.9 | % | ||||||||||||||||||||||||
Other Real Estate Investments(3) |
7,495,659 | — | — | — | 7,495,659 | 54.3 | % | 95.0 | % | |||||||||||||||||||||||||||||||
Total Operating Portfolio |
121,526,098 | 3,066,470 | 1,373,101 | (289,715 | ) | 125,675,954 | 55.0 | % | 95.1 | % | ||||||||||||||||||||||||||||||
Development |
||||||||||||||||||||||||||||||||||||||||
Pipeline |
16,773,990 | 4,228,206 | (5) | (3,078,031 | )(6) | (101,345 | )(6) | 17,822,820 | 87.6 | % | ||||||||||||||||||||||||||||||
Available for Sale or Contribution(4) |
2,475,555 | 2,268,526 | (5) | (525,397 | )(6) | (28,180 | )(6) | 4,190,504 | 98.3 | % | ||||||||||||||||||||||||||||||
Development Subtotal |
19,249,545 | 6,496,732 | (3,603,428 | ) | (129,525 | ) | 22,013,324 | 89.7 | % | |||||||||||||||||||||||||||||||
Total Global Portfolio |
140,775,643 | 9,563,202 | (2,230,327 | ) | (419,240 | ) | 147,689,278 | 60.2 | % | |||||||||||||||||||||||||||||||
| (1) | Represents assets contributed or placed in operations from development and may include positive/(negative) remeasures to operating assets. | |
| (2) | See reporting definitions and supplemental financial measures disclosures. | |
| (3) | Includes investments in operating properties through AMB’s investments in unconsolidated co-investment ventures that it does not manage and are therefore excluded from the owned and managed portfolio and the location of AMB’s global headquarters. | |
| (4) | Represents development projects available for sale or contribution that are not included in the operating portfolio. | |
| (5) | For development pipeline, represents square footage of development starts. For available for sale or contribution, represents new projects available. | |
| (6) | For development pipeline, represents square footage of completed development projects. For available for sale or contribution, represents projects sold, contributed, or placed in operations. |
| Overview | Financial Results | Operations | Capital Deployment | Private Capital | Capitalization | NAV | Reporting Definitions | 9 |
|
|
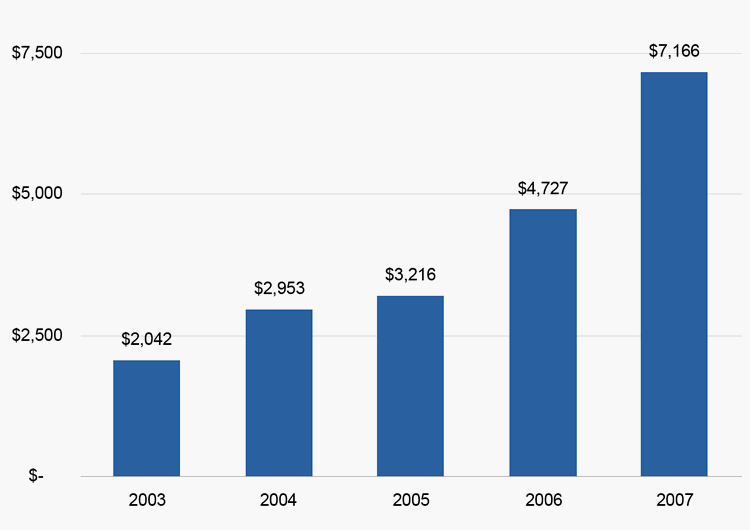
Capital Deployment Overview (dollars in millions) |
SUPPLEMENTAL ANALYST PACKAGE 2007 Fourth Quarter Earnings Conference Call |
||
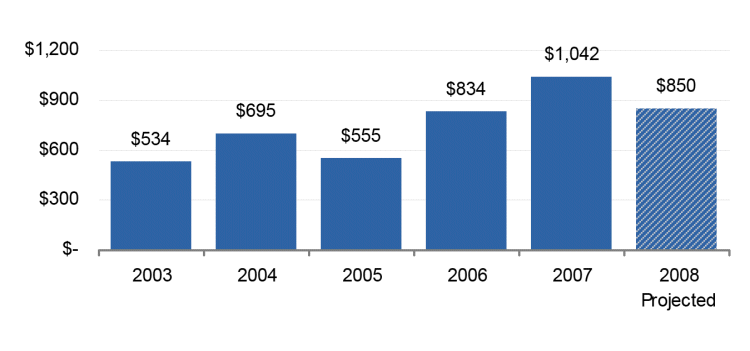
| (1) | Includes investments held through unconsolidated co-investment ventures. | |
| (2) | See reporting definitions and supplemental financial measures disclosures. | |
| (3) | Owned and managed portfolio. |
| Overview | Financial Results | Operations | Capital Deployment | Private Capital | Capitalization | NAV | Reporting Definitions | 10 |
|
Property Acquisitions(1) (dollars in thousands) |
SUPPLEMENTAL ANALYST PACKAGE 2007 Fourth Quarter Earnings Conference Call |
| For the Quarter ended | For the Year ended | |||||||||||||||||||
| December 31, 2007 | December 31, 2007 | |||||||||||||||||||
| % of Total | ||||||||||||||||||||
| Acquisition | Acquisition | Acquisition | ||||||||||||||||||
| Square Feet | Cost(2) | Square Feet | Cost(2) | Cost | ||||||||||||||||
The Americas |
||||||||||||||||||||
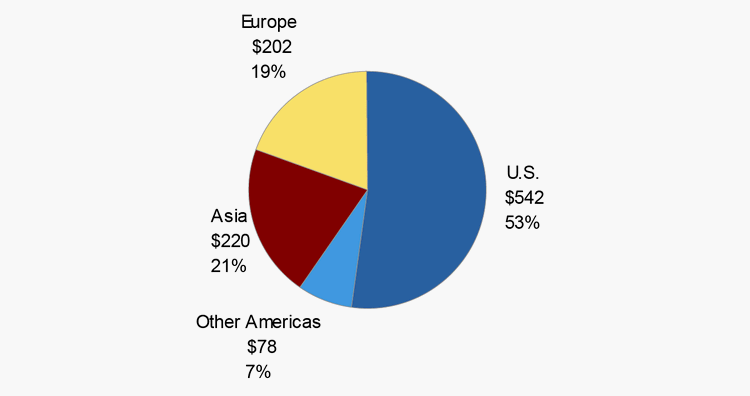
United States |
2,433,316 | $ | 222,247 | 6,341,590 | $ | 542,345 | 52.1 | % | ||||||||||||
Other Americas |
— | — | 1,846,160 | 78,033 | 7.5 | % | ||||||||||||||
The Americas Total |
2,433,316 | $ | 222,247 | 8,187,750 | $ | 620,378 | 59.5 | % | ||||||||||||
Europe |
||||||||||||||||||||
France |
— | $ | — | 577,483 | $ | 38,040 | 3.7 | % | ||||||||||||
Germany |
— | — | 474,796 | 47,605 | 4.6 | % | ||||||||||||||
Benelux |
633,154 | 67,015 | 1,049,114 | 116,149 | 11.1 | % | ||||||||||||||
Other Europe |
— | — | — | — | 0.0 | % | ||||||||||||||
Europe Total |
633,154 | $ | 67,015 | 2,101,393 | $ | 201,794 | 19.4 | % | ||||||||||||
Asia |
||||||||||||||||||||
Japan |
— | $ | — | 1,107,261 | $ | 180,901 | 17.4 | % | ||||||||||||
China |
— | — | — | — | 0.0 | % | ||||||||||||||
Other Asia |
— | — | 466,948 | 38,815 | 3.7 | % | ||||||||||||||
Asia Total |
— | $ | — | 1,574,209 | $ | 219,716 | 21.1 | % | ||||||||||||
Total |
3,066,470 | $ | 289,262 | 11,863,352 | $ | 1,041,888 | 100.0 | % | ||||||||||||
AMB’s Weighted |
||||||||||||||||||||
Average Ownership Percentage |
20.5 | % | 24.3 | % | ||||||||||||||||
Weighted Average |
||||||||||||||||||||
Stabilized GAAP Cap Rate(3) |
5.4 | % | 6.2 | % | ||||||||||||||||
Weighted Average |
||||||||||||||||||||
Stabilized Cash Cap Rate(3) |
5.2 | % | 5.9 | % | ||||||||||||||||
| % of Total | ||||||||||||||||||||
| Acquisition | Acquisition | Acquisition | ||||||||||||||||||
| Square Feet | Cost(2) | Square Feet | Cost(2) | Cost | ||||||||||||||||
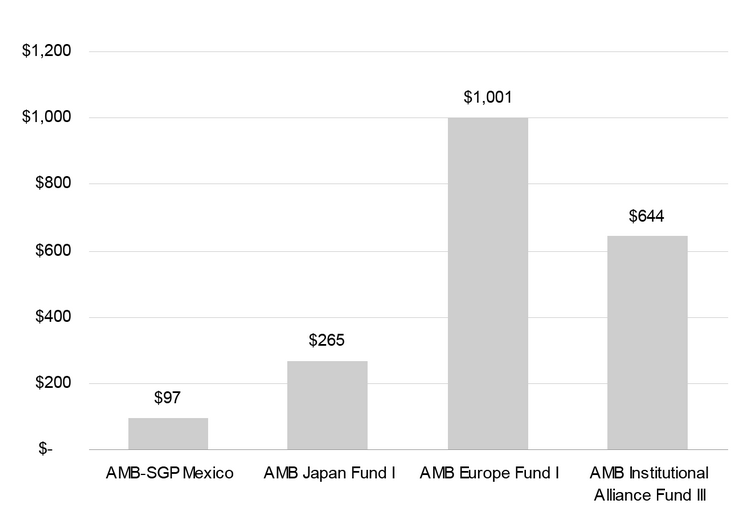
By Entity |
||||||||||||||||||||
AMB Property Corporation |
35,800 | 6,783 | 701,629 | 62,241 | 6.0 | % | ||||||||||||||
AMB-SGP Mexico |
— | — | 1,739,976 | 69,688 | 6.6 | % | ||||||||||||||
AMB Japan Fund I |
— | — | 1,107,261 | 180,901 | 17.4 | % | ||||||||||||||
AMB Europe Fund I |
633,154 | 67,015 | 2,101,393 | 201,794 | 19.4 | % | ||||||||||||||
AMB Institutional Alliance Fund III |
2,397,516 | 215,464 | 6,213,093 | 527,264 | 50.6 | % | ||||||||||||||
Total |
3,066,470 | $ | 289,262 | 11,863,352 | $ | 1,041,888 | 100.0 | % | ||||||||||||
| (1) | Owned and managed portfolio. | |
| (2) | Includes closing costs and estimated total acquisition capital expenditures of approximately $4.8 million and $19.3 million, respectively, for the quarter and year ended December 31, 2007. | |
| (3) | See reporting definitions and supplemental financial measures disclosures. |
| Overview | Financial Results | Operations | Capital Deployment | Private Capital | Capitalization | NAV | Reporting Definitions | 11 |
|
Development Starts and Total Capital Deployment(1) (dollars in thousands) |
SUPPLEMENTAL ANALYST PACKAGE 2007 Fourth Quarter Earnings Conference Call |
| For the Quarter ended December 31, 2007 | For the Year ended December 31, 2007 | |||||||||||||||||||
| Estimated | Estimated | Estimated | Estimated | % of Total | ||||||||||||||||
| Square Feet at | Total | Square Feet at | Total | Estimated | ||||||||||||||||
| Stabilization(2) | Investment(2) | Stabilization(2) | Investment(2)(3) | Investment(2) | ||||||||||||||||
The Americas |
||||||||||||||||||||
United States |
422,504 | $ | 40,444 | 5,101,686 | $ | 414,702 | 38.2 | % | ||||||||||||
Other Americas |
1,589,913 | 111,162 | 2,326,228 | 144,574 | 13.3 | % | ||||||||||||||
The Americas Total |
2,012,417 | $ | 151,606 | 7,427,914 | $ | 559,276 | 51.5 | % | ||||||||||||
Europe |
||||||||||||||||||||
France |
409,588 | $ | 38,542 | 476,862 | $ | 52,751 | 4.9 | % | ||||||||||||
Germany |
— | — | — | — | 0.0 | % | ||||||||||||||
Benelux |
453,515 | 57,521 | 890,529 | 94,964 | 8.7 | % | ||||||||||||||
Other Europe |
320,210 | 72,485 | 320,210 | 72,485 | 6.7 | % | ||||||||||||||
Europe Total |
1,183,313 | $ | 168,548 | 1,687,601 | $ | 220,200 | 20.3 | % | ||||||||||||
Asia |
||||||||||||||||||||
Japan |
423,939 | $ | 51,401 | 2,089,053 | $ | 246,450 | 22.7 | % | ||||||||||||
China |
608,537 | 24,918 | 608,537 | 24,918 | 2.3 | % | ||||||||||||||
Other Asia |
— | — | 362,745 | 34,504 | 3.2 | % | ||||||||||||||
Asia Total |
1,032,476 | $ | 76,319 | 3,060,335 | $ | 305,872 | 28.2 | % | ||||||||||||
Total |
4,228,206 | $ | 396,473 | 12,175,850 | $ | 1,085,348 | 100.0 | % | ||||||||||||
AMB’s Weighted Average Ownership Percentage |
92.2 | % | 88.6 | % | ||||||||||||||||
Weighted Average Estimated Yield(2) |
6.9 | % | 7.2 | % | ||||||||||||||||
| For the Quarter ended December 31, 2007 | For the Year ended December 31, 2007 | |||||||||||||||
| Estimated | Estimated | Estimated | Estimated | |||||||||||||
| Square Feet at | Total | Square Feet at | Total | |||||||||||||
| Stabilization(2) | Investment(2) | Stabilization(2) | Investment(2)(3) | |||||||||||||
Total Acquisitions |
3,066,470 | $ | 289,262 | 11,863,352 | $ | 1,041,888 | ||||||||||
Total Development Starts |
4,228,206 | 396,473 | 12,175,850 | 1,085,348 | ||||||||||||
Total Capital Deployment |
7,294,676 | $ | 685,735 | 24,039,202 | $ | 2,127,236 | ||||||||||
| (1) | Includes investments held through unconsolidated co-investment ventures. | |
| (2) | See reporting definitions and supplemental financial measures disclosures. | |
| (3) | Includes value added conversion projects. |
| Overview | Financial Results | Operations | Capital Deployment | Private Capital | Capitalization | NAV | Reporting Definitions | 12 |
|
Contributions and Dispositions(1) (dollars in thousands) |
SUPPLEMENTAL ANALYST PACKAGE 2007 Fourth Quarter Earnings Conference Call |
| Operating Property | Development Property | |||||||||||||||
| Contributions and Dispositions | Contributions and Dispositions | |||||||||||||||
| For the Quarter ended | For the Year ended | For the Quarter ended | For the Year ended | |||||||||||||
| December 31, 2007 | December 31, 2007 | December 31, 2007 | December 31, 2007 | |||||||||||||
AMB’s Ownership Contributed and Disposed |
100.0 | % | 80.6 | % | 92.6 | % | 86.2 | % | ||||||||
Contribution Value and Disposition Price |
$ | 8,788 | $ | 541,188 | $ | 244,871 | $ | 730,348 | ||||||||
Weighted Average Stabilized Cash Cap
Rate(2)(3) |
8.5 | % | 6.4 | % | 5.6 | % | 5.6 | % | ||||||||
Development Margin(3) |
N/A | N/A | 65.5 | % | 39.9 | % | ||||||||||
| Operating Property | Development Property | |||||||||||||||||||||||||||
| Contributions and Dispositions | Contributions and Dispositions | |||||||||||||||||||||||||||
| For the Quarter ended | For the Year ended | For the Quarter ended | For the Year ended | |||||||||||||||||||||||||
| December 31, 2007 | December 31, 2007 | December 31, 2007 | December 31, 2007 | |||||||||||||||||||||||||
| Square Feet | Square Feet | Square Feet | Land Acreage(4) | Square Feet | Land Acreage(4) | |||||||||||||||||||||||
The Americas |
||||||||||||||||||||||||||||
United States |
289,715 | 542,291 | 129,525 | 100 | 1,504,181 | 107 | ||||||||||||||||||||||
Other Americas |
— | 95,949 | 111,600 | 6 | 329,114 | 6 | ||||||||||||||||||||||
The Americas Total |
289,715 | 638,240 | 241,125 | 106 | 1,833,295 | 113 | ||||||||||||||||||||||
Europe |
||||||||||||||||||||||||||||
France |
— | 2,148,023 | — | — | 598,161 | — | ||||||||||||||||||||||
Germany |
— | 1,119,286 | 414,701 | — | 523,653 | — | ||||||||||||||||||||||
Benelux |
— | 964,039 | 110,696 | — | 716,197 | — | ||||||||||||||||||||||
Other Europe |
— | — | — | — | — | — | ||||||||||||||||||||||
Europe Total |
— | 4,231,348 | 525,397 | — | 1,838,011 | — | ||||||||||||||||||||||
Asia |
||||||||||||||||||||||||||||
Japan |
— | — | — | — | 469,627 | — | ||||||||||||||||||||||
China |
— | — | — | — | — | — | ||||||||||||||||||||||
Other Asia |
— | — | — | — | — | — | ||||||||||||||||||||||
Asia Total |
— | — | — | — | 469,627 | — | ||||||||||||||||||||||
Total |
289,715 | 4,869,588 | 766,522 | 106 | 4,140,933 | 113 | ||||||||||||||||||||||
| (1) | Includes investments held through unconsolidated co-investment ventures. | |
| (2) | Excludes value added conversions, build-to-suit buildings, and land sales. | |
| (3) | See reporting definitions and supplemental financial measures disclosures. | |
| (4) | Includes value added conversion projects. |
| Overview | Financial Results | Operations | Capital Deployment | Private Capital | Capitalization | NAV | Reporting Definitions | 13 |
|
Development Pipeline(1) (dollars in thousands) |
SUPPLEMENTAL ANALYST PACKAGE 2007 Fourth Quarter Earnings Conference Call |
| 2008 Expected Stabilizations | 2009 Expected Stabilizations | Total | ||||||||||||||||||||||||||
| Estimated | Estimated | Estimated | Estimated | Estimated | Estimated | % of Total | ||||||||||||||||||||||
| Square Feet at | Total | Square Feet at | Total | Square Feet at | Total | Estimated | ||||||||||||||||||||||
| Stabilization(2) | Investment(2)(3) | Stabilization(2) | Investment(2)(3) | Stabilization(2) | Investment(2)(3) | Investment(2) | ||||||||||||||||||||||
The Americas |
||||||||||||||||||||||||||||
United States |
3,577,575 | $ | 275,366 | 3,804,520 | $ | 324,843 | 7,382,095 | $ | 600,209 | 35.0 | % | |||||||||||||||||
Other Americas |
281,441 | 26,047 | 2,321,879 | 145,474 | 2,603,320 | 171,521 | 10.0 | % | ||||||||||||||||||||
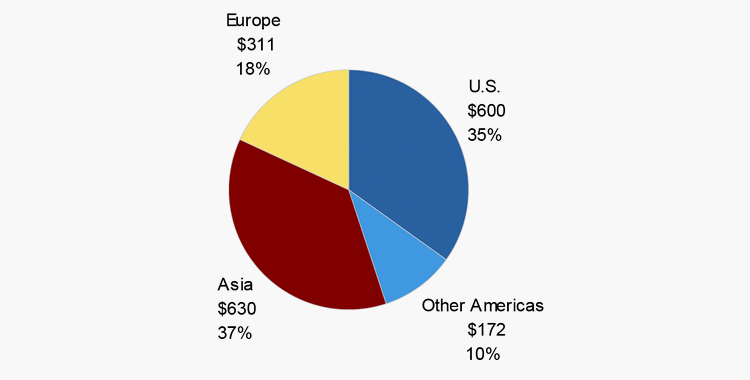
The Americas Total |
3,859,016 | $ | 301,413 | 6,126,399 | $ | 470,317 | 9,985,415 | $ | 771,730 | 45.0 | % | |||||||||||||||||
Europe |
||||||||||||||||||||||||||||
France |
37,954 | $ | 5,173 | 409,588 | $ | 38,542 | 447,542 | $ | 43,715 | 2.6 | % | |||||||||||||||||
Germany |
139,608 | 19,452 | — | — | 139,608 | 19,452 | 1.1 | % | ||||||||||||||||||||
Benelux |
207,232 | 35,513 | 890,529 | 95,811 | 1,097,761 | 131,324 | 7.7 | % | ||||||||||||||||||||
Other Europe |
585,971 | 76,540 | 436,916 | 40,336 | 1,022,887 | 116,876 | 6.8 | % | ||||||||||||||||||||
Europe Total |
970,765 | $ | 136,678 | 1,737,033 | $ | 174,690 | 2,707,798 | $ | 311,368 | 18.2 | % | |||||||||||||||||
Asia |
||||||||||||||||||||||||||||
Japan |
3,472,568 | $ | 471,591 | 685,757 | $ | 98,630 | 4,158,325 | $ | 570,221 | 33.3 | % | |||||||||||||||||
China |
— | — | 608,537 | 24,918 | 608,537 | 24,918 | 1.5 | % | ||||||||||||||||||||
Other Asia |
362,745 | 34,672 | — | — | 362,745 | 34,672 | 2.0 | % | ||||||||||||||||||||
Asia Total |
3,835,313 | $ | 506,263 | 1,294,294 | $ | 123,548 | 5,129,607 | $ | 629,811 | 36.8 | % | |||||||||||||||||
Total |
8,665,094 | $ | 944,353 | 9,157,726 | $ | 768,555 | 17,822,820 | $ | 1,712,908 | 100.0 | % | |||||||||||||||||
Number of Projects |
27 | 29 | 56 | |||||||||||||||||||||||||
Funded-to-Date |
$ | 822,500 | $ | 391,757 | $ | 1,214,257 | ||||||||||||||||||||||
AMB’s Weighted Average Ownership Percentage |
90.9 | % | 88.5 | % | 89.8 | % | ||||||||||||||||||||||
AMB’s Share of Amounts Funded to Date |
$ | 758,668 | $ | 347,152 | $ | 1,105,820 | ||||||||||||||||||||||
Weighted Average Estimated Yield(2) |
7.3 | % | 7.5 | % | 7.4 | % | ||||||||||||||||||||||
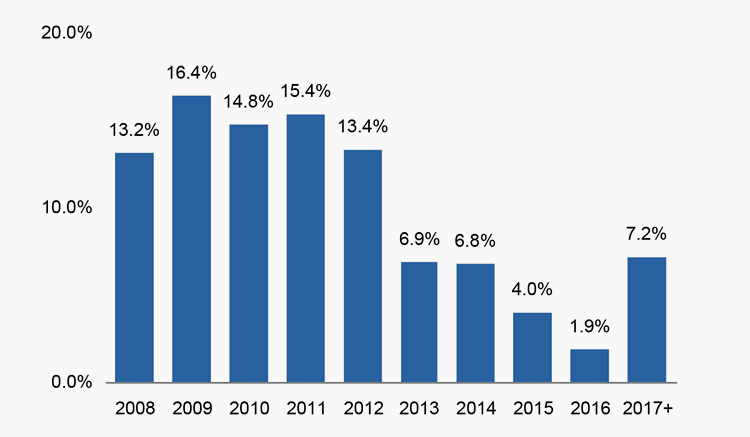
Percent Pre-leased(2) |
39.7 | % | 6.9 | % | 22.9 | % | ||||||||||||||||||||||
| (1) | Includes investments held through unconsolidated co-investment ventures. | |
| (2) | See reporting definitions and supplemental financial measures disclosures. | |
| (3) | Includes value added conversion projects. |
| Overview | Financial Results | Operations | Capital Deployment | Private Capital | Capitalization | NAV | Reporting Definitions | 14 |
|
Completions and Properties Available for Sale or Contribution(1) (dollars in thousands) |
SUPPLEMENTAL ANALYST PACKAGE 2007 Fourth Quarter Earnings Conference Call |
| Development Completions(2) | Available for Sale or Contribution As of December 31, 2007 | |||||||||||||||||||||||||||||||
| For the Quarter ended | For the Year ended | Development | Operating | |||||||||||||||||||||||||||||
| December 31, 2007 | December 31, 2007 | Properties | Properties | |||||||||||||||||||||||||||||
| Total | Total | Total | Total | |||||||||||||||||||||||||||||
| Square Feet | Investment | Square Feet | Investment | Square Feet | Investment | Square Feet | Investment | |||||||||||||||||||||||||
The Americas |
||||||||||||||||||||||||||||||||
United States |
1,104,722 | $ | 88,920 | 2,635,762 | $ | 223,463 | 1,400,656 | $ | 110,657 | 116,168 | $ | 6,505 | ||||||||||||||||||||
Other Americas |
920,058 | 55,845 | 2,379,295 | 151,051 | 2,444,757 | 155,223 | 304,353 | 25,511 | ||||||||||||||||||||||||
The Americas Total |
2,024,780 | $ | 144,765 | 5,015,057 | $ | 374,514 | 3,845,413 | $ | 265,880 | 420,521 | $ | 32,016 | ||||||||||||||||||||
Europe |
||||||||||||||||||||||||||||||||
France |
345,091 | $ | 38,863 | 937,870 | $ | 99,235 | 345,091 | $ | 38,863 | — | $ | — | ||||||||||||||||||||
Germany |
— | — | 414,701 | 40,434 | — | — | — | — | ||||||||||||||||||||||||
Benelux |
110,701 | 16,278 | 488,277 | 73,049 | — | — | 110,701 | 16,278 | ||||||||||||||||||||||||
Other Europe |
178,282 | 38,053 | 178,282 | 38,053 | — | — | 178,282 | 38,053 | ||||||||||||||||||||||||
Europe Total |
634,074 | $ | 93,194 | 2,019,130 | $ | 250,771 | 345,091 | $ | 38,863 | 288,983 | $ | 54,331 | ||||||||||||||||||||
Asia |
||||||||||||||||||||||||||||||||
Japan |
543,056 | $ | 92,553 | 1,012,310 | $ | 145,236 | — | $ | — | 543,056 | $ | 92,553 | ||||||||||||||||||||
China |
— | — | — | — | — | — | 1,382,817 | 58,375 | ||||||||||||||||||||||||
Other Asia |
— | — | — | — | — | — | 733,321 | 52,750 | ||||||||||||||||||||||||
Asia Total |
543,056 | $ | 92,553 | 1,012,310 | $ | 145,236 | — | $ | — | 2,659,194 | $ | 203,678 | ||||||||||||||||||||
Total |
3,201,910 | $ | 330,512 | 8,046,497 | $ | 770,521 | 4,190,504 | $ | 304,743 | 3,368,698 | $ | 290,025 | ||||||||||||||||||||
AMB’s Weighted Average Ownership Percentage |
95.9 | % | 94.8 | % | 98.9 | % | 88.7 | % | ||||||||||||||||||||||||
Weighted Average Estimated Yield(2) |
6.8 | % | 7.6 | % | 7.8 | % | N/A | |||||||||||||||||||||||||
Percent Pre-leased |
86.6 | % | 83.8 | % | 82.4 | % | 98.6 | % | ||||||||||||||||||||||||
| (1) | Includes investments held through unconsolidated co-investment ventures. | |
| (2) | See reporting definitions and supplemental financial measures disclosures. |
| Overview | Financial Results | Operations | Capital Deployment | Private Capital | Capitalization | NAV | Reporting Definitions | 15 |
|
Land, Value Added Conversion, and Redevelopment Inventory(1)(2) (dollars in thousands) |
SUPPLEMENTAL ANALYST PACKAGE 2007 Fourth Quarter Earnings Conference Call |
| Land Inventory | The Americas | Europe | Asia | Total | ||||||||||||||||||||||||||||
| Estimated | Estimated | Estimated | Estimated | |||||||||||||||||||||||||||||
| Build Out | Build Out | Build Out | Build Out | |||||||||||||||||||||||||||||
| Acres | (square feet) | Acres | (square feet) | Acres | (square feet) | Acres | (square feet) | |||||||||||||||||||||||||
Balance as of September 30, 2007 |
2,296 | 38,108,831 | 53 | 1,299,163 | 56 | 2,681,838 | 2,405 | 42,089,832 | ||||||||||||||||||||||||
Acquisitions |
205 | 3,087,277 | 182 | 3,328,267 | 9 | 210,273 | 396 | 6,625,817 | ||||||||||||||||||||||||
Sales |
(83 | ) | (1,227,578 | ) | — | — | — | — | (83 | ) | (1,227,578 | ) | ||||||||||||||||||||
Development starts |
(122 | ) | (2,026,097 | ) | (36 | ) | (767,326 | ) | (25 | ) | (608,537 | ) | (183 | ) | (3,401,960 | ) | ||||||||||||||||
Site plan adjustments |
— | (66,212 | ) | — | — | — | — | — | (66,212 | ) | ||||||||||||||||||||||
Balance as of December 31, 2007 |
2,296 | 37,876,221 | 199 | 3,860,104 | 40 | 2,283,574 | 2,535 | (3) | 44,019,899 | (3) | ||||||||||||||||||||||
Investment in Land(4) |
$ | 459,147 | $ | 52,917 | $ | 88,449 | $ | 600,513(3) | ||||||||||||||||||||||||
Estimated Total Investment(1) |
$ | 1,957,390 | $ | 341,557 | $ | 264,864 | $ | 2,563,811 | ||||||||||||||||||||||||
| East Region | Southwest Region | West Central Region | The Americas | |||||||||||||||||||||||||||||
| Number of | Number of | Number of | Number of | |||||||||||||||||||||||||||||
| Conversion Time Frame | Acres | Projects | Acres | Projects | Acres | Projects | Acres | Projects | ||||||||||||||||||||||||
3 years or less |
— | — | 31 | 2 | 44 | 4 | 75 | 6 | ||||||||||||||||||||||||
3+ years |
7 | 2 | 20 | 1 | 112 | 4 | 139 | 7 | ||||||||||||||||||||||||
Total |
7 | 2 | 51 | 3 | 156 | 8 | 214 | (5) | 13 | |||||||||||||||||||||||
| East Region | Southwest Region | West Central Region | The Americas | |||||||||||||||||||||||||||||
| Square | Number of | Square | Number of | Square | Number of | Square | Number of | |||||||||||||||||||||||||
| Redevelopment Time Frame | Feet | Projects | Feet | Projects | Feet | Projects | Feet | Projects | ||||||||||||||||||||||||
3 years or less |
40,800 | 1 | 888,140 | 2 | 131,987 | 1 | 1,060,927 | 4 | ||||||||||||||||||||||||
3+ years |
— | — | 129,499 | 1 | 860,641 | 2 | 990,140 | 3 | ||||||||||||||||||||||||
Total |
40,800 | 1 | 1,017,639 | 3 | 992,628 | 3 | 2,051,067 | (6) | 7 | |||||||||||||||||||||||
| (1) | See reporting definitions and supplemental financial measures disclosures. | |
| (2) | Includes investments held through unconsolidated co-investment ventures. | |
| (3) | AMB’s share of acres, square feet of estimated build out, and total investment including amounts held in unconsolidated co-investment ventures is 2,302 acres, 39.7 million square feet and $470,940, respectively. | |
| (4) | Represents actual cost incurred to date including initial acquisition, infrastructure, and associated carry costs. | |
| (5) | AMB’s share is 161 acres. | |
| (6) | AMB’s share is 1,436,257 square feet. | |
| (7) | East, Southwest, and West Central regions represent AMB’s geographic division of the Americas. |
| Overview | Financial Results | Operations | Capital Deployment | Private Capital | Capitalization | NAV | Reporting Definitions | 16 |
|
|
Private Capital Co-investment Ventures Overview (dollars in millions) |
SUPPLEMENTAL ANALYST PACKAGE 2007 Fourth Quarter Earnings Conference Call |
||
| Incentive | ||||||||||||
| Date | Geographic | Functional | Distribution | |||||||||
| Co-investment Venture | Established | Focus | Principal Venture Investors | Currency | Frequency | Term | ||||||
AMB Erie
|
March 1998 | United States | Erie Insurance Group | USD | 3 years | Perpetual | ||||||
AMB Partners II
|
February 2001 | United States | City and County of San Francisco ERS | USD | 3 years | Perpetual | ||||||
AMB-SGP
|
March 2001 | United States | Subsidiary of GIC Real Estate Pte Ltd. | USD | 10 years | March 2011; extendable 10 years | ||||||
AMB Institutional Alliance Fund II
|
June 2001 | United States | Various | USD | At dissolution | December 2014 (estimated) | ||||||
AMB-AMS
|
June 2004 | United States | Various | USD | At dissolution | December 2012; extendable 4 years | ||||||
AMB Institutional Alliance Fund III
|
October 2004 | United States | Various | USD | 3 years | Open end | ||||||
AMB-SGP Mexico
|
December 2004 | Mexico | Subsidiary of GIC Real Estate Pte Ltd. | USD | 7 years | December 2011; extendable 7 years | ||||||
AMB Japan Fund I
|
June 2005 | Japan | Various | JPY | At dissolution | June 2013; extendable 2 years | ||||||
AMB DFS Fund I
|
October 2006 | United States | GE Real Estate | USD | Upon project sales | Perpetual | ||||||
AMB Europe Fund I
|
June 2007 | Europe | Various | EUR | 3 years | Open end | ||||||
| (1) | See reporting definitions and supplemental financial measures disclosures. | |
| (2) | Additions to private capital co-investment ventures include both acquisitions from third parties as well as assets contributed to co-investment ventures from AMB. |
| Overview | Financial Results | Operations | Capital Deployment | Private Capital | Capitalization | NAV | Reporting Definitions | 17 |
|
|
Private Capital Co-investment Ventures Financial Summary (dollars in thousands) |
SUPPLEMENTAL ANALYST PACKAGE 2007 Fourth Quarter Earnings Conference Call |
||
| AMB‘s | Gross | AMB‘s | Estimated | Planned | ||||||||||||||||||||||||||
| Ownership | Square | Book | Property | Other | Net Equity | Investment | Gross | |||||||||||||||||||||||
| Unconsolidated Co-investment Ventures | Percentage | Feet(1) | Value(2) | Debt | Debt | Investment(3) | Capacity | Capitalization | ||||||||||||||||||||||
Co-Investment Operating Ventures |
||||||||||||||||||||||||||||||
AMB Institutional Alliance Fund III(4) |
18% | 21,382,228 | $ | 1,975,455 | $ | 962,029 | $ | 86,000 | $ | 135,710 | $ | 309,000 | $ | 2,284,000 | ||||||||||||||||
AMB Europe Fund I(4) |
21% | 8,322,680 | 1,098,469 | 667,018 | — | 49,893 | 273,000 | 1,371,000 | ||||||||||||||||||||||
AMB Japan Fund I |
20% | 5,392,336 | 926,859 | 561,020 | 105,496 | 54,733 | 1,300,000 | 2,227,000 | ||||||||||||||||||||||
AMB-SGP Mexico |
20% | 4,903,596 | 262,428 | 173,449 | — | 12,557 | 443,000 | 705,000 | ||||||||||||||||||||||
Total Co-investment Operating Ventures |
19% | 40,000,840 | 4,263,211 | 2,363,516 | 191,496 | 252,893 | 2,325,000 | 6,587,000 | ||||||||||||||||||||||
Co-investment Development Ventures: |
||||||||||||||||||||||||||||||
AMB DFS Fund I |
15% | 1,432,577 | 144,150 | — | — | 22,004 | 274,000 | 418,000 | ||||||||||||||||||||||
Other Industrial Co-investment Operating Ventures |
54% | 7,669,507 | (5) | 294,805 | 177,812 | — | 48,555 | n/a | n/a | |||||||||||||||||||||
Total
Unconsolidated Co-investment Ventures |
21% | 49,102,924 | $ | 4,702,166 | $ | 2,541,328 | $ | 191,496 | $ | 323,452 | $ | 2,599,000 | $ | 7,005,000 | ||||||||||||||||
Consolidated Co-investment Ventures |
||||||||||||||||||||||||||||||
Co-investment Operating Ventures |
||||||||||||||||||||||||||||||
AMB Partners II |
20% | 9,914,742 | $ | 691,114 | $ | 319,956 | $ | 65,000 | ||||||||||||||||||||||
AMB-SGP |
50% | 8,287,592 | 454,794 | 346,638 | — | |||||||||||||||||||||||||
AMB Institutional Alliance Fund II |
20% | 8,006,081 | 524,727 | 238,284 | 60,000 | |||||||||||||||||||||||||
AMB-AMS |
39% | 2,172,137 | 156,468 | 83,151 | — | |||||||||||||||||||||||||
AMB Erie |
50% | 821,712 | 53,745 | 20,026 | — | |||||||||||||||||||||||||
Total Co-investment Operating Ventures |
30% | 29,202,264 | 1,880,848 | 1,008,055 | 125,000 | |||||||||||||||||||||||||
Co-investment Development Ventures |
||||||||||||||||||||||||||||||
AMB Partners II |
20% | n/a | 3,376 | — | — | |||||||||||||||||||||||||
AMB Institutional Alliance Fund II |
20% | n/a | 4,421 | — | — | |||||||||||||||||||||||||
Total Co-investment Development Ventures |
20% | — | 7,797 | — | — | |||||||||||||||||||||||||
Total Co-investment Ventures |
30% | 29,202,264 | 1,888,645 | 1,008,055 | 125,000 | |||||||||||||||||||||||||
Other Industrial Co-investment Operating Ventures |
92% | 2,196,134 | 209,554 | 28,570 | — | |||||||||||||||||||||||||
Other Industrial Co-investment Development Ventures |
82% | 2,868,271 | 410,847 | 82,403 | — | |||||||||||||||||||||||||
Total
Consolidated Co-investment Ventures |
43% | 34,266,669 | $ | 2,509,046 | $ | 1,119,028 | $ | 125,000 | ||||||||||||||||||||||
| Selected Operating Results | ||||||||||||||||||||||||||
| For the Quarter ended December 31, 2007 | Cash NOI(6) | Net Income | FFO(6) | Share of | Cash NOI(6) | Net Income | FFO(6) | |||||||||||||||||||
Unconsolidated Co-investment Ventures |
$ | 68,997 | $ | 2,944 | $ | 29,796 | AMB's | $ | 18,335 | $ | 181 | $ | 6,083 | |||||||||||||
Consolidated Co-investment Ventures |
$ | 39,768 | $ | 6,960 | $ | 22,808 | Partner's | $ | 28,217 | $ | 3,599 | $ | 15,555 | |||||||||||||
| Selected Operating Results | ||||||||||||||||||||||||||
| For the Year ended December 31, 2007 | Cash NOI(6) | Net Income | FFO(6) | Share of | Cash NOI(6) | Net Income | FFO(6) | |||||||||||||||||||
Unconsolidated Co-investment Ventures |
$ | 219,952 | $ | 20,839 | $ | 104,888 | AMB's | $ | 56,679 | $ | 7,467 | $ | 27,391 | |||||||||||||
Consolidated Co-investment Ventures |
$ | 169,538 | $ | 37,416 | $ | 99,926 | Partner's | $ | 110,409 | $ | 16,076 | $ | 62,902 | |||||||||||||
| (1) | For development properties, represents the estimated square feet upon completion for the committed phases of development projects. | |
| (2) | Represents the book value of the property (before accumulated depreciation) owned by the co-investment venture and excludes net other assets. Development book values include uncommitted land. | |
| (3) | AMB also has a 39% equity interest in G. Accion, a Mexican real estate company for approximately $32.7 million. G. Accion provides real estate management and development services in Mexico. | |
| (4) | The estimated investment capacity and planned gross capitalizations and investment capacities of AMB Institutional Alliance Fund III and AMB Europe Fund I, as open-end funds, are not limited. The planned gross capitalization represents the gross book value of real estate assets as of the most recent quarter end, and the investment capacity represents estimated capacity based on the Fund’s current cash and leverage limitations as of the most recent quarter end. | |
| (5) | Includes investments in 7.5 million square feet of operating properties through AMB’s investments in unconsolidated co-investment venture that it does not manage which it excludes from its owned and managed portfolio. | |
| (6) | See reporting definitions and supplemental financial measures disclosures. |
| Overview | Financial Results | Operations | Capital Deployment | Private Capital | Capitalization | NAV | Reporting Definitions | 18 |
|
|
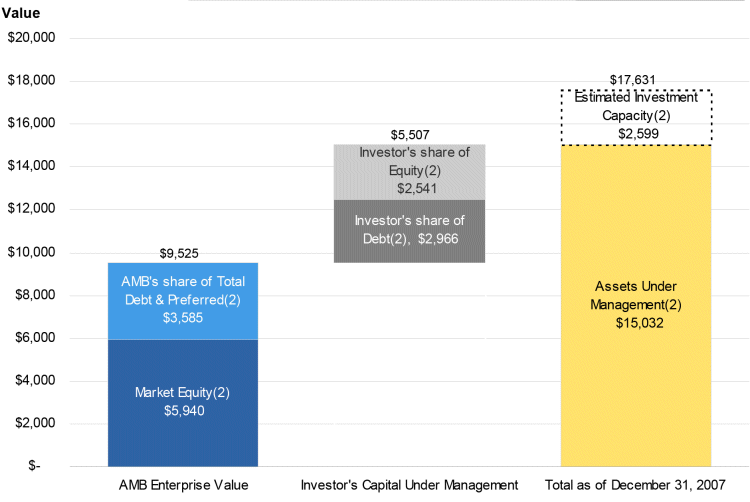
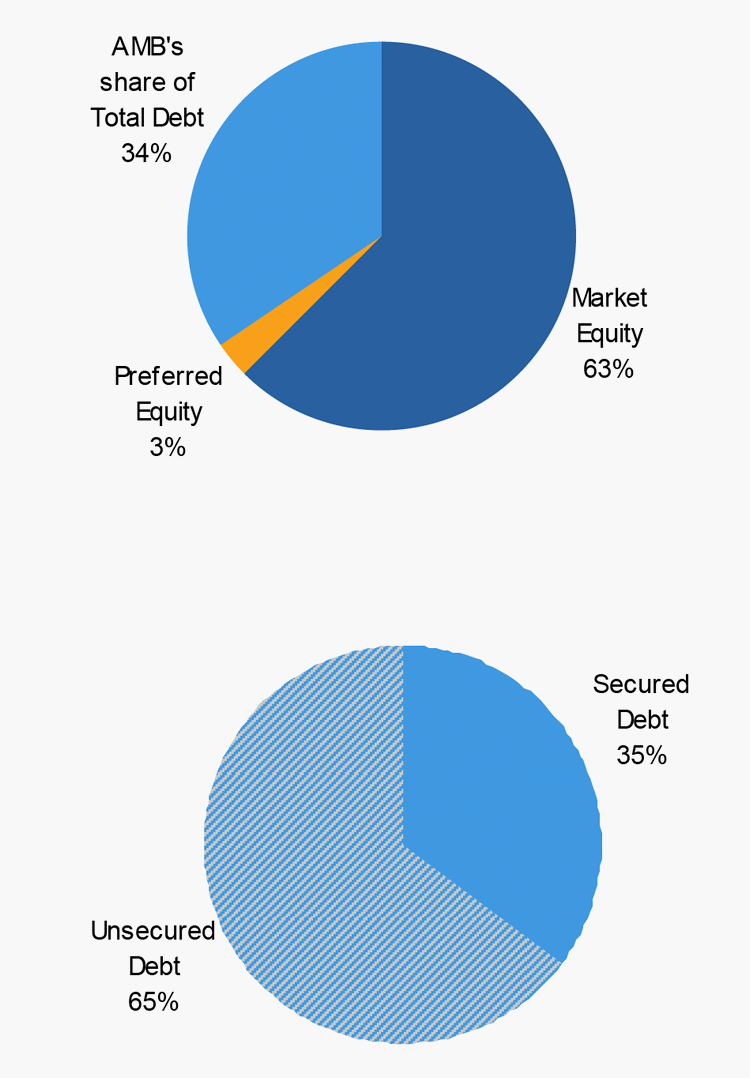
Capitalization Summary (dollars in millions) |
SUPPLEMENTAL ANALYST PACKAGE 2007 Fourth Quarter Earnings Conference Call |
||
| Quarter ended | Year ended | |||||||
| December 31, 2007 | December 31, 2007 | |||||||
Interest coverage(2) |
6.1 | x | 4.9 | x | ||||
Fixed charge coverage(2) |
3.3 | x | 2.7 | x | ||||
FFO payout(2) |
41.7 | % | 57.0 | % | ||||
AMB’s share of total debt-to-total market capitalization(2) |
34.4 | % | 34.4 | % | ||||
| (1) | Debt amounts represents AMB’s share of debt and preferred securities. | |
| (2) | See reporting definitions and supplemental financial measures disclosures. |
| Overview | Financial Results | Operations | Capital Deployment | Private Capital | Capitalization | NAV | Reporting Definitions | 19 |
|
|
Capitalization Detail (dollars in thousands, except share price) |
SUPPLEMENTAL ANALYST PACKAGE 2007 Fourth Quarter Earnings Conference Call |
||
| AMB | Co-investment | Unsecured | ||||||||||||||||||||||
| Secured | Venture | Senior | Credit | Other | Total | |||||||||||||||||||
| Debt | Debt | Debt | Facilities(1) | Debt | Debt | |||||||||||||||||||
2008 |
$ | 199,970 | $ | 98,989 | $ | 175,000 | $ | — | $ | 13,408 | $ | 487,367 | ||||||||||||
2009 |
25,799 | 122,671 | 100,000 | — | 873 | 249,343 | ||||||||||||||||||
2010 |
65,905 | 102,661 | 250,000 | 658,928 | 941 | 1,078,435 | ||||||||||||||||||
2011 |
115 | 189,420 | 75,000 | 217,177 | 1,014 | 482,726 | ||||||||||||||||||
2012 |
3,753 | 459,111 | — | — | 61,093 | 523,957 | ||||||||||||||||||
2013 |
3,053 | 46,195 | 175,000 | — | 65,920 | 290,168 | ||||||||||||||||||
2014 |
3,216 | 4,102 | — | — | 616 | 7,934 | ||||||||||||||||||
2015 |
3,387 | 18,806 | 112,491 | — | 664 | 135,348 | ||||||||||||||||||
2016 |
3,567 | 54,795 | — | — | — | 58,362 | ||||||||||||||||||
Thereafter |
42,267 | 19,091 | 125,000 | — | — | 186,358 | ||||||||||||||||||
Subtotal |
$ | 351,032 | $ | 1,115,841 | $ | 1,012,491 | $ | 876,105 | $ | 144,529 | $ | 3,499,998 | ||||||||||||
Unamortized premiums/(discount) |
1,027 | 3,187 | (9,368 | ) | — | — | (5,154 | ) | ||||||||||||||||
Total consolidated debt |
$ | 352,059 | $ | 1,119,028 | $ | 1,003,123 | $ | 876,105 | $ | 144,529 | $ | 3,494,844 | ||||||||||||
AMB’s share of unconsolidated
co-investment venture debt(2)(4) |
— | 556,710 | — | — | 36,368 | 593,078 | ||||||||||||||||||
Total debt |
$ | 352,059 | $ | 1,675,738 | $ | 1,003,123 | $ | 876,105 | $ | 180,897 | $ | 4,087,922 | ||||||||||||
Co-investment venture partners’
share of consolidated debt(4) |
— | (715,409 | ) | — | — | (100,000 | ) | (815,409 | ) | |||||||||||||||
AMB’s share of total debt(4) |
$ | 352,059 | $ | 960,329 | $ | 1,003,123 | $ | 876,105 | $ | 80,897 | $ | 3,272,513 | ||||||||||||
Weighted average interest rate |
4.0 | % | 6.1 | % | 6.1 | % | 3.4 | % | 6.0 | % | 5.2 | % | ||||||||||||
Weighted average maturity (years) |
2.4 | 4.1 | 4.2 | 2.7 | 4.6 | 3.6 | ||||||||||||||||||
| Market Equity | ||||||||||||
| Security | Shares | Price | Value | |||||||||
Common Stock |
99,210,508 | $ | 57.56 | $ | 5,710,557 | |||||||
LP Units |
3,992,607 | 57.56 | 229,814 | |||||||||
Total |
103,203,115 | $ | 5,940,371 | |||||||||
| Preferred Stock and Units(3) | ||||||||
| Dividend | Liquidation | |||||||
| Security | Rate | Preference | ||||||
Series D preferred units |
7.18 | % | $ | 79,767 | ||||
Series L preferred stock |
6.50 | % | 50,000 | |||||
Series M preferred stock |
6.75 | % | 57,500 | |||||
Series O preferred stock |
7.00 | % | 75,000 | |||||
Series P preferred stock |
6.85 | % | 50,000 | |||||
Weighted Average/Total |
6.90 | % | $ | 312,267 | ||||
| Capitalization Ratios | ||||
Total debt-to-total market capitalization(4) |
39.5 | % | ||
AMB’s share of total debt-to-total market
capitalization(4) |
34.4 | % | ||
Total debt plus preferred-to-total market capitalization(4) |
42.6 | % | ||
AMB’s share of total debt plus preferred-to- |
||||
AMB’s share of total market capitalization(4) |
37.6 | % | ||
| (1) | Represents three credit facilities with total capacity of approximately $1.5 billion. Includes $432.7 million, $197.3 million, $84.3 million, $82.0 million and $19.9 million in Yen, Canadian dollar, Euro, British Pounds and Singapore dollar based borrowings, respectively, translated to U.S. Dollars using the foreign exchange rates at December 31, 2007. | |
| (2) | The weighted average interest and maturity for the unconsolidated co-investment venture debt are 4.8% and 5.4 years, respectively. | |
| (3) | Units are exchangeable under certain circumstances by the unitholder for preferred stock and redeemable at the option of AMB after a non-call period, five years from issuance. | |
| (4) | See reporting definitions and supplemental financial measures disclosures. |
| Overview | Financial Results | Operations | Capital Deployment | Private Capital | Capitalization | NAV | Reporting Definitions | 20 |
|
|
Supplemental Information for Net Asset Value Analysis (NAV) (dollars in millions, except per share amounts) |
SUPPLEMENTAL ANALYST PACKAGE 2007 Fourth Quarter Earnings Conference Call |
||
| Actual | Projected | |||||||
| Quarter ended | ||||||||
| December 31, 2007 | 2008 | |||||||
Real Estate: |
||||||||
Wholly owned property cash NOI(1) |
$ | 72.7 | ||||||
Total cash NOI from co-investment ventures(1) |
$ | 108.8 | ||||||
AMB’s share of co-investment ventures(1) |
27.5 | % | ||||||
AMB’s share of cash NOI from co-investment ventures(1) |
$ | 29.9 | ||||||
AMB’s share of transaction adjustments(1)(2) |
$ | (5.6) | ||||||
Total AMB share of cash NOI(1) |
$ | 97.0 | ||||||
Development platform: |
||||||||
Development starts |
$ | 1,350.0 | ||||||
Average development margin(1) |
12%-15 | % | ||||||
Private capital platform: |
||||||||
Total private capital revenue per common share and unit (diluted) |
$ | 0.09 | $ | 0.52-$0.59 | ||||
Incentive distributions per common share and unit (diluted) |
$ | 0.01 | $ | 0.20-$0.25 | ||||
FFO per common share and unit (diluted)(1) |
$ | 1.20 | $ | 3.85-$4.05 | ||||
| As of | ||||
| AMB‘s share of:(1) | December 31, 2007 | |||
Development, land, and contributed assets: |
||||
Development pipeline (funded-to-date) |
$ | 1.1 | ||
Development projects held for contribution or sale |
301.5 | |||
Land held for future development |
470.9 | |||
Assets contributed to co-investment ventures |
18.9 | |||
Debt and preferred securities: |
||||
Total debt |
$ | 3,272.5 | ||
Preferred securities |
312.3 | |||
Other balance sheet items: |
||||
Cash and cash equivalents |
$ | 292.7 | ||
Accounts receivable (net) and other assets |
330.4 | |||
Deferred rents receivable and deferred financing costs (net) |
(73.7 | ) | ||
Accounts payable and other liabilities |
(347.0 | ) | ||
| (1) | See reporting definitions and supplemental financial measures disclosures. | |
| (2) | Transaction activity adjustments to NOI stabilizes NOI for acquisitions and removes NOI generated from in-progress developments, contributed developments, and projects held for sale or contribution. |
| Overview | Financial Results | Operations | Capital Deployment | Private Capital | Capitalization | NAV | Reporting Definitions | 21 |
|
|
Reporting Definitions / Supplemental Financial Measures |
SUPPLEMENTAL ANALYST PACKAGE 2007 Fourth Quarter Earnings Conference Call |
||
| For the Quarters ended | For the Years ended | |||||||||||||||
| December 31, | December 31, | |||||||||||||||
| 2007 | 2006 | 2007 | 2006 | |||||||||||||
Net income |
$ | 97,199 | $ | 87,755 | $ | 314,260 | $ | 224,072 | ||||||||
Depreciation and amortization |
40,093 | 42,079 | 161,925 | 174,721 | ||||||||||||
Impairment losses |
900 | 918 | 1,157 | 6,312 | ||||||||||||
Stock-based compensation amortization |
2,530 | 6,350 | 16,047 | 20,736 | ||||||||||||
Adjustments
to derive adjusted EBITDA from unconsolidated co-investment ventures: |
||||||||||||||||
AMB’s
share of net income |
(181 | ) | (10,635 | ) | (7,467 | ) | (23,240 | ) | ||||||||
AMB’s share of FFO |
6,083 | 6,703 | 27,391 | 16,038 | ||||||||||||
AMB’s share of interest expense |
5,395 | 3,823 | 19,745 | 10,424 | ||||||||||||
Interest expense, including amortization |
30,551 | 37,600 | 126,945 | 165,087 | ||||||||||||
Total minority interests’ share of income |
16,899 | 15,801 | 54,845 | 61,632 | ||||||||||||
Total discontinued operations, including gains |
(8,419 | ) | (22,930 | ) | (95,233 | ) | (60,852 | ) | ||||||||
Adjusted EBITDA attributable to minority interests |
(37,744 | ) | (30,701 | ) | (129,613 | ) | (147,050 | ) | ||||||||
Discontinued operations’ adjusted EBITDA |
2,282 | 5,831 | 10,690 | 23,330 | ||||||||||||
Adjusted EBITDA |
$ | 155,588 | $ | 142,594 | $ | 500,692 | $ | 471,210 | ||||||||
| Overview | Financial Results | Operations | Capital Deployment | Private Capital | Capitalization | NAV | Reporting Definitions | 22 |
|
|
Reporting Definitions / Supplemental Financial Measures |
SUPPLEMENTAL ANALYST PACKAGE 2007 Fourth Quarter Earnings Conference Call |
||
| Quarter ended | ||||
| December 31, 2007 | ||||
| 2007 | ||||
NOI |
$ | 116,982 | ||
Straight-line rents and amortization of lease intangibles |
(4,479 | ) | ||
Consolidated co-investment venture cash NOI |
(39,768 | ) | ||
Wholly-owned property cash NOI |
72,735 | |||
AMB’s share of consolidated co-investment venture cash NOI |
11,551 | |||
AMB’s share of unconsolidated co-investment venture cash NOI |
18,335 | |||
AMB’s share of transaction adjustments |
(5,584 | ) | ||
AMB’s share of cash-basis NOI |
$ | 97,037 | ||
| For the Quarters ended | For the Years ended | |||||||||||||||
| December 31, | December 31, | |||||||||||||||
| Fixed charge | 2007 | 2006 | 2007 | 2006 | ||||||||||||
Interest expense, including amortization — continuing operations |
$ | 30,551 | $ | 37,600 | $ | 126,945 | $ | 165,087 | ||||||||
Amortization of financing costs and debt premiums — continuing operations |
(2,303 | ) | (1,923 | ) | (5,811 | ) | (7,674 | ) | ||||||||
Interest expense, including amortization — discontinued operations |
— | (465 | ) | (1,170 | ) | (1,397 | ) | |||||||||
Amortization of financing costs and debt premiums — discontinued operations |
— | (18 | ) | (2 | ) | (45 | ) | |||||||||
Co-investment partner’s share of interest expense |
(10,439 | ) | (9,239 | ) | (43,741 | ) | (52,802 | ) | ||||||||
AMB’s share of interest expense from unconsolidated co-investment ventures |
5,395 | 3,823 | 19,745 | 10,424 | ||||||||||||
Capitalized interest |
18,419 | 13,004 | 64,014 | 42,938 | ||||||||||||
Preferred unit distributions |
1,432 | 3,646 | 8,042 | 16,462 | ||||||||||||
Preferred stock dividends |
3,950 | 3,951 | 15,806 | 13,582 | ||||||||||||
Total fixed charge |
$ | 47,005 | $ | 50,379 | $ | 183,828 | $ | 186,575 | ||||||||
| Overview | Financial Results | Operations | Capital Deployment | Private Capital | Capitalization | NAV | Reporting Definitions | 23 |
|
|
Reporting Definitions / Supplemental Financial Measures |
SUPPLEMENTAL ANALYST PACKAGE 2007 Fourth Quarter Earnings Conference Call |
||
| 2008 | ||||||||||
| Low | High | |||||||||
Projected net income |
$ | 2.80 | $ | 3.00 | ||||||
AMB’s share of projected depreciation and amortization |
1.44 | 1.46 | ||||||||
AMB’s share of projected gains on disposition of operating properties |
(0.32 | ) | (0.34 | ) | ||||||
Impact of additional dilutive securities, other, rounding |
(0.07 | ) | (0.07 | ) | ||||||
Projected Funds From Operations (FFO) |
$ | 3.85 | $ | 4.05 | ||||||
| For the Quarters ended | For the Years ended | |||||||||||||||
| December 31, | December 31, | |||||||||||||||
| Interest | 2007 | 2006 | 2007 | 2006 | ||||||||||||
Interest expense, including amortization — continuing operations |
$ | 30,551 | $ | 37,600 | $ | 126,945 | $ | 165,087 | ||||||||
Interest expense, including amortization — discontinued operations |
— | (465 | ) | (1,170 | ) | (1,397 | ) | |||||||||
Co-investment venture partner’s share of interest expense |
(10,439 | ) | (9,239 | ) | (43,741 | ) | (52,802 | ) | ||||||||
AMB’s share of interest expense from unconsolidated co-investment ventures |
5,395 | 3,823 | 19,745 | 10,424 | ||||||||||||
Total interest |
$ | 25,507 | $ | 31,719 | $ | 101,779 | $ | 121,312 | ||||||||
| Overview | Financial Results | Operations | Capital Deployment | Private Capital | Capitalization | NAV | Reporting Definitions | 24 |
|
|
Reporting Definitions / Supplemental Financial Measures |
SUPPLEMENTAL ANALYST PACKAGE 2007 Fourth Quarter Earnings Conference Call |
||
| For the Quarters ended | For the Years ended | |||||||||||||||
| December 31, | December 31, | |||||||||||||||
| 2007 | 2006 | 2007 | 2006 | |||||||||||||
Net income |
$ | 97,199 | $ | 87,755 | $ | 314,260 | $ | 224,072 | ||||||||
Private capital income |
(9,700 | ) | (28,563 | ) | (31,707 | ) | (46,102 | ) | ||||||||
Depreciation and amortization |
40,093 | 42,079 | 161,925 | 174,721 | ||||||||||||
Impairment losses |
900 | 918 | 1,157 | 6,312 | ||||||||||||
General and administrative and fund costs |
34,548 | 30,934 | 130,586 | 106,160 | ||||||||||||
Total other income and expenses |
(3,226 | ) | (11,182 | ) | (95,465 | ) | 26,229 | |||||||||
Total minority interests’ share of income |
16,899 | 15,801 | 54,845 | 61,632 | ||||||||||||
Total discontinued operations |
(59,731 | ) | (22,930 | ) | (71,702 | ) | (60,852 | ) | ||||||||
NOI |
116,982 | 114,812 | 463,899 | 492,172 | ||||||||||||
Less non same-store NOI |
(13,855 | ) | (15,968 | ) | (61,639 | ) | (104,147 | ) | ||||||||
Less non cash adjustments(1) |
(414 | ) | (1,002 | ) | (2,861 | ) | (9,502 | ) | ||||||||
Cash-basis same-store NOI |
$ | 102,713 | $ | 97,842 | $ | 399,399 | $ | 378,523 | ||||||||
| (1) | Non-cash adjustments include straight line rents and amortization of lease intangibles for the same store pool only. |
| Overview | Financial Results | Operations | Capital Deployment | Private Capital | Capitalization | NAV | Reporting Definitions | 25 |
|
|
Contacts |
SUPPLEMENTAL ANALYST PACKAGE 2007 Fourth Quarter Earnings Conference Call |
||
| Contact Name | Title | Phone | E-mail Address | |||
Hamid R. Moghadam
|
Chairman & Chief Executive Officer | (415) 733-9401 | hmoghadam@amb.com | |||
Thomas S. Olinger
|
Chief Financial Officer | (415) 733-9405 | tolinger@amb.com | |||
Guy F. Jaquier
|
President, Europe and Asia | (415) 733-9406 | gjaquier@amb.com | |||
Eugene F. Reilly
|
President, The Americas | (617) 619-9333 | ereilly@amb.com | |||
John T. Roberts, Jr.
|
President, Private Capital; President, AMB Capital Partners, LLC | (415) 733-9408 | jroberts@amb.com | |||
Margan S. Mitchell
|
VP, Corporate Communications | (415) 733-9477 | mmitchell@amb.com | |||
Tracy A. Ward
|
Director, Investor Relations | (415) 733-9565 | tward@amb.com |
| Corporate Headquarters | Investor Relations | Other Office Locations | ||||||||
AMB Property Corporation
|
Tel: (415) 394-9000 | Amsterdam | Dallas | Narita | Shanghai | |||||
Pier 1, Bay 1
|
Fax: (415) 394-9001 | Atlanta | Delhi | New Jersey | Shenzhen | |||||
San Francisco, CA 94111
|
E-mail: ir@amb.com | Baltimore | Frankfurt | New York | Singapore | |||||
Tel: (415) 394-9000
|
Website: www.amb.com | Beijing | Los Angeles | Osaka | Tokyo | |||||
Fax: (415) 394-9001
|
Boston | Menlo Park | Paris | Vancouver | ||||||
| Chicago | Nagoya | Seoul | ||||||||
| Overview | Financial Results | Operations | Capital Deployment | Private Capital | Capitalization | NAV | Reporting Definitions | 26 |
|
|
Forward Looking Statements |
SUPPLEMENTAL ANALYST PACKAGE 2007 Fourth Quarter Earnings Conference Call |
||