|
SUPPLEMENTAL ANALYST PACKAGE 2007 Third Quarter Earnings Conference Call |
Financial Highlights |
1 | |||
Consolidated Balance Sheets |
2 | |||
Consolidated Statements of Operations |
3 | |||
Consolidated Statements of Funds from Operations |
4 | |||
Supplemental Cash Flow Information |
5 | |||
Owned & Managed Operating Statistics, Top 10 Customers & Lease Expirations |
6 | |||
Principal Global Markets |
7 | |||
Portfolio Overview |
8 | |||
Capital Deployment |
9 | |||
Property Contributions & Dispositions |
11 | |||
Development Projects in Process |
12 | |||
Development Projects Placed in Operations and Projects Available for Sale or Contribution |
15 | |||
Land Inventory |
16 | |||
Capitalization Summary |
17 | |||
Unconsolidated & Consolidated Joint Ventures |
18 | |||
Supplemental Information for Net Asset Value Analysis |
19 | |||
Reporting Definitions |
20 | |||
Supplemental Financial Measures Disclosures |
21 | |||
Joint Venture Partner Information |
24 | |||
Contacts |
25 |
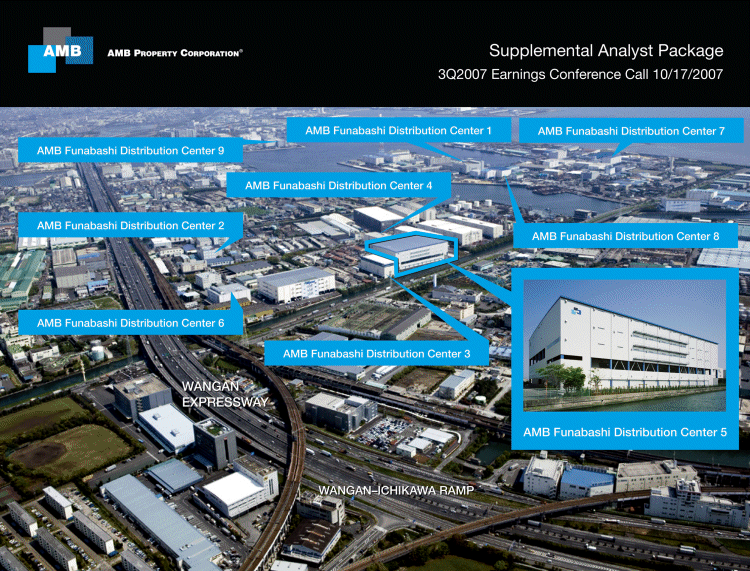
| Cover: | AMB Funabashi Distribution Center 5 has been contributed to AMB Japan Fund I. The 469,627 square foot multi-story facility is proximate to the Wangan Expressway that connects the Narita International Airport to the Tokyo CBD. AMB’s portfolio in the Funabashi submarket of Tokyo totals 1.8 million square feet. |
|
|
SUPPLEMENTAL ANALYST PACKAGE 2007 Third Quarter Earnings Conference Call |
| Quarters Ended September 30, | Nine Months Ended September 30, | |||||||||||||||||||||||
| 2007 | Change | 2006 | 2007 | Change | 2006 | |||||||||||||||||||
Operating Data |
||||||||||||||||||||||||
Revenues |
$ | 166,304 | (7.8 | %) | $ | 180,335 | (1) | $ | 499,830 | (5.3 | %) | $ | 527,577 | (1) | ||||||||||
Adjusted EBITDA (2) |
165,782 | 10.2 | % | 150,503 | 436,973 | (1.8 | %) | 444,965 | ||||||||||||||||
Net income available to common stockholders |
69,155 | 130.8 | % | 29,963 | 202,275 | 60.9 | % | 125,682 | ||||||||||||||||
FFO (2) |
104,235 | 52.6 | % | 68,286 | 239,582 | 20.2 | % | 199,380 | ||||||||||||||||
Per diluted share and unit: |
||||||||||||||||||||||||
EPS |
$ | 0.69 | 109.1 | % | $ | 0.33 | $ | 2.04 | 46.8 | % | $ | 1.39 | ||||||||||||
FFO (2) |
0.99 | 37.5 | % | 0.72 | 2.31 | 10.0 | % | 2.10 | ||||||||||||||||
Dividends per common share |
0.50 | 8.7 | % | 0.46 | 1.50 | 8.7 | % | 1.38 | ||||||||||||||||
Ratios |
||||||||||||||||||||||||
Interest coverage (2) |
4.7 x | 3.3 x | 4.0 x | 3.3 x | ||||||||||||||||||||
Fixed charge coverage (2) |
3.1 x | 2.4 x | 2.6 x | 2.5 x | ||||||||||||||||||||
FFO payout |
51 | % | 64 | % | 65 | % | 66 | % | ||||||||||||||||
| As of | ||||||||
| September 30, 2007 | December 31, 2006 | |||||||
Capitalization |
||||||||
AMB’s share of total debt (2) |
$ | 3,049,098 | $ | 3,088,624 | ||||
Preferred equity |
312,267 | 417,767 | ||||||
Market equity |
6,163,731 | 5,531,113 | ||||||
Total capitalization |
$ | 9,525,096 | $ | 9,037,504 | ||||
Ratios |
||||||||
AMB’s share of total debt-to-AMB’s share of total book capitalization (2) (3) |
51.4 | % | 55.8 | % | ||||
AMB’s share of total debt-to-AMB’s share of total market capitalization (2) (3) |
32.0 | % | 34.2 | % | ||||
Total common shares and units outstanding |
103,055,202 | 94,371,491 | ||||||
| (1) | Effective October 1, 2006, AMB deconsolidated AMB Alliance Fund III on a prospective basis. Pro forma revenues for the quarter and nine months ended September 30, 2006 would have been $160,262 and $473,935, respectively, if AMB Institutional Alliance Fund III had been deconsolidated as of January 1, 2006. | |
| (2) | See Supplemental Financial Measures Disclosures. | |
| (3) | See Reporting Definitions. |
1
|
|
SUPPLEMENTAL ANALYST PACKAGE 2007 Third Quarter Earnings Conference Call |
| As of | ||||||||
| September 30, 2007 | December 31, 2006 | |||||||
Assets |
||||||||
Investments in real estate: |
||||||||
Total investments in properties |
$ | 6,548,426 | $ | 6,575,733 | ||||
Accumulated depreciation |
(884,336 | ) | (789,693 | ) | ||||
Net investments in properties |
5,664,090 | 5,786,040 | ||||||
Investments in unconsolidated joint ventures |
360,272 | 274,381 | ||||||
Properties held for contribution, net |
258,568 | 154,036 | ||||||
Properties held for divestiture, net |
63,733 | 20,916 | ||||||
Net investments in real estate |
6,346,663 | 6,235,373 | ||||||
Cash and cash equivalents and restricted cash |
400,011 | 195,878 | ||||||
Accounts receivable, net |
159,269 | 133,998 | ||||||
Other assets |
157,235 | 148,263 | ||||||
Total assets |
$ | 7,063,178 | $ | 6,713,512 | ||||
Liabilities and stockholders’ equity |
||||||||
Secured debt |
$ | 1,364,557 | $ | 1,395,354 | ||||
Unsecured senior debt |
1,002,810 | 1,101,874 | ||||||
Unsecured credit facilities |
818,325 | 852,033 | ||||||
Other debt |
145,104 | 88,154 | ||||||
Accounts payable and other liabilities |
333,034 | 271,880 | ||||||
Total liabilities |
3,663,830 | 3,709,295 | ||||||
Minority interests: |
||||||||
Joint venture partners |
516,948 | 555,201 | ||||||
Preferred unitholders |
77,561 | 180,298 | ||||||
Limited partnership unitholders |
103,773 | 102,061 | ||||||
Total minority interests |
698,282 | 837,560 | ||||||
Stockholders’ equity: |
||||||||
Common equity |
2,477,654 | 1,943,240 | ||||||
Preferred equity |
223,412 | 223,417 | ||||||
Total stockholders’ equity |
2,701,066 | 2,166,657 | ||||||
Total liabilities and stockholders’ equity |
$ | 7,063,178 | $ | 6,713,512 | ||||
2
|
|
SUPPLEMENTAL ANALYST PACKAGE 2007 Third Quarter Earnings Conference Call |
| For the Quarters Ended | For the Nine Months Ended | |||||||||||||||
| September 30, | September 30, | |||||||||||||||
| 2007 | 2006 | 2007 | 2006 | |||||||||||||
Revenues |
||||||||||||||||
Rental revenues (1) |
$ | 158,740 | $ | 172,845 | $ | 477,823 | $ | 510,038 | ||||||||
Private capital income |
7,564 | 7,490 | 22,007 | 17,539 | ||||||||||||
Total revenues |
166,304 | 180,335 | 499,830 | 527,577 | ||||||||||||
Costs and expenses |
||||||||||||||||
Property operating costs (1) |
(43,028 | ) | (44,540 | ) | (129,926 | ) | (131,671 | ) | ||||||||
Depreciation and amortization |
(40,865 | ) | (46,914 | ) | (122,433 | ) | (133,514 | ) | ||||||||
Impairment losses |
— | — | (257 | ) | (5,394 | ) | ||||||||||
General and administrative |
(35,145 | ) | (25,641 | ) | (95,259 | ) | (73,638 | ) | ||||||||
Other expenses (2) |
(944 | ) | (893 | ) | (2,995 | ) | (1,134 | ) | ||||||||
Fund costs |
(261 | ) | (495 | ) | (779 | ) | (1,588 | ) | ||||||||
Total costs and expenses |
(120,243 | ) | (118,483 | ) | (351,649 | ) | (346,939 | ) | ||||||||
Other income and expenses |
||||||||||||||||
Equity in earnings of unconsolidated joint ventures (3) |
3,425 | 2,239 | 7,286 | 12,605 | ||||||||||||
Other income (2) |
7,956 | 2,911 | 20,012 | 8,716 | ||||||||||||
Gains from sale or contribution of real estate interests, net |
— | — | 74,843 | — | ||||||||||||
Development profits, net of taxes |
48,298 | 23,517 | 89,486 | 69,889 | ||||||||||||
Interest expense, including amortization |
(28,896 | ) | (43,966 | ) | (96,394 | ) | (127,487 | ) | ||||||||
Total other income and expenses |
30,783 | (15,299 | ) | 95,233 | (36,277 | ) | ||||||||||
Income from operations before minority interests |
76,844 | 46,553 | 243,414 | 144,361 | ||||||||||||
Minority interests’ share of income: |
||||||||||||||||
Joint venture partners’ share of income |
(5,889 | ) | (12,014 | ) | (21,149 | ) | (29,310 | ) | ||||||||
Joint venture partners’ and limited partnership unitholders’ share of development profits |
(2,115 | ) | (1,150 | ) | (5,196 | ) | (2,735 | ) | ||||||||
Preferred unitholders |
(1,431 | ) | (3,791 | ) | (6,610 | ) | (12,816 | ) | ||||||||
Limited partnership unitholders |
(614 | ) | 17 | (4,998 | ) | (994 | ) | |||||||||
Total minority interests’ share of income |
(10,049 | ) | (16,938 | ) | (37,953 | ) | (45,855 | ) | ||||||||
Income from continuing operations |
66,795 | 29,615 | 205,461 | 98,506 | ||||||||||||
Discontinued operations: |
||||||||||||||||
Income attributable to discontinued operations, net of minority interests |
2,403 | 3,559 | 7,271 | 13,476 | ||||||||||||
Gains from disposition of real estate, net of minority interests |
3,912 | 213 | 4,329 | 24,335 | ||||||||||||
Total discontinued operations |
6,315 | 3,772 | 11,600 | 37,811 | ||||||||||||
Net income |
73,110 | 33,387 | 217,061 | 136,317 | ||||||||||||
Preferred stock dividends |
(3,952 | ) | (3,440 | ) | (11,856 | ) | (9,631 | ) | ||||||||
Preferred unit redemption (issuance costs) discount
|
(3 | ) | 16 | (2,930 | ) | (1,004 | ) | |||||||||
Net income available to common stockholders |
$ | 69,155 | $ | 29,963 | $ | 202,275 | $ | 125,682 | ||||||||
Net income per common share (diluted) |
$ | 0.69 | $ | 0.33 | $ | 2.04 | $ | 1.39 | ||||||||
Weighted average common shares (diluted) |
100,914,340 | 91,058,029 | 99,311,137 | 90,458,810 | ||||||||||||
| (1) | Effective October 1, 2006, AMB deconsolidated AMB Alliance Fund III on a prospective basis. Pro forma rental revenues for the quarter and nine months ended September 30, 2006 would have been $152,772 and $456,396, respectively, if AMB Institutional Alliance Fund III had been deconsolidated as of January 1, 2006. Pro forma property operating costs for the quarter and nine months ended September 30, 2006 would have been $40,298 and $118,974, respectively, if AMB Institutional Alliance Fund III had been deconsolidated as of January 1, 2006. | |
| (2) | Includes changes in liabilities and assets associated with AMB’s deferred compensation plan. | |
| (3) | There were no gains on sale of operating properties for the quarters ended September 30, 2007 and 2006. Includes gains on sale of operating properties of $0.0 million and $8.3 million, for the nine months ended September 30, 2007 and 2006, respectively. |
3
|
|
SUPPLEMENTAL ANALYST PACKAGE 2007 Third Quarter Earnings Conference Call |
| For the Quarters Ended | For the Nine Months Ended | |||||||||||||||
| September 30, | September 30, | |||||||||||||||
| 2007 | 2006 | 2007 | 2006 | |||||||||||||
Net income available to common stockholders |
$ | 69,155 | $ | 29,963 | $ | 202,275 | $ | 125,682 | ||||||||
Gains from sale or contribution of real estate, net of minority interests |
(3,912 | ) | (213 | ) | (79,172 | ) | (24,335 | ) | ||||||||
Depreciation and amortization: |
||||||||||||||||
Total depreciation and amortization |
40,865 | 46,914 | 122,433 | 133,514 | ||||||||||||
Discontinued operations’ depreciation |
117 | 1,810 | 1,061 | 2,916 | ||||||||||||
Non-real estate depreciation |
(1,387 | ) | (1,001 | ) | (3,965 | ) | (3,069 | ) | ||||||||
Adjustments to derive FFO from consolidated JVs: |
||||||||||||||||
Joint venture partners’ minority interests (Net income) |
5,889 | 12,014 | 21,149 | 29,310 | ||||||||||||
Limited partnership unitholders’ minority interests (Net income (loss)) |
614 | (17 | ) | 4,998 | 994 | |||||||||||
Limited partnership unitholders’ minority interests (Development profits) |
2,115 | 1,086 | 3,861 | 3,260 | ||||||||||||
Discontinued operations’ minority interests (Net income) |
107 | 410 | 267 | 1,032 | ||||||||||||
FFO attributable to minority interests |
(15,731 | ) | (24,471 | ) | (47,347 | ) | (66,654 | ) | ||||||||
Adjustments to derive FFO from unconsolidated JVs: |
||||||||||||||||
AMB’s share of net income |
(3,425 | ) | (2,239 | ) | (7,286 | ) | (12,605 | ) | ||||||||
AMB’s share of FFO |
9,828 | 4,030 | 21,308 | 9,335 | ||||||||||||
Funds from operations |
$ | 104,235 | $ | 68,286 | $ | 239,582 | $ | 199,380 | ||||||||
FFO per common share and unit (diluted) |
$ | 0.99 | $ | 0.72 | $ | 2.31 | $ | 2.10 | ||||||||
Weighted average common share and unit (diluted) |
105,109,868 | 95,117,597 | 103,777,347 | 94,734,736 | ||||||||||||
Estimated FFO by business line (1) |
||||||||||||||||
Capital Partners FFO per common share and unit (diluted) (1) |
$ | 0.03 | $ | 0.04 | $ | 0.10 | $ | 0.09 | ||||||||
% of reported FFO |
3.0 | % | 5.6 | % | 4.3 | % | 4.3 | % | ||||||||
Development FFO per common share and unit (diluted) (1) |
$ | 0.43 | $ | 0.21 | $ | 0.79 | $ | 0.69 | ||||||||
% of reported FFO |
43.4 | % | 29.3 | % | 34.2 | % | 32.8 | % | ||||||||
Real estate operations FFO per common share and unit (diluted) (1) |
$ | 0.53 | $ | 0.47 | $ | 1.42 | $ | 1.32 | ||||||||
% of reported FFO |
53.6 | % | 65.1 | % | 61.5 | % | 62.9 | % | ||||||||
Total FFO
per common share and unit (diluted) |
$ | 0.99 | $ | 0.72 | $ | 2.31 | $ | 2.10 | ||||||||
| (1) | See Supplemental Financial Measures Disclosure. |
4
|
|
SUPPLEMENTAL ANALYST PACKAGE 2007 Third Quarter Earnings Conference Call |
| For the Quarters Ended | For the Nine Months Ended | |||||||||||||||
| September 30, | September 30, | |||||||||||||||
| 2007 | 2006 | 2007 | 2006 | |||||||||||||
AMB’s Owned and Managed Portfolio: (1) (2) |
||||||||||||||||
Supplemental Information: |
||||||||||||||||
Straight-line rents and amortization of lease intangibles |
$ | 6,246 | $ | 5,966 | $ | 14,204 | $ | 17,569 | ||||||||
AMB’s share of straight-line rents and amortization of lease intangibles |
$ | 4,039 | $ | 3,859 | $ | 9,438 | $ | 12,997 | ||||||||
Gross lease termination fees |
$ | 1,100 | $ | 406 | $ | 1,803 | $ | 6,456 | ||||||||
Net lease termination fees (3) |
$ | 1,045 | $ | 296 | $ | 1,766 | $ | 6,282 | ||||||||
AMB’s share of net lease termination fees |
$ | 546 | $ | 177 | $ | 1,181 | $ | 6,069 | ||||||||
Recurring capital expenditures: |
||||||||||||||||
Tenant improvements |
$ | 6,655 | $ | 4,887 | $ | 15,808 | $ | 13,385 | ||||||||
Lease commissions and other lease costs |
5,562 | 5,723 | 19,065 | 18,589 | ||||||||||||
Building improvements |
10,123 | 13,076 | 24,475 | 30,302 | ||||||||||||
Sub-total |
22,340 | 23,686 | 59,348 | 62,276 | ||||||||||||
JV Partners’ share of capital expenditures |
(6,508 | ) | (5,864 | ) | (17,747 | ) | (16,720 | ) | ||||||||
AMB’s share of recurring capital expenditures |
$ | 15,832 | $ | 17,822 | $ | 41,601 | $ | 45,556 | ||||||||
AMB’s Consolidated Portfolio: |
||||||||||||||||
Supplemental Information: |
||||||||||||||||
Straight-line rents and amortization of lease intangibles |
$ | 3,817 | $ | 4,890 | $ | 8,767 | $ | 16,190 | ||||||||
AMB’s share of straight-line rents and amortization of lease intangibles |
$ | 3,554 | $ | 3,644 | $ | 8,352 | $ | 12,721 | ||||||||
Gross lease termination fees |
$ | 519 | $ | 406 | $ | 1,158 | $ | 6,456 | ||||||||
Net lease termination fees (3) |
$ | 464 | $ | 296 | $ | 1,123 | $ | 6,282 | ||||||||
AMB’s share of net lease termination fees |
$ | 431 | $ | 177 | $ | 1,053 | $ | 6,069 | ||||||||
Recurring capital expenditures: |
||||||||||||||||
Tenant improvements |
$ | 6,229 | $ | 4,891 | $ | 14,271 | $ | 13,317 | ||||||||
Lease commissions and other lease costs |
4,811 | 5,654 | 15,900 | 18,300 | ||||||||||||
Building improvements |
9,139 | 12,958 | 22,309 | 29,230 | ||||||||||||
Sub-total |
20,179 | 23,503 | 52,480 | 60,847 | ||||||||||||
JV Partners’ share of capital expenditures |
(4,742 | ) | (5,718 | ) | (12,297 | ) | (15,577 | ) | ||||||||
AMB’s share of recurring capital expenditures |
$ | 15,437 | $ | 17,785 | $ | 40,183 | $ | 45,270 | ||||||||
| (1) | See Reporting Definitions. |
|
| (2) | See Supplemental Financial Measures Disclosure for a discussion of owned and managed supplemental cash flow information. | |
| (3) | Net lease termination fees are defined as gross lease termination fees less the associated straight-line rent balance. |
5
|
|
SUPPLEMENTAL ANALYST PACKAGE 2007 Third Quarter Earnings Conference Call |
| Operating Portfolio | Quarter | Prior Quarter | ||||||
Square feet owned at September 30, 2007 |
114,030,439 | 111,335,628 | ||||||
Occupancy percentage |
95.5 | % | 96.1 | % | ||||
Average occupancy percentage |
95.4 | % | 94.9 | % | ||||
Weighted average lease terms (years): |
||||||||
Original |
6.1 | 6.0 | ||||||
Remaining |
3.5 | 3.4 | ||||||
Trailing four quarter tenant retention |
72.8 | % | 76.0 | % | ||||
| Quarter | Year-to-Date | |||||||
Same Space Leasing Activity: (2) |
||||||||
Rent increases on renewals and rollovers |
8.9 | % | 4.5 | % | ||||
Same space square footage commencing (millions) |
4.0 | 14.4 | ||||||
2nd Generation Leasing Activity: |
||||||||
TIs and LCs per square foot: |
||||||||
Retained |
$ | 0.94 | $ | 1.06 | ||||
Re-tenanted |
4.23 | 3.42 | ||||||
Weighted average |
$ | 2.22 | $ | 2.03 | ||||
Square footage commencing (millions) |
5.5 | 17.2 | ||||||
| Same Store Pool (1) | Quarter | Prior Quarter | ||||||
Square feet in same store pool at September 30, 2007 |
85,480,766 | 85,808,842 | ||||||
% of total square feet |
75.0 | % | 77.1 | % | ||||
Occupancy percentage at period end: |
||||||||
September 30, 2007 |
96.2 | % | 96.4 | % | ||||
September 30, 2006 |
96.1 | % | 95.6 | % | ||||
Weighted average lease terms (years): |
||||||||
Original |
6.1 | 6.1 | ||||||
Remaining |
3.1 | 3.2 | ||||||
Trailing four quarter tenant retention |
72.3 | % | 75.8 | % | ||||
| Quarter | Year-to-Date | |||||||
Same Space Leasing Activity: (2) |
||||||||
Rent increases on renewals and rollovers |
9.2 | % | 4.5 | % | ||||
Same space square footage commencing (millions) |
3.7 | 12.9 | ||||||
Cash basis NOI % change: (3) |
||||||||
Revenues (4) |
6.3 | % | 5.9 | % | ||||
Expenses (4) |
9.3 | % | 6.3 | % | ||||
NOI (3) (4) |
5.3 | % | 5.8 | % | ||||
NOI without lease termination fees (3) (4) |
5.1 | % | 5.7 | % | ||||
| % of | ||||||||||||||||||||
| Number | Aggregate | Aggregate | % of | |||||||||||||||||
| of | Rentable | Leased | Aggregate | |||||||||||||||||
| Customer Name (8) | Leases | Square Feet | Square Feet | ABR (1)(7) | ABR (1)(7) | |||||||||||||||
1. Deutsche Post World Net (DHL) (9) |
53 | 3,547,522 | 3.3 | % | $ | 26,837 | 3.6 | % | ||||||||||||
2. United States Government (9) (10) |
47 | 1,407,748 | 1.3 | % | 20,516 | 2.8 | % | |||||||||||||
3. FedEx Corporation (9) |
31 | 1,517,523 | 1.4 | % | 15,577 | 2.1 | % | |||||||||||||
4. Nippon Express |
13 | 987,076 | 0.9 | % | 10,011 | 1.4 | % | |||||||||||||
5. Sagawa Express |
10 | 729,141 | 0.7 | % | 9,433 | 1.3 | % | |||||||||||||
6. BAX Global Inc/Schenker/Deutsche Bahn (9) |
19 | 803,514 | 0.7 | % | 8,374 | 1.1 | % | |||||||||||||
7. La Poste |
2 | 902,391 | 0.8 | % | 7,837 | 1.1 | % | |||||||||||||
8. Panalpina, Inc. |
10 | 1,033,796 | 0.9 | % | 6,779 | 0.9 | % | |||||||||||||
9. Expeditors International |
7 | 1,238,693 | 1.1 | % | 6,192 | 0.8 | % | |||||||||||||
10. City and
County of San Francisco |
1 | 559,605 | 0.5 | % | 5,714 | 0.8 | % | |||||||||||||
Total |
12,727,009 | 11.6 | % | $ | 117,270 | 15.9 | % | |||||||||||||
| Year | Square Feet | ABR (1) (7) (9) | % of ABR (1) (7) | |||||||||
2007 |
5,036,552 | $ | 32,408 | 4.1 | % | |||||||
2008 |
14,942,983 | 98,821 | 12.5 | % | ||||||||
2009 |
19,878,985 | 127,723 | 16.2 | % | ||||||||
2010 |
16,473,590 | 121,835 | 15.4 | % | ||||||||
2011 |
16,085,884 | 118,413 | 15.0 | % | ||||||||
2012 |
12,161,194 | 101,704 | 12.9 | % | ||||||||
2013 |
6,793,579 | 46,463 | 5.9 | % | ||||||||
2014 |
6,559,572 | 53,644 | 6.8 | % | ||||||||
2015 |
3,836,440 | 30,696 | 3.9 | % | ||||||||
2016 and beyond |
7,943,877 | 58,161 | 7.3 | % | ||||||||
Total |
109,712,656 | $ | 789,868 | 100.0 | % | |||||||
| (1) | See Reporting Definitions for definitions of “owned and managed”, “same store properties” and “annualized base rent (ABR)”, as applicable. | |
| (2) | Consists of second generation leases renewing or re-tenanting with current and prior lease terms greater than one year. | |
| (3) | See Supplemental Financial Measures Disclosures. | |
| (4) | For the quarter ended September 30, 2007, on a consolidated basis, the % change was 6.5%, 6.5%, 6.5% and 6.3%, respectively, for revenues, expenses, NOI and NOI without lease termination fees. For the year-to-date ended September 30, 2007, on a consolidated basis, the % change was 5.8%, 6.1%, 5.7% and 5.6%, respectively, for revenues, expenses, NOI and NOI without lease termination fees. | |
| (5) | Schedule includes customers in our owned and managed portfolio. | |
| (6) | Schedule represents spaces that expire on or after September 30, 2007. Schedule includes owned and managed operating properties. | |
| (7) | ABR is reported net of all operating expense reimbursements. | |
| (8) | Customer(s) may be a subsidiary of or an entity affiliated with the named customer. | |
| (9) | Apron rental amounts (but not square footage) are included. | |
| (10) | United States Government includes the United States Postal Service (USPS), United States Customs, United States Department of Agriculture (USDA) and various other U.S. governmental agencies. |
6
|
|
SUPPLEMENTAL ANALYST PACKAGE 2007 Third Quarter Earnings Conference Call |
| Total | ||||||||||||||||||||||||||||||||||||||||
| No. New | San | Principal | ||||||||||||||||||||||||||||||||||||||
| Southern | Jersey/ | Francisco | U.S. | South | Global | |||||||||||||||||||||||||||||||||||
| California | New York | Bay Area | Chicago | On-Tarmac (2) | Florida | Seattle | Tokyo (3) | Paris (3) | Markets | |||||||||||||||||||||||||||||||
Rentable square feet |
15,966,939 | 11,115,945 | 10,147,211 | 12,423,064 | 2,679,328 | 6,119,659 | 7,891,551 | 4,374,922 | 3,108,673 | 73,827,292 | ||||||||||||||||||||||||||||||
Occupancy percentage |
97.2 | % | 99.1 | % | 96.5 | % | 91.4 | % | 94.3 | % | 98.6 | % | 97.3 | % | 96.3 | % | 90.2 | % | 96.1 | % | ||||||||||||||||||||
ABR (000’s) (4) |
$ | 103,979 | $ | 78,687 | $ | 62,307 | $ | 60,618 | $ | 46,723 | $ | 45,837 | $ | 39,095 | $ | 49,931 | $ | 23,827 | $ | 511,004 | ||||||||||||||||||||
% of total ABR (4) |
14.1 | % | 10.6 | % | 8.4 | % | 8.2 | % | 6.3 | % | 6.2 | % | 5.3 | % | 6.8 | % | 3.2 | % | 69.1 | % | ||||||||||||||||||||
ABR per square foot |
$ | 6.70 | $ | 7.14 | $ | 6.36 | $ | 5.34 | $ | 18.49 | $ | 7.60 | $ | 5.09 | $ | 11.86 | $ | 8.50 | $ | 7.20 | ||||||||||||||||||||
Lease
expirations as a % of ABR:
(4) |
||||||||||||||||||||||||||||||||||||||||
2007 |
4.5 | % | 0.9 | % | 3.5 | % | 9.6 | % | 9.5 | % | 8.6 | % | 1.8 | % | 0.7 | % | 3.7 | % | 4.6 | % | ||||||||||||||||||||
2008 |
13.0 | % | 9.0 | % | 18.3 | % | 12.4 | % | 13.8 | % | 13.0 | % | 11.2 | % | 6.0 | % | 5.9 | % | 11.9 | % | ||||||||||||||||||||
2009 |
13.3 | % | 17.3 | % | 25.5 | % | 14.2 | % | 6.0 | % | 15.1 | % | 25.7 | % | 22.8 | % | 15.0 | % | 17.2 | % | ||||||||||||||||||||
Weighted average lease terms: |
||||||||||||||||||||||||||||||||||||||||
Original |
5.7 | 7.5 | 5.4 | 5.5 | 8.7 | 5.6 | 5.9 | 5.0 | 6.1 | 6.0 | ||||||||||||||||||||||||||||||
Remaining |
3.1 | 4.6 | 2.4 | 3.0 | 4.5 | 3.4 | 3.2 | 3.5 | 4.3 | 3.4 | ||||||||||||||||||||||||||||||
Trailing four quarter tenant retention: |
75.6 | % | 82.8 | % | 62.7 | % | 64.3 | % | 85.4 | % | 59.5 | % | 89.4 | % | 60.6 | % | 76.8 | % | 74.1 | % | ||||||||||||||||||||
Rent increases on renewals and rollovers: |
||||||||||||||||||||||||||||||||||||||||
Quarter |
1.6 | % | 9.7 | % | 5.6 | % | 1.1 | % | 24.5 | % | 24.7 | % | 30.5 | % | (42.2 | %) | 4.7 | % | 11.0 | % | ||||||||||||||||||||
Same space square feet leased |
499,897 | 297,661 | 408,865 | 383,250 | 67,268 | 210,156 | 731,048 | 11,531 | 1,292 | 2,610,968 | ||||||||||||||||||||||||||||||
Year-to-Date |
8.9 | % | 3.0 | % | (5.1 | %) | (0.2 | %) | 1.6 | % | 17.4 | % | 19.3 | % | 0.6 | % | 10.6 | % | 5.1 | % | ||||||||||||||||||||
Same space square feet leased |
2,066,386 | 1,980,755 | 1,824,865 | 1,128,903 | 274,616 | 749,350 | 1,501,290 | 171,560 | 550,046 | 10,247,771 | ||||||||||||||||||||||||||||||
Same store cash basis NOI % change: (5) |
||||||||||||||||||||||||||||||||||||||||
Quarter |
7.4 | % | 10.4 | % | (2.0 | %) | 5.3 | % | 1.8 | % | 9.0 | % | 3.9 | % | 18.8 | % | 5.6 | % | 5.5 | % | ||||||||||||||||||||
Year-to-Date |
5.3 | % | 9.4 | % | 2.1 | % | 4.0 | % | 2.3 | % | 11.9 | % | 4.2 | % | 17.3 | % | 18.3 | % | 6.0 | % | ||||||||||||||||||||
Same store square feet as % of aggregate square feet (4) |
83.2 | % | 83.2 | % | 98.2 | % | 75.4 | % | 100.0 | % | 83.3 | % | 88.1 | % | 26.8 | % | 34.4 | % | 79.7 | % | ||||||||||||||||||||
AMB’s pro rata share of square feet (6) |
9,752,961 | 5,587,391 | 7,405,900 | 6,838,081 | 2,485,169 | 4,409,086 | 3,935,702 | 876,459 | 621,735 | 41,912,484 | ||||||||||||||||||||||||||||||
AMB’s pro rata % share of square feet (6) |
61.1 | % | 50.3 | % | 73.0 | % | 55.0 | % | 92.8 | % | 72.0 | % | 49.9 | % | 20.0 | % | 20.0 | % | 56.8 | % | ||||||||||||||||||||
| (1) | Based on annualized base rent and represents AMB’s owned and managed portfolio. The markets included here are a subset of AMB’s regions defined as East, Southwest, and West Central in North America and Europe and Asia. See Reporting Definitions for the definition of owned and managed. | |
| (2) | Includes on-tarmac cargo facilities at 14 airports. | |
| (3) | At September 30, 2007, these represent our largest single markets in Asia and Europe, respectively. | |
| (4) | See Reporting Definitions for definitions of “ABR” and “same store properties”, as applicable. | |
| (5) | See Supplemental Financial Measures Disclosures. | |
| (6) | Calculated as AMB’s pro rata share of square feet on the Owned and Managed portfolio. |
7
|
|
SUPPLEMENTAL ANALYST PACKAGE 2007 Third Quarter Earnings Conference Call |
| Rentable | AMB's Pro Rata | |||||||||||||||||||||||
| Square | % Share of | Occupancy | % of Total | ABR per | ||||||||||||||||||||
| Feet | Square Feet | Percentage | ABR (2) | ABR (2) | Square Foot (2) | |||||||||||||||||||
Principal Global Markets |
73,827,292 | 56.8 | % | 96.1 | % | $ | 511,004 | 69.1 | % | $ | 7.20 | |||||||||||||
Other Global Target Markets |
||||||||||||||||||||||||
North America Markets |
||||||||||||||||||||||||
Atlanta |
4,624,026 | 50.1 | % | 94.6 | % | $ | 19,565 | 2.6 | % | $ | 4.47 | |||||||||||||
Baltimore |
3,755,256 | 71.9 | % | 98.7 | % | 23,908 | 3.2 | % | 6.45 | |||||||||||||||
Boston |
5,188,593 | 72.4 | % | 91.2 | % | 31,626 | 4.3 | % | 6.69 | |||||||||||||||
Dallas |
5,103,893 | 55.9 | % | 94.1 | % | 22,934 | 3.1 | % | 4.78 | |||||||||||||||
Mexico City |
2,134,089 | 20.0 | % | 100.0 | % | 13,432 | 1.8 | % | 6.29 | |||||||||||||||
Minneapolis |
4,129,770 | 79.1 | % | 93.1 | % | 17,847 | 2.4 | % | 4.64 | |||||||||||||||
Other Markets (3) |
8,204,094 | 48.9 | % | 94.0 | % | 42,582 | 5.8 | % | 5.52 | |||||||||||||||
Subtotal/Weighted Average |
33,139,721 | 58.3 | % | 94.4 | % | $ | 171,894 | 23.2 | % | $ | 5.49 | |||||||||||||
Europe Markets |
||||||||||||||||||||||||
Amsterdam, Netherlands |
1,880,498 | 20.0 | % | 95.2 | % | $ | 18,139 | 2.5 | % | $ | 10.13 | |||||||||||||
Brussels, Belgium |
100,169 | 20.0 | % | 100.0 | % | 1,462 | 0.2 | % | 14.60 | |||||||||||||||
Frankfurt, Germany |
275,868 | 20.0 | % | 100.0 | % | 4,811 | 0.7 | % | 17.44 | |||||||||||||||
Hamburg, Germany |
1,425,002 | 19.8 | % | 99.9 | % | 10,935 | 1.4 | % | 7.68 | |||||||||||||||
Lyon, France |
262,491 | 20.0 | % | 100.0 | % | 1,903 | 0.3 | % | 7.25 | |||||||||||||||
Subtotal/Weighted Average |
3,944,028 | 19.9 | % | 97.7 | % | $ | 37,250 | 5.1 | % | $ | 9.67 | |||||||||||||
Asia Markets |
||||||||||||||||||||||||
Osaka, Japan |
1,018,875 | 20.0 | % | 91.1 | % | $ | 8,443 | 1.2 | % | $ | 9.10 | |||||||||||||
Shanghai, China |
1,382,817 | 100.0 | % | 100.0 | % | 5,347 | 0.7 | % | 3.87 | |||||||||||||||
Singapore, Singapore |
717,706 | 100.0 | % | 69.9 | % | 5,430 | 0.7 | % | 10.83 | |||||||||||||||
Subtotal/Weighted Average |
3,119,398 | 73.9 | % | 90.2 | % | $ | 19,220 | 2.6 | % | $ | 6.83 | |||||||||||||
Owned and Managed Total |
114,030,439 | 56.4 | % | 95.5 | % | $ | 739,368 | 100.0 | % | $ | 6.79 | |||||||||||||
Other (4) |
7,495,659 | 93.8 | % | |||||||||||||||||||||
Total Stabilized Portfolio (2) |
121,526,098 | 95.4 | % | |||||||||||||||||||||
Development Projects |
19,249,545 | |||||||||||||||||||||||
Total Portfolio (5) |
140,775,643 | |||||||||||||||||||||||
| (1) | Includes AMB’s owned and managed operating and development properties, investments in operating properties through non-managed unconsolidated joint ventures, and recently completed developments that have not yet been placed in operations but are being held for sale or contribution. See Reporting Definitions for the definition of “owned and managed”. | |
| (2) | See Reporting Definitions for definitions of “ABR” and “completion/stabilization”, as applicable. | |
| (3) | Other Markets includes other target markets (Austin, Guadalajara, Houston, Orlando, Querétaro, Tijuana and Toronto) and non-target markets (Columbus and New Orleans). | |
| (4) | Includes investments in 7.4 million square feet of operating properties through AMB’s investments in unconsolidated joint ventures that it does not manage which it excludes from its owned and managed portfolio and 151,606 square feet for its investment in AMB Pier One, LLC. | |
| (5) | Total Portfolio includes recently completed development projects available for sale or contribution totaling ten projects and 2.5 million square feet. |
8
|
|
SUPPLEMENTAL ANALYST PACKAGE 2007 Third Quarter Earnings Conference Call |
| Month of | Square | |||||||
| Property Acquisitions | Market | Acquisition | Feet | |||||
AMB Alliance Fund III |
||||||||
1. AMB Bluefin Distribution Center |
South Florida | July | 234,541 | |||||
2. AMB Eagle Creek |
Minneapolis | August | 122,912 | |||||
3. AMB Midland Distribution Center |
Seattle | August | 73,086 | |||||
4. AMB New Durham Industrial Center |
No. New Jersey/New York | September | 452,374 | |||||
5. AMB Pearl Distribution Center |
Southern California | September | 103,248 | |||||
Total AMB Alliance Fund III |
986,161 | |||||||
AMB Japan Fund I |
||||||||
6. AMB Saitama Distribution Center 4 |
Tokyo, Japan | July | 44,566 | |||||
Total AMB Japan Fund I |
44,566 | |||||||
AMB Europe Fund I |
||||||||
7. AMB Orleans Distribution Center 1 |
Paris, France | July | 122,924 | |||||
Total AMB Europe Fund I |
122,924 | |||||||
AMB Property Corporation |
||||||||
8. AMB Tuas Distribution Center 1 |
Singapore, Singapore | September | 199,321 | |||||
9. AMB Changi North Distribution Center 1 |
Singapore, Singapore | September | 105,456 | |||||
Total AMB Property Corporation |
304,777 | |||||||
Total Third Quarter Property Acquisitions |
1,458,428 | |||||||
Acquisition
Cost (1) (2) |
$ | 116,259 | ||||||
AMB’s Weighted Average Ownership Percentage |
32 | % | ||||||
Weighted Average Stabilized Cap Rate (Using GAAP NOI) (3) |
6.6 | % | ||||||
Total Year-to-Date Property Acquisitions |
8,796,882 | |||||||
Acquisition Cost (1) (2) |
$ | 752,626 | ||||||
AMB’s Weighted Average Ownership Percentage |
26 | % | ||||||
Weighted Average Stabilized Cap Rate (Using GAAP NOI) (3) |
6.5 | % | ||||||
| (1) | Represents the total expected investment, including closing costs and estimated acquisition capital of $2.7 million and $14.5 million, respectively, for the quarter and nine months ended September 30, 2007. | |
| (2) | Non-U.S. Dollar assets are translated using the exchange rate on the date of acquisition. | |
| (3) | See Reporting Definitions for definition of “stabilized GAAP cap rates” and Supplemental Financial Disclosures for discussion of NOI. |
9
|
|
SUPPLEMENTAL ANALYST PACKAGE 2007 Third Quarter Earnings Conference Call |
| Estimated | ||||||||
| Estimated | Square Feet | |||||||
| New Development Project | Market | Stabilization (1) | at Stabilization (1) | |||||
1. AMB DFW Distribution Center — IV & V |
Dallas | Q208 | 396,060 | |||||
2. AMB Le Grand Roissy Distribution — Genevilliers |
Paris, France | Q208 | 67,274 | |||||
3. AMB Manzanita R&D (2) |
San Francisco Bay Area | Q408 | 26,615 | |||||
4. AMB I-78 Distribution Center Bldg 100 |
No. New Jersey/New York | Q109 | 700,000 | |||||
5. AMB Tripoint (2) |
San Francisco Bay Area | Q109 | 167,296 | |||||
6. AMB Rogers Distribution Center |
Minneapolis | Q109 | 147,160 | |||||
7. AMB Portview Commerce Center — Bldg 100 |
No. New Jersey/New York | Q109 | 143,756 | |||||
8. AMB Agua Fria — Bldgs 1&2 |
Monterrey, Mexico | Q209 | 276,288 | |||||
9. AMB Boom Distribution Center |
Brussels, Belgium | Q209 | 437,014 | |||||
10. AMB Riverfront Distribution Center — Bldg A |
Seattle | Q209 | 388,000 | |||||
11. AMB Arques Business Center (2) |
San Francisco Bay Area | Q309 | 82,000 | |||||
Total Third Quarter New Development Projects |
2,831,463 | |||||||
Estimated Total Investment (1) |
$ | 232,997 | ||||||
AMB’s Weighted Average Ownership Percentage |
97 | % | ||||||
Weighted Average Estimated Yield (1) |
7.5 | % | ||||||
Total Year-to-Date New Projects |
7,947,644 | |||||||
Estimated Total Investment (1) |
$ | 688,875 | ||||||
Total Third Quarter Capital Deployment |
$ | 349,256 | ||||||
Total Year-to-Date Capital Deployment |
$ | 1,441,501 | ||||||
| (1) | See Reporting Definitions for definitions of “completion/stabilization”, “estimated total investment” and “estimated yields”, as applicable. | |
| (2) | Represents a redevelopment project. See Reporting Definitions. |
10
|
|
SUPPLEMENTAL ANALYST
PACKAGE 2007 Third Quarter Earnings Conference Call |
| Month of | ||||||||
| Contribution/ | Square | |||||||
| Operating Property Contributions and Dispositions | Market | Disposition | Feet | |||||
Contributions |
||||||||
None |
n/a | n/a | n/a | |||||
Dispositions |
||||||||
1. JFK Air Cargo - 1 |
No. New Jersey/New York | September | 45,920 | |||||
Total Third Quarter Operating Property Contributions and Dispositions |
45,920 | |||||||
Total Contribution Value and Disposition Price (1) |
$ | 7,550 | ||||||
AMB’s Weighted Average Ownership Percentage Sold or Contributed |
100 | % | ||||||
Weighted Average Stabilized Cash Cap Rate (3) |
5.1 | % | ||||||
Total Year-to-Date Operating Property Contributions and Dispositions |
4,579,873 | |||||||
Total Contribution Value and Disposition Price (1) |
$ | 532,401 | ||||||
AMB’s
Weighted Average Ownership Percentage Sold or Contributed |
80 | % | ||||||
Weighted Average Stabilized Cash Cap Rate (3) |
6.4 | % | ||||||
| Month of | ||||||||
| Contribution/ | Square | |||||||
| Development Property Contributions and Dispositions | Market | Disposition | Feet | |||||
Contributions |
||||||||
1. AMB Fokker Logistics Center 2A |
Amsterdam, Netherlands | September | 117,929 | |||||
2. AMB Funabashi Distribution Center 5 |
Tokyo, Japan | September | 469,627 | |||||
3. AMB Gonesse Distribution Center |
Paris, France | September | 598,161 | |||||
4. AMB Douglassingel Distribution Center |
Amsterdam, Netherlands | September | 148,714 | |||||
Total Contributions |
1,334,431 | |||||||
Dispositions |
||||||||
1. AMB Torrance Matrix — 6 units |
Southern California | September | 42,585 | |||||
2. AMB Osgood Industrial (2) (4) |
San Francisco Bay Area | September | n/a | |||||
3. AMB Pacific Coast Business Park — Land (5) |
Southern California | September | n/a | |||||
Total Dispositions |
42,585 | |||||||
Total Third Quarter Development Property Contributions and Dispositions |
1,377,016 | |||||||
Total Contribution Value and Disposition Price (1) |
$ | 245,324 | ||||||
Development Margin (3) |
34.7 | % | ||||||
AMB’s Weighted Average Ownership Percentage Sold or Contributed |
82 | % | ||||||
Weighted Average Stabilized Cash Cap Rate (3) |
5.5 | % | ||||||
Total Year-to-Date Development Property Contributions and Dispositions |
3,374,411 | |||||||
Total Contribution Value and Disposition Price (1) |
$ | 485,477 | ||||||
Development Margin (3) |
31.0 | % | ||||||
AMB’s Weighted Average Ownership Percentage Sold or Contributed |
83 | % | ||||||
Weighted Average Stabilized Cash Cap Rate (3) |
5.8 | % | ||||||
| (1) | Translated to U.S. Dollars using the exchange rate on the date of contribution/disposition, as applicable. | |
| (2) | Represents a project that was placed in projects available for sale or contribution during the quarter ended September 30, 2007, and was sold or contributed during the quarter. | |
| (3) | See Reporting Definitions for definition of “development margin” and “stabilized cash cap rates”. | |
| (4) | Represents a value-added conversion project. See Reporting Definitions. | |
| (5) | Represents a project in an unconsolidated joint venture. |
11
|
|
SUPPLEMENTAL ANALYST PACKAGE 2007 Third Quarter Earnings Conference Call |
| Estimated | ||||||||
| Estimated | Square Feet | |||||||
| 2007 Deliveries | Market | Stabilization (1) | at Stabilization (1) | |||||
1. AMB Arrayanes — Bldg 2 |
Guadalajara, Mexico | Q4 | 473,720 | |||||
2. AMB Pearson Logistics Centre 1 — Bldg 100 |
Toronto, Canada | Q4 | 446,338 | |||||
3. AMB Sagamihara Distribution Center |
Tokyo, Japan | Q4 | 543,056 | |||||
4. AMB Isle d’Abeau Logistics Park Bldg. C |
Lyon, France | Q4 | 277,817 | |||||
5. AMB Wille Distribution Center |
Chicago | Q4 | 253,410 | |||||
6. AMB Beacon Lakes — Commerce Bank |
South Florida | Q4 | 101,345 | |||||
Total 2007 Deliveries |
2,095,686 | |||||||
Estimated Total Investment (1) |
$ | 209,477 | ||||||
Funded-to-date |
$ | 168,022 | (2) | |||||
AMB’s Weighted Average Ownership Percentage |
97 | % | ||||||
Weighted Average Estimated Yield (1) |
7.0 | % | ||||||
% Pre-leased |
71 | % | ||||||
| (1) | See Reporting Definitions for definitions of “completion/stabilization”, “estimated total investment” and “estimated yield”, as applicable. | |
| (2) | AMB’s share of amounts funded to date for 2007, 2008 and 2009 deliveries was $163.8 million, $689.3 million and $156.9 million, respectively, for a total of $1,010.0 million. |
12
|
|
SUPPLEMENTAL ANALYST PACKAGE 2007 Third Quarter Earnings Conference Call |
| Estimated | ||||||||
| Estimated | Square Feet | |||||||
| 2008 Deliveries | Market | Stabilization (1) | at Stabilization (1) | |||||
7. AMB Aurora Industrial (5) |
Minneapolis | Q1 | 122,793 | |||||
8. AMB Milton 401 Business Park — Bldg 2 |
Toronto, Canada | Q1 | 281,441 | |||||
9. AMB Fokker Logistics Center 3A and 3B |
Amsterdam, Netherlands | Q1 | 221,413 | |||||
10. AMB Valley Distribution Center |
Seattle | Q1 | 749,970 | |||||
11. AMB Amagasaki Distribution Center 2 |
Osaka, Japan | Q2 | 981,679 | |||||
12. AMB Beacon Lakes Bldg 7 |
South Florida | Q2 | 193,090 | |||||
13. AMB Redlands 2 |
Southern California | Q2 | 1,313,470 | |||||
14. AMB DFW Distribution Center — IV & V (4) |
Dallas | Q2 | 396,060 | |||||
15. AMB Le Grand Roissy Distribution — Genevilliers (4) |
Paris, France | Q2 | 67,274 | |||||
16. AMB Le Grand Roissy Distribution — Mitry |
Paris, France | Q2 | 37,954 | |||||
17. AMB Shinkiba Distribution Center |
Tokyo, Japan | Q2 | 333,668 | |||||
18. AMB Theodorpark Logistics Center |
Frankfurt, Germany | Q2 | 139,608 | |||||
19. AMB Narita Air Cargo 1 — Phase 1 Bldg C |
Tokyo, Japan | Q2 | 348,891 | |||||
20. AMB IAH Airfreight 7 |
Houston | Q2 | 239,500 | |||||
21. AMB Palmetto Distribution Center |
Orlando | Q2 | 406,400 | |||||
22. AMB Lijnden Logistics Court 1 |
Amsterdam, Netherlands | Q3 | 96,520 | |||||
23. AMB Nanko Naka Distribution Center |
Osaka, Japan | Q3 | 402,313 | |||||
24. AMB Franklin Commerce Center |
No. New Jersey/New York | Q3 | 366,896 | |||||
25. AMB Manzanita R&D (4) (5) |
San Francisco Bay Area | Q4 | 26,615 | |||||
26. AMB Remington Lakes Distribution |
Chicago | Q4 | 228,413 | |||||
27. AMB Beacon Lakes Village — Phase 1 Bldg E2 |
South Florida | Q4 | 52,918 | |||||
28. AMB Pompano Center of Commerce — Phase 1 |
South Florida | Q4 | 218,835 | |||||
29. AMB Barajas Logistics Park |
Madrid, Spain | Q4 | 444,043 | |||||
30. AMB Liberty Logistics Center |
No. New Jersey/New York | Q4 | 191,196 | |||||
31. AMB El Segundo (6) |
Southern California | Q4 | 217,740 | |||||
32. AMB Platinum Triangle Land — Phase 1 (3) |
Southern California | Q4 | — | |||||
33. AMB Dublin (3) |
San Francisco Bay Area | Q4 | — | |||||
34. AMB ICN Logistics Center |
Seoul, Korea | Q4 | 362,745 | |||||
35. AMB Akechi Distribution Center |
Nagoya, Japan | Q4 | 979,357 | |||||
Total 2008 Deliveries |
9,420,802 | |||||||
Estimated Total Investment (1) |
$ | 966,131 | ||||||
Funded-to-date |
$ | 751,440 | (2) | |||||
AMB’s Weighted Average Ownership Percentage |
92 | % | ||||||
Weighted Average Estimated Yield (1) |
7.4 | % | ||||||
% Pre-leased |
32 | % | ||||||
| (1) | See Reporting Definitions for definitions of “completion/stabilization”, “estimated total investment” and “estimated yield”, as applicable. | |
| (2) | AMB’s share of amounts funded to date for 2007, 2008 and 2009 deliveries was $163.8 million, $689.3 million and $156.9 million, respectively, for a total of $1,010.0 million. | |
| (3) | Represents a value-added conversion project. See Reporting Definitions. | |
| (4) | Represents a new development start for the quarter ended September 30, 2007. | |
| (5) | Represents a redevelopment project. See Reporting Definitions. | |
| (6) | Represents a project in an unconsolidated joint venture. |
13
|
|
SUPPLEMENTAL ANALYST PACKAGE 2007 Third Quarter Earnings Conference Call |
| Estimated | ||||||||
| Estimated | Square Feet | |||||||
| 2009 Deliveries | Market | Stabilization(1) | at Stabilization(1) | |||||
36. AMB Arrayanes — Bldg 4 |
Guadalajara, Mexico | Q1 | 253,597 | |||||
37. AMB Pacifico — Bldgs 3&4 |
Tijuana, Mexico | Q1 | 195,945 | |||||
38. AMB I - 78 Distribution Center Bldg 100 (4) |
No. New Jersey/New York | Q1 | 700,000 | |||||
39. AMB Tripoint (4) (5) |
San Francisco Bay Area | Q1 | 167,296 | |||||
40. AMB Minooka Distribution Center (6) |
Chicago | Q1 | 1,000,743 | |||||
41. AMB Rogers Distribution Center (4) |
Minneapolis | Q1 | 147,160 | |||||
42. AMB Portview Commerce Center — Bldg 100 (4) |
No. New Jersey/New York | Q1 | 143,756 | |||||
43. AMB Morgan Business Center — Bldg 100 |
Savannah | Q2 | 343,030 | |||||
44. AMB Agua Fria — Bldgs 1&2 (4) |
Monterrey, Mexico | Q2 | 276,288 | |||||
45. AMB Boom Distribution Center (4) |
Brussels, Belgium | Q2 | 437,014 | |||||
46. AMB Tsurumi Distribution Center 1 |
Tokyo Japan | Q2 | 685,757 | |||||
47. AMB Riverfront Distribution Center — Bldg A (4) |
Seattle | Q2 | 388,000 | |||||
48. AMB Siziano Business Park — Bldg 1 |
Milan, Italy | Q2 | 436,916 | |||||
49. AMB Arques Business Center (4) (5) |
San Francisco Bay Area | Q3 | 82,000 | |||||
50. AMB
Hathaway(3) |
San Francisco Bay Area | Q4 | — | |||||
51. AMB Platinum Triangle Land — Phase 2 (3) |
Southern California | Q4 | — | |||||
Total 2009 Deliveries |
5,257,502 | |||||||
Estimated Total Investment (1) |
$ | 443,224 | ||||||
Funded-to-date |
$ | 178,930 | (2) | |||||
AMB’s Weighted Average Ownership Percentage |
87 | % | ||||||
Weighted Average Estimated Yield (1) |
7.5 | % | ||||||
% Pre-leased |
0 | % | ||||||
Total 2007, 2008 and 2009 Scheduled Deliveries |
16,773,990 | |||||||
Estimated Total Investment (1) |
$ | 1,618,832 | ||||||
Funded-to-date |
$ | 1,098,392 | (2) | |||||
AMB’s Weighted Average Ownership Percentage |
91 | % | ||||||
Weighted Average Estimated Yield (1) |
7.4 | % | ||||||
% Pre-leased |
27 | % | ||||||
| (1) | See Reporting Definitions for definitions of “completion/stabilization”, “estimated total investment” and “estimated yield”, as applicable. | |
| (2) | AMB’s share of amounts funded to date for 2007, 2008 and 2009 deliveries was $163.8 million, $689.3 million and $156.9 million, respectively, for a total of $1,010.0 million. | |
| (3) | Represents a value-added conversion project. See Reporting Definitions. | |
| (4) | Represents a new development start for the quarter ended September 30, 2007. | |
| (5) | Represents a redevelopment project. See Reporting Definitions. | |
| (6) | Represents a project in an unconsolidated joint venture. |
14
|
|
SUPPLEMENTAL ANALYST PACKAGE 2007 Third Quarter Earnings Conference Call |
| Projects Placed in Operations | Market | Square Feet | ||||
None |
n/a | n/a | ||||
Total Year-to-Date Placed in Operations |
179,400 | |||||
Total Investment (1) |
$ | 10,657 | ||||
AMB’s Weighted Average Ownership Percentage |
20 | % | ||||
Weighted Average Estimated Yield (1) |
8.0 | % | ||||
| Development and Value-Added Conversion Projects | ||||||
| Available for Sale or Contribution (1) (2) | Market | Square Feet | ||||
1. AMB Singapore Airport Logistics Center — Bldg 2 (3) (6) |
Singapore, Singapore | 250,758 | ||||
2. AMB Milton 401 Business Park — Bldg 1 |
Toronto, Canada | 375,241 | ||||
3. AMB Fengxian Logistics Center — Bldgs 2, 4 & 6 (4) (6) |
Shanghai, China | 1,040,633 | ||||
4. AMB Highway 17 — 55 Madison Street (4) |
No. New Jersey/New York | 150,446 | ||||
5. AMB Jiuting Distribution Center 2 (6) |
Shanghai, China | 190,435 | ||||
6. AMB Annagem Distribution Centre (6) |
Toronto, Canada | 198,169 | ||||
7. AMB Beacon Lakes Village — Phase 1 Bldg E1 — 1 unit |
South Florida | 6,583 | ||||
8. AMB Steel Road |
Southern California | 161,000 | ||||
9. AMB Torrance Matrix — 16 units |
Southern California | 107,430 | ||||
10. AMB Altenwerder Distribution Center 1 (5) |
Hamburg, Germany | 414,701 | ||||
11. AMB Agave 5 (5) (6) |
Mexico City, Mexico | 111,600 | ||||
12. AMB Pearson Logistics Centre 1-Bldg 200 (5) |
Toronto, Canada | 205,518 | ||||
13. AMB Tres Rios Industrial Park — Bldg 3 (5) |
Mexico City, Mexico | 628,784 | ||||
14. AMB Tres Rios Industrial Park — Bldg 4 (5) |
Mexico City, Mexico | 315,156 | ||||
15. AMB Fokker Logistics Center 4A (5) |
Amsterdam, Netherlands | 110,696 | ||||
16. AMB
Moffett Business Center Industrial
(7)(5) |
San Francisco Bay Area | — | ||||
Total Available for Sale or Contribution |
4,267,150 | |||||
Total Investment (1) |
$ | 320,297 | ||||
AMB’s Weighted Average Ownership Percentage |
89 | % | ||||
% Leased |
78 | % | ||||
| Operating Properties Available for Contribution | Market | Square Feet | ||||
1. AMB Annagem Distribution Centre II |
Toronto, Canada | 106,184 | ||||
2. AMB Jiuting Distribution Center 1 |
Shanghai, China | 151,749 | ||||
3. AMB Singapore Airport Logistics Center — Bldg 3 |
Singapore, Singapore | 162,171 | ||||
4. AMB Tuas Distribution Center 1 |
Singapore, Singapore | 199,321 | ||||
5. AMB Changi North Distribution Center 1 |
Singapore, Singapore | 105,456 | ||||
Total Available for Contribution |
724,881 | |||||
Total Investment (1) |
$ | 51,339 | ||||
AMB’s Weighted Average Ownership Percentage |
100 | % | ||||
% Leased |
64 | % | ||||
| (1) | See Reporting Definitions for definitions of “estimated total investment” and “estimated yields”, as applicable. | |
| (2) | Represents projects where development activities have been completed and which AMB intends to sell or contribute within two years of construction completion. | |
| (3) | Represents a project in an unconsolidated joint venture. | |
| (4) | Represents a redevelopment project. See Reporting Definitions. | |
| (5) | Represents an asset placed in available for sale or contribution during the quarter ended September 30, 2007. Assets placed in available for sale or contribution during the quarter totaled $179.7 million and 1.8 million square feet. | |
| (6) | Represents a project that is at least 90% leased and is included in the owned and managed operating portfolio. | |
| (7) | Represents a value-added conversion project. See Reporting Definitions. |
15
|
|
SUPPLEMENTAL ANALYST PACKAGE 2007 Third Quarter Earnings Conference Call |
| North America | Europe | Asia | Totals | |||||||||||||||||||||||||||||
| Estimated | Estimated | Estimated | Estimated | |||||||||||||||||||||||||||||
| Build Out Potential | Build Out Potential | Build Out Potential | Build Out Potential | |||||||||||||||||||||||||||||
| Acres | (square feet) | Acres | (square feet) | Acres | (square feet) | Acres | (square feet) | |||||||||||||||||||||||||
Balance as of June 30, 2007 |
2,345 | 38,991,786 | 53 | 1,037,254 | 40 | 2,283,574 | 2,438 | 42,312,614 | ||||||||||||||||||||||||
Acquisitions |
92 | 1,444,220 | — | — | 16 | 398,264 | 108 | 1,842,484 | ||||||||||||||||||||||||
Sales |
(2 | ) | — | — | — | — | — | (2 | ) | — | ||||||||||||||||||||||
Development starts |
(139 | ) | (2,327,175 | ) | — | — | — | — | (139 | ) | (2,327,175 | ) | ||||||||||||||||||||
Redesign adjustments |
— | — | — | 261,909 | — | — | — | 261,909 | ||||||||||||||||||||||||
Balance as of September 30, 2007 |
2,296 | 38,108,831 | 53 | 1,299,163 | 56 | 2,681,838 | 2,405 | (5) | 42,089,832 | (4) | ||||||||||||||||||||||
Total investments in Land (2) |
$ | 439,224 | $ | 29,982 | $ | 93,124 | $ | 562,330 | (4) | |||||||||||||||||||||||
Estimated Development Cost |
$ | 2,230,774 | (3) | |||||||||||||||||||||||||||||
| (1) | Includes consolidated and unconsolidated investments. | |
| (2) | Includes initial acquisition cost and associated carry costs. | |
| (3) | Represents total estimated costs of development including initial land acquisition cost and associated carry costs assuming full build out of land inventory. | |
| (4) | AMB’s share of acres, square feet of estimated build out potential, and total investment including amounts held in unconsolidated joint ventures is 2,196 acres, 38,372,635 square feet and $453,729, respectively. |
16
|
|
SUPPLEMENTAL ANALYST PACKAGE 2007 Third Quarter Earnings Conference Call |
| AMB | Joint | Unsecured | ||||||||||||||||||||||
| Secured | Venture | Senior | Credit | Other | Total | |||||||||||||||||||
| Year | Debt (1) | Debt (1) | Debt | Facilities (2) | Debt | Debt | ||||||||||||||||||
2007 |
$ | 57,564 | $ | 11,256 | $ | — | $ | — | $ | 13,173 | $ | 81,993 | ||||||||||||
2008 |
90,800 | 72,774 | 175,000 | — | 810 | 339,384 | ||||||||||||||||||
2009 |
25,799 | 146,333 | 100,000 | — | 873 | 273,005 | ||||||||||||||||||
2010 |
65,905 | 95,365 | 250,000 | 604,873 | 941 | 1,017,084 | ||||||||||||||||||
2011 |
115 | 189,640 | 75,000 | 213,452 | 1,014 | 479,221 | ||||||||||||||||||
2012 |
2,044 | 459,082 | — | — | 61,093 | (6) | 522,219 | |||||||||||||||||
2013 |
— | 46,366 | 175,000 | — | 65,920 | (7) | 287,286 | |||||||||||||||||
2014 |
— | 4,076 | — | — | 616 | 4,692 | ||||||||||||||||||
2015 |
— | 18,780 | 112,491 | — | 664 | 131,935 | ||||||||||||||||||
2016 |
— | 54,995 | — | — | — | 54,995 | ||||||||||||||||||
Thereafter |
— | 19,091 | 125,000 | — | — | 144,091 | ||||||||||||||||||
Sub-total |
242,227 | 1,117,758 | 1,012,491 | 818,325 | 145,104 | 3,335,905 | ||||||||||||||||||
Unamortized premiums/(discount) |
1,129 | 3,443 | (9,681 | ) | — | — | (5,109 | ) | ||||||||||||||||
Total consolidated debt |
243,356 | 1,121,201 | 1,002,810 | 818,325 | 145,104 | 3,330,796 | ||||||||||||||||||
AMB’s
share of unconsolidated JV Debt (3) (5) |
— | 505,285 | — | — | 31,478 | 536,763 | ||||||||||||||||||
Total debt |
243,356 | 1,626,486 | 1,002,810 | 818,325 | 176,582 | 3,867,559 | ||||||||||||||||||
JV partners’ share of
consolidated JV debt (5) |
— | (718,461 | ) | — | — | (100,000 | ) | (818,461 | ) | |||||||||||||||
AMB’s share of total debt (5) |
$ | 243,356 | $ | 908,025 | $ | 1,002,810 | $ | 818,325 | $ | 76,582 | $ | 3,049,098 | ||||||||||||
Weighted average interest rate |
5.6 | % | 6.2 | % | 6.1 | % | 3.4 | % | 6.2 | % | 5.4 | % | ||||||||||||
Weighted average
maturity (in years) |
1.2 | 4.4 | 4.5 | 2.9 | 4.8 | 3.8 | ||||||||||||||||||
| Market Equity | ||||||||||||
| Security | Shares | Price | Value | |||||||||
Common Stock |
98,910,419 | $ | 59.81 | $ | 5,915,832 | |||||||
LP Units |
4,144,783 | 59.81 | 247,899 | |||||||||
Total |
103,055,202 | $ | 6,163,731 | |||||||||
| Preferred Stock and Units (4) | ||||||||
| Dividend | Liquidation | |||||||
| Security | Rate | Preference | ||||||
Series D preferred units |
7.18 | % | $ | 79,767 | ||||
Series L preferred stock |
6.50 | % | 50,000 | |||||
Series M preferred stock |
6.75 | % | 57,500 | |||||
Series O preferred stock |
7.00 | % | 75,000 | |||||
Series P preferred stock |
6.85 | % | 50,000 | |||||
Weighted Average/Total |
6.90 | % | $ | 312,267 | ||||
| Capitalization Ratios | ||||
Total debt-to-total market capitalization (5) |
37.4 | % | ||
AMB’s share of total debt-to-AMB’s share of
total market capitalization (5) |
32.0 | % | ||
Total debt plus preferred-to-total market capitalization (5) |
40.4 | % | ||
AMB’s share of total debt plus preferred-to-
AMB’s share of total market capitalization (5) |
35.3 | % | ||
| (1) | AMB secured debt includes debt related to European and Asian assets in the amount of $63.7 million and $67.1 million, respectively. | |
| (2) | Represents three credit facilities with total capacity of approximately $1,529 million. Includes $402.7 million, $194.2 million, $102.6 million, $84.6 million and $19.3 million in Yen, Canadian dollar, Euro, British Pounds and Singapore dollar based borrowings, respectively, translated to U.S. Dollars using the foreign exchange rates at September 30, 2007. | |
| (3) | The weighted average interest and maturity for the unconsolidated JV debt were 4.7% and 5.3 years, respectively. | |
| (4) | Exchangeable under certain circumstances by the unitholder and redeemable at the option of AMB after a non-call period, five years from issuance. | |
| (5) | See Reporting Definitions and Supplemental Financial Measures Disclosures. | |
| (6) | Maturity includes $60 million balance outstanding on a $70 million non-recourse credit facility obtained by AMB Institutional Alliance Fund II. | |
| (7) | Maturity includes $65 million balance outstanding on a $65 million non-recourse credit facility obtained by AMB Partners II. |
17
|
|
SUPPLEMENTAL ANALYST
PACKAGE 2007 Third Quarter Earnings Conference Call |
| AMB's | Gross | AMB's | Estimated | Planned | ||||||||||||||||||||||||||||||
| Geographic | Ownership | Square | Book | Property | Other | Net Equity | Investment | Gross | ||||||||||||||||||||||||||
| Unconsolidated Joint Ventures | Focus | Percentage | Feet (2) | Value (3) | Debt | Debt | Investment (4) | Capacity | Capitalization | |||||||||||||||||||||||||
Co-Investment Operating Joint Ventures: |
||||||||||||||||||||||||||||||||||
AMB Institutional Alliance Fund III (5) |
United States | 19 | % | 18,985,658 | $ | 1,756,192 | $ | 851,791 | $ | — | $ | 137,759 | $ | 345,000 | $ | 2,101,192 | ||||||||||||||||||
AMB Europe Fund I (5) (6) |
Europe | 21 | % | 7,052,701 | 924,376 | 559,340 | — | 50,246 | 235,000 | 1,159,376 | ||||||||||||||||||||||||
AMB Japan Fund I (6) |
Japan | 20 | % | 5,393,797 | 903,387 | 546,415 | 102,657 | 54,191 | 1,280,000 | 2,183,387 | ||||||||||||||||||||||||
AMB-SGP Mexico |
Mexico | 20 | % | 4,791,996 | 253,538 | 112,925 | 55,851 | 12,556 | 451,000 | 704,538 | ||||||||||||||||||||||||
Total Co-Investment Operating Joint Ventures |
20 | % | 36,224,152 | 3,837,493 | 2,070,471 | 158,508 | 254,752 | 2,311,000 | 6,148,493 | |||||||||||||||||||||||||
Co-Investment Development Joint Ventures: |
||||||||||||||||||||||||||||||||||
AMB DFS Fund I |
United States | 15 | % | 1,218,483 | 133,680 | — | — | 20,319 | 274,000 | 407,680 | ||||||||||||||||||||||||
Other Industrial Operating Joint Ventures |
53 | % | 7,669,507 | (7) | 293,008 | 179,480 | — | 49,866 | n/a | n/a | ||||||||||||||||||||||||
Total Unconsolidated Joint Ventures |
22 | % | 45,112,142 | $ | 4,264,181 | $ | 2,249,951 | $ | 158,508 | $ | 324,937 | $ | 2,585,000 | $ | 6,556,173 | |||||||||||||||||||
| Consolidated Joint Ventures | ||||||||||||||||||||||||||||||||||||
Co-Investment Operating Joint Ventures: |
||||||||||||||||||||||||||||||||||||
AMB Partners II |
United States | 20 | % | 9,914,742 | $ | 689,350 | $ | 321,358 | $ | 65,000 | ||||||||||||||||||||||||||
AMB Institutional Alliance Fund II |
United States | 20 | % | 8,007,103 | 521,837 | 239,560 | 60,000 | |||||||||||||||||||||||||||||
AMB-SGP |
United States | 50 | % | 8,287,592 | 451,648 | 347,802 | — | |||||||||||||||||||||||||||||
AMB-AMS |
United States | 39 | % | 2,172,137 | 155,955 | 83,647 | — | |||||||||||||||||||||||||||||
AMB Erie |
United States | 50 | % | 821,712 | 52,650 | 20,175 | — | |||||||||||||||||||||||||||||
Total Co-Investment Operating Joint Ventures |
30 | % | 29,203,286 | 1,871,440 | 1,012,542 | 125,000 | ||||||||||||||||||||||||||||||
Co-Investment Development Joint Ventures: |
||||||||||||||||||||||||||||||||||||
AMB Partners II |
United States | 20 | % | n/a | 1,366 | — | — | |||||||||||||||||||||||||||||
AMB Institutional Alliance Fund II |
United States | 20 | % | n/a | 4,357 | — | — | |||||||||||||||||||||||||||||
Total Co-Investment Development Joint Ventures |
20 | % | — | 5,723 | — | — | ||||||||||||||||||||||||||||||
Total Co-Investment Joint Ventures |
30 | % | 29,203,286 | 1,877,163 | 1,012,542 | 125,000 | ||||||||||||||||||||||||||||||
Other Industrial Operating Joint Ventures |
92 | % | 2,196,134 | 208,092 | 28,999 | — | ||||||||||||||||||||||||||||||
Other Industrial Development Joint Ventures |
81 | % | 4,480,759 | 437,682 | 79,660 | — | ||||||||||||||||||||||||||||||
Total Consolidated Joint Ventures |
44 | % | 35,880,179 | $ | 2,522,937 | $ | 1,121,201 | $ | 125,000 | |||||||||||||||||||||||||||
| Selected Operating Results | ||||||||||||||||||||||||||||
| For the Quarter Ended September 30, 2007 | Cash NOI (8) | Net Income | FFO (8) | Share of | Cash NOI (8) | Net Income | FFO (8) | |||||||||||||||||||||
Unconsolidated Joint Ventures |
$ | 63,951 | $ | 5,184 | $ | 32,131 | AMB's | $ | 15,278 | $ | 3,425 | $ | 9,828 | |||||||||||||||
Consolidated Co-Investment Joint Ventures |
$ | 37,913 | $ | 7,654 | $ | 21,094 | Partner's | $ | 27,311 | $ | 3,380 | $ | 15,304 | |||||||||||||||
| Selected Operating Results | ||||||||||||||||||||||||||||
| For the Nine Months Ended September 30, 2007 | Cash NOI (8) | Net Income | FFO (8) | Share of | Cash NOI (8) | Net Income | FFO (8) | |||||||||||||||||||||
Unconsolidated Joint Ventures |
$ | 150,955 | $ | 17,895 | $ | 75,092 | AMB's | $ | 38,344 | $ | 7,286 | $ | 21,308 | |||||||||||||||
Consolidated Co-Investment Joint Ventures |
$ | 111,278 | $ | 21,526 | $ | 60,676 | Partner's | $ | 80,751 | $ | 11,775 | $ | 46,114 | |||||||||||||||
| (1) | See Joint Venture Partner Information. | |
| (2) | For development properties, this represents estimated square feet upon completion for committed phases of development projects. | |
| (3) | Represents the book value of the property (before accumulated depreciation) owned by the joint venture entity and excludes net other assets. Development book values include uncommitted land. | |
| (4) | AMB also has a 39% equity interest in G. Accion, a Mexican real estate company for approximately $35.3 million. G. Accion provides real estate management and development services in Mexico. | |
| (5) | The planned gross capitalizations and investment capacities of AMB Institutional Alliance Fund III and AMB Europe Fund I, as open-end funds, are not limited. The planned gross capitalization represents the gross book value of real estate assets as of the most recent quarter end, and the investment capacity represents estimated capacity based on the Fund’s current cash and leverage limitations as of the most recent quarter end. | |
| (6) | AMB Japan Fund I is a yen-denominated fund. AMB Europe Fund I is a euro-denominated fund. U.S. dollar amounts are converted at the September 30, 2007 exchange rate. | |
| (7) | Includes investments in 7.4 million square feet of operating properties through AMB’s investments in unconsolidated joint ventures that it does not manage which it excludes from its owned and managed portfolio. See Reporting Definitions for the definition of owned and managed. | |
| (8) | See Supplemental Financial Measures Disclosures and Reporting Definitions. |
18
|
|
SUPPLEMENTAL ANALYST PACKAGE 2007 Third Quarter Earnings Conference Call |
| For the Quarter | ||||
| Ended | ||||
| September 30, 2007 | ||||
AMB’s Share of cash basis NOI (1) (2) |
||||
Rental revenues |
$ | 158,740 | ||
Straight-line rents and amortization of lease intangibles |
(3,817 | ) | ||
Property operating costs |
(43,028 | ) | ||
JV Partners’ share of cash basis NOI (1) (2) |
(27,674 | ) | ||
AMB’s share of transaction activity adjustments to NOI (1) (2) (3) |
(7,771 | ) | ||
AMB’s share of unconsolidated JV’s cash basis NOI (1) (2) |
15,278 | |||
Total AMB’s share of cash basis NOI (1) (2) |
$ | 91,728 | ||
Private capital income |
$ | 7,564 | ||
AMB’s share of land and development projects |
||||
AMB’s share of land held for future development (2) (4) |
$ | 453,729 | ||
AMB’s share of developments and renovations in process (2) (4) |
$ | 1,010,000 | ||
AMB’s share of development projects held for contribution or sale (2) (4) |
$ | 285,064 | ||
AMB’s share of assets contributed to private capital joint ventures (2) (4) |
$ | 43,572 | ||
AMB’s share of total debt and preferred securities (1) (2) (4) |
$ | 3,361,365 | ||
AMB’s share of select balance sheet items (owned and managed portfolio): (1) (2) |
||||
Cash and cash equivalents |
$ | 384,326 | ||
Mortgages and loans receivable |
4,593 | |||
Accounts receivable (net) and other assets |
297,997 | |||
Deferred rents receivable and deferred financing costs (net) |
(78,868 | ) | ||
Accounts payable and other liabilities |
(349,386 | ) | ||
AMB’s share of other assets and liabilities |
$ | 258,662 | ||
| (1) | See Supplemental Financial Disclosures. | |
| (2) | See Reporting Definitions for definitions of “AMB’s share of”, “JV Partner’s share of” and “owned and managed”, as applicable. | |
| (3) | Transaction activity adjustments to NOI stabilizes NOI for acquisitions and development completions and removes NOI generated from in-progress developments, contributed developments, and projects held for sale or contribution. | |
| (4) | See Property Contributions & Dispositions, Development Projects in Process, Development Projects Placed in Operations & Projects Available for Sale or Contribution, Land Inventory or Capitalization Summary and their respective footnotes for further information. |
19
|
|
SUPPLEMENTAL ANALYST PACKAGE 2007 Third Quarter Earnings Conference Call |
20
|
|
SUPPLEMENTAL ANALYST PACKAGE 2007 Third Quarter Earnings Conference Call |
| For the Quarters Ended | For the Nine Months Ended | |||||||||||||||
| September 30, | September 30, | |||||||||||||||
| 2007 | 2006 | 2007 | 2006 | |||||||||||||
Net income |
$ | 73,110 | $ | 33,387 | $ | 217,061 | $ | 136,317 | ||||||||
Depreciation and amortization |
40,865 | 46,914 | 122,433 | 133,514 | ||||||||||||
Impairment losses |
— | — | 257 | 5,394 | ||||||||||||
Stock-based compensation amortization |
4,114 | 3,445 | 13,517 | 14,386 | ||||||||||||
Adjustments to derive adjusted EBITDA from unconsolidated JVs: |
||||||||||||||||
AMB’s share of net income |
(3,425 | ) | (2,239 | ) | (7,286 | ) | (12,605 | ) | ||||||||
AMB’s share of FFO |
9,828 | 4,030 | 21,308 | 9,335 | ||||||||||||
AMB’s share of interest expense |
6,033 | 2,146 | 14,350 | 6,601 | ||||||||||||
AMB’s share of development profits, net of taxes |
— | — | ||||||||||||||
Interest expense, including amortization |
28,896 | 43,966 | 96,394 | 127,487 | ||||||||||||
Total minority interests’ share of income |
10,049 | 16,938 | 37,953 | 45,855 | ||||||||||||
Total discontinued operations, including gains |
(6,315 | ) | (3,772 | ) | (86,443 | ) | (37,811 | ) | ||||||||
Discontinued operations’ adjusted EBITDA |
2,627 | 5,688 | 7,429 | 16,492 | ||||||||||||
Adjusted EBITDA |
$ | 165,782 | $ | 150,503 | $ | 436,973 | $ | 444,965 | ||||||||
21
|
|
SUPPLEMENTAL ANALYST PACKAGE 2007 Third Quarter Earnings Conference Call |
| For the Quarters Ended | For the Nine Months Ended | |||||||||||||||
| September 30, | September 30, | |||||||||||||||
| Fixed charge | 2007 | 2006 | 2007 | 2006 | ||||||||||||
Interest expense, including amortization — continuing operations |
$ | 28,896 | $ | 43,966 | $ | 96,394 | $ | 127,487 | ||||||||
Amortization of financing costs and debt premiums — continuing operations |
(1,473 | ) | (1,612 | ) | (3,508 | ) | (6,085 | ) | ||||||||
Interest expense, including amortization — discontinued operations |
— | (91 | ) | (1,170 | ) | (932 | ) | |||||||||
Amortization of financing costs and debt premiums — discontinued operations |
— | (2 | ) | (2 | ) | (5 | ) | |||||||||
AMB’s share of interest expense from unconsolidated JVs |
6,033 | 2,146 | 14,350 | 6,601 | ||||||||||||
Capitalized interest |
15,227 | 11,383 | 45,595 | 29,934 | ||||||||||||
Preferred unit distributions |
1,431 | 3,791 | 6,610 | 12,816 | ||||||||||||
Preferred stock dividends |
3,952 | 3,440 | 11,856 | 9,631 | ||||||||||||
Total fixed charge |
$ | 54,066 | $ | 63,021 | $ | 170,125 | $ | 179,447 | ||||||||
| For the Quarters Ended | For the Nine Months Ended | |||||||||||||||
| September 30, | September 30, | |||||||||||||||
| Interest | 2007 | 2006 | 2007 | 2006 | ||||||||||||
Interest expense, including amortization — continuing operations |
$ | 28,896 | $ | 43,966 | $ | 96,394 | $ | 127,487 | ||||||||
Interest expense, including amortization — discontinued operations |
— | (91 | ) | (1,170 | ) | (932 | ) | |||||||||
AMB’s share of interest expense from unconsolidated JVs |
6,033 | 2,146 | 14,350 | 6,601 | ||||||||||||
Total interest |
$ | 34,929 | $ | 46,021 | $ | 109,574 | $ | 133,156 | ||||||||
22
|
|
SUPPLEMENTAL ANALYST PACKAGE 2007 Third Quarter Earnings Conference Call |
| For the Quarters Ended | For the Nine Months Ended | |||||||||||||||
| September 30, | September 30, | |||||||||||||||
| 2007 | 2006 | 2007 | 2006 | |||||||||||||
Net income |
$ | 73,110 | $ | 33,387 | $ | 217,061 | $ | 136,317 | ||||||||
Private capital income |
(7,564 | ) | (7,490 | ) | (22,007 | ) | (17,539 | ) | ||||||||
Depreciation and amortization |
40,865 | 46,914 | 122,433 | 133,514 | ||||||||||||
Impairment losses |
— | — | 257 | 5,394 | ||||||||||||
General and administrative and fund costs |
35,406 | 26,136 | 96,038 | 75,226 | ||||||||||||
Total other income and expenses |
(29,839 | ) | 16,192 | (92,238 | ) | 37,411 | ||||||||||
Total minority interests’ share of income |
10,049 | 16,938 | 37,953 | 45,855 | ||||||||||||
Total discontinued operations |
(6,315 | ) | (3,772 | ) | (11,600 | ) | (37,811 | ) | ||||||||
NOI |
115,712 | 128,305 | 347,897 | 378,367 | ||||||||||||
Less non same-store NOI |
(13,932 | ) | (30,631 | ) | (48,372 | ) | (89,011 | ) | ||||||||
Less non cash adjustments (1) |
(261 | ) | (2,384 | ) | (2,596 | ) | (8,445 | ) | ||||||||
Cash-basis same-store NOI |
$ | 101,519 | $ | 95,290 | $ | 296,929 | $ | 280,911 | ||||||||
| (1) | Non-cash adjustments include straight line rents and amortization of lease intangibles for the same store pool only. |
23
|
|
SUPPLEMENTAL ANALYST PACKAGE 2007 Third Quarter Earnings Conference Call |
24
|
|
SUPPLEMENTAL ANALYST PACKAGE 2007 Third Quarter Earnings Conference Call |
| Contact Name | Title | Phone | E-mail Address | |||
Hamid R. Moghadam
|
Chairman & Chief Executive Officer | (415) 733-9401 | hmoghadam@amb.com | |||
Thomas S. Olinger
|
Chief Financial Officer | (415) 733-9405 | tolinger@amb.com | |||
Guy F. Jaquier
|
President, Europe and Asia | (415) 733-9406 | gjaquier@amb.com | |||
Eugene F. Reilly
|
President, The Americas | (617) 619-9333 | ereilly@amb.com | |||
John T. Roberts, Jr.
|
President, Private Capital; President, AMB Capital Partners, LLC | (415) 733-9408 | jroberts@amb.com | |||
Margan S. Mitchell
|
VP, Corporate Communications | (415) 733-9477 | mmitchell@amb.com | |||
Tracy A. Ward
|
Director, Investor Relations | (415) 733-9565 | tward@amb.com |
| Corporate Headquarters | Investor Relations | Other Office Locations | ||||||||
AMB Property Corporation
|
Tel: (415) 394-9000 | Amsterdam | Dallas | New Jersey | Shenzhen | |||||
Pier 1, Bay 1
|
Fax: (415) 394-9001 | Atlanta | Frankfurt | New York | Singapore | |||||
San Francisco, CA 94111
|
E-mail: ir@amb.com | Baltimore | Los Angeles | Osaka | Tokyo | |||||
Tel: (415) 394-9000
|
Website: www.amb.com | Beijing | Menlo Park | Paris | Vancouver | |||||
Fax: (415) 394-9001
|
Boston | Nagoya | Seoul | |||||||
| Chicago | Narita | Shanghai | ||||||||
25

26