
UNITED STATES SECURITIES AND EXCHANGE COMMISSION
Washington, D.C. 20549
FORM 10-K
(Mark One)
|
☑ |
ANNUAL REPORT PURSUANT TO SECTION 13 OR 15(d) OF THE SECURITIES EXCHANGE ACT OF 1934 |
For the fiscal year ended December 31, 2016
or
|
☐ |
TRANSITION REPORT PURSUANT TO SECTION 13 OR 15(d) OF THE SECURITIES EXCHANGE ACT OF 1934 |
For the transition period from to
Commission File Number: 001-13545 (Prologis, Inc.) 001-14245 (Prologis, L.P.)
Prologis, Inc.
Prologis, L.P.
(Exact name of registrant as specified in its charter)
|
Maryland (Prologis, Inc.) Delaware (Prologis, L.P.) |
94-3281941 (Prologis, Inc.) 94-3285362 (Prologis, L.P.) |
|
(State or other jurisdiction of incorporation or organization) |
(I.R.S. Employer Identification No.) |
|
|
|
|
Pier 1, Bay 1, San Francisco, California |
94111 |
|
(Address or principal executive offices) |
(Zip Code) |
(415) 394-9000
(Registrant’s telephone number, including area code)
Securities registered pursuant to Section 12(b) of the Act:
|
|
|
Title of Each Class |
|
Name of Each Exchange on Which Registered |
|
Prologis, Inc. |
|
Common Stock, $0.01 par value |
|
New York Stock Exchange |
|
Prologis, L.P. |
|
4.000% Notes due 2018 |
|
New York Stock Exchange |
|
Prologis, L.P. |
|
1.375% Notes due 2020 |
|
New York Stock Exchange |
|
Prologis, L.P. |
|
1.375% Notes due 2021 |
|
New York Stock Exchange |
|
Prologis, L.P. |
|
3.000% Notes due 2022 |
|
New York Stock Exchange |
|
Prologis, L.P. |
|
3.375% Notes due 2024 |
|
New York Stock Exchange |
|
Prologis, L.P. |
|
3.000% Notes due 2026 |
|
New York Stock Exchange |
Securities registered pursuant to Section 12(g) of the Act:
Prologis, Inc. – NONE
Prologis, L.P. – NONE
Indicate by check mark if the registrant is a well-known seasoned issuer, as defined in Rule 405 of the Securities Act.
Prologis, Inc.: Yes ☑ No ☐
Prologis, L.P.: Yes ☑ No ☐
Indicate by check mark if the registrant is not required to file reports pursuant to Section 13 or Section 15(d) of the Act.
Prologis, Inc.: Yes ☐ No ☑
Prologis, L.P.: Yes ☐ No ☑
Indicate by check mark whether the registrant: (1) has filed all reports required to be filed by Section 13 or 15(d) of the Securities Exchange Act of 1934 during the preceding 12 months (or for such shorter period that the registrant was required to file such reports), and (2) has been subject to such filing requirements for the past 90 days. Prologis, Inc.: Yes ☑ No ☐ Prologis, L.P.: Yes ☑ No ☐
Indicate by check mark whether the registrant has submitted electronically and posted on its corporate website; if any, every Interactive Data File required to be submitted and posted pursuant to Rule 405 of Regulation S-T during the preceding 12 months (or for such shorter periods that the registrant was required to submit and post such files). Prologis, Inc.: Yes ☑ No ☐ Prologis, L.P.: Yes ☑ No ☐
Indicate by check mark if disclosure of delinquent filers pursuant to Item 405 of Regulation S-K is not contained herein, and will not be contained, to the best of registrant’s knowledge, in definitive proxy or information statements incorporated by reference in Part III of this Form 10-K or any amendment to this Form 10-K. ☐
Indicate by check mark whether the registrant is a large accelerated filer, an accelerated filer, a non-accelerated filer, or a smaller reporting company. See the definitions of “large accelerated filer,” “accelerated filer” and “smaller reporting company” in Rule 12b-2 of the Exchange Act (check one):
|
Prologis, Inc.: |
☑ Large accelerated filer |
☐ Accelerated filer |
|
|
☐ Non-accelerated filer (do not check if a smaller reporting company) |
☐ Smaller reporting company |
|
Prologis, L.P.: |
☐ Large accelerated filer |
☐ Accelerated filer |
|
|
☑ Non-accelerated filer (do not check if a smaller reporting company) |
☐ Smaller reporting company |
Indicate by check mark whether the registrant is a shell company (as defined in Rule 12b-2 of the Securities Exchange Act of 1934).
Prologis, Inc.: Yes ☐ No ☑
Prologis, L.P.: Yes ☐ No ☑
Based on the closing price of Prologis, Inc.’s common stock on June 30, 2016, the aggregate market value of the voting common equity held by nonaffiliates of Prologis, Inc. was $25,583,323,441.
The number of shares of Prologis, Inc.’s common stock outstanding at February 10, 2017, was approximately 529,345,000.
DOCUMENTS INCORPORATED BY REFERENCE
Portions of Part III of this report are incorporated by reference to the registrant’s definitive proxy statement for the 2017 annual meeting of its stockholders or will be provided in an amendment filed on Form 10-K/A.
This report combines the annual reports on Form 10-K for the year ended December 31, 2016, of Prologis, Inc. and Prologis, L.P. Unless stated otherwise or the context otherwise requires, references to “Prologis, Inc.” or the “Parent” mean Prologis, Inc. and its consolidated subsidiaries; and references to “Prologis, L.P.” or the “Operating Partnership” mean Prologis, L.P., and its consolidated subsidiaries. The terms “the Company,” “Prologis,” “we,” “our” or “us” means the Parent and the Operating Partnership collectively.
The Parent is a real estate investment trust (a “REIT”) and the general partner of the Operating Partnership. At December 31, 2016, the Parent owned an approximate 97.42% common general partnership interest in the Operating Partnership and 100% of the preferred units in the Operating Partnership. The remaining approximate 2.58% common limited partnership interests are owned by nonaffiliated investors and certain current and former directors and officers of the Parent. As the sole general partner of the Operating Partnership, the Parent has complete responsibility and discretion in the day-to-day management and control of the Operating Partnership.
We operate the Parent and the Operating Partnership as one enterprise. The management of the Parent consists of the same members as the management of the Operating Partnership. These members are officers of the Parent and employees of the Operating Partnership or one of its subsidiaries. As general partner with control of the Operating Partnership, the Parent consolidates the Operating Partnership for financial reporting purposes. Because the only significant asset of the Parent is its investment in the Operating Partnership, the assets and liabilities of the Parent and the Operating Partnership are the same on their respective financial statements.
We believe combining the annual reports on Form 10-K of the Parent and the Operating Partnership into this single report results in the following benefits:
|
• |
enhances investors’ understanding of the Parent and the Operating Partnership by enabling investors to view the business as a whole in the same manner as management views and operates the business; |
|
• |
eliminates duplicative disclosure and provides a more streamlined and readable presentation as a substantial portion of the Company’s disclosure applies to both the Parent and the Operating Partnership; and |
|
• |
creates time and cost efficiencies through the preparation of one combined report instead of two separate reports. |
It is important to understand the few differences between the Parent and the Operating Partnership in the context of how we operate the Company. The Parent does not conduct business itself, other than acting as the sole general partner of the Operating Partnership and issuing public equity from time to time. The Parent itself does not incur any indebtedness, but it guarantees the unsecured debt of the Operating Partnership. The Operating Partnership holds substantially all the assets of the business, directly or indirectly, and holds the ownership interests in the Company’s investment in certain entities. The Operating Partnership conducts the operations of the business and is structured as a partnership with no publicly traded equity. Except for net proceeds from equity issuances by the Parent, which are contributed to the Operating Partnership in exchange for partnership units, the Operating Partnership generates capital required by the business through the Operating Partnership’s operations, incurrence of indebtedness and issuance of partnership units to third parties.
The presentation of noncontrolling interests, stockholders’ equity and partners’ capital are the main areas of difference between the consolidated financial statements of the Parent and those of the Operating Partnership. The common limited partnership interests held by the limited partners in the Operating Partnership are presented as limited partners’ capital within partners’ capital in the Operating Partnership’s consolidated financial statements and as noncontrolling interest within equity in the Parent’s consolidated financial statements. The common and preferred partnership interests held by the Parent in the Operating Partnership are presented as general partner’s capital within partners’ capital in the Operating Partnership’s consolidated financial statements and as preferred stock, common stock, additional paid-in capital, accumulated other comprehensive loss and distributions in excess of net earnings within stockholders’ equity in the Parent’s consolidated financial statements. The differences in the presentations between stockholders’ equity and partners’ capital result from the differences in the equity and capital issuances at the Parent and Operating Partnership levels.
To highlight the differences between the Parent and the Operating Partnership, separate sections in this report, as applicable, individually discuss the Parent and the Operating Partnership, including separate financial statements and separate Exhibit 31 and 32 certifications. In the sections that combine disclosure of the Parent and the Operating Partnership, this report refers to actions or holdings as being actions or holdings of Prologis.
|
Item |
|
Description |
|
Page |
|
|
|
|
|
|
|
1. |
|
|
3 |
|
|
|
|
|
3 |
|
|
|
|
|
5 |
|
|
|
|
|
7 |
|
|
|
|
|
8 |
|
|
|
|
|
8 |
|
|
1A. |
|
|
8 |
|
|
1B. |
|
|
15 |
|
|
2. |
|
|
15 |
|
|
|
|
|
15 |
|
|
|
|
|
18 |
|
|
|
|
|
19 |
|
|
3. |
|
|
19 |
|
|
4. |
|
|
19 |
|
|
|
|
|
|
|
|
5. |
|
|
20 |
|
|
|
|
|
20 |
|
|
|
|
|
21 |
|
|
|
|
|
21 |
|
|
|
|
Securities Authorized for Issuance Under Equity Compensation Plans |
|
21 |
|
|
|
|
21 |
|
|
6. |
|
|
22 |
|
|
7. |
|
Management’s Discussion and Analysis of Financial Condition and Results of Operations |
|
22 |
|
|
|
|
22 |
|
|
|
|
|
23 |
|
|
|
|
|
32 |
|
|
|
|
|
33 |
|
|
|
|
|
37 |
|
|
|
|
|
38 |
|
|
|
|
|
38 |
|
|
|
|
|
40 |
|
|
|
|
Funds from Operations Attributable to Common Stockholders/Unitholders ("FFO") |
|
40 |
|
7A. |
|
|
42 |
|
|
8. |
|
|
43 |
|
|
9. |
|
Changes in and Disagreements with Accountants on Accounting and Financial Disclosure |
|
43 |
|
9A. |
|
|
43 |
|
|
9B. |
|
|
44 |
|
|
|
|
|
|
|
|
10. |
|
|
44 |
|
|
11. |
|
|
44 |
|
|
12. |
|
Security Ownership of Certain Beneficial Owners and Management and Related Stockholder Matters |
|
44 |
|
13. |
|
Certain Relationships and Related Transactions, and Director Independence |
|
45 |
|
14. |
|
|
45 |
|
|
|
|
|
|
|
|
15. |
|
|
45 |
|
|
16. |
|
|
45 |
2
The statements in this report that are not historical facts are forward-looking statements within the meaning of Section 27A of the Securities Act of 1933, as amended, and Section 21E of the Securities Exchange Act of 1934, as amended. These forward-looking statements are based on current expectations, estimates and projections about the industry and markets in which we operate as well as management’s beliefs and assumptions. Such statements involve uncertainties that could significantly impact our financial results. Words such as “expects,” “anticipates,” “intends,” “plans,” “believes,” “seeks,” and “estimates” including variations of such words and similar expressions are intended to identify such forward-looking statements, which generally are not historical in nature. All statements that address operating performance, events or developments that we expect or anticipate will occur in the future — including statements relating to rent and occupancy growth, development activity, contribution and disposition activity, general conditions in the geographic areas where we operate, our debt, capital structure and financial position, our ability to form new co-investment ventures and the availability of capital in existing or new co-investment ventures — are forward-looking statements. These statements are not guarantees of future performance and involve certain risks, uncertainties and assumptions that are difficult to predict. Although we believe the expectations reflected in any forward-looking statements are based on reasonable assumptions, we can give no assurance that our expectations will be attained, and therefore actual outcomes and results may differ materially from what is expressed or forecasted in such forward-looking statements. Some of the factors that may affect outcomes and results include, but are not limited to: (i) national, international, regional and local economic and political climates, (ii) changes in global financial markets, interest rates and foreign currency exchange rates, (iii) increased or unanticipated competition for our properties, (iv) risks associated with acquisitions, dispositions and development of properties, (v) maintenance of REIT status, tax structuring and changes in income tax rates, (vi) availability of financing and capital, the levels of debt that we maintain and our credit ratings, (vii) risks related to our investments in our co-investment ventures, including our ability to establish new co-investment ventures, (viii) risks of doing business internationally, including currency risks, (ix) environmental uncertainties, including risks of natural disasters, and (x) those additional factors discussed under Item 1A. Risk Factors in this report. We undertake no duty to update any forward-looking statements appearing in this report except as may be required by law.
Prologis, Inc. is a self-administered REIT and is the sole general partner of Prologis, L.P. We operate Prologis, Inc. and Prologis, L.P. as one enterprise and, therefore, our discussion and analysis refers to Prologis, Inc. and its consolidated subsidiaries, including Prologis, L.P., collectively.
Prologis, Inc. began operating as a fully integrated real estate company in 1997 and elected to be taxed as a REIT under the Internal Revenue Code of 1986, as amended (“Internal Revenue Code”). We believe the current organization and method of operation will enable Prologis, Inc. to maintain its status as a REIT. Prologis, L.P. also was formed in 1997.
Our corporate headquarters are at Pier 1, Bay 1, San Francisco, California 94111, and our other principal offices are located in Amsterdam, Denver, Luxembourg, Mexico City, Shanghai, Singapore and Tokyo.
Our Internet address is www.prologis.com. All reports required to be filed with the Securities and Exchange Commission (“SEC”) are available and can be accessed free of charge through the Investor Relations section of our website, www.prologis.com. The common stock of Prologis, Inc. is listed on the New York Stock Exchange (“NYSE”) under the ticker “PLD” and is a component of the Standard & Poor’s (“S&P”) 500.
We are the global leader in logistics real estate with a focus on high-barrier, high-growth markets. We own, manage and develop high-quality logistics facilities in the world’s most active centers of commerce. An investment in Prologis taps into key drivers of economic growth, including consumption, supply chain modernization, e-commerce and urbanization.
Customers turn to us because they know an efficient supply chain will make their businesses run better, and that a strategic relationship with Prologis will create a competitive advantage. We lease modern logistics facilities to a diverse base of approximately 5,200 customers. These facilities assist the efficient distribution of goods for the world’s best businesses and brands.
We invest in Class-A logistics facilities in the world’s primary population centers with high barriers to entry and supported by extensive transportation infrastructure (major airports, seaports, rail systems and highway systems). We believe our portfolio is the highest-quality logistics property portfolio in the industry because it is focused in those key markets. Our local teams actively manage the portfolio, which encompasses leasing and property management, new capital deployment activities and an opportunistic disposition program. The majority of our consolidated properties are in the United States (or “U.S.”); while outside the U.S., our properties are generally held in co-investment ventures, which reduces our exposure to movements in foreign currency. Therefore, we are principally an owner-operator in the U.S. and a manager-developer outside the U.S.
Macroeconomics and demographics are important drivers of our business; these drivers include population growth, consumption and rising affluence. In the developed markets of U.S., Europe and Japan, key factors are the reconfiguration of supply chains (strongly influenced by e-commerce trends), and the operational efficiencies that can be realized from our modern logistics facilities. In emerging markets, such as Brazil, China and Mexico, new affluence and the rise of the consumer classes have prompted demand as supply chains are constructed. Taken together, logistics real estate markets benefit from economic growth, as well as from the modernization of supply chains around the world.
3
We manage our business on an owned and managed basis, including properties wholly owned by us or owned by one of our co-investment ventures, which allows us to make decisions based on the property operations versus our ownership. We believe the operating fundamentals of our owned and managed portfolio are consistent with those of our consolidated portfolio, and therefore we generally look at operating metrics on an owned and managed basis.
At December 31, 2016, we owned or had investments in, on a wholly owned basis or through co-investment ventures, properties and development projects expected to total $52.1 billion in gross total investment across 676 million square feet (63 million square meters) in 20 countries spanning four continents. Our investment was $30.8 billion, which consisted of our wholly-owned properties and our pro rata (or ownership) share of the properties owned by our co-investment ventures.
Throughout this document, we reflect amounts in U.S. dollars, our reporting currency. Included in these amounts are consolidated and unconsolidated investments denominated in foreign currencies, primarily the British pound sterling, euro and Japanese yen that are impacted by fluctuations in exchange rates when translated into U.S. dollars. We mitigate our exposure to foreign currency fluctuations by investing outside the U.S. through co-investment ventures, borrowing in local currency and utilizing derivative instruments.
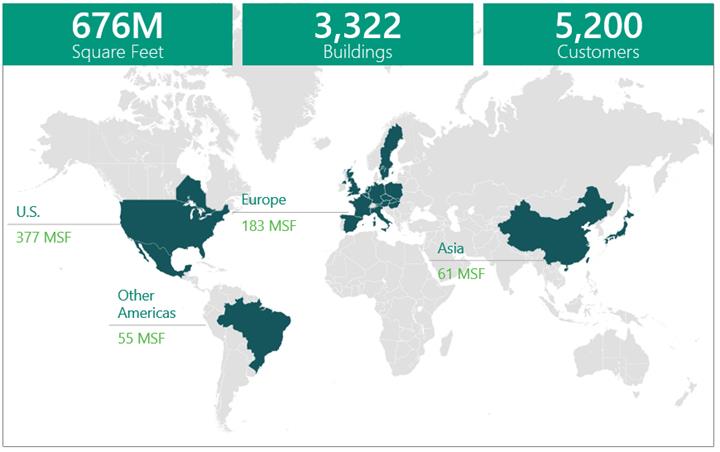
Details of the 676 million square feet at December 31, 2016, in our owned and managed portfolio were as follows (dollars and square feet in millions):
|
|
|
U.S. |
|
|
Other Americas |
|
|
Europe |
|
|
Asia |
|
|
Total |
|
|||||
|
Operating portfolio (number of buildings) |
|
|
2,058 |
|
|
|
240 |
|
|
736 |
|
|
102 |
|
|
|
3,136 |
|
||
|
|
|
|
|
|
|
|
|
|
|
|
|
|
|
|
|
|
|
|
|
|
|
Operating portfolio (square feet) |
|
|
358 |
|
|
|
51 |
|
|
|
172 |
|
|
|
41 |
|
|
|
622 |
|
|
Development portfolio (square feet) |
|
|
12 |
|
|
|
4 |
|
|
|
9 |
|
|
|
19 |
|
|
|
44 |
|
|
Other real estate properties (square feet) |
|
|
7 |
|
|
|
- |
|
|
|
2 |
|
|
|
1 |
|
|
|
10 |
|
|
Total square feet |
|
|
377 |
|
|
|
55 |
|
|
|
183 |
|
|
|
61 |
|
|
|
676 |
|
|
|
|
|
|
|
|
|
|
|
|
|
|
|
|
|
|
|
|
|
|
|
|
Operating portfolio (gross book value) |
|
$ |
27,148 |
|
|
$ |
3,100 |
|
|
$ |
12,010 |
|
|
$ |
5,021 |
|
|
$ |
47,279 |
|
|
Development portfolio (TEI) (1) |
|
|
924 |
|
|
|
304 |
|
|
|
669 |
|
|
|
1,488 |
|
|
|
3,385 |
|
|
Land portfolio (gross book value) |
|
|
474 |
|
|
|
356 |
|
|
|
431 |
|
|
|
164 |
|
|
|
1,425 |
|
|
Total |
|
$ |
28,546 |
|
|
$ |
3,760 |
|
|
$ |
13,110 |
|
|
$ |
6,673 |
|
|
$ |
52,089 |
|
4
Our operating portfolio includes stabilized logistics facilities in our owned and managed portfolio. A developed property moves into the operating portfolio when it meets stabilization. The property is considered stabilized when a development project has been completed for one year or is at least 90% occupied, whichever occurs first.
BUSINESS STRATEGY AND OPERATING SEGMENTS
Our business comprises two operating segments: Real Estate Operations and Strategic Capital.
|
REAL ESTATE – RENTAL OPERATIONS Generate revenues and net operating income (“NOI”) by maintaining high occupancy rates and increasing rents |
REAL ESTATE – DEVELOPMENT Generate value from development |
STRATEGIC CAPITAL
Access third-party capital to grow our business and earn recurring fees and promotes |
|
We have a high-quality logistics portfolio that serves premier companies across the globe. For the year ended December 31, 2016, we:
•generated over 90% of our consolidated revenues and NOI from our buildings in the U.S. •increased consolidated revenues and NOI over 12% from 2015 •ended the year with consolidated occupancy of 97.0% |
Development contributes to significant earnings growth as projects lease up and generate revenues and NOI. For the year ended December 31, 2016, we:
•stabilized a total estimated investment in our owned and managed portfolio of $2.5 billion of development projects with an estimated weighted average margin of 25.5% •created $640 million of value (of which $571 million is our share) |
Durable fee stream with more than 90% from perpetual or long-life co-investment ventures with some of the world’s largest institutional partners. For the year ended December 31, 2016, we:
•generated approximately 90% of our consolidated Strategic Capital revenues from outside the U.S. •increased consolidated Strategic Capital revenues over 40% from 2015 |
Real Estate Operations
Rental Operations. Rental operations comprise the largest component of our operating segments and contributed approximately 90% of our consolidated revenues, earnings and funds from operations in 2016 (see Item 7. Management’s Discussion and Analysis of Financial Condition and Results of Operations for more information on funds from operations, a non-GAAP measure). We collect rent from our customers through operating leases, including reimbursements for the majority of our property operating costs. We expect to generate long-term internal growth by maintaining high occupancy rates, increasing rents and controlling expenses. We believe our active portfolio management, coupled with the skills of our property, leasing, maintenance, capital, energy and risk management teams, will allow us to maximize rental revenues across our portfolio. In 2016, over 90% of our consolidated revenues and NOI in this segment were generated in the U.S. NOI from this segment is calculated directly from our financial statements as rental revenues, rental recoveries and development management and other revenues less rental expenses and other expenses.
Development. We utilize (i) our land bank, (ii) the development expertise of our local teams, (iii) our customer relationships and (iv) our in-depth local knowledge in connection with our development activities. Successful development and redevelopment efforts increase both the rental revenues and the net asset value of our Real Estate Operations segment. We measure the value we created based on the increase in estimated fair value of a stabilized development property, as compared to the costs incurred. Generally, we develop properties in the U.S. for long-term hold and outside the U.S. for contribution to our co-investment ventures. Occasionally, we develop for sale to third parties.
Strategic Capital
Real estate is a capital-intensive business that requires growth capital. Our strategic capital business gives us access to third-party capital, both private and public, which allows us to diversify our sources of capital and therefore have a broader range of options to fund our growth. We co-invest with some of the world’s largest institutional partners to grow our business and provide incremental revenues. We also access alternative sources of equity through two publicly traded vehicles: Nippon Prologis REIT, Inc. (“NPR”) in Japan and FIBRA Prologis in Mexico. We tailor logistics portfolios to meet our partners’ specific needs, with a focus on long-term ventures and open-ended funds. We hold significant ownership interests in these ventures, aligning our interests with those of our partners.
5
We generate strategic capital revenues from our unconsolidated ventures principally through asset management and property management services, and we earn additional revenues by providing leasing, acquisition, construction, development, financing and disposition services. Depending on the structure of the venture and the returns provided to our partners, we also earn revenues through incentive fees (“promotes”) periodically during the life of a venture or upon liquidation. In 2016, we earned promote revenues in Europe of $89 million. Approximately 40% of promote revenues are paid as a combination of cash and stock awards pursuant to the terms of the Prologis Promote Plan and expensed through Strategic Capital Expenses. This segment contributed approximately 10% of our consolidated revenues, earnings and funds from operations in 2016. We plan to grow this business through increasing the assets under management in our existing ventures. In 2016, approximately 90% of the consolidated revenues and NOI in this segment were generated outside the U.S. NOI in this segment is calculated as Strategic Capital Revenues less Strategic Capital Expenses directly from each line item in the Consolidated Financial Statements in Item 8. Financial Statements and Supplementary Data and does not include property related NOI.
Competition
Competitively priced logistics space could impact our occupancy rates and have an adverse effect on how much rent we can charge, which in turn could affect both of our operating segments. We may face competition with regard to our capital deployment activities, including local, regional and national operators or developers. We also face competition from investment managers for institutional capital within our strategic capital business.
We believe we have competitive advantages due to our:
|
• |
properties being focused in the world’s primary population centers with high barriers to entry and supported by extensive transportation infrastructure; |
|
• |
ability to respond quickly to customers’ needs for high-quality logistics facilities; |
|
• |
established relationships with key customers served by our local teams; |
|
• |
ability to leverage our organizational scale and structure to provide a single point of contact for our focus customers through our global customer solutions team; |
|
• |
property management and leasing expertise; |
|
• |
relationships and proven track record with current and prospective investors in our strategic capital business; |
|
• |
experience developing and managing logistics facilities; |
|
• |
well-positioned land bank; and |
|
• |
team members with experience in the land entitlement and development processes. |
Customers
Our broad customer base represents a spectrum of international, national, regional and local logistics users. At December 31, 2016, in our Real Estate Operations segment representing our consolidated properties, we had more than 3,200 customers occupying 334 million square feet of logistics space. On an owned and managed basis, we had more than 5,200 customers occupying 625 million square feet of logistics space.
In our Strategic Capital segment, we view our partners and investors as our customers. At December 31, 2016, in our private ventures, we partnered with approximately 100 investors, several of which invest in multiple ventures.
6
The following table details our top 25 customers at December 31, 2016 (square feet in millions):
|
|
Consolidated – Real Estate Operations |
|
|
|
Owned and Managed |
|
||||||||||
|
Top Customers |
% of NER (1) |
|
|
Total Occupied Square Feet |
|
|
Top Customers |
% of NER (1) |
|
|
Total Occupied Square Feet |
|
||||
|
1. Amazon.com |
|
5.0 |
|
|
|
13 |
|
|
1. Amazon.com |
|
3.1 |
|
|
|
15 |
|
|
2. Home Depot |
|
1.8 |
|
|
|
5 |
|
|
2. DHL |
|
1.6 |
|
|
|
10 |
|
|
3. FedEx |
|
1.3 |
|
|
|
3 |
|
|
3. Geodis |
|
1.2 |
|
|
|
9 |
|
|
4. XPO Logistics |
|
1.0 |
|
|
|
4 |
|
|
4. XPO Logistics |
|
1.2 |
|
|
|
9 |
|
|
5. Wal-Mart |
|
0.9 |
|
|
|
3 |
|
|
5. Kuehne + Nagel |
|
1.1 |
|
|
|
7 |
|
|
6. BMW |
|
0.9 |
|
|
|
3 |
|
|
6. FedEx |
|
1.0 |
|
|
|
4 |
|
|
7. U.S. Government |
|
0.9 |
|
|
|
1 |
|
|
7. Home Depot |
|
0.9 |
|
|
|
6 |
|
|
8. Ingram Micro |
|
0.8 |
|
|
|
2 |
|
|
8. CEVA Logistics |
|
0.9 |
|
|
|
6 |
|
|
9. PepsiCo |
|
0.7 |
|
|
|
3 |
|
|
9. Wal-Mart |
|
0.8 |
|
|
|
5 |
|
|
10. DSV Air and Sea |
|
0.6 |
|
|
|
2 |
|
|
10. DSV Air and Sea |
|
0.8 |
|
|
|
5 |
|
|
Top 10 Customers |
|
13.9 |
|
|
|
39 |
|
|
Top 10 Customers |
|
12.6 |
|
|
|
76 |
|
|
11. UPS |
|
0.6 |
|
|
|
2 |
|
|
11. Nippon Express |
|
0.7 |
|
|
|
3 |
|
|
12. Kuehne + Nagel |
|
0.6 |
|
|
|
2 |
|
|
12. BMW |
|
0.6 |
|
|
|
4 |
|
|
13. APL Logistics |
|
0.6 |
|
|
|
2 |
|
|
13. UPS |
|
0.6 |
|
|
|
3 |
|
|
14. Best Buy |
|
0.6 |
|
|
|
2 |
|
|
14. Hitachi |
|
0.5 |
|
|
|
2 |
|
|
15. DHL |
|
0.5 |
|
|
|
2 |
|
|
15. DB Schenker |
|
0.5 |
|
|
|
4 |
|
|
16. Cal Cartage Company |
|
0.5 |
|
|
|
1 |
|
|
16. U.S. Government |
|
0.5 |
|
|
|
1 |
|
|
17. Sears |
|
0.5 |
|
|
|
2 |
|
|
17. Tesco |
|
0.5 |
|
|
|
3 |
|
|
18. Kimberly-Clark |
|
0.5 |
|
|
|
2 |
|
|
18. Ingram Micro |
|
0.5 |
|
|
|
3 |
|
|
19. Geodis |
|
0.5 |
|
|
|
2 |
|
|
19. Panalpina |
|
0.4 |
|
|
|
2 |
|
|
20. NFI Industries |
|
0.4 |
|
|
|
2 |
|
|
20. PepsiCo |
|
0.4 |
|
|
|
3 |
|
|
21. Office Depot |
|
0.4 |
|
|
|
1 |
|
|
21. Samsung Electronics |
|
0.3 |
|
|
|
2 |
|
|
22. Kellogg's |
|
0.4 |
|
|
|
2 |
|
|
22. Best Buy |
|
0.3 |
|
|
|
2 |
|
|
23. Mohawk Industries |
|
0.4 |
|
|
|
1 |
|
|
23. APL Logistics |
|
0.3 |
|
|
|
2 |
|
|
24. C&S Wholesale Grocers |
|
0.4 |
|
|
|
1 |
|
|
24. Under Armour |
|
0.3 |
|
|
|
2 |
|
|
25. Anixter |
|
0.4 |
|
|
|
1 |
|
|
25. La Poste |
|
0.3 |
|
|
|
2 |
|
|
Top 25 Customers |
|
21.2 |
|
|
|
64 |
|
|
Top 25 Customers |
|
19.3 |
|
|
|
114 |
|
|
(1) |
Net effective rent (“NER”) is calculated using the estimated total cash to be received over the term of the lease (including base rent and expense reimbursements) divided by the lease term to determine the amount of rent and expense reimbursements received per year. Amounts derived in a currency other than the U.S. dollar have been translated using the average rate from the previous twelve months. |
Employees
The following table summarizes our employee base at December 31, 2016:
|
Regions |
|
Number of Employees |
|
|
|
U.S. (1) |
|
|
830 |
|
|
Other Americas |
|
|
105 |
|
|
Europe |
|
|
370 |
|
|
Asia |
|
|
225 |
|
|
Total |
|
|
1,530 |
|
|
(1) |
This includes employees who are employed in the U.S. but also support other regions. |
We allocate our employees who perform property management functions to our Real Estate Operations segment and Strategic Capital segment based on the size of the respective portfolios. Employees who perform only Strategic Capital functions are allocated directly to that segment.
We believe we have good relationships with our employees. Prologis employees are not organized under collective bargaining agreements, although some employees in Europe are represented by statutory Works Councils and as such, benefit from applicable labor agreements.
CODE OF ETHICS AND BUSINESS CONDUCT
We maintain a Code of Ethics and Business Conduct applicable to our board of directors (the “Board”) and all of our officers and employees, including the principal executive officer, the principal financial officer and the principal accounting officer, and other people performing similar functions. A copy of our Code of Ethics and Business Conduct is available on our website, www.prologis.com. In addition to being accessible through our website, copies of our Code of Ethics and Business Conduct can be obtained, free of charge, upon written request to Investor Relations, Pier 1, Bay 1, San Francisco, California 94111. Any amendments to or waivers of our Code of Ethics and Business Conduct that apply to the principal executive officer, the principal financial officer, the principal accounting officer, or other people performing similar functions, and that relate to any matter enumerated in Item 406(b) of Regulation S-K, will be disclosed on our website.
7
We are exposed to various environmental risks that may result in unanticipated losses and affect our operating results and financial condition. Either the previous owners or we have conducted environmental reviews on a majority of the properties we have acquired, including land. While some of these assessments have led to further investigation and sampling, none of the environmental assessments has revealed an environmental liability that we believe would have a material adverse effect on our business, financial condition or results of operations. See further discussion in Item 1A. Risk Factors and Note 17 to the Consolidated Financial Statements in Item 8. Financial Statements and Supplementary Data.
We carry insurance coverage on our properties. We determine the type of coverage and the policy specifications and limits based on what we deem to be the risks associated with our ownership of properties and our business operations in specific markets. Such coverage typically includes property damage and rental loss insurance resulting from such perils as fire, windstorm, flood, earthquake and terrorism; commercial general liability insurance; and environmental insurance. Insurance is maintained through a combination of commercial insurance, self-insurance and a wholly-owned captive insurance entity. The costs to insure our properties are primarily covered through reimbursements from our customers. We believe that our insurance coverage contains policy specifications and insured limits that are customary for similar properties, business activities and markets and we believe our properties are adequately insured. See further discussion in Item 1A. Risk Factors.
Our operations and structure involve various risks that could adversely affect our business and financial condition, including but not limited to, our financial position, results of operations, cash flow, ability to make distributions and payments to security holders and the market value of our securities. These risks relate to our consolidated company as well as our investments in unconsolidated entities and include among others, (i) general risks; (ii) risks related to our business; (iii) risks related to financing and capital and (iv) income tax risks.
General Risks
As a global company, we are subject to social, political and economic risks of doing business in many countries.
We conduct a significant portion of our business and employ a substantial number of people outside of the U.S. During 2016, we generated approximately $453 million or 17.9% of our revenues from operations outside the U.S. Circumstances and developments related to international and U.S. operations that could negatively affect us include, but are not limited to, the following factors:
|
• |
difficulties and costs of staffing and managing international operations in certain regions, including differing employment practices and labor issues; |
|
• |
local businesses and cultural factors that differ from our usual standards and practices; |
|
• |
volatility in currencies and currency restrictions, which may prevent the transfer of capital and profits to the U.S.; |
|
• |
challenges in establishing effective controls and procedures to regulate operations in different regions and to monitor compliance with applicable regulations, such as the Foreign Corrupt Practices Act, the United Kingdom (“U.K.”) Bribery Act and other similar laws; |
|
• |
unexpected changes in regulatory requirements, tax, tariffs and other laws within the U.S. or other countries in which we operate; |
|
• |
potentially adverse tax consequences; |
|
• |
the responsibility of complying with multiple and potentially conflicting laws, e.g., with respect to corrupt practices, employment and licensing; |
|
• |
the impact of regional or country-specific business cycles and economic instability, including instability in, or further withdrawals from, the European Union or other international trade alliances or agreements; |
|
• |
political instability, uncertainty over property rights, civil unrest, drug trafficking, political activism or the continuation or escalation of terrorist or gang activities; |
|
• |
foreign ownership restrictions in operations with the respective countries; and |
|
• |
access to capital may be more restricted, or unavailable on favorable terms or at all in certain locations. |
In addition, we may be impacted by the ability of our non-U.S. subsidiaries to dividend or otherwise transfer cash among our subsidiaries, including transfers of cash to pay interest and principal on our debt, due to currency exchange control regulations, transfer pricing regulations and potentially adverse tax consequences, among other factors.
8
Disruptions in the global capital and credit markets may adversely affect our operating results and financial condition.
To the extent there is turmoil in the global financial markets, this turmoil has the potential to adversely affect (i) the value of our properties; (ii) the availability or the terms of financing that we have or may anticipate utilizing; (iii) our ability to make principal and interest payments on, or refinance any outstanding debt when due; and (iv) the ability of our customers to enter into new leasing transactions or satisfy rental payments under existing leases. Disruptions in the capital and credit markets may also adversely affect our ability to make distributions and payments to our security holders and the market price of our securities.
Our business and operations could suffer in the event of system failures or cyber security attacks.
Despite system redundancy, the implementation of security measures and the existence of a disaster recovery plan for our internal and hosted information technology systems, our systems are vulnerable to damages from any number of sources, including energy blackouts, natural disasters, terrorism, war, telecommunication failures and cyber security attacks, such as computer viruses or unauthorized access. Any system failure or accident that causes interruptions in our operations could result in a material disruption to our business. We may also incur additional costs to remedy damages caused by such disruptions. Any compromise of our security could result in a violation of applicable privacy and other laws, unauthorized access to information of ours and others, significant legal and financial exposure, damage to our reputation, loss or misuse of the information and a loss of confidence in our security measures, which could harm our business.
Risks associated with our dependence on key personnel.
We depend on the deep industry knowledge and the efforts of our executive officers and other key employees. From time to time, our personnel and their roles may change. While we believe that we are able to retain our key talent and find suitable employees to meet our personnel needs, the loss of key personnel, any change in their roles or the limitation of their availability could adversely affect our business. If we are unable to continue to attract and retain our executive officers, or if compensation costs required to attract and retain key employees become more expensive, our performance and competitive position could be materially adversely affected.
Our business could be adversely impacted if we have deficiencies in our disclosure controls and procedures or internal control over financial reporting.
The design and effectiveness of our disclosure controls and procedures and internal control over financial reporting may not prevent all errors, misstatements or misrepresentations. While management continually reviews the effectiveness of our disclosure controls and procedures and internal control over financial reporting, there can be no guarantee that our internal control over financial reporting will be effective in accomplishing all control objectives all of the time. Deficiencies, including any material weakness, in our internal control over financial reporting that may occur in the future could result in misstatements or restatements of our financial statements or a decline in the price of our securities.
The depreciation in the value of the foreign currency in countries where we have a significant investment may adversely affect our results of operations and financial position.
We pursue growth opportunities in international markets where the U.S. dollar is not the functional currency. At December 31, 2016, approximately $6.6 billion or 22.0% of our total consolidated assets are invested in a currency other than the U.S. dollar, primarily the British pound sterling, Canadian dollar, euro and Japanese yen. As a result, we are subject to foreign currency risk due to potential fluctuations in exchange rates between foreign currencies and the U.S. dollar. A significant change in the value of the foreign currency of one or more countries where we have a significant investment may have a material adverse effect on our business and, in particular, our U.S. dollar reported financial position and results of operations and debt covenant ratios. Although we attempt to mitigate adverse effects by borrowing under debt agreements denominated in foreign currencies and using derivative contracts, there can be no assurance that those attempts to mitigate foreign currency risk will be successful.
Our hedging of foreign currency and interest rate risk may not effectively limit our exposure to other risks.
Hedging arrangements involve risks, such as the risk of fluctuation in the relative value of the foreign currency or interest rates and the risk that counterparties may fail to honor their obligations under these arrangements. The funds required to settle such arrangements could be significant depending on the stability and movement of the hedged foreign currency or the size of the underlying financing and the applicable interest rates at the time of the breakage. The failure to hedge effectively against foreign exchange changes or interest rate changes may adversely affect our business.
Compliance or failure to comply with regulatory requirements could result in substantial costs.
We are required to comply with many regulations in different countries, including (but not limited to) the Foreign Corrupt Practices Act, the U.K Bribery Act and similar laws and regulations. Our properties are also subject to various federal, state and local regulatory requirements, such as the Americans with Disabilities Act and state and local fire and life-safety requirements. Noncompliance could result in the imposition of governmental fines or the award of damages to private litigants. While we believe that we are currently in material compliance with these regulatory requirements, the requirements may change or new requirements may be imposed that could require significant unanticipated expenditures by us. If we are required to make unanticipated expenditures to comply with these regulations, we may be adversely affected.
9
Real estate investments are not as liquid as certain other types of assets, which may reduce economic returns to investors.
Real estate investments are not as liquid as certain other types of investments and this lack of liquidity may limit our ability to react promptly to changes in economic or other conditions. Significant expenditures associated with real estate investments, such as secured mortgage payments, real estate taxes and maintenance costs, are generally not reduced when circumstances cause a reduction in income from the investments. As a REIT, under the Internal Revenue Code, we are only able to hold property for sale in the ordinary course of business through taxable REIT subsidiaries in order to not incur punitive taxation on any tax gain from the sale of such property. We may dispose of certain properties that have been held for investment to generate liquidity. If we do not satisfy certain safe harbors or we believe there is too much risk of incurring the punitive tax on any tax gain from the sale, we may not pursue such sales.
We may decide to sell properties to certain of our unconsolidated co-investment ventures or third parties to generate proceeds to fund our capital deployment activities. Our ability to sell properties on advantageous terms is affected by: (i) competition from other owners of properties that are trying to dispose of their properties; (ii) market conditions, including the capitalization rates applicable to our properties; and (iii) other factors beyond our control. If our competitors sell assets similar to assets we intend to divest in the same markets or at valuations below our valuations for comparable assets, we may be unable to divest our assets at favorable pricing or at all. The unconsolidated co-investment ventures or third parties who might acquire our properties may need to have access to debt and equity capital, in the private and public markets, in order to acquire properties from us. Should they have limited or no access to capital on favorable terms, then dispositions could be delayed.
If we do not have sufficient cash available to us through our operations, sales or contributions of properties or available credit facilities to continue operating our business as usual, we may need to find alternative ways to increase our liquidity. Such alternatives may include, without limitation, divesting ourselves of properties, whether or not they otherwise meet our strategic objectives to keep in the long term, at less than optimal terms, incurring debt, entering into leases with new customers at lower rental rates or less than optimal terms or entering into lease renewals with our existing customers without an increase in rental rates. There can be no assurance, however, that such alternative ways to increase our liquidity will be available to us. Additionally, taking such measures to increase our liquidity may adversely affect our business, and in particular, our distributable cash flow and debt covenants.
Our investments are concentrated in the logistics sector and our business would be adversely affected by an economic downturn in that sector.
Our investments in real estate assets are concentrated in the logistics sector. This concentration may expose us to the risk of economic downturns in this sector to a greater extent than if our business activities were more diversified.
General economic conditions and other events or occurrences that affect areas in which our properties are geographically concentrated, may impact financial results.
We are exposed to general economic conditions, local, regional, national and international economic conditions and other events and occurrences that affect the markets in which we own properties. Our operating performance is further impacted by the economic conditions of the specific markets in which we have concentrations of properties.
At December 31, 2016, approximately 33.0% of our consolidated operating properties or $8.0 billion (based on consolidated gross book value, or investment before depreciation) are located in California, which represented 26.3% of the aggregate square footage of our operating properties and 33.7% of our NOI. Our revenues from, and the value of, our properties located in California may be affected by local real estate conditions (such as an oversupply of or reduced demand for logistics properties) and the local economic climate. Business layoffs, downsizing, industry slowdowns, changing demographics and other factors may adversely impact California’s economic climate. Because of the number of properties, we have located in California, a downturn in California’s economy or real estate conditions could adversely affect our business.
In addition to California, we also have significant holdings (defined as more than 3.0% of total consolidated investment before depreciation) in operating properties in certain markets located in Central and Eastern Pennsylvania, Chicago, Dallas/Fort Worth, New Jersey/New York City, Seattle and South Florida. Our operating performance could be adversely affected if conditions become less favorable in any of the markets in which we have a concentration of properties. Conditions such as an oversupply of logistics space or a reduction in demand for logistics space, among other factors, may impact operating conditions. Any material oversupply of logistics space or material reduction in demand for logistics space could adversely affect our overall business.
In addition, our owned and managed portfolio, including the unconsolidated co-investment ventures in which we invest, has concentrations of properties in the same markets mentioned above, as well as in markets in France, Germany, Japan and the U.K., and are subject to the economic conditions in those markets.
A number of our investments, both wholly-owned and owned through co-investment ventures, are located in areas that are known to be subject to earthquake activity. U.S. properties located in active seismic areas include properties in the San Francisco Bay Area, Los Angeles, and Seattle. International properties located in active seismic areas include Japan and Mexico. We generally carry earthquake insurance on our properties located in areas historically subject to seismic activity, subject to coverage limitations and deductibles, if we believe it is commercially reasonable. We evaluate our earthquake insurance coverage annually in light of current industry practice through an analysis prepared by outside consultants and in some specific instances have elected to self-insure our earthquake exposure based on this analysis. We have elected not to carry earthquake insurance for our assets in Japan based on this analysis.
10
Furthermore, a number of our properties are located in areas that are known to be subject to hurricane or flood risk. We carry hurricane and flood hazard insurance on all of our properties located in areas historically subject to such activity, subject to coverage limitations and deductibles, if we believe it is commercially reasonable. We evaluate our insurance coverage annually in light of current industry practice through an analysis prepared by outside consultants.
Investments in real estate properties are subject to risks that could adversely affect our business.
Investments in real estate properties are subject to varying degrees of risk. While we seek to minimize these risks through geographic diversification of our portfolio, market research and our asset management capabilities, these risks cannot be eliminated. Factors that may affect real estate values and cash flows include:
|
• |
local conditions, such as oversupply or a reduction in demand; |
|
• |
technological changes, such as reconfiguration of supply chains, autonomous vehicles, robotics, 3D printing or other technologies; |
|
• |
the attractiveness of our properties to potential customers and competition from other available properties; |
|
• |
increasing costs of maintaining, insuring, renovating and making improvements to our properties; |
|
• |
our ability to rehabilitate and reposition our properties due to changes in the business and logistics needs of our customers; |
|
• |
our ability to control rents and variable operating costs; and |
|
• |
governmental regulations and the associated potential liability under, and changes in, environmental, zoning, usage, tax, tariffs and other laws. |
We may be unable to lease vacant space or renew leases or re-lease space on favorable terms as leases expire.
Our operating results and distributable cash flow would be adversely affected if a significant number of our customers were unable to meet their lease obligations. We are also subject to the risk that, upon the expiration of leases for space located in our properties, leases may not be renewed by existing customers, the space may not be re-leased to new customers or the terms of renewal or re-leasing (including the cost of required renovations or concessions to customers) may be less favorable to us than current lease terms. Our competitors may offer space at rental rates below current market rates or below the rental rates we currently charge our customers, we may lose potential customers, and we may be pressured to reduce our rental rates below those we currently charge to retain customers when our customers’ leases expire. In the event of default by a significant number of customers, we may experience delays and incur substantial costs in enforcing our rights as landlord, and we may be unable to re-lease spaces. A customer may experience a downturn in its business, which may cause the loss of the customer or may weaken its financial condition, resulting in the customer’s failure to make rental payments when due or requiring a restructuring that might reduce cash flow from the lease. In addition, a customer may seek the protection of bankruptcy, insolvency or similar laws, which could result in the rejection and termination of such customer’s lease and thereby cause a reduction in our available cash flow.
We may acquire properties, which involves risks that could adversely affect our business and financial condition.
We have acquired properties and will continue to acquire properties, both through the direct acquisition of real estate and through the acquisition of entities that own the real estate and through additional investments in co-investment ventures that acquire properties. The acquisition of properties involves risks, including the risk that the acquired property will not perform as anticipated and that any actual costs for rehabilitation, repositioning, renovation and improvements identified in the pre-acquisition due diligence process will exceed estimates. When we acquire properties, we may face risks associated with a lack of market knowledge or understanding of the local economy, forging new business relationships in the area and unfamiliarity with local government and permitting procedures. Additionally, there is, and it is expected there will continue to be, significant competition for properties that meet our investment criteria as well as risks associated with obtaining financing for acquisition activities. The acquired properties or entities may be subject to liabilities, which may be without any recourse, or with only limited recourse, with respect to unknown liabilities. As a result, if a liability were asserted against us based on ownership of any of these entities or properties, then we may have to pay substantial sums to settle it.
Our real estate development strategies may not be successful.
Our real estate development strategy is focused on monetizing land in the future through development of logistics facilities to hold for long-term investment, contribution or sale to a co-investment venture or third party, depending on market conditions, our liquidity needs and other factors. We may increase our investment in the development, renovation and redevelopment business and we expect to complete the build-out and leasing of our current development portfolio. We may also develop, renovate and redevelop properties within existing or newly formed co-investment ventures. The real estate development, renovation and redevelopment business includes the following significant risks:
|
• |
we may not be able to obtain financing for development projects on favorable terms or at all; |
|
• |
we may explore development opportunities that may be abandoned and the related investment impaired; |
11
|
• |
we may not be able to obtain, or may experience delays in obtaining, all necessary zoning, land-use, building, occupancy and other governmental permits and authorizations; |
|
• |
we may have construction costs, total investment amounts and our share of remaining funding that exceed our estimates and projects may not be completed, delivered or stabilized as planned due to defects or other issues; |
|
• |
we may not be able to attract third-party investment in new development co-investment ventures or sufficient customer demand for our product; |
|
• |
we may have properties that perform below anticipated levels, producing cash flow below budgeted amounts; |
|
• |
we may seek to sell certain land parcels and not be able to find a third party to acquire such land or the sales price will not allow us to recover our investment, resulting in impairment charges; |
|
• |
we may not be able to lease properties we develop on favorable terms or at all; |
|
• |
we may not be able to capture the anticipated enhanced value created by our value-added properties on expected timetables or at all; |
|
• |
we may experience delays (temporary or permanent) if there is public or government opposition to our activities; and |
|
• |
we may have substantial renovation, new development and redevelopment activities, regardless of their ultimate success, that require a significant amount of management’s time and attention, diverting their attention from our day-to-day operations. |
We are subject to risks and liabilities in connection with forming co-investment ventures, investing in new or existing co-investment ventures, attracting third-party investment and investing in and managing properties through co-investment ventures.
At December 31, 2016, we had investments in real estate containing approximately 403 million square feet held through co-investment ventures, both public and private. Our organizational documents do not limit the amount of available funds that we may invest in these ventures, and we may and currently intend to develop and acquire properties through co-investment ventures and investments in other entities when warranted by the circumstances. However, there can be no assurance that we will be able to form new co-investment ventures, or attract third-party investment or that additional investments in new or existing ventures to develop or acquire properties will be successful. Further, there can be no assurance that we are able to realize value from such investments.
Our co-investment ventures involve certain additional risks that we do not otherwise face, including:
|
• |
our partners may share certain approval rights over major decisions made on behalf of the ventures; |
|
• |
if our partners fail to fund their share of any required capital contributions, then we may choose to contribute such capital; |
|
• |
our partners might have economic or other business interests or goals that are inconsistent with our business interests or goals that would affect our ability to operate the property; |
|
• |
the venture or other governing agreements often restrict the transfer of an interest in the co-investment venture or may otherwise restrict our ability to sell the interest when we desire or on advantageous terms; |
|
• |
our relationships with our partners are generally contractual in nature and may be terminated or dissolved under the terms of the agreements, and in such event, we may not continue to manage or invest in the assets underlying such relationships resulting in reduced fee revenues or causing a need to purchase such interest to continue ownership; and |
|
• |
disputes between us and our partners may result in litigation or arbitration that would increase our expenses and prevent our officers and directors from focusing their time and effort on our business and result in subjecting the properties owned by the applicable co-investment venture to additional risk. |
We generally seek to maintain sufficient influence over our co-investment ventures to permit us to achieve our business objectives; however, we may not be able to continue to do so indefinitely. We have formed publicly traded investment vehicles, such as NPR and FIBRA Prologis, for which we serve as sponsor or manager. We have contributed, and may continue to contribute, assets into such vehicles. There is a risk that our managerial relationship may be terminated.
We are exposed to various environmental risks, including the potential impacts of future climate change, which may result in unanticipated losses that could affect our business and financial condition.
Under various federal, state and local laws, ordinances and regulations, a current or previous owner, developer or operator of real estate may be liable for the costs of removal or remediation of certain hazardous or toxic substances. The costs of removal or remediation of such substances could be substantial. Such laws often impose liability without regard to whether the owner or operator
12
knew of, or was responsible for, the release or presence of such hazardous substances. In addition, third parties may sue the owner or operator of a site for damages based on personal injury, property damage or other costs, including investigation and clean-up costs, resulting from the environmental contamination.
Environmental laws in some countries, including the U.S., also require that owners or operators of buildings containing asbestos properly manage and maintain the asbestos, adequately inform or train those who may come into contact with asbestos and undertake special precautions, including removal or other abatement, in the event that asbestos is disturbed during building renovation or demolition. These laws may impose fines and penalties on building owners or operators who fail to comply with these requirements and may allow third parties to seek recovery from owners or operators for personal injury associated with exposure to asbestos. Some of our properties are known to contain asbestos-containing building materials.
In addition, some of our properties are leased or have been leased, in part, to owners and operators of businesses that use, store or otherwise handle petroleum products or other hazardous or toxic substances, creating a potential for the release of such hazardous or toxic substances. Furthermore, certain of our properties are on, adjacent to or near other properties that have contained or currently contain petroleum products or other hazardous or toxic substances, or upon which others have engaged, are engaged or may engage in activities that may release such hazardous or toxic substances. From time to time, we may acquire properties, or interests in properties, with known adverse environmental conditions for which we believe that the environmental liabilities associated with these conditions are quantifiable and that the acquisition will yield a superior risk-adjusted return. In connection with certain divested properties, we have agreed to remain responsible for, and to bear the cost of, remediating or monitoring certain environmental conditions on the properties.
We are also exposed to potential physical risks from possible future changes in climate. Our logistics facilities may be exposed to rare catastrophic weather events, such as severe storms or floods. If the frequency of extreme weather events increases due to climate change, our exposure to these events could increase. We do not currently consider ourselves to be exposed to regulatory risks related to climate change, as our operations generally do not emit a significant amount of greenhouse gases. However, we may be adversely impacted as a real estate developer in the future by potential impacts to the supply chain or stricter energy efficiency standards for buildings. We cannot give any assurance that other such conditions do not exist or may not arise in the future. The presence of such substances on our real estate properties could adversely affect our ability to lease, develop or sell such properties or to borrow using such properties as collateral, and this may have an adverse effect on our business and financial condition, and in particular, our distributable cash flow.
Our insurance coverage does not include all potential losses.
We and our unconsolidated co-investment ventures carry insurance coverage including property damage and rental loss insurance resulting from certain perils such as fire and additional perils as covered under an extended coverage policy, namely windstorm, flood, earthquake and terrorism; commercial general liability insurance; and environmental insurance, as appropriate for the markets where each of our properties and business operations are located. The insurance coverage contains policy specifications and insured limits customarily carried for similar properties, business activities and markets. We believe our properties and the properties of our unconsolidated co-investment ventures are adequately insured. Certain losses, however, including losses from floods, earthquakes, acts of war, acts of terrorism or riots, generally are not insured against or generally are not fully insured against because it is not deemed economically feasible or prudent to do so. If an uninsured loss or a loss in excess of insured limits occurs with respect to one or more of our properties, we could experience a significant loss of capital invested and future revenues in these properties and could potentially remain obligated under any recourse debt associated with the property.
Furthermore, we cannot be sure that the insurance companies will be able to continue to offer products with sufficient coverage at commercially reasonable rates. If we experience a loss that is uninsured or that exceeds insured limits with respect to one or more of our properties or if the insurance companies fail to meet their coverage commitments to us in the event of an insured loss, then we could lose the capital invested in the damaged properties, as well as the anticipated future revenues from those properties and, if there is recourse debt, then we would remain obligated for any mortgage debt or other financial obligations related to the properties. Any such losses or higher insurance costs could adversely affect our business.
Risks Related to Financing and Capital
We may be unable to refinance our debt or our cash flow may be insufficient to make required debt payments.
We are subject to risks normally associated with debt financing, including the risk that our cash flow will be insufficient to meet required payments of principal and interest. There can be no assurance that we will be able to refinance any maturing indebtedness, that such refinancing would be on terms as favorable as the terms of the maturing indebtedness, or that we will be able to otherwise obtain funds by selling assets or raising equity to make required payments on maturing indebtedness. If we are unable to refinance our indebtedness at maturity or meet our payment obligations, our business and financial condition will be negatively impacted and, if the maturing debt is secured, the lender may foreclose on the property securing such indebtedness. Our credit facilities and certain other debt bears interest at variable rates. Increases in interest rates would increase our interest expense under these agreements.
Covenants in our credit agreements could limit our flexibility and breaches of these covenants could adversely affect our financial condition.
The terms of our various credit agreements, including our credit facilities, the indentures under which our senior notes are issued and other note agreements, require us to comply with a number of customary financial covenants, such as maintaining debt service
13
coverage, leverage ratios, fixed charge ratios and other operating covenants including maintaining insurance coverage. These covenants may limit our flexibility to run our business, and breaches of these covenants could result in defaults under the instruments governing the applicable indebtedness. If we default under the covenant provisions and are unable to cure the default, refinance the indebtedness or meet payment obligations, our business and financial condition generally and, in particular, the amount of our distributable cash flow could be adversely affected.
Adverse changes in our credit ratings could negatively affect our financing activity.
The credit ratings of our senior unsecured notes and preferred stock are based on our operating performance, liquidity and leverage ratios, overall financial position and other factors employed by the credit rating agencies in their rating analyses of us. Our credit ratings can affect the amount of capital we can access, as well as the terms and pricing of any debt we may incur. There can be no assurance that we will be able to maintain our current credit ratings, and in the event our credit ratings are downgraded, we would likely incur higher borrowing costs and may encounter difficulty in obtaining additional financing. Also, a downgrade in our credit ratings may trigger additional payments or other negative consequences under our credit facilities and other debt instruments. Adverse changes in our credit ratings could negatively impact our business and, in particular, our refinancing and other capital market activities, our ability to manage debt maturities, our future growth and our development and acquisition activity.
At December 31, 2016, our credit ratings were A3 from Moody’s and A- from S&P, both with stable outlook. A securities rating is not a recommendation to buy, sell or hold securities and is subject to revision or withdrawal at any time by the rating organization.
We depend on external sources of capital.
To qualify as a REIT, we are required each year to distribute at least 90% of our REIT taxable income (determined without regard to the dividends-paid deduction and by excluding any net capital gain) to our stockholders and we may be subject to tax to the extent our taxable income is not fully distributed. Historically, we have satisfied these distribution requirements by making cash distributions to our stockholders, but we may choose to satisfy these requirements by making distributions of cash or other property, including, in limited circumstances, our own stock. For distributions with respect to taxable years that ended on or before December 31, 2016, and in some cases declared as late as December 31, 2016, a REIT can satisfy up to 90% of the distribution requirements discussed above through the distribution of shares of our stock if certain conditions are met. Assuming we continue to satisfy these distribution requirements with cash, we may not be able to fund all future capital needs, including acquisition and development activities, from cash retained from operations and may have to rely on third-party sources of capital. Furthermore, to maintain our REIT status and not have to pay federal income and excise taxes, we may need to borrow funds on a short-term basis to meet the REIT distribution requirements even if the then-prevailing market conditions are not favorable for these borrowings. These short-term borrowing needs could result from differences in timing between the actual receipt of cash and inclusion of income for federal income tax purposes, or the effect of nondeductible capital expenditures, the creation of reserves or required debt or amortization payments. Our ability to access debt and equity capital on favorable terms or at all depends on a number of factors, including general market conditions, the market’s perception of our growth potential, our current and potential future earnings and cash distributions and the market price of our securities.
Our stockholders may experience dilution if we issue additional common stock or units in the Operating Partnership.
Any additional future issuance of common stock or operating partnership units will reduce the percentage of our common stock and units owned by investors. In most circumstances, stockholders and unitholders will not be entitled to vote on whether or not we issue additional common stock or units. In addition, depending on the terms and pricing of any additional offering of our common stock or units and the value of the properties, our stockholders and unitholders may experience dilution in both book value and fair value of their common stock or units.
Income Tax Risks
The failure of Prologis, Inc. to qualify as a REIT would have serious adverse consequences.
Prologis, Inc. elected to be taxed as a REIT under Sections 856 through 860 of the Internal Revenue Code commencing with the taxable year ended December 31, 1997. We believe we have operated Prologis, Inc. to qualify as a REIT under the Internal Revenue Code and believe that the current organization and method of operation comply with the rules and regulations promulgated under the Internal Revenue Code to enable Prologis, Inc. to continue to qualify as a REIT. However, it is possible that we are organized or have operated in a manner that would not allow Prologis, Inc. to qualify as a REIT, or that our future operations could cause Prologis, Inc. to fail to qualify. Qualification as a REIT requires us to satisfy numerous requirements (some annually and others on a quarterly basis) established under highly technical and complex sections of the Internal Revenue Code for which there are only limited judicial and administrative interpretations, and involves the determination of various factual matters and circumstances not entirely within our control. For example, to qualify as a REIT, Prologis, Inc. must derive at least 95% of its gross income in any year from qualifying sources. In addition, Prologis, Inc. must pay dividends to its stockholders aggregating annually at least 90% of its taxable income (determined without regard to the dividends paid deduction and by excluding capital gains) and must satisfy specified asset tests on a quarterly basis. The provisions of the Internal Revenue Code and applicable Treasury regulations regarding qualification as a REIT are more complicated for Prologis, Inc. because we hold assets through the Operating Partnership.
If Prologis, Inc. fails to qualify as a REIT in any taxable year, we will be required to pay federal income tax (including any applicable alternative minimum tax) on taxable income at regular corporate rates. Unless we are entitled to relief under certain statutory provisions, Prologis, Inc. would be disqualified from treatment as a REIT for the four taxable years following the year in which it lost the qualification. If Prologis, Inc. lost its REIT status, our net earnings would be significantly reduced for each of the years involved.
14
Furthermore, we own a direct or indirect interest in certain subsidiary REITs that elected to be taxed as REITs under Sections 856 through 860 of the Internal Revenue Code. Provided that each subsidiary REIT qualifies as a REIT, our interest in such subsidiary REIT will be treated as a qualifying real estate asset for purposes of the REIT asset tests, and any dividend income or gains derived by us from such subsidiary REIT will generally be treated as income that qualifies for purposes of the REIT gross income tests. To qualify as a REIT, the subsidiary REIT must independently satisfy all of the REIT qualification requirements. If such subsidiary REIT were to fail to qualify as a REIT, and certain relief provisions did not apply, it would be treated as a regular taxable corporation and its income would be subject to U.S. federal income tax. In addition, a failure of the subsidiary REIT to qualify as a REIT would have an adverse effect on the ability of Prologis, Inc. to comply with the REIT income and asset tests, and thus its ability to qualify as a REIT.
Certain property transfers may generate prohibited transaction income, resulting in a penalty tax on gain attributable to the transaction.
From time to time, we may transfer or otherwise dispose of some of our properties, including by contributing properties to our co-investment ventures. Under the Internal Revenue Code, any gain resulting from transfers of properties we hold as inventory or primarily for sale to customers in the ordinary course of business is treated as income from a prohibited transaction subject to a 100% penalty tax. We do not believe that our transfers or disposals of property or our contributions of properties into our co-investment ventures are prohibited transactions. However, whether property is held for investment purposes is a question of fact that depends on all the facts and circumstances surrounding the particular transaction. The Internal Revenue Service may contend that certain transfers or dispositions of properties by us or contributions of properties into our co-investment ventures are prohibited transactions. While we believe that the Internal Revenue Service would not prevail in any such dispute, if the Internal Revenue Service were to argue successfully that a transfer, disposition or contribution of property constituted a prohibited transaction, we would be required to pay a 100% penalty tax on any gain allocable to us from the prohibited transaction. In addition, income from a prohibited transaction might adversely affect our ability to satisfy the income tests for qualification as a REIT.
Legislative or regulatory action could adversely affect us.
In recent years, numerous legislative, judicial and administrative changes have been made to the U.S. and foreign income tax laws applicable to investments in real estate, REITs, similar entities and investments. Additional changes are likely to continue to occur in the future, both in and outside of the U.S. and may impact our taxation or that of our stockholders.
ITEM 1B. Unresolved Staff Comments
None.
We invest in predominately logistics facilities. Our properties are typically used for distribution, storage, packaging, assembly and light manufacturing of consumer products. The vast majority of our operating properties are used by our customers for bulk distribution.
The following tables provide details of our consolidated operating properties, investment in land and development portfolio. We have also included operating property information below for our owned and managed portfolio. The owned and managed portfolio includes the properties we consolidate and the properties owned by our unconsolidated co-investment ventures reflected at 100% of the amount included in the ventures’ financial statements as calculated on a GAAP basis, not our proportionate share.
Included in the operating property information below for our consolidated operating properties are 646 buildings owned primarily by two co-investment ventures that we consolidate but of which we own less than 100% of the equity. No individual property or group of properties operating as a single business unit amounted to 10% or more of our consolidated total assets at December 31, 2016, or generated income equal to 10% or more of our consolidated gross revenues for the year ended December 31, 2016.
15
Dollars and square feet in the following tables are in millions and items notated by ‘0‘ indicate an amount that rounds to less than one million:
|
|
|
Consolidated Operating Properties |
|
|
Owned and Managed |
|
||||||||||||||
|
Operating properties |
|
Rentable Square Footage |
|
|
Gross Book Value |
|
|
Encumbrances (1) |
|
|
Rentable Square Footage |
|
|
Gross Book Value |
|
|||||
|
Global Markets – U.S.: |
|
|
|
|
|
|
|
|
|
|
|
|
|
|
|
|
|
|
|
|
|
Atlanta |
|
|
16 |
|
|
$ |
712 |
|
|
$ |
128 |
|
|
|
17 |
|
|
$ |
812 |
|
|
Baltimore/Washington D.C. |
|
|
6 |
|
|
|
518 |
|
|
|
68 |
|
|
|
8 |
|
|
|
704 |
|
|
Central Valley California |
|
|
11 |
|
|
|
609 |
|
|
|
61 |
|
|
|
11 |
|
|
|
638 |
|
|
Central and Eastern Pennsylvania |
|
|
18 |
|
|
|
1,103 |
|
|
|
56 |
|
|
|
18 |
|
|
|
1,104 |
|
|
Chicago |
|
|
34 |
|
|
|
2,137 |
|
|
|
129 |
|
|
|
41 |
|
|
|
2,616 |
|
|
Dallas/Fort Worth |
|
|
22 |
|
|
|
1,166 |
|
|
|
196 |
|
|
|
25 |
|
|
|
1,446 |
|
|
Houston |
|
|
9 |
|
|
|
519 |
|
|
|
68 |
|
|
|
13 |
|
|
|
832 |
|
|
New Jersey/New York City |
|
|
28 |
|
|
|
2,778 |
|
|
|
357 |
|
|
|
33 |
|
|
|
3,372 |
|
|
San Francisco Bay Area |
|
|
16 |
|
|
|
1,630 |
|
|
|
10 |
|
|
|
19 |
|
|
|
1,972 |
|
|
Seattle |
|
|
8 |
|
|
|
818 |
|
|
|
59 |
|
|
|
15 |
|
|
|
1,515 |
|
|
South Florida |
|
|
11 |
|
|
|
1,136 |
|
|
|
128 |
|
|
|
15 |
|
|
|
1,501 |
|
|
Southern California |
|
|
61 |
|
|
|
5,727 |
|
|
|
461 |
|
|
|
72 |
|
|
|
6,922 |
|
|
Regional Markets – U.S. (15 markets) (2) |
|
|
68 |
|
|
|
3,546 |
|
|
|
584 |
|
|
|
70 |
|
|
|
3,608 |
|
|
Other Markets – U.S (5 markets) |
|
|
1 |
|
|
|
59 |
|
|
|
- |
|
|
|
1 |
|
|
|
106 |
|
|
Subtotal U.S. |
|
|
309 |
|
|
|
22,458 |
|
|
|
2,305 |
|
|
|
358 |
|
|
|
27,148 |
|
|
Global Markets – Other Americas: |
|
|
|
|
|
|
|
|
|
|
|
|
|
|
|
|
|
|
|
|
|
Brazil |
|
|
- |
|
|
|
- |
|
|
|
- |
|
|
|
8 |
|
|
|
505 |
|
|
Canada |
|
|
8 |
|
|
|
635 |
|
|
|
145 |
|
|
|
8 |
|
|
|
635 |
|
|
Mexico: |
|
|
|
|
|
|
|
|
|
|
|
|
|
|
|
|
|
|
|
|
|
Guadalajara |
|
0 |
|
|
|
4 |
|
|
|
- |
|
|
|
6 |
|
|
|
321 |
|
|
|
Mexico City |
|
|
- |
|
|
|
- |
|
|
|
- |
|
|
|
12 |
|
|
|
819 |
|
|
Monterrey |
|
|
- |
|
|
|
- |
|
|
|
- |
|
|
|
4 |
|
|
|
236 |
|
|
Regional Markets – Other Americas (3 markets) |
|
0 |
|
|
|
14 |
|
|
|
- |
|
|
|
13 |
|
|
|
584 |
|
|
|
Subtotal Other Americas |
|
|
8 |
|
|
|
653 |
|
|
|
145 |
|
|
|
51 |
|
|
|
3,100 |
|
|
Global Markets – Europe: |
|
|
|
|
|
|
|
|
|
|
|
|
|
|
|
|
|
|
|
|
|
Belgium |
|
|
- |
|
|
|
- |
|
|
|
- |
|
|
|
3 |
|
|
|
188 |
|
|
Czech Republic |
|
|
1 |
|
|
|
35 |
|
|
|
- |
|
|
|
11 |
|
|
|
663 |
|
|
France |
|
|
2 |
|
|
|
78 |
|
|
|
- |
|
|
|
33 |
|
|
|
2,141 |
|
|
Germany |
|
|
2 |
|
|
|
120 |
|
|
|
- |
|
|
|
23 |
|
|
|
1,648 |
|
|
Italy |
|
|
1 |
|
|
|
68 |
|
|
|
- |
|
|
|
10 |
|
|
|
528 |
|
|
Netherlands |
|
0 |
|
|
|
20 |
|
|
|
- |
|
|
|
18 |
|
|
|
1,281 |
|
|
|
Poland |
|
|
1 |
|
|
|
51 |
|
|
|
- |
|
|
|
25 |
|
|
|
1,338 |
|
|
Spain |
|
|
1 |
|
|
|
35 |
|
|
|
- |
|
|
|
8 |
|
|
|
537 |
|
|
U.K. |
|
|
1 |
|
|
|
121 |
|
|
|
- |
|
|
|
23 |
|
|
|
2,718 |
|
|
Regional Markets – Europe (3 markets) |
|
|
1 |
|
|
47 |
|
|
|
- |
|
|
|
17 |
|
|
|
960 |
|
|
|
Other Markets – Europe (1 market) |
|
0 |
|
|
|
9 |
|
|
|
- |
|
|
1 |
|
|
|
8 |
|
||
|
Subtotal Europe |
|
|
10 |
|
|
|
584 |
|
|
|
- |
|
|
|
172 |
|
|
|
12,010 |
|
|
Global Markets – Asia: |
|
|
|
|
|
|
|
|
|
|
|
|
|
|
|
|
|
|
|
|
|
China |
|
|
2 |
|
|
|
69 |
|
|
|
- |
|
|
|
14 |
|
|
|
627 |
|
|
Japan |
|
|
2 |
|
|
|
165 |
|
|
|
- |
|
|
|
26 |
|
|
|
4,265 |
|
|
Singapore |
|
|
1 |
|
|
|
128 |
|
|
|
- |
|
|
|
1 |
|
|
|
129 |
|
|
Subtotal Asia |
|
|
5 |
|
|
|
362 |
|
|
|
- |
|
|
|
41 |
|
|
|
5,021 |
|
|
Total operating portfolio (3) |
|
|
332 |
|
|
|
24,057 |
|
|
|
2,450 |
|
|
|
622 |
|
|
|
47,279 |
|
|
Value-added properties |
|
|
2 |
|
|
|
117 |
|
|
|
- |
|
|
|
3 |
|
|
|
192 |
|
|
Total operating properties |
|
|
334 |
|
|
$ |
24,174 |
|
|
$ |
2,450 |
|
|
|
625 |
|
|
$ |
47,471 |
|
16
|
|
|
Consolidated – Investment in Land |
|
|
Consolidated – Development Portfolio |
|
||||||||||||||
|
Region |
|
Acres |
|
|
Estimated Build Out Potential (square feet) (4) |
|
|
Current Investment |
|
|
Rentable Square Footage |
|
|
TEI (5) |
|
|||||
|
Global Markets – U.S.: |
|
|
|
|
|
|
|
|
|
|
|
|
|
|
|
|
|
|
|
|
|
Atlanta |
|
|
135 |
|
|
|
2 |
|
|
$ |
4 |
|
|
|
1 |
|
|
$ |
49 |
|
|
Baltimore/Washington D.C. |
|
|
81 |
|
|
0 |
|
|
|
21 |
|
|
|
- |
|
|
|
- |
|
|
|
Central Valley California |
|
|
1,090 |
|
|
|
22 |
|
|
|
93 |
|
|
|
1 |
|
|
|
98 |
|
|
Central and Eastern Pennsylvania |
|
|
137 |
|
|
|
2 |
|
|
|
24 |
|
|
|
- |
|
|
|
- |
|
|
Chicago |
|
|
219 |
|
|
|
4 |
|
|
|
19 |
|
|
0 |
|
|
|
20 |
|
|
|
Dallas/Fort Worth |
|
|
178 |
|
|
|
3 |
|
|
|
23 |
|
|
|
1 |
|
|
|
40 |
|
|
Houston |
|
|
185 |
|
|
|
3 |
|
|
|
15 |
|
|
0 |
|
|
|
17 |
|
|
|
New Jersey/New York City |
|
|
119 |
|
|
|
1 |
|
|
|
38 |
|
|
|
1 |
|
|
|
116 |
|
|
San Francisco Bay Area |
|
|
- |
|
|
|
- |
|
|
|
- |
|
|
|
1 |
|
|
|
63 |
|
|
Seattle |
|
|
43 |
|
|
|
1 |
|
|
|
30 |
|
|
|
1 |
|
|
|
67 |
|
|
South Florida |
|
|
215 |
|
|
|
4 |
|
|
|
117 |
|
|
0 |
|
|
|
57 |
|
|
|
Southern California |
|
|
144 |
|
|
|
3 |
|
|
|
30 |
|
|
|
2 |
|
|
|
166 |
|
|
Regional Markets – U.S. (15 markets) |
|
|
497 |
|
|
|
8 |
|
|
|
61 |
|
|
|
4 |
|
|
|
231 |
|
|
Other Markets – U.S (4 markets) |
|
|
- |
|
|
|
- |
|
|
|
- |
|
|
|
- |
|
|
|
- |
|
|
Subtotal U.S. |
|
|
3,043 |
|
|
|
53 |
|
|
|
475 |
|
|
|
12 |
|
|
|
924 |
|
|
Global Markets – Other Americas: |
|
|
|
|
|
|
|
|
|
|
|
|
|
|
|
|
|
|
|
|
|
Canada |
|
|
161 |
|
|
|
3 |
|
|
|
41 |
|
|
|
1 |
|
|
|
56 |
|
|
Mexico: |
|
|
|
|
|
|
|
|
|
|
|
|
|
|
|
|
|
|
|
|
|
Guadalajara |
|
|
15 |
|
|
0 |
|
|
|
4 |
|
|
0 |
|
|
|
28 |
|
||
|
Mexico City |
|
|
246 |
|
|
|
5 |
|
|
|
127 |
|
|
|
1 |
|
|
|
69 |
|
|
Monterrey |
|
|
110 |
|
|
|
2 |
|
|
|
22 |
|
|
|
1 |
|
|
|
31 |
|
|
Regional Markets – Other Americas (3 markets) |
|
|
352 |
|
|
|
6 |
|
|
|
31 |
|
|
|
- |
|
|
|
- |
|
|
Subtotal Other Americas |
|
|
884 |
|
|
|
16 |
|
|
|
225 |
|
|
|
3 |
|
|
|
184 |
|
|
Global Markets – Europe: |
|
|
|
|
|
|
|
|
|
|
|
|
|
|
|
|
|
|
|
|
|
Belgium |
|
|
45 |
|
|
|
1 |
|
|
|
13 |
|
|
|
- |
|
|
|
- |
|
|
Czech Republic |
|
|
162 |
|
|
|
3 |
|
|
|
27 |
|
|
0 |
|
|
|
29 |
|
|
|
France |
|
|
319 |
|
|
|
6 |
|
|
|
54 |
|
|
|
1 |
|
|
|
70 |
|
|
Germany |
|
|
50 |
|
|
|
1 |
|
|
|
13 |
|
|
|
1 |
|
|
|
43 |
|
|
Italy |
|
|
108 |
|
|
|
2 |
|
|
|
27 |
|
|
0 |
|
|
|
12 |
|
|
|
Netherlands |
|
|
46 |
|
|
|
1 |
|
|
|
28 |
|
|
|
1 |
|
|
|
64 |
|
|
Poland |
|
|
443 |
|
|
|
8 |
|
|
|
42 |
|
|
|
1 |
|
|
|
53 |
|
|
Spain |
|
|
73 |
|
|
|
2 |
|
|
|
27 |
|
|
|
1 |
|
|
|
33 |
|
|
U.K. |
|
|
291 |
|
|
|
4 |
|
|
|
132 |
|
|
|
1 |
|
|
|
177 |
|
|
Regional Markets – Europe (3 markets) |
|
|
356 |
|
|
|
6 |
|
|
|
35 |
|
|
|
2 |
|
|
|
100 |
|
|
Other Markets – Europe (1 market) |
|
|
- |
|
|
|
- |
|
|
|
- |
|
|
|
- |
|
|
|
- |
|
|
Subtotal Europe |
|
|
1,893 |
|
|
|
34 |
|
|
|
398 |
|
|
|
8 |
|
|
|
581 |
|
|
Global Markets – Asia: |
|
|
|
|
|
|
|
|
|
|
|
|
|
|
|
|
|
|
|
|
|
China |
|
|
18 |
|
|
0 |
|
|
|
5 |
|
|
|
- |
|
|
|
- |
|
|
|
Japan |
|
|
54 |
|
|
|
4 |
|
|
|
116 |
|
|
|
5 |
|
|
|
754 |
|
|
Subtotal Asia |
|
|
72 |
|
|
|
4 |
|
|
|
121 |
|
|
|
5 |
|
|
|
754 |
|
|
Total land and development portfolio |
|
|
5,892 |
|
|
|
107 |
|
|
$ |
1,219 |
|
|
|
28 |
|
|
$ |
2,443 |
|
|
(1) |
Certain of our consolidated properties are pledged as security under secured mortgage debt and assessment bonds at December 31, 2016. For purposes of this table, the total principal balance of a debt issuance that is secured by a pool of properties is allocated among the properties in the pool based on each property’s investment balance. In addition to the amounts reflected here, we also have $173 million of encumbrances related to other real estate properties not included in Real Estate Operations. See Schedule III – Real Estate and Accumulated Depreciation to the Consolidated Financial Statements in Item 8. Financial Statements and Supplementary Data for additional identification of the properties pledged. |
|
(2) |
No regional market within the U.S. represented more than 2% of the total gross book value of the consolidated operating properties. The regional markets within the U.S. by order of highest to lowest gross book value were: Las Vegas, Denver, Louisville, Orlando, Columbus, Reno, Nashville, Cincinnati, San Antonio, Portland, Indianapolis, Austin, Phoenix, Charlotte and Memphis. |
|
(3) |
Included in our consolidated operating properties are properties that we consider to be held for contribution and are presented as Assets Held for Sale or Contribution in the Consolidated Balance Sheets. We include these properties in our operating portfolio as they are expected to be contributed to our co-investment ventures and remain in our owned and managed operating portfolio. At December 31, 2016, we had properties that were expected to be contributed to our co-investment ventures totaling $231 million aggregating 2.4 million square feet. See Note 6 to the Consolidated Financial Statements in Item 8. Financial Statements and Supplementary Data for further information on our Assets Held for Sale or Contribution. |
|
(4) |
Represents the estimated finished square feet available for lease upon completion of a building on existing parcels of land. |
17
The following table summarizes our investment in consolidated real estate properties at December 31, 2016 (in millions):
|
|
|
Investment Before Depreciation |
|
|
|
Operating properties, excluding assets held for sale or contribution |
|
$ |
23,943 |
|
|
Development portfolio, including cost of land |
|
|
1,432 |
|
|
Land |
|
|
1,219 |
|
|
Other real estate investments (1) |
|
|
525 |
|
|
Total consolidated real estate properties |
|
$ |
27,119 |
|
|
(1) |
Included in other real estate investments are: (i) non-logistics real estate; (ii) land parcels that are ground leased to third parties; (iii) our corporate office buildings; (iv) infrastructure costs related to projects we are developing on behalf of others; (v) costs related to future development projects, including purchase options on land and (vi) earnest money deposits associated with potential acquisitions. |
We generally lease our properties on a long-term basis (with a weighted average lease term remaining of four years). The following table summarizes the lease expirations of our consolidated operating portfolio for leases in place at December 31, 2016 (dollars and square feet in millions):
|
|
|
|
|
|
|
|
|
|
|
|
|
|
|
|
|
|
|
|
|
|
|
|
|
|
|
|
|
|
|
|
|
NER |
|
|||||||||
|
|
|
Number of Leases |
|
|
Occupied Square Feet |
|
|
Dollars |
|
|
Percent of Total |
|
|
Dollars Per Square Foot |
|
|||||
|
2017 |
|
|
750 |
|
|
|
38 |
|
|
$ |
182 |
|
|
|
11.3 |
% |
|
$ |
4.76 |
|
|
2018 |
|
|
827 |
|
|
|
49 |
|
|
|
246 |
|
|
|
15.3 |
% |
|
|
5.01 |
|
|
2019 |
|
|
747 |
|
|
|
52 |
|
|
|
242 |
|
|
|
15.0 |
% |
|
|
4.70 |
|
|
2020 |
|
|
568 |
|
|
|
34 |
|
|
|
176 |
|
|
|
10.9 |
% |
|
|
5.24 |
|
|
2021 |
|
|
592 |
|
|
|
45 |
|
|
|
232 |
|
|
|
14.4 |
% |
|
|
5.19 |
|
|
2022 |
|
|
281 |
|
|
|
32 |
|
|
|
160 |
|
|
|
9.9 |
% |
|
|
5.05 |
|
|
2023 |
|
|
138 |
|
|
|
16 |
|
|
|
85 |
|
|
|
5.3 |
% |
|
|
5.35 |
|
|
2024 |
|
|
77 |
|
|
|
10 |
|
|
|
57 |
|
|
|
3.5 |
% |
|
|
5.67 |
|
|
2025 |
|
|
59 |
|
|
|
12 |
|
|
|
66 |
|
|
|
4.1 |
% |
|
|
5.68 |
|
|
2026 |
|
|
30 |
|
|
|
7 |
|
|
|
45 |
|
|
|
2.8 |
% |
|
|
6.35 |
|
|
Thereafter |
|
|
75 |
|
|
|
20 |
|
|
|
121 |
|
|
|
7.5 |
% |
|
|
6.20 |
|
|
|
|
|
4,144 |
|
|
|
315 |
|
|
$ |
1,612 |
|
|
|
100.0 |
% |
|
$ |
5.15 |
|
|
Month to month |
|
|
135 |
|
|
|
7 |
|
|
|
|
|
|
|
|
|
|
|
|
|
|
Total |
|
|
4,279 |
|
|
|
322 |
|
|
|
|
|
|
|
|
|
|
|
|
|
18
Included in our owned and managed portfolio are consolidated and unconsolidated co-investment ventures that hold investments in real estate properties, primarily logistics facilities that we also manage. Our unconsolidated co-investment ventures are accounted for under the equity method. The amounts included for the unconsolidated ventures are reflected at 100% of the amount included in the ventures’ financial statements as calculated on a GAAP basis, not our proportionate share. The following table summarizes our consolidated and unconsolidated co-investment ventures at December 31, 2016 (in millions):
|
|
|
Operating Properties |
|
|
|
|
|
|
|
|
|
|||||
|
|
|
Square Feet |
|
|
Gross Book Value |
|
|
Investment in Land |
|
|
Development Portfolio – TEI |
|
||||
|
Consolidated Co-Investment Ventures |
|
|
|
|
|
|
|
|
|
|
|
|
|
|
|
|
|
U.S.: |
|
|
|
|
|
|
|
|
|
|
|
|
|
|
|
|
|
Prologis North American Industrial Fund (“NAIF”) |
|
|
40 |
|
|
$ |
2,438 |
|
|
$ |
- |
|
|
$ |
- |
|
|
Prologis U.S. Logistics Venture (“USLV”) |
|
|
72 |
|
|
|
6,058 |
|
|
|
36 |
|
|
|
96 |
|
|
Totals |
|
|
112 |
|
|
$ |
8,496 |
|
|
$ |
36 |
|
|
$ |
96 |
|
|
|
|
|
|
|
|
|
|
|
|
|
|
|
|
|
|
|
|
Unconsolidated Co-Investment Ventures |
|
|
|
|
|
|
|
|
|
|
|
|
|
|
|
|
|
U.S.: |
|
|
|
|
|
|
|
|
|
|
|
|
|
|
|
|
|
Prologis Targeted U.S. Logistics Fund (“USLF”) |
|
|
50 |
|
|
$ |
4,704 |
|
|
$ |
- |
|
|
$ |
- |
|
|
Subtotal U.S. |
|
|
50 |
|
|
|
4,704 |
|
|
|
- |
|
|
|
- |
|
|
Other Americas: |
|
|
|
|
|
|
|
|
|
|
|
|
|
|
|
|
|
FIBRA Prologis |
|
|
34 |
|
|
|
1,942 |
|
|
|
2 |
|
|
|
- |
|
|
Prologis Brazil Logistics Partners Fund I (“Brazil Fund”) and related joint ventures |
|
|
8 |
|
|
|
505 |
|
|
|
128 |
|
|
|
120 |
|
|
Subtotal Other Americas |
|
|
42 |
|
|
|
2,447 |
|
|
|
130 |
|
|
|
120 |
|
|
Europe: |
|
|
|
|
|
|
|
|
|
|
|
|
|
|
|
|
|
Europe Logistics Venture 1 (“ELV”) (1) |
|
|
6 |
|
|
|
378 |
|
|
|
- |
|
|
|
- |
|
|
Prologis European Logistics Partners Sàrl (“PELP”) |
|
|
59 |
|
|
|
3,769 |
|
|
|
28 |
|
|
|
26 |
|
|
Prologis European Properties Fund II (“PEPF II”) |
|
|
72 |
|
|
|
4,881 |
|
|
|
5 |
|
|
|
19 |
|
|
Prologis Targeted Europe Logistics Fund (“PTELF”) (1) |
|
|
26 |
|
|
|
2,458 |
|
|
|
2 |
|
|
|
- |
|
|
Subtotal Europe |
|
|
163 |
|
|
|
11,486 |
|
|
|
35 |
|
|
|
45 |
|
|
Asia: |
|
|
|
|
|
|
|
|
|
|
|
|
|
|
|
|
|
Nippon Prologis REIT (“NPR”) |
|
|
25 |
|
|
|
4,101 |
|
|
|
- |
|
|
|
- |
|
|
Prologis China Logistics Venture |
|
|
11 |
|
|
|
559 |
|
|
|
42 |
|
|
|
734 |
|
|
Subtotal Asia |
|
|
36 |
|
|
|
4,660 |
|
|
|
42 |
|
|
|
734 |
|
|
Totals |
|
|
291 |
|
|
$ |
23,297 |
|
|
$ |
207 |
|
|
$ |
899 |
|
|
(1) |
In January 2017, we sold our investment in ELV to our fund partner and ELV contributed its properties to PTELF in exchange for equity interests. |
For more information regarding our unconsolidated and consolidated co-investment ventures, see Notes 5 and 12 to the Consolidated Financial Statements in Item 8. Financial Statements and Supplementary Data.
From time to time, we and our unconsolidated co-investment ventures are parties to a variety of legal proceedings arising in the ordinary course of business. We believe that, with respect to any such matters to which we are currently a party, the ultimate disposition of any such matter will not result in a material adverse effect on our business, financial position or results of operations.
ITEM 4. Mine Safety Disclosures
Not Applicable.
19
ITEM 5. Market for Registrant’s Common Equity, Related Stockholder Matters and Issuer Purchases of Equity Securities
MARKET INFORMATION AND HOLDERS
Our common stock is listed on the NYSE under the symbol “PLD.” The following table sets forth the high and low sale price of our common stock, as reported in the NYSE Composite Tape, and the declared dividends per share, for the periods indicated.
|
|
|
High |
|
|
Low |
|
|
Dividends |
|
|||
|
2016 |
|
|
|
|
|
|
|
|
|
|
|
|
|
First Quarter |
|
$ |
44.26 |
|
|
$ |
35.25 |
|
|
$ |
0.42 |
|
|
Second Quarter |
|
$ |
50.74 |
|
|
$ |
43.45 |
|
|
$ |
0.42 |
|
|
Third Quarter |
|
$ |
54.87 |
|
|
$ |
48.46 |
|
|
$ |
0.42 |
|
|
Fourth Quarter |
|
$ |
53.51 |
|
|
$ |
45.93 |
|
|
$ |
0.42 |
|
|
2015 |
|
|
|
|
|
|
|
|
|
|
|
|
|
First Quarter |
|
$ |
47.56 |
|
|
$ |
41.15 |
|
|
$ |
0.36 |
|
|
Second Quarter |
|
$ |
44.48 |
|
|
$ |
37.03 |
|
|
$ |
0.36 |
|
|
Third Quarter |
|
$ |
42.49 |
|
|
$ |
36.26 |
|
|
$ |
0.40 |
|
|
Fourth Quarter |
|
$ |
43.69 |
|
|
$ |
38.66 |
|
|
$ |
0.40 |
|
Our future common stock dividends, if and as declared, may vary and will be determined by the Board upon the circumstances prevailing at the time, including our financial condition, operating results, estimated taxable income and REIT distribution requirements. These dividends, if and as declared, may be adjusted at the discretion of the Board during the year.
On February 10, 2017, we had approximately 529,345,000 shares of common stock outstanding, which were held of record by approximately 4,690 stockholders.
Stock Performance Graph
The following line graph compares the change in Prologis, Inc. cumulative total stockholder’s return on shares of its common stock from December 31, 2011, to the cumulative total return of the S&P 500 Stock Index and the Financial Times and Stock Exchange NAREIT Equity REITs Index from December 31, 2011, to December 31, 2016. The graph assumes an initial investment of $100 in our common stock and each of the indices on December 31, 2011, and, as required by the SEC, the reinvestment of all dividends. The return shown on the graph is not necessarily indicative of future performance.
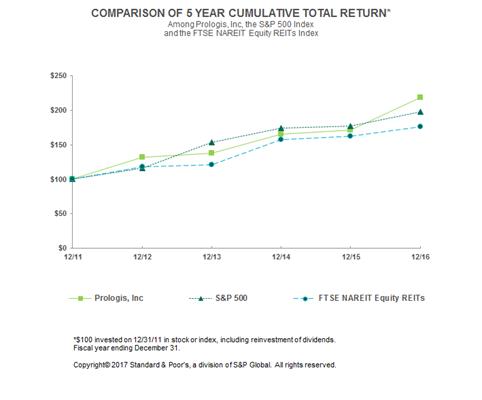
20
This graph and the accompanying text are not “soliciting material,” are not deemed filed with the SEC and are not to be incorporated by reference in any filing by the company under the Securities Act of 1933, as amended, or the Securities Exchange Act of 1934, as amended, whether made before or after the date hereof and irrespective of any general incorporation language in any such filing.
At December 31, 2016, and 2015, we had 1.6 million shares of the Series Q preferred stock with a liquidation preference of $50 per share. Dividends payable per share were $4.27 for the years ended December 31, 2016, and 2015.
For more information regarding dividends, see Note 10 to the Consolidated Financial Statements in Item 8. Financial Statements and Supplementary Data.
SALES OF UNREGISTERED SECURITIES
During 2016, we issued an aggregate of 1.9 million shares of common stock of Prologis, Inc. in connection with the redemption of common units of Prologis, L.P. During 2015, we issued common units and Class A Units of Prologis, L.P. See Note 11 to the Consolidated Financial Statements in Item 8. Financial Statements and Supplementary Data for more information. The issuance of the shares of common stock, common units and Class A Units was undertaken in reliance upon the exemption from registration requirements of the Securities Act of 1933, as amended, afforded by Section 4(a)(2) thereof.
SECURITIES AUTHORIZED FOR ISSUANCE UNDER EQUITY COMPENSATION PLANS
For information regarding securities authorized for issuance under our equity compensation plans, see Notes 10 and 13 to the Consolidated Financial Statements in Item 8. Financial Statements and Supplementary Data.
Common Stock Plans
Further information relative to our equity compensation plans will be provided in our 2017 Proxy Statement or in an amendment filed on Form 10-K/A.
21
ITEM 6. Selected Financial Data
The following table summarizes selected financial data related to our historical financial condition and results of operations for both Prologis, Inc. and Prologis, L.P. (in millions, except for per share and unit amounts):
|
|
Years Ended December 31, |
|
|||||||||||||||||
|
|
2016 |
|
|
2015 |
|
|
2014 |
|
|
2013 |
|
|
2012 |
|
|||||
|
Operating Data: |
|
|
|
|
|
|
|
|
|
|
|
|
|
|
|
|
|
|
|
|
Total revenues |
$ |
2,533 |
|
|
$ |
2,197 |
|
|
$ |
1,761 |
|
|
$ |
1,750 |
|
|
$ |
1,961 |
|
|
Gains on dispositions of investments in real estate and revaluation of equity investments upon acquisition of a controlling interest, net (1) |
$ |
757 |
|
|
$ |
759 |
|
|
$ |
726 |
|
|
$ |
715 |
|
|
$ |
72 |
|
|
Consolidated net earnings (loss) |
$ |
1,293 |
|
|
$ |
926 |
|
|
$ |
739 |
|
|
$ |
230 |
|
|
$ |
(106 |
) |
|
Net earnings (loss) per share attributable to common stockholders and unitholders – Basic: |
|
|
|
|
|
|
|
|
|
|
|
|
|
|
|
|
|
|
|
|
Continuing operations (2) |
$ |
2.29 |
|
|
$ |
1.66 |
|
|
$ |
1.25 |
|
|
$ |
0.40 |
|
|
$ |
(0.35 |
) |
|
Discontinued operations (2) (3) |
|
- |
|
|
|
- |
|
|
|
- |
|
|
|
0.25 |
|
|
|
0.17 |
|
|
Net earnings (loss) per share attributable to common stockholders and unitholders – Basic |
$ |
2.29 |
|
|
$ |
1.66 |
|
|
$ |
1.25 |
|
|
$ |
0.65 |
|
|
$ |
(0.18 |
) |
|
Net earnings (loss) per share attributable to common stockholders and unitholders – Diluted: |
|
|
|
|
|
|
|
|
|
|
|
|
|
|
|
|
|
|
|
|
Continuing operations |
$ |
2.27 |
|
|
$ |
1.64 |
|
|
$ |
1.24 |
|
|
$ |
0.39 |
|
|
$ |
(0.34 |
) |
|
Discontinued operations (3) |
|
- |
|
|
|
- |
|
|
|
- |
|
|
|
0.25 |
|
|
|
0.16 |
|
|
Net earnings (loss) per share attributable to common stockholders and unitholders – Diluted |
$ |
2.27 |
|
|
$ |
1.64 |
|
|
$ |
1.24 |
|
|
$ |
0.64 |
|
|
$ |
(0.18 |
) |
|
Dividends per common share and distributions per common unit |
$ |
1.68 |
|
|
$ |
1.52 |
|
|
$ |
1.32 |
|
|
$ |
1.12 |
|
|
$ |
1.12 |
|
|
Balance Sheet Data: |
|
|
|
|
|
|
|
|
|
|
|
|
|
|
|
|
|
|
|
|
Total assets |
$ |
30,250 |
|
|
$ |
31,395 |
|
|
$ |
25,775 |
|
|
$ |
24,534 |
|
|
$ |
27,268 |
|
|
Total debt |
$ |
10,608 |
|
|
$ |
11,627 |
|
|
$ |
9,337 |
|
|
$ |
8,973 |
|
|
$ |
11,749 |
|
|
FFO (4): |
|
|
|
|
|
|
|
|
|
|
|
|
|
|
|
|
|
|
|
|
Reconciliation of net earnings (loss) to FFO: |
|
|
|
|
|
|
|
|
|
|
|
|
|
|
|
|
|
|
|
|
Net earnings (loss) attributable to common stockholders |
$ |
1,203 |
|
|
$ |
863 |
|
|
$ |
622 |
|
|
$ |
315 |
|
|
$ |
(81 |
) |
|
Total NAREIT defined adjustments |
|
534 |
|
|
|
461 |
|
|
|
299 |
|
|
|
504 |
|
|
|
633 |
|
|
Total our defined adjustments |
|
(35 |
) |
|
|
(15 |
) |
|
|
(33 |
) |
|
|
36 |
|
|
|
- |
|
|
FFO, as modified by Prologis (4) |
$ |
1,702 |
|
|
$ |
1,309 |
|
|
$ |
888 |
|
|
$ |
855 |
|
|
$ |
552 |
|
|
Total core defined adjustments |
|
(302 |
) |
|
|
(128 |
) |
|
|
65 |
|
|
|
(42 |
) |
|
|
262 |
|
|
Core FFO (4) |
$ |
1,400 |
|
|
$ |
1,181 |
|
|
$ |
953 |
|
|
$ |
813 |
|
|
$ |
814 |
|
|
(1) |
In 2012, this included impairment charges of $269 million. |
|
(2) |
Net earnings (loss) per share attributable to common unitholders for the Prologis, L.P. was $(0.34) and $0.16 for continuing operations and discontinued operations, respectively, in 2012. For all other years, the amounts for the Prologis, L.P. were the same as Prologis, Inc. |
|
(3) |
In 2014, the accounting standard changed for classifying and reporting discontinued operations and as such, none of our dispositions in 2016, 2015 or 2014 met the qualifications to be reported as discontinued operations. |
|
(4) |
FFO; FFO, as modified by Prologis and Core FFO are non-GAAP measures. See Item 7. Management’s Discussion and Analysis of Financial Condition and Results of Operations for our definition of our FFO measures and a complete reconciliation to net earnings. |
ITEM 7. Management’s Discussion and Analysis of Financial Condition and Results of Operations
The following discussion should be read in conjunction with the Consolidated Financial Statements included in Item 8. Financial Statements and Supplementary Data of this report and the matters described under Item 1A. Risk Factors.
We believe the quality and scale of our global operating portfolio, the expertise of our team and the strength of our balance sheet give us unique competitive advantages. Our plan to grow revenues, earnings, NOI, cash flows and funds from operations is based on the following:
22
|
into increased future earnings, NOI and cash flow, both on a consolidated basis and through the amounts we recognize from our unconsolidated co-investment ventures based on our ownership. This is reflected in the positive rent change on rollovers (when comparing the net effective rent of the new lease to the prior lease for the same space) on our owned and managed operating portfolio that we have experienced every quarter beginning in 2013 and which we expect to continue for several more years. |
|
• |
Value Creation from Development. We believe a successful development and redevelopment program involves maintaining control of well-positioned land. On the basis of our current estimates, our owned and managed land bank has the potential to support the development of $8.4 billion of TEI of logistics space. We believe the carrying value of our land bank is below its current fair value, and we expect to realize this value going forward primarily through development. During 2016, in our owned and managed portfolio, we stabilized development projects with a TEI of $2.5 billion. Post stabilization, we estimate the value of these buildings to be 25.5% above their book value or the cost to develop (defined as estimated margin and calculated using estimated yield and capitalization rates from our underwriting models). In addition, these properties will generate an increase in NOI as they are leased up and become occupied. |
|
• |
Economies of Scale from Growth in Assets Under Management. Over the last several years, we have invested in a variety of technologies that have allowed us to achieve efficiencies and increase our investments in real estate with minimal increases to general and administrative (“G&A”) expenses. We have increased our owned and managed real estate assets by 85 million square feet (or approximately 16%) over the last two years primarily through acquisitions and integrated the assets with only minimal increases in overhead related to property management and leasing functions. We will continue to leverage these technologies in order to further streamline our operations and reduce our costs as a percentage of assets under management, along with advanced data analysis to enhance decision making. |
Summary of 2016
During the year ended December 31, 2016, operating fundamentals remained strong for our owned and managed portfolio and we ended the year with occupancy of 97.1%. See below for details of the operating and development activity of our Owned and Managed Portfolio. During 2016, we completed the following activities as further described in the footnotes to the Consolidated Financial Statements:
|
• |
We generated net proceeds of $3.0 billion from the contribution and disposition of real estate assets. We recorded net gains of $354 million from dispositions to third parties, primarily in the U.S., and $267 million from property contributions, principally in Europe and Japan. |
|
• |
We earned promotes from PEP II, PTELF and USLV aggregating $96 million, of which $89 million was recorded in Strategic Capital Revenues, and $7 million was recorded in Net Earnings Attributable to Noncontrolling Interests. |
|
• |
We generated proceeds of $611 million and recorded gains of $136 million through the redemption of our investments in certain unconsolidated co-investment ventures. |
|
• |
We amended our global senior credit facility (the “Global Facility”) and increased the total borrowing capacity to $3.0 billion and extended the maturity until April 2020. This facility, along with our Japanese yen revolver, increased our total borrowing capacity, which was $3.3 billion at December 31, 2016. |
|
• |
We entered into an ¥120.0 billion ($1.0 billion at December 31, 2016) unsecured yen senior term loan agreement (the “Yen Term Loan”) and repaid our existing yen term loans. See Liquidity and Capital Resources section below for details of this transaction. |
In January 2017, we sold our investment in ELV to our fund partner and ELV contributed its properties to PTELF in exchange for equity interests.
We evaluate our business operations based on the NOI of our two business reporting segments, Real Estate Operations and Strategic Capital. NOI by segment is a non-GAAP financial measure that is calculated using revenues and expenses directly from our financial statements. We consider NOI by segment to be an appropriate supplemental measure of our performance because it helps both management and investors to understand the core operations of our business.
Below is a reconciliation of our NOI by segment to Operating Income per the Consolidated Financial Statements for the years ended December 31 (in millions). Each segment’s NOI is reconciled to a line item in the Consolidated Financial Statements in the respective segment discussion below.
23
|
|
|
2016 |
|
|
2015 |
|
|
2014 |
|
|||
|
Real Estate Operations segment – NOI |
|
$ |
1,655 |
|
|
$ |
1,376 |
|
|
$ |
1,087 |
|
|
Strategic Capital segment – NOI |
|
|
166 |
|
|
|
102 |
|
|
|
104 |
|
|
General and administrative expenses |
|
|
(222 |
) |
|
|
(217 |
) |
|
|
(229 |
) |
|
Depreciation and amortization expenses |
|
|
(931 |
) |
|
|
(881 |
) |
|
|
(642 |
) |
|
Operating income |
|
$ |
668 |
|
|
$ |
380 |
|
|
$ |
320 |
|
|
|
|
|
|
|
|
|
|
|
|
|
|
|
See Note 18 to the Consolidated Financial Statements for more information on our segments and a reconciliation of each reportable business segment’s NOI to Operating Income and Earnings Before Income Taxes.
Real Estate Operations
This operating segment principally includes rental revenues, rental recoveries and rental expenses recognized from our consolidated properties. We allocate the costs of our property management functions to the Real Estate Operations segment through Rental Expenses and the Strategic Capital segment through Strategic Capital Expenses based on the size of the relative portfolios as compared to our total owned and managed portfolio. The operating fundamentals in the markets in which we operate continue to improve, which has positively affected both the rental rates and occupancy and also has fueled development activity.
Below are the components of Real Estate Operations revenues, expenses and NOI for the years ended December 31 (in millions), derived directly from line items in the Consolidated Financial Statements.
|
|
|
2016 |
|
|
2015 |
|
|
2014 |
|
|||
|
Rental revenues |
|
$ |
1,735 |
|
|
$ |
1,536 |
|
|
$ |
1,179 |
|
|
Rental recoveries |
|
|
486 |
|
|
|
437 |
|
|
|
349 |
|
|
Development management and other revenues |
|
|
17 |
|
|
|
14 |
|
|
|
13 |
|
|
Rental expenses |
|
|
(569 |
) |
|
|
(544 |
) |
|
|
(430 |
) |
|
Other expenses |
|
|
(14 |
) |
|
|
(67 |
) |
|
|
(24 |
) |
|
Real Estate Operations – NOI |
|
$ |
1,655 |
|
|
$ |
1,376 |
|
|
$ |
1,087 |
|
Real Estate Operations revenues, expenses and NOI are impacted by capital deployment activities, occupancy and changes in rental rates. The following items highlight the key changes in NOI for the years ended December 31 (in millions):
|
|
|
Change in |
|
|||||
|
|
|
2016 from 2015 |
|
|
2015 from 2014 |
|
||
|
Acquisitions (1) |
|
$ |
194 |
|
|
$ |
279 |
|
|
Rent rate and occupancy growth (2) |
|
|
89 |
|
|
|
76 |
|
|
Development activity (3) |
|
|
39 |
|
|
|
17 |
|
|
Contributions and dispositions |
|
|
(91 |
) |
|
|
(98 |
) |
|
Other (4) |
|
|
48 |
|
|
|
15 |
|
|
Total change in Real Estate Operations – NOI |
|
$ |
279 |
|
|
$ |
289 |
|
|
(1) |
The impact from acquisitions in 2016 from 2015 was primarily due to the acquisition of the real estate assets and operating platform of KTR Capital Partners and its affiliates (“KTR”) in May 2015, which generated an additional $152 million of net revenues, including a decrease of $25 million acquisition costs in 2016. |
The impact from acquisitions in 2015 from 2014 included the KTR transaction in 2015 and the consolidation of NAIF in 2014. KTR included an additional $176 million of net revenues, which was slightly offset by $25 million in acquisition costs.
In the fourth quarter of 2014, we consolidated our co-investment venture NAIF, which increased NOI $153 million in 2015 from 2014.
Approximately 45% and 34% of KTR and NAIF activity, respectively, is offset in Net Earnings Attributable to Noncontrolling Interests attributable to our venture partner’s share. See Note 3 in the Consolidated Financial Statements for further detail on the KTR transaction and NAIF consolidation.
|
(2) |
Rent rate growth is a combination of the turnover of existing leases and increases in rental rates from contractual rent increases on existing leases. If a lease has a contractual rent increase that is not known at the time the lease is signed, such as the consumer price index or a similar metric, the rent increase is not included in rent leveling and therefore, would impact the rental revenues we recognize. We have experienced an increase in rental rates on turnover of existing leases every quarter beginning in 2013 that has resulted in higher average rental rates in our portfolio and increased rental revenues and NOI as those leases commenced. |
|
(3) |
We have had a steady increase in properties that have been completed and leased from 2014 to 2016. |
24
Below are key operating metrics of our consolidated operating portfolio for the years ended December 31:
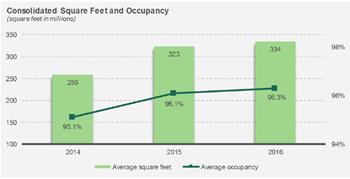
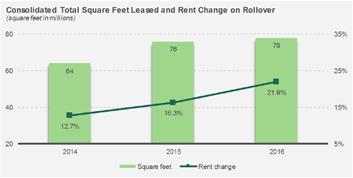
Strategic Capital
This operating segment includes revenues from asset management and other fees as well as promotes earned for services performed for our unconsolidated co-investment ventures. Revenues associated with the Strategic Capital segment fluctuate because of the size of co-investment ventures under management, the transactional activity in the ventures and the timing of promotes. These revenues are reduced generally by the direct costs associated with the asset management and property-level management for the properties owned by these ventures. We allocate the costs of our property management functions to the Strategic Capital segment through Strategic Capital Expenses and to the Real Estate Operations segment through Rental Expenses based on the size of the relative portfolios as compared to our total owned and managed portfolio.
Below are the components of Strategic Capital revenues, expenses and NOI for the years ended December 31, derived directly from the line items in the Consolidated Financial Statements (in millions):
|
|
|
2016 |
|
|
2015 |
|
|
2014 |
|
|||
|
Strategic capital revenues |
|
$ |
295 |
|
|
$ |
210 |
|
|
$ |
220 |
|
|
Strategic capital expenses |
|
|
(129 |
) |
|
|
(108 |
) |
|
|
(116 |
) |
|
Strategic Capital – NOI |
|
$ |
166 |
|
|
$ |
102 |
|
|
$ |
104 |
|
Below is additional detail of our Strategic Capital revenues, expenses and NOI for the years ended December 31 (in millions):
|
|
|
2016 |
|
|
2015 |
|
|
2014 |
|
|||
|
U.S. (1): |
|
|
|
|
|
|
|
|
|
|
|
|
|
Asset management and other fees |
|
$ |
33 |
|
|
$ |
31 |
|
|
$ |
41 |
|
|
Leasing commissions, acquisition and other transaction fees |
|
|
6 |
|
|
|
8 |
|
|
|
12 |
|
|
Promotes (2) |
|
|
- |
|
|
|
- |
|
|
|
31 |
|
|
Strategic capital expenses (3) |
|
|
(41 |
) |
|
|
(41 |
) |
|
|
(46 |
) |
|
Subtotal U.S. |
|
|
(2 |
) |
|
|
(2 |
) |
|
|
38 |
|
|
Other Americas (4): |
|
|
|
|
|
|
|
|
|
|
|
|
|
Asset management and other fees |
|
|
21 |
|
|
|
20 |
|
|
|
11 |
|
|
Leasing commissions, acquisition and other transaction fees |
|
|
2 |
|
|
|
2 |
|
|
|
- |
|
|
Strategic capital expenses |
|
|
(10 |
) |
|
|
(9 |
) |
|
|
(9 |
) |
|
Subtotal Other Americas |
|
|
13 |
|
|
|
13 |
|
|
|
2 |
|
|
Europe: |
|
|
|
|
|
|
|
|
|
|
|
|
|
Asset management and other fees |
|
|
84 |
|
|
|
71 |
|
|
|
71 |
|
|
Leasing commissions, acquisition and other transaction fees |
|
|
13 |
|
|
|
12 |
|
|
|
16 |
|
|
Promotes (2) |
|
|
89 |
|
|
|
30 |
|
|
|
- |
|
|
Strategic capital expenses |
|
|
(43 |
) |
|
|
(27 |
) |
|
|
(30 |
) |
|
Subtotal Europe |
|
|
143 |
|
|
|
86 |
|
|
|
57 |
|
|
Asia: |
|
|
|
|
|
|
|
|
|
|
|
|
|
Asset management and other fees |
|
|
38 |
|
|
|
32 |
|
|
|
32 |
|
|
Leasing commissions, acquisition and other transaction fees |
|
|
9 |
|
|
|
4 |
|
|
|
6 |
|
|
Strategic capital expenses |
|
|
(35 |
) |
|
|
(31 |
) |
|
|
(31 |
) |
|
Subtotal Asia |
|
|
12 |
|
|
|
5 |
|
|
|
7 |
|
|
Strategic Capital – NOI |
|
$ |
166 |
|
|
$ |
102 |
|
|
$ |
104 |
|
25
|
(1) |
In 2014, we acquired a controlling interest in our co-investment venture NAIF. See Notes 3 and 4 to the Consolidated Financial Statements for additional information on this venture. |
|
(2) |
The promotes represent the third parties’ share based on the venture’s cumulative returns to the investors over the last three years. Approximately 40% of promote revenues are paid as a combination of cash and stock awards pursuant to the terms of the Prologis Promote Plan and expensed through Strategic Capital Expenses. |
|
(3) |
This includes compensation and personnel costs for employees who are located in the U.S. but also support other regions. |
|
(4) |
In 2014, we formed the co-investment venture FIBRA Prologis. See Note 4 to the Consolidated Financial Statements for additional information on this venture. |
The following real estate investments were held through our unconsolidated co-investment ventures at December 31 (dollars and square feet in millions):
|
|
|
2016 |
|
|
2015 |
|
|
2014 |
|
|||
|
U.S.: |
|
|
|
|
|
|
|
|
|
|
|
|
|
Number of ventures |
|
|
1 |
|
|
|
1 |
|
|
|
1 |
|
|
Number of properties owned |
|
|
369 |
|
|
|
391 |
|
|
|
392 |
|
|
Square feet |
|
|
50 |
|
|
|
50 |
|
|
|
50 |
|
|
Total assets |
|
$ |
4,238 |
|
|
$ |
4,408 |
|
|
$ |
4,403 |
|
|
Other Americas: |
|
|
|
|
|
|
|
|
|
|
|
|
|
Number of ventures |
|
|
2 |
|
|
|
2 |
|
|
|
2 |
|
|
Number of properties owned |
|
|
213 |
|
|
|
205 |
|
|
|
198 |
|
|
Square feet |
|
|
42 |
|
|
|
39 |
|
|
|
37 |
|
|
Total assets |
|
$ |
2,793 |
|
|
$ |
2,482 |
|
|
$ |
2,653 |
|
|
Europe: |
|
|
|
|
|
|
|
|
|
|
|
|
|
Number of ventures |
|
|
4 |
|
|
|
4 |
|
|
|
4 |
|
|
Number of properties owned |
|
|
700 |
|
|
|
688 |
|
|
|
636 |
|
|
Square feet |
|
|
163 |
|
|
|
159 |
|
|
|
148 |
|
|
Total assets |
|
$ |
10,853 |
|
|
$ |
11,343 |
|
|
$ |
11,440 |
|
|
Asia: |
|
|
|
|
|
|
|
|
|
|
|
|
|
Number of ventures |
|
|
2 |
|
|
|
2 |
|
|
|
2 |
|
|
Number of properties owned |
|
|
85 |
|
|
|
66 |
|
|
|
52 |
|
|
Square feet |
|
|
36 |
|
|
|
29 |
|
|
|
26 |
|
|
Total assets |
|
$ |
5,173 |
|
|
$ |
4,320 |
|
|
$ |
4,120 |
|
|
Total: |
|
|
|
|
|
|
|
|
|
|
|
|
|
Number of ventures |
|
|
9 |
|
|
|
9 |
|
|
|
9 |
|
|
Number of properties owned |
|
|
1,367 |
|
|
|
1,350 |
|
|
|
1,278 |
|
|
Square feet |
|
|
291 |
|
|
|
277 |
|
|
|
261 |
|
|
Total assets |
|
$ |
23,057 |
|
|
$ |
22,553 |
|
|
$ |
22,616 |
|
See Note 5 to the Consolidated Financial Statements for additional information on our unconsolidated co-investment ventures.
G&A Expenses
G&A expenses increased $5 million for the year ended December 31, 2016, compared to the same time period in 2015, primarily due to increased compensation, including equity-based compensation awards. G&A expenses decreased $12 million for the year ended December 31, 2015, compared to the same time period in 2014, primarily due to fluctuations in foreign currency exchange rates between the U.S. dollar and the British pound sterling, euro and Japanese yen.
We capitalize certain costs directly related to our development and leasing activities. Capitalized G&A expenses included salaries and related costs, as well as other G&A costs. The following table summarizes capitalized G&A amounts for the years ended December 31 (in millions):
|
|
|
2016 |
|
|
2015 |
|
|
2014 |
|
|||
|
Building and land development activities |
|
$ |
61 |
|
|
$ |
63 |
|
|
$ |
56 |
|
|
Leasing activities |
|
|
24 |
|
|
|
21 |
|
|
|
18 |
|
|
Operating building improvements and other |
|
|
16 |
|
|
|
16 |
|
|
|
13 |
|
|
Total capitalized G&A expenses |
|
$ |
101 |
|
|
$ |
100 |
|
|
$ |
87 |
|
|
Capitalized salaries and related costs as a percent of total salaries and related costs |
|
|
26.0 |
% |
|
|
27.6 |
% |
|
|
23.9 |
% |
26
Depreciation and Amortization Expenses
The following table highlights the key changes in depreciation and amortization expenses for the years ended December 31 (in millions):
|
|
|
Change in |
|
|||||
|
|
|
2016 from 2015 |
|
|
2015 from 2014 |
|
||
|
Acquisition of properties (1) |
|
$ |
65 |
|
|
$ |
269 |
|
|
Development properties placed into service |
|
|
22 |
|
|
|
12 |
|
|
Disposition and contribution of properties |
|
|
(45 |
) |
|
|
(56 |
) |
|
Other |
|
|
9 |
|
|
|
13 |
|
|
Total change in depreciation and amortization expenses |
|
$ |
51 |
|
|
$ |
238 |
|
|
(1) |
The increase in 2015 from 2014 included the KTR transaction and the consolidation of NAIF. |
Our Owned and Managed Properties
We manage our business on an owned and managed basis, which includes properties wholly owned by us or owned by one of our co-investment ventures. We review our operating fundamentals on an owned and managed basis. We believe reviewing these fundamentals this way allows management to understand the entire impact to the financial statements, as it will affect both the Real Estate Operations and Strategic Capital segments, as well as the net earnings we recognize from our unconsolidated co-investment ventures based on our ownership share. We do not control the unconsolidated co-investment ventures for purposes of GAAP and the presentation of the ventures’ operating information does not represent a legal claim to such items.
Our owned and managed portfolio includes operating properties and does not include properties under development or held for sale to third parties and was as follows at December 31 (square feet in millions):
|
|
2016 |
|
|
2015 |
|
|
2014 |
|
|||||||||||||||||||||||||||
|
|
Number of Properties |
|
|
Square Feet |
|
|
Percentage Occupied |
|
|
Number of Properties |
|
|
Square Feet |
|
|
Percentage Occupied |
|
|
Number of Properties |
|
|
Square Feet |
|
|
Percentage Occupied |
|
|||||||||
|
Consolidated |
|
1,777 |
|
|
|
332 |
|
|
|
97.0 |
% |
|
|
1,872 |
|
|
|
334 |
|
|
|
97.1 |
% |
|
|
1,605 |
|
|
|
282 |
|
|
|
96.4 |
% |
|
Unconsolidated |
|
1,359 |
|
|
|
290 |
|
|
|
97.2 |
% |
|
|
1,331 |
|
|
|
273 |
|
|
|
96.7 |
% |
|
|
1,248 |
|
|
|
255 |
|
|
|
95.9 |
% |
|
Totals |
|
3,136 |
|
|
|
622 |
|
|
|
97.1 |
% |
|
|
3,203 |
|
|
|
607 |
|
|
|
96.9 |
% |
|
|
2,853 |
|
|
|
537 |
|
|
|
96.1 |
% |
Operating Activity
Below is information summarizing the leasing activity of our owned and managed operating portfolio for the years ended December 31:
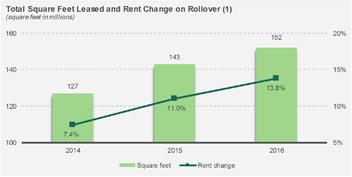
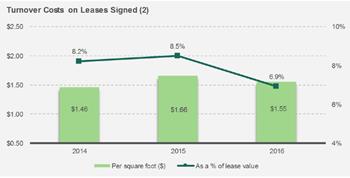
|
(1) |
We retained at least 80% of our customers, based on the total square feet of leases signed, for each year during the three-year period ended December 31, 2016. |
|
(2) |
Turnover costs represent the obligations incurred in connection with the signing of a lease, including leasing commissions and tenant improvements. |
27
We capitalize costs incurred in developing, renovating, rehabilitating and improving our properties as part of the investment basis. The following table summarizes our capital expenditures on previously leased buildings within our owned and managed portfolio for the years ended December 31 (in millions):
|
|
|
2016 |
|
|
2015 |
|
|
2014 |
|
|||
|
Property improvements |
|
$ |
165 |
|
|
$ |
143 |
|
|
$ |
140 |
|
|
Tenant improvements |
|
|
120 |
|
|
|
127 |
|
|
|
117 |
|
|
Leasing commissions |
|
|
117 |
|
|
|
108 |
|
|
|
89 |
|
|
Total turnover costs |
|
|
237 |
|
|
|
235 |
|
|
|
206 |
|
|
Total capital expenditures |
|
$ |
402 |
|
|
$ |
378 |
|
|
$ |
346 |
|
|
Our proportionate share of capital expenditures based on ownership (1) |
|
$ |
261 |
|
|
$ |
257 |
|
|
$ |
245 |
|
|
(1) |
We calculated our proportionate share of capital expenditures by applying our ownership percentage of each co-investment venture on an entity-by-entity basis to the capital expenditures each period. |
Development Start Activity
The following table summarizes development starts for the years ended December 31 (dollars and square feet in millions):
|
|
|
2016 (1) |
|
|
2015 |
|
|
2014 |
|
|||
|
Number of new development projects during the period |
|
|
102 |
|
|
|
96 |
|
|
|
76 |
|
|
Square feet |
|
|
30 |
|
|
|
28 |
|
|
|
26 |
|
|
TEI |
|
$ |
2,181 |
|
|
$ |
2,247 |
|
|
$ |
2,034 |
|
|
Our proportionate share of TEI (2) |
|
$ |
1,809 |
|
|
$ |
1,815 |
|
|
$ |
1,792 |
|
|
Percentage of build-to-suits based on TEI |
|
|
35.6 |
% |
|
|
43.6 |
% |
|
|
32.6 |
% |
|
(1) |
We expect all of our properties under development at December 31, 2016, to be completed before July 2018. |
|
(2) |
We calculate our proportionate share of TEI by applying our ownership percentage of each co-investment venture on an entity-by-entity basis to the TEI of each period. |
Development Stabilization Activity
The following table summarizes development stabilization activity for the years ended December 31 (dollars and square feet in millions):
|
|
|
2016 |
|
|
2015 |
|
|
2014 |
|
|||
|
Number of development projects stabilized during the period |
|
|
98 |
|
|
|
81 |
|
|
|
47 |
|
|
Square feet |
|
|
32 |
|
|
|
26 |
|
|
|
17 |
|
|
TEI |
|
$ |
2,510 |
|
|
$ |
1,848 |
|
|
$ |
1,105 |
|
|
Our proportionate share of TEI (1) |
|
$ |
2,155 |
|
|
$ |
1,640 |
|
|
$ |
955 |
|
|
Weighted average expected yield on TEI (2) |
|
|
6.9 |
% |
|
|
7.4 |
% |
|
|
7.7 |
% |
|
Estimated value at completion |
|
$ |
3,150 |
|
|
$ |
2,434 |
|
|
$ |
1,360 |
|
|
Our proportionate share of estimated value at completion (1) |
|
$ |
2,726 |
|
|
$ |
2,173 |
|
|
$ |
1,191 |
|
|
Estimated weighted average margin |
|
|
25.5 |
% |
|
|
31.8 |
% |
|
|
23.0 |
% |
|
(1) |
We calculate our proportionate share of TEI and estimated value by applying our ownership percentage of each co-investment venture on an entity-by-entity basis to the TEI of each period. |
|
(2) |
We calculate the weighted average expected yield on TEI as estimated NOI assuming stabilized occupancy divided by TEI. |
For information on our development portfolio at December 31, 2016, see Item 2. Properties.
Same Store Analysis
We evaluate the operating performance of the operating properties we own and manage using a “same store” analysis because the population of properties in this analysis is consistent from period to period, thereby eliminating the effects of changes in the composition of the portfolio on performance measures. We include properties from our owned and managed portfolio in our same store analysis. We have defined the same store portfolio, for the three months ended December 31, 2016, as those properties that were in operation at January 1, 2015, and have been in operation throughout the same three-month periods in both 2016 and 2015 (including development properties that have been completed and available for lease). We have removed all properties that were disposed of to a third party or were classified as held for sale to a third party from the population for both periods. We believe the factors that affect rental revenues, rental expenses and NOI in the same store portfolio are generally the same as for the total operating portfolio. To derive an appropriate
28
measure of period-to-period operating performance, we remove the effects of foreign currency exchange rate movements by using the recent period end exchange rate to translate from local currency into the U.S. dollar, for both periods.
Same store is a commonly used measure in the real estate industry. Our same store measures are non-GAAP financial measures that are calculated beginning with rental revenues, rental recoveries and rental expenses from the financial statements prepared in accordance with GAAP. As our same store measures are non-GAAP financial measures, they have certain limitations as analytical tools and may vary among real estate companies. As a result, we provide a reconciliation from our financial statements prepared in accordance with GAAP to same store property NOI with explanations of how these metrics are calculated.
The following is a reconciliation of our consolidated rental revenues, rental recoveries, rental expenses and property NOI for the full year, as included in the Consolidated Statements of Income and within Note 20 to the Consolidated Financial Statements, to the respective amounts in our same store portfolio analysis for the three months ended December 31 (dollars in millions):
|
|
|
Three Months Ended |
|
|
|
|
|
|||||||||||||
|
|
|
March 31, |
|
|
June 30, |
|
|
September 30, |
|
|
December 31, |
|
|
Full Year |
|
|||||
|
2016 |
|
|
|
|
|
|
|
|
|
|
|
|
|
|
|
|
|
|
|
|
|
Rental revenues |
|
$ |
437 |
|
|
$ |
426 |
|
|
$ |
436 |
|
|
$ |
436 |
|
|
$ |
1,735 |
|
|
Rental recoveries |
|
|
117 |
|
|
|
120 |
|
|
|
125 |
|
|
|
124 |
|
|
|
486 |
|
|
Rental expenses |
|
|
(147 |
) |
|
|
(141 |
) |
|
|
(140 |
) |
|
|
(141 |
) |
|
|
(569 |
) |
|
Property NOI |
|
$ |
407 |
|
|
$ |
405 |
|
|
$ |
421 |
|
|
$ |
419 |
|
|
$ |
1,652 |
|
|
2015 |
|
|
|
|
|
|
|
|
|
|
|
|
|
|
|
|
|
|
|
|
|
Rental revenues |
|
$ |
325 |
|
|
$ |
358 |
|
|
$ |
418 |
|
|
$ |
435 |
|
|
$ |
1,536 |
|
|
Rental recoveries |
|
|
94 |
|
|
|
104 |
|
|
|
115 |
|
|
|
124 |
|
|
|
437 |
|
|
Rental expenses |
|
|
(127 |
) |
|
|
(126 |
) |
|
|
(140 |
) |
|
|
(151 |
) |
|
|
(544 |
) |
|
Property NOI |
|
$ |
292 |
|
|
$ |
336 |
|
|
$ |
393 |
|
|
$ |
408 |
|
|
$ |
1,429 |
|
|
|
|
Three Months Ended December 31, |
|
|||||||||
|
|
|
2016 |
|
|
2015 |
|
|
Percentage Change |
|
|||
|
Rental Revenues (1) (2) |
|
|
|
|
|
|
|
|
|
|
|
|
|
Consolidated: |
|
|
|
|
|
|
|
|
|
|
|
|
|
Rental revenues (per the quarterly information table above) |
|
$ |
436 |
|
|
$ |
435 |
|
|
|
|
|
|
Rental recoveries (per the quarterly information table above) |
|
|
124 |
|
|
|
124 |
|
|
|
|
|
|
Consolidated adjustments to derive same store results: |
|
|
|
|
|
|
|
|
|
|
|
|
|
Rental revenues and recoveries of properties not in the same store portfolio – properties developed, acquired and sold to third parties during the period and land subject to ground leases |
|
|
(168 |
) |
|
|
(177 |
) |
|
|
|
|
|
Effect of changes in foreign currency exchange rates and other |
|
|
(1 |
) |
|
|
- |
|
|
|
|
|
|
Unconsolidated co-investment ventures – rental revenues |
|
|
436 |
|
|
|
423 |
|
|
|
|
|
|
Same store portfolio – rental revenues (2) |
|
$ |
827 |
|
|
$ |
805 |
|
|
|
2.7 |
% |
|
Rental Expenses (1) (3) |
|
|
|
|
|
|
|
|
|
|
|
|
|
Consolidated: |
|
|
|
|
|
|
|
|
|
|
|
|
|
Rental expenses (per the quarterly information table above) |
|
$ |
141 |
|
|
$ |
151 |
|
|
|
|
|
|
Consolidated adjustments to derive same store results: |
|
|
|
|
|
|
|
|
|
|
|
|
|
Rental expenses of properties not in the same store portfolio – properties developed, acquired and sold to third parties during the period and land subject to ground leases |
|
|
(46 |
) |
|
|
(52 |
) |
|
|
|
|
|
Effect of changes in foreign currency exchange rates and other |
|
|
14 |
|
|
|
7 |
|
|
|
|
|
|
Unconsolidated co-investment ventures – rental expenses |
|
|
99 |
|
|
|
97 |
|
|
|
|
|
|
Same store portfolio – rental expenses (3) |
|
$ |
208 |
|
|
$ |
203 |
|
|
|
2.5 |
% |
|
NOI (1) |
|
|
|
|
|
|
|
|
|
|
|
|
|
Consolidated: |
|
|
|
|
|
|
|
|
|
|
|
|
|
Property NOI (per the quarterly information table above) |
|
$ |
419 |
|
|
$ |
408 |
|
|
|
|
|
|
Consolidated adjustments to derive same store results: |
|
|
|
|
|
|
|
|
|
|
|
|
|
Property NOI of properties not in the same store portfolio – properties developed, acquired and sold to third parties during the period and land subject to ground leases |
|
|
(122 |
) |
|
|
(125 |
) |
|
|
|
|
|
Effect of changes in foreign currency exchange rates and other |
|
|
(15 |
) |
|
|
(7 |
) |
|
|
|
|
|
Unconsolidated co-investment ventures – property NOI |
|
|
337 |
|
|
|
326 |
|
|
|
|
|
|
Same store portfolio – NOI |
|
$ |
619 |
|
|
$ |
602 |
|
|
|
2.8 |
% |
29
|
basis because of the changes in composition of the respective portfolios from period to period (e.g. the results of a contributed property are included in our consolidated results through the contribution date and in the results of the unconsolidated entities subsequent to the contribution date). |
|
(2) |
We exclude the net termination and renegotiation fees from our same store rental revenues to allow us to evaluate the growth or decline in each property’s rental revenues without regard to items that are not indicative of the property’s recurring operating performance. Net termination and renegotiation fees represent the gross fee negotiated to allow a customer to terminate or renegotiate their lease, offset by the write-off of the asset recorded due to the adjustment to straight-line rents over the lease term. The adjustments to remove these items are included in “effect of changes in foreign currency exchange rates and other” in this table. |
|
(3) |
Rental expenses include the direct operating expenses of the property such as property taxes, insurance and utilities. In addition, we include an allocation of the property management expenses for our direct-owned properties based on the property management services provided to each property (generally, based on a percentage of revenues). On consolidation, these amounts are eliminated and the actual costs of providing property management services are recognized as part of our consolidated rental expenses. These expenses fluctuate based on the level of properties included in the same store portfolio and any adjustment is included as “effect of changes in foreign currency exchange rates and other” in this table. |
Other Components of Income (Expense)
Earnings from Unconsolidated Entities, Net
We recognized net earnings from unconsolidated entities that are accounted for using the equity method of $206 million, $159 million and $134 million for the years ended December 31, 2016, 2015 and 2014, respectively. The earnings we recognize can be impacted by: (i) variances in revenues and expenses of each venture; (ii) the size and occupancy rate of the portfolio of properties owned by each venture; (iii) gains or losses from the dispositions of properties; (iv) our ownership interest in each venture; and (v) fluctuations in foreign currency exchange rates used to translate our share of net earnings to U.S. dollars.
See the discussion of our co-investment ventures above in the Strategic Capital segment discussion and in Note 5 to the Consolidated Financial Statements for a further breakdown of our share of net earnings recognized.
Interest Expense
The following table details our net interest expense for the year ended December 31 (dollars in millions):
|
|
|
2016 |
|
|
2015 |
|
|
2014 |
|
|||
|
Gross interest expense |
|
$ |
383 |
|
|
$ |
394 |
|
|
$ |
378 |
|
|
Amortization of premium, net and debt issuance costs |
|
|
(15 |
) |
|
|
(32 |
) |
|
|
(8 |
) |
|
Capitalized amounts |
|
|
(65 |
) |
|
|
(61 |
) |
|
|
(61 |
) |
|
Net interest expense |
|
$ |
303 |
|
|
$ |
301 |
|
|
$ |
309 |
|
|
Weighted average effective interest rate |
|
|
3.3 |
% |
|
|
3.3 |
% |
|
|
4.2 |
% |
Gross interest expense decreased in 2016, compared with 2015, principally from lower outstanding debt balances and borrowing costs during the periods. Our debt decreased by $1.0 billion from December 31, 2015, to December 31, 2016, primarily from the repayment of the senior term loan related to the KTR transaction with proceeds from contributions and dispositions. Gross interest expense increased in 2015, compared with 2014, due to higher debt driven by the KTR transaction, offset somewhat by a decrease in interest rates and fluctuations in foreign currency exchange rates. See Note 9 to the Consolidated Financial Statements for a further breakdown of gross interest expense, amortization and capitalized amounts included in net interest expense. See also the Liquidity and Capital Resources section for further discussion of our debt and borrowing costs.
Gains on Dispositions of Investments in Real Estate and Revaluation of Equity Investments upon Acquisition of a Controlling Interest, Net
Over the last three years, we have contributed properties, generally that we had developed, to our co-investment ventures in Europe, Japan and Mexico, as included in the table below. We recognize a gain to the extent of the third party ownership in the venture acquiring the property. In 2014, our contribution activity included the properties that we contributed to FIBRA Prologis upon its formation.
In addition, we have sold properties to third parties, generally from our operating portfolio in the U.S. These dispositions have supported our strategic objective of owning a portfolio of high-quality properties in the most active centers of commerce.
We utilize the proceeds from both contributions and dispositions to fund our capital investments.
30
The following table details our gains on dispositions of investments in real estate and revaluation of equity investments upon acquisition of a controlling interest, net for the year ended December 31 (in millions):
|
|
|
2016 |
|
|
2015 |
|
|
2014 |
|
|||
|
Contributions to unconsolidated co-investment ventures |
|
|
|
|
|
|
|
|
|
|
|
|
|
Number of properties |
|
|
35 |
|
|
|
31 |
|
|
|
126 |
|
|
Net gains on contributions |
|
$ |
267 |
|
|
$ |
149 |
|
|
$ |
188 |
|
|
Dispositions to third parties |
|
|
|
|
|
|
|
|
|
|
|
|
|
Number of properties |
|
|
172 |
|
|
|
136 |
|
|
|
145 |
|
|
Net gains on dispositions |
|
$ |
354 |
|
|
$ |
610 |
|
|
$ |
337 |
|
|
Total net gains on contributions and dispositions |
|
$ |
621 |
|
|
$ |
759 |
|
|
$ |
525 |
|
|
Gains on redemptions of investments in co-investment ventures |
|
|
136 |
|
|
|
- |
|
|
|
- |
|
|
Gains on revaluation of equity investments upon acquisition of a controlling interest, net (1) |
|
|
- |
|
|
|
- |
|
|
|
201 |
|
|
Total gains on dispositions of investments in real estate and revaluation of equity investments upon acquisition of a controlling interest, net |
|
$ |
757 |
|
|
$ |
759 |
|
|
$ |
726 |
|
|
(1) |
In 2014, we acquired the equity units from all but one partner in our co-investment venture NAIF, resulting in the acquisition of a controlling interest. This resulted in us gaining control over NAIF and recording a gain on the revaluation of our equity investment. See Note 3 to the Consolidated Financial Statements for further information on this transaction. |
See Notes 4 and 5 to the Consolidated Financial Statements for further information on the gains we recognized.
Foreign Currency and Derivative Gains (Losses), Net
The following table details our foreign currency and derivative gains (losses), net included in earnings for the year ended December 31 (in millions):
|
|
|
2016 |
|
|
2015 |
|
|
2014 |
|
|||
|
Realized foreign currency and derivative gains (losses): |
|
|
|
|
|
|
|
|
|
|
|
|
|
Gains on the settlement of unhedged derivative transactions |
|
$ |
3 |
|
|
$ |
15 |
|
|
$ |
1 |
|
|
Losses on the settlement of transactions with third parties |
|
|
(3 |
) |
|
|
(4 |
) |
|
|
2 |
|
|
Total realized foreign currency and derivative gains |
|
|
- |
|
|
|
11 |
|
|
|
3 |
|
|
|
|
|
|
|
|
|
|
|
|
|
|
|
|
Unrealized foreign currency and derivative gains (losses), net: |
|
|
|
|
|
|
|
|
|
|
|
|
|
Gains on the change in fair value of unhedged derivative transactions |
|
|
10 |
|
|
|
16 |
|
|
|
15 |
|
|
Losses on remeasurement of certain assets and liabilities (1) |
|
|
(2 |
) |
|
|
(20 |
) |
|
|
(8 |
) |
|
Gains (losses) on embedded derivative, including amortization (settled March 2015) |
|
|
- |
|
|
|
5 |
|
|
|
(28 |
) |
|
Total unrealized foreign currency and derivative gains (losses), net |
|
|
8 |
|
|
|
1 |
|
|
|
(21 |
) |
|
Total foreign currency and derivative gains (losses), net |
|
$ |
8 |
|
|
$ |
12 |
|
|
$ |
(18 |
) |
|
(1) |
These gains or losses were primarily related to the remeasurement of assets and liabilities that are denominated in currencies other than the functional currency of the entity, such as short-term intercompany loans between the U.S. parent and certain consolidated subsidiaries, debt and tax receivables and payables. |
See Note 2 to the Consolidated Financial Statements for more information about our foreign currency and derivative policies and Note 16 to the Consolidated Financial Statements for more information about our derivative transactions.
Gains (Losses) on Early Extinguishment of Debt, Net
We repurchased portions of several series of senior notes, senior exchangeable notes and secured mortgage debt that resulted in the recognition of a gain of $2 million in 2016 and losses of $86 million and $165 million in 2015 and 2014, respectively. As a result of these transactions, we reduced our effective interest rate and lengthened the maturities of our debt. See Note 9 to the Consolidated Financial Statements for more information regarding our debt repurchases.
Income Tax Expense (Benefit)
We recognize current income tax expense for income taxes incurred by our taxable REIT subsidiaries, state and local income taxes and taxes incurred in the foreign jurisdictions in which we operate. Our current income tax expense fluctuates from period to period based primarily on the timing of our taxable income. Deferred income tax expense (benefit) is generally a function of the period’s temporary differences and the utilization of net operating losses generated in prior years that had been previously recognized as deferred income tax assets in taxable subsidiaries operating in the U.S. or in foreign jurisdictions.
31
The following table summarizes our income tax expense (benefit) for the year ended December 31 (in millions):
|
|
|
2016 |
|
|
2015 |
|
|
2014 |
|
|||
|
Current income tax expense: |
|
|
|
|
|
|
|
|
|
|
|
|
|
Income tax expense |
|
$ |
36 |
|
|
$ |
24 |
|
|
$ |
16 |
|
|
Income tax expense on dispositions |
|
|
24 |
|
|
|
- |
|
|
|
15 |
|
|
Income tax expense on dispositions related to acquired tax liabilities |
|
|
- |
|
|
|
4 |
|
|
|
30 |
|
|
Total current income tax expense |
|
|
60 |
|
|
|
28 |
|
|
|
61 |
|
|
|
|
|
|
|
|
|
|
|
|
|
|
|
|
Deferred income tax expense (benefit): |
|
|
|
|
|
|
|
|
|
|
|
|
|
Income tax benefit |
|
|
(5 |
) |
|
|
(1 |
) |
|
|
(57 |
) |
|
Income tax benefit on dispositions related to acquired tax liabilities |
|
|
- |
|
|
|
(4 |
) |
|
|
(30 |
) |
|
Total deferred income tax benefit |
|
|
(5 |
) |
|
|
(5 |
) |
|
|
(87 |
) |
|
Total income tax expense (benefit) |
|
$ |
55 |
|
|
$ |
23 |
|
|
$ |
(26 |
) |
Our income taxes are discussed in more detail in Note 14 to the Consolidated Financial Statements.
Net Earnings Attributable to Noncontrolling Interests
This amount represents the third-party investors’ share of the earnings generated in consolidated entities in which we do not own 100% of the equity, reduced by the third party share of fees or promotes payable to us and earned during the period.
The following table summarizes net earnings attributable to noncontrolling interests for the year ended December 31 (in millions):
|
|
|
2016 |
|
|
2015 |
|
|
2014 |
|
|||
|
Prologis North American Industrial Fund |
|
$ |
23 |
|
|
$ |
4 |
|
|
$ |
3 |
|
|
Prologis U.S. Logistics Venture (1) |
|
|
18 |
|
|
|
38 |
|
|
|
7 |
|
|
Other consolidated entities (2) |
|
|
8 |
|
|
|
3 |
|
|
|
91 |
|
|
Prologis, L.P. net earnings attributable to noncontrolling interests |
|
|
49 |
|
|
|
45 |
|
|
|
101 |
|
|
Limited partners in Prologis, L.P. |
|
|
34 |
|
|
|
11 |
|
|
|
2 |
|
|
Prologis, Inc. net earnings attributable to noncontrolling interests |
|
$ |
83 |
|
|
$ |
56 |
|
|
$ |
103 |
|
|
(1) |
USLV completed the KTR transaction in May 2015; approximately seven months of operating activity were included in 2015, offset by third-party share of acquisition costs and an acquisition fee payable to us. |
|
(2) |
In 2014, we recognized net earnings attributable to noncontrolling interests in Prologis Mexico Fondo Logistico of $65 million because of the FIBRA Prologis transaction, primarily related to the third-party investors’ share of the gain on disposition and the net deferred income tax benefit. |
See Note 12 to the Consolidated Financial Statements for further information on our consolidated co-investment ventures.
Other Comprehensive Loss
During 2016, 2015 and 2014, we recorded net losses in our Statement of Comprehensive Income related to foreign currency translations of our foreign subsidiaries into U.S. dollars upon consolidation. These losses were principally due to the weakening of the Brazilian real, British pound sterling, euro and Japanese yen to the U.S. dollar.
During 2016, 2015 and 2014, we also recorded unrealized losses in our Statement of Comprehensive Income, related to the change in fair value of our cash flow hedges and our share of derivatives in our unconsolidated co-investment ventures.
See Note 2 to the Consolidated Financial Statements for more information about our foreign currency and derivative policies and Note 16 to the Consolidated Financial Statements for more information about our derivative transactions and other comprehensive losses.
Other Matters
On June 23, 2016, the U.K. passed a referendum to leave the European Union. Our key business driver remains intact, and we have not seen, nor do we anticipate, a material operational or financial impact. Our customers in the U.K. principally serve domestic consumers and we do not expect the decision to leave the European Union will materially change the consumption habits that drive our business. At December 31, 2016, our owned and managed U.K. operating portfolio was 99.5% leased and had a weighted average lease term of nine years with only 4.6% of the leases expiring in 2017. The U.K. portfolio contributes approximately 4% of our share of annual NOI through consolidated entities and co-investment ventures.
A majority of the properties we acquired were subjected to environmental reviews either by us or the previous owners. While some of these assessments have led to further investigation and sampling, none of the environmental assessments have revealed an
32
environmental liability that we believe would have a material adverse effect on our business, financial condition or results of operations. See Note 17 in the Consolidated Financial Statements for further information about environmental liabilities.
LIQUIDITY AND CAPITAL RESOURCES
Overview
We consider our ability to generate cash from operating activities, distributions from our co-investment ventures, dispositions of properties and from available financing sources to be adequate to meet our anticipated future development, acquisition, operating, debt service, dividend and distribution requirements.
Near-Term Principal Cash Sources and Uses
In addition to dividends to the common and preferred stockholders of Prologis and distributions to the holders of limited partnership units of the Operating Partnership and our partners in the consolidated co-investment ventures, we expect our primary cash needs will consist of the following:
|
• |
completion of the development and leasing of the properties in our consolidated development portfolio (at December 31, 2016, 89 properties in our development portfolio were 59.8% leased with a current investment of $1.4 billion and a TEI of $2.4 billion when completed and leased, leaving $1.0 billion remaining to be spent); |
|
• |
development of new properties for long-term investment, including the acquisition of land in certain markets; |
|
• |
capital expenditures and leasing costs on properties in our operating portfolio; |
|
• |
repayment of debt and scheduled principal payments of $622 million in 2017; |
|
• |
additional investments in current unconsolidated entities or new investments in future unconsolidated co-investment ventures; |
|
• |
acquisition of operating properties or portfolios of operating properties (depending on market and other conditions) for direct, long-term investment in our consolidated portfolio (this might include acquisitions from our co-investment ventures); and |
|
• |
repurchase of our outstanding debt or equity securities (depending on prevailing market conditions, our liquidity requirements, contractual restrictions and other factors) through cash purchases, open-market purchases, privately negotiated transactions, tender offers or otherwise. |
We expect to fund our cash needs principally from the following sources (subject to market conditions):
|
• |
available unrestricted cash balances ($807 million at December 31, 2016); |
|
• |
property operations; |
|
• |
fees earned for services performed on behalf of the co-investment ventures, including promotes; |
|
• |
distributions received from the co-investment ventures; |
|
• |
proceeds from the disposition of properties, land parcels or other investments to third parties; |
|
• |
proceeds from the contributions of properties to current or future co-investment ventures; |
|
• |
proceeds from the sale of a portion of our investments in co-investment ventures; |
|
• |
borrowing capacity under our current credit facility arrangements discussed in the following section, other facilities or borrowing arrangements ($3.2 billion available at December 31, 2016); and |
|
• |
proceeds from the issuance of debt. |
We may also generate proceeds from the issuance of equity securities, subject to market conditions.
33
The following table summarizes information about our debt at December 31 (dollars in millions):
|
|
|
2016 |
|
|
2015 |
|
||
|
Debt outstanding |
|
$ |
10,608 |
|
|
$ |
11,627 |
|
|
Weighted average interest rate |
|
|
3.2 |
% |
|
|
3.2 |
% |
|
Weighted average maturity in months |
|
60 |
|
|
67 |
|
||
In the first quarter of 2016, we repaid the $400 million remaining balance on the senior term loan that was used to fund the KTR transaction with proceeds generated from the contributions of development properties to our co-investment ventures and proceeds generated from the disposition of certain nonstrategic properties to third parties.
In March 2016, we entered into an unsecured term loan agreement under which we could draw in Japanese yen in an aggregate amount not to exceed ¥11.2 billion that was scheduled to mature in March 2017. In the first quarter of 2016, we borrowed ¥11.2 billion ($100 million) on this term loan.
In April 2016, we amended the Global Facility and increased our aggregate borrowing capacity to $3.0 billion
In August 2016, we entered into the Yen Term Loan under which we can draw in Japanese yen in an aggregate amount not to exceed ¥120.0 billion ($1.0 billion at December 31, 2016) bearing interest at yen LIBOR plus 0.65%, of which ¥50.0 billion ($427 million at December 31, 2016) matures in August 2022 and ¥70.0 billion ($598 million at December 31, 2016) matures in August 2023. We may increase the borrowings up to ¥200.0 billion ($1.7 billion at December 31, 2016), subject to obtaining additional lender commitments. In the third quarter of 2016, we borrowed on the Yen Term Loan and used the proceeds to repay the previously outstanding Japanese yen term loans entered into in 2014, 2015 and 2016. The Yen Term Loan was fully drawn at December 31, 2016.
At December 31, 2016, we had credit facilities with an aggregate borrowing capacity of $3.3 billion, of which $3.2 billion was available for borrowing.
At December 31, 2016, our credit ratings were A3 from Moody’s and A- from S&P, both with stable outlook. A securities rating is not a recommendation to buy, sell or hold securities and is subject to revision or withdrawal at any time by the rating organization.
At December 31, 2016, we were in compliance with all of our debt covenants. These covenants include customary financial covenants for total debt, encumbered debt and fixed charge coverage ratios.
See Note 9 to the Consolidated Financial Statements for further discussion on our debt.
Equity Commitments Related to Certain Co-Investment Ventures
Certain co-investment ventures have equity commitments from us and our venture partners. Our venture partners fulfill their equity commitment with cash. We may fulfill our equity commitment through contributions of properties or cash. See the Cash Flow Summary below for more information about our investment activity in our co-investment ventures. For more information on equity commitments for our unconsolidated co-investment ventures, see Note 5 to the Consolidated Financial Statements.
Cash Flow Summary
The following table summarizes our cash flow activity for the years ended December 31 (in millions):
|
|
|
2016 |
|
|
2015 |
|
|
2014 |
|
|||
|
Net cash provided by operating activities |
|
$ |
1,417 |
|
|
$ |
1,116 |
|
|
$ |
894 |
|
|
Net cash provided by (used in) investing activities |
|
$ |
1,252 |
|
|
$ |
(4,789 |
) |
|
$ |
(665 |
) |
|
Net cash provided by (used in) financing activities |
|
$ |
(2,125 |
) |
|
$ |
3,596 |
|
|
$ |
(351 |
) |
Cash Provided by Operating Activities
Cash provided by operating activities, exclusive of changes in receivables and payables, is impacted by the following significant activity:
|
• |
Real estate operations. We receive the majority of our operating cash through net revenues of our Real Estate Operations segment. See our Results of Operations section above for further explanation of our Real Estate Operations segment. The revenues from this segment include noncash adjustments for straight-lined rent and amortization of above and below market leases of $94 million, $60 million and $14 million for 2016, 2015 and 2014, respectively. |
|
• |
Strategic capital. We also generate operating cash through our Strategic Capital segment by providing management services to our unconsolidated co-investment ventures, including promotes. See our Strategic Capital Results of Operations section above for the key drivers of our strategic capital revenues and expenses. Included in the cash provided by operating activities for 2016 is $30 million of cash received from promotes, which represented the third-party share and was accrued as strategic capital revenues for the year ended December 31, 2015. |
34
|
• |
G&A expenses. We incurred $222 million, $217 million and $229 million of G&A costs in 2016, 2015 and 2014, respectively. |
|
• |
Distributions from unconsolidated entities. In 2016, we adopted an accounting standard update that clarifies the classification methodology within the statement of cash flows for distributions received from equity method investments. We elected the nature of distributions approach, in which cash flows generated from the operations of an unconsolidated entity are classified as a return on investment (cash inflow from operating activities) and cash flows that are generated from property sales, debt refinancing or redemption of ownership interests are classified as a return of investment (cash inflow from investing activities). |
Following our adoption of this standard, we recognized $287 million, $285 million and $295 million of distributions from our unconsolidated entities in Net Cash Provided by Operating Activities in 2016, 2015 and 2014, respectively. Included in 2016 are distributions of $27 million that represented our share of promotes earned in 2015. For the years ended December 31, 2015 and 2014, we reclassified $141 million and $177 million of distributions from our unconsolidated entities into Net Cash Provided by Operating Activities that were previously reported as Net Cash Provided by (Used in) Investing Activities. See Note 2 to the Consolidated Financial Statements for more detail on this adoption.
|
• |
Equity-based compensation awards. We record equity-based compensation expenses in Rental Expenses in the Real Estate Operations segment, Strategic Capital Expenses in the Strategic Capital segment and G&A expenses. The total amounts expensed were $60 million, $54 million and $57 million in 2016, 2015 and 2014, respectively. |
|
• |
Cash paid for interest and income taxes. We paid combined amounts for interest and income taxes of $352 million, $370 million and $364 million in 2016, 2015 and 2014, respectively. See Note 9 and Note 14 to the Consolidated Financial Statements for further information on this activity. |
Cash Provided by (Used in) Investing Activities
|
• |
Real estate development. We invested $1.6 billion, $1.3 billion and $1.1 billion during 2016, 2015 and 2014, respectively, in real estate development and leasing costs for first generation leases. We have 60 properties under development and 29 properties that were completed but not stabilized at December 31, 2016, and we expect to continue to develop new properties as the opportunities arise. |
|
• |
Real estate acquisitions. In 2016, we acquired total real estate of $459 million, which included 776 acres of land and nine operating properties. In 2015, we acquired total real estate of $890 million, which included 690 acres of land and 52 operating properties, excluding the KTR transaction. In 2014, we acquired 1,040 acres of land and eight operating properties for a combined total of $612 million. |
|
• |
KTR transaction, net of cash received. In 2015, we acquired the real estate assets of KTR for a net cash purchase price of $4.8 billion through our consolidated co-investment venture USLV. See Note 3 to the Consolidated Financial Statements for more detail on the transaction. |
|
• |
Capital expenditures. We invested $268 million, $238 million and $213 million in our operating properties during 2016, 2015 and 2014, respectively, which included recurring capital expenditures, tenant improvements and leasing commissions on existing operating properties that were previously leased. |
|
• |
Proceeds from contributions and dispositions. We generated cash from contributions and dispositions of real estate properties of $2.8 billion, $2.8 billion and $2.3 billion in 2016, 2015 and 2014, respectively. See Note 4 to the Consolidated Financial Statements for more detail about our contributions and dispositions. |
35
|
|
|
|
2016 |
|
|
2015 |
|
|
2014 |
|
|||
|
|
Other Americas |
|
|
|
|
|
|
|
|
|
|
|
|
|
|
Prologis Brazil Logistics Partners Fund I and related joint ventures |
|
$ |
34 |
|
|
$ |
57 |
|
|
$ |
71 |
|
|
|
Europe |
|
|
|
|
|
|
|
|
|
|
|
|
|
|
Prologis European Logistics Partners Sàrl |
|
|
125 |
|
|
|
222 |
|
|
|
478 |
|
|
|
Prologis European Properties Fund II |
|
|
6 |
|
|
|
17 |
|
|
|
53 |
|
|
|
Prologis Targeted Europe Logistics Fund |
|
|
- |
|
|
|
91 |
|
|
|
73 |
|
|
|
Asia |
|
|
|
|
|
|
|
|
|
|
|
|
|
|
Nippon Prologis REIT |
|
|
53 |
|
|
|
- |
|
|
|
57 |
|
|
|
Prologis China Logistics Venture |
|
|
10 |
|
|
|
56 |
|
|
|
14 |
|
|
|
Remaining unconsolidated co-investment ventures |
|
|
- |
|
|
|
3 |
|
|
|
4 |
|
|
|
Total co-investment ventures |
|
|
228 |
|
|
|
446 |
|
|
|
750 |
|
|
|
Other unconsolidated joint ventures |
|
|
38 |
|
|
|
28 |
|
|
|
6 |
|
|
|
Total |
|
$ |
266 |
|
|
$ |
474 |
|
|
$ |
756 |
|
See Note 5 to the Consolidated Financial Statements for more detail on our unconsolidated co-investment ventures.
|
• |
Purchase of a controlling interest. We paid net cash of $590 million to acquire a controlling interest in NAIF in 2014. |
|
• |
Return of investment. As discussed above, we adopted an accounting standard update in 2016 that clarifies the classification methodology within the statement of cash flows for distributions received from equity method investments. As a result, distributions generated from activities outside the operations of our unconsolidated entities, such as property sales, debt refinancing or redemptions of ownership interests, are reflected in Net Cash Provided by (Used in) Investing Activities. We received distributions from unconsolidated co-investment ventures and other ventures as a return of investment of $777 million, $29 million and $84 million during 2016, 2015 and 2014, respectively. Included in this amount for 2016 is $611 million from the sale of a portion of our investments, and the remaining amount was from property dispositions within our unconsolidated co-investment entities. For the years ended December 31, 2015 and 2014, we reclassified $141 million and $177 million, respectively, of distributions from our unconsolidated entities that were previously reported as Net Cash Provided by (Used in) Investing Activities into Net Cash Provided by Operating Activities. |
|
• |
Proceeds from repayment of notes receivable backed by real estate. In 2016, we received $203 million for the payment in full of notes receivable received in connection with dispositions of real estate to third parties in 2015. In 2014, we received $188 million for the payment in full of the notes receivable that originated in 2010 through the sale of a portfolio of properties. See Note 7 to the Consolidated Financial Statements for further information about notes receivable. |
|
• |
Settlement of net investment hedges. We received net proceeds of $80 million, $128 million and $13 million from the settlement of net investment hedges during 2016, 2015 and 2014, respectively. See Note 16 to the Consolidated Financial Statements for further information on our derivative activity. |
Cash Provided by (Used in) Financing Activities
|
• |
Proceeds from issuance of common stock. |
|
|
o |
We generated net proceeds from the issuance of common stock under our incentive plans, primarily from the exercise of stock options, of $40 million, $18 million and $26 million in 2016, 2015 and 2014, respectively. |
|
|
o |
We generated net proceeds of $72 million and $140 million from the issuance of 2 million shares and 3 million shares of common stock under our at-the-market program during 2015 and 2014, respectively. |
|
|
o |
Norges Bank Investment Management exercised a warrant (that we issued in connection with the formation of PELP) for $214 million in exchange for 6 million shares of Prologis common stock in 2014. |
|
• |
Dividends paid on common and preferred stock. We paid dividends of $893 million, $805 million and $672 million to our common and preferred stockholders during 2016, 2015 and 2014, respectively. |
|
• |
Repurchase of preferred stock and units. We paid $28 million to repurchase shares of series Q preferred stock in 2014. |
|
• |
Noncontrolling interests contributions. Our partner in USLV made contributions in 2015 of $2.4 billion, primarily for the KTR transaction, and $446 million in 2014 related to the formation of the venture. |
36
|
• |
Tax paid for shares withheld. In 2016, we adopted an accounting standard update that clarifies the classification methodology within the statement of cash flows for taxes paid to a tax authority by us when we withhold shares to cover employee withholding tax payments for certain stock compensation plans. As a result of the adoption, we reclassified payments of $12 million and $13 million from Net Cash Provided by Operating Activities to Net Cash Provided by (Used in) Financing Activities for the years ended December 31, 2015 and 2014, respectively. |
|
• |
Net borrowings on credit facilities. We generated net proceeds of $33 million from our credit facilities in 2016. We made net payments of $8 million and $717 million in 2015 and 2014 respectively, on our credit facilities. |
|
• |
Repurchase and payments of debt. During 2016, we made payments of $1.6 billion on our outstanding term loans, $233 million on regularly scheduled debt principal payments and payments at maturity and repurchased and extinguished secured mortgage debt of $461 million. During 2015, we made payments of $1.0 billion on our outstanding term loans, $128 million on regularly scheduled debt principal payments and payments at maturity and repurchased and extinguished secured mortgage debt of $2.0 billion. During 2014, we made payments of $2.2 billion on our previous term loan, $102 million on regularly scheduled debt principal payments and payments at maturity and repurchased and extinguished senior notes and secured mortgage debt of $1.9 billion. |
|
• |
Proceeds from issuance of debt. In 2016, we issued $973 million of term loans and $397 million of secured mortgage debt and used the net proceeds for general corporate purposes. In 2015, we issued $1.5 billion of senior notes, $565 million of secured mortgage debt and $3.1 billion of term loans and used the net proceeds to fund our share of the purchase price for the KTR transaction, repurchased and redeemed senior notes and for general corporate purposes. In 2014, we issued €1.8 billion ($2.4 billion) of senior notes, $2.3 billion of term loans and $71 million of secured debt. See Note 9 to the Consolidated Financial Statements for more detail on debt. |
OFF-BALANCE SHEET ARRANGEMENTS
Unconsolidated Co-Investment Venture Debt
We had investments in and advances to our unconsolidated co-investment ventures, at December 31, 2016, of $4.1 billion. These ventures had total third-party debt of $6.5 billion at December 31, 2016. This debt is primarily secured, is non-recourse to Prologis or the other investors in the co-investment ventures, matures and bears interest as follows (dollars in millions):
|
|
|
|
|
|
|
|
|
|
|
|
|
|
|
|
|
|
|
|
|
|
|
|
|
|
Weighted |
|
|
Gross |
|
|
|
|
|
||
|
|
|
|
|
|
|
|
|
|
|
|
|
|
There- |
|
|
Disc/ |
|
|
|
|
|
|
Average |
|
|
Book |
|
|
Ownership |
|
|||||
|
|
2017 |
|
|
2018 |
|
|
2019 |
|
|
after |
|
|
Prem |
|
|
Total |
|
|
Interest Rate |
|
|
Value |
|
|
% |
|
|||||||||
|
Prologis Targeted U.S. Logistics Fund |
$ |
19 |
|
|
$ |
449 |
|
|
$ |
14 |
|
|
$ |
930 |
|
|
$ |
2 |
|
|
$ |
1,414 |
|
|
|
4.4% |
|
|
$ |
4,704 |
|
|
|
14.9% |
|
|
FIBRA Prologis |
|
217 |
|
|
|
73 |
|
|
|
84 |
|
|
|
363 |
|
|
|
2 |
|
|
|
739 |
|
|
|
5.0% |
|
|
|
1,942 |
|
|
|
45.9% |
|
|
Prologis European Properties Fund II |
|
50 |
|
|
|
317 |
|
|
|
166 |
|
|
|
1,253 |
|
|
|
(11 |
) |
|
|
1,775 |
|
|
|
3.1% |
|
|
|
4,881 |
|
|
|
31.2% |
|
|
Prologis Targeted Europe Logistics Fund |
|
5 |
|
|
|
77 |
|
|
|
233 |
|
|
|
361 |
|
|
|
(5 |
) |
|
|
671 |
|
|
|
2.2% |
|
|
|
2,458 |
|
|
|
23.5% |
|
|
Nippon Prologis REIT |
|
77 |
|
|
|
254 |
|
|
|
231 |
|
|
|
1,063 |
|
|
|
(9 |
) |
|
|
1,616 |
|
|
|
0.9% |
|
|
|
4,101 |
|
|
|
15.1% |
|
|
Prologis China Logistics Venture |
|
- |
|
|
|
111 |
|
|
|
180 |
|
|
|
46 |
|
|
|
(6 |
) |
|
|
331 |
|
|
|
4.5% |
|
|
|
559 |
|
|
|
15.0% |
|
|
Totals |
$ |
368 |
|
|
$ |
1,281 |
|
|
$ |
908 |
|
|
$ |
4,016 |
|
|
$ |
(27 |
) |
|
$ |
6,546 |
|
|
|
|
|
|
$ |
18,645 |
|
|
|
|
|
|
|
|
|
|
|
|
|
|
|
|
|
|
|
|
|
|
|
|
|
|
|
|
|
|
|
|
|
|
|
|
|
|
|
|
|
|
At December 31, 2016, we did not guarantee any third-party debt of the co-investment ventures. In our role as the manager or sponsor, we work with the co-investment ventures to refinance their maturing debt. There can be no assurance that the co-investment ventures will be able to refinance any maturing indebtedness on terms as favorable as the maturing debt, or at all. If the ventures are unable to refinance the maturing indebtedness with newly issued debt, they may be able to obtain funds by voluntary capital contributions from us and our partners or by selling assets. Certain of our ventures also have credit facilities, or unencumbered properties, both of which may be used to obtain funds.
37
Long-Term Contractual Obligations
The following table summarizes our long-term contractual obligations at December 31, 2016 (in millions):
|
|
Payments Due by Period |
|
|||||||||||||||||
|
|
Less than 1 Year |
|
|
1 to 3 Years |
|
|
3 to 5 Years |
|
|
More than 5 Years |
|
|
Total |
|
|||||
|
Debt obligations, other than credit facilities |
$ |
622 |
|
|
$ |
1,812 |
|
|
$ |
2,641 |
|
|
$ |
5,523 |
|
|
$ |
10,598 |
|
|
Interest on debt obligations, other than credit facilities |
|
340 |
|
|
|
562 |
|
|
|
403 |
|
|
|
373 |
|
|
|
1,678 |
|
|
Unfunded commitments on the development portfolio (1) |
|
854 |
|
|
|
99 |
|
|
|
- |
|
|
|
- |
|
|
|
953 |
|
|
Operating lease payments |
|
31 |
|
|
|
62 |
|
|
|
52 |
|
|
|
333 |
|
|
|
478 |
|
|
Totals |
$ |
1,847 |
|
|
$ |
2,535 |
|
|
$ |
3,096 |
|
|
$ |
6,229 |
|
|
$ |
13,707 |
|
|
(1) |
We had properties in our consolidated development portfolio (completed and under development) at December 31, 2016, with a TEI of $2.4 billion. The unfunded commitments presented include not only those costs that we are obligated to fund under construction contracts, but all costs necessary to place the property into service, including the estimated costs of tenant improvements, marketing and leasing costs that we expect to incur as the property is leased. |
Distribution and Dividend Requirements
Our dividend policy on our common stock is to distribute a percentage of our cash flow to ensure that we will meet the dividend requirements of the Internal Revenue Code, relative to maintaining our REIT status, while still allowing us to retain cash to meet other needs such as capital improvements and other investment activities.
In 2016, we paid quarterly cash dividends of $0.42 per common share. In 2015, we paid a quarterly cash dividend of $0.36 for the first two quarters and $0.40 per common share for the last two quarters. Our future common stock dividends, if and as declared, may vary and will be determined by the Board upon the circumstances prevailing at the time, including our financial condition, operating results and REIT distribution requirements, and may be adjusted at the discretion of the Board during the year.
In the fourth quarter of 2015, we issued a new class of common limited partnership units in the Operating Partnership that are entitled to a quarterly distribution equal to $0.64665 per unit so long as the common units receive a quarterly distribution of at least $0.40 per unit. See Note 11 in the Consolidated Financial Statements for more information on this new partnership unit class. We paid a distribution of $0.64665 in December 2016 and in December 2015 related to this new partnership unit class. We make distributions to the common limited partnership units outstanding at the same per unit amount as our common stock dividend.
At December 31, 2016, we had 1.6 million shares of one series of preferred stock outstanding – the “Series Q preferred stock,” with a liquidation preference of $50 per share. The annual dividend rate is 8.54% per share and dividends are payable quarterly in arrears. Pursuant to the terms of our preferred stock, we are restricted from declaring or paying any dividend with respect to our common stock unless and until all cumulative dividends with respect to the preferred stock have been paid and sufficient funds have been set aside for dividends that have been declared for the relevant dividend period with respect to the preferred stock.
Other Commitments
On a continuing basis, we are engaged in various stages of negotiations for the acquisition or disposition of individual properties or portfolios of properties.
A critical accounting policy is one that is both important to the portrayal of an entity’s financial condition and results of operations and requires judgment on the part of management. Generally, the judgment requires management to make estimates and assumptions about the effect of matters that are inherently uncertain. Estimates are prepared using management’s best judgment, after considering past and current economic conditions and expectations for the future. Changes in estimates could affect our financial position and specific items in our results of operations that are used by stockholders, potential investors, industry analysts and lenders in their evaluation of our performance. Of the accounting policies discussed in Note 2 to the Consolidated Financial Statements, those presented below have been identified by us as critical accounting policies.
Consolidation
We consolidate all entities that are wholly owned and those in which we own less than 100% of the equity but control, as well as any variable interest entities in which we are the primary beneficiary. We evaluate our ability to control an entity including whether the entity is a variable interest entity and whether we are the primary beneficiary. We consider the substantive terms of the arrangement to identify which enterprise has the power to direct the activities of the entity that most significantly impacts the entity’s economic performance and the obligation to absorb losses of the entity or the right to receive benefits from the entity. Investments in entities that we do not control but over which we have the ability to exercise significant influence over operating and financial policies are accounted
38
for using the equity method. Our ability to correctly assess our influence or control over an entity affects the presentation of these investments in the Consolidated Financial Statements.
Business Combinations
Upon acquisition of real estate that constitutes a business, which includes acquiring a controlling interest in an entity previously accounted for using the equity method of accounting, we allocate the purchase price to the various components of the acquisition based on the fair value of each component. The components typically include buildings, land, intangible assets related to the acquired leases, debt, deferred tax liabilities and other assumed assets and liabilities. In an acquisition of multiple properties, we allocate the purchase price among the properties. The allocation of the purchase price is based on our assessment of estimated fair value and often is based on the expected future cash flows of the property and various characteristics of the markets where the property is located. The fair value may also include an enterprise value premium that we estimate a third party would be willing to pay for a portfolio of properties. In the case of an acquisition of a controlling interest in an entity previously accounted for under the equity method of accounting, this allocation may result in a gain or a loss. The initial allocation of the purchase price is based on management’s preliminary assessment, which may differ when final information becomes available. Subsequent adjustments made to the initial purchase price allocation are made within the allocation period, not to exceed one year. The use of different assumptions in the allocation of the purchase price of the acquired properties and liabilities assumed could affect the timing of recognition of the related revenues and expenses.
Revenue Recognition – Gains (Losses) on Dispositions of Investments in Real Estate and Strategic Capital Revenues
We recognize gains from the contributions and sales of real estate assets, generally at the time the title is transferred, consideration is received and we no longer have substantial continuing involvement with the real estate sold. In many of our transactions, an entity in which we have an equity investment will acquire a real estate asset from us. We make judgments based on the specific terms of each transaction as to the amount of the total profit from the transaction that we recognize given our continuing ownership interest and our level of future involvement with the entity that acquires the assets. In addition, we make judgments regarding recognition in earnings of certain fees and incentives earned for services provided to these entities based on when they are earned, fixed and determinable.
Derivative Financial Instruments
Derivative financial instruments can be designated as fair value hedges, cash flow hedges or hedges of net investments in foreign operations. We do not use derivatives for trading or speculative purposes. Accounting for derivatives as hedges requires that at inception, and over the term of the instruments, the hedged item and derivative qualify for hedge accounting. The rules and interpretations for derivatives are complex. Failure to apply this guidance correctly may result in all changes in fair value of the hedged derivative being recognized in earnings. We assess both at inception, and at least quarterly thereafter, whether the derivatives used in hedging transactions are effective at offsetting changes in either the fair values or cash flows of the related underlying exposures. Any ineffective portion of a derivative financial instrument's change in fair value is immediately recognized in earnings. Derivatives not designated as hedges are used to manage our exposure to foreign currency fluctuations and variable interest rates but do not meet the strict hedge accounting requirements. The rules and interpretations for derivatives are complex. Failure to apply this guidance correctly may result in all changes in fair value of the hedged derivative being recognized in earnings. See Notes 2 and 16 to the Consolidated Financial Statements for additional information about our derivative financial instrument policy and our derivative financial instruments.
Income Taxes
Significant management judgment is required to estimate our income tax liability for each taxable entity, the liability associated with open tax years that are under review, our REIT taxable income and our compliance with REIT requirements. Our estimates are based on interpretation of tax laws. We estimate our actual current income tax due and assess temporary differences resulting from differing treatment of items for book and tax purposes resulting in the recognition of deferred income tax assets and liabilities. These estimates may have an impact on the income tax expense recognized. Adjustments may be required by a change in assessment of our deferred income tax assets and liabilities; changes in assessments of the recognition of income tax benefits for certain nonroutine transactions; changes due to audit adjustments by federal, international and state tax authorities; our inability to qualify as a REIT; the potential for built-in gain recognition; changes in the assessment of properties to be contributed to taxable REIT subsidiaries and changes in tax laws. Adjustments required in any given period are included within income tax expense. We recognize the tax benefit from an uncertain tax position only if it is more likely than not that the tax position will be sustained on examination by taxing authorities.
Recoverability of Real Estate Assets
We assess the carrying values of our respective long-lived assets whenever events or changes in circumstances indicate that the carrying amounts of these assets may not be fully recoverable.
Recoverability of real estate assets is measured by comparison of the carrying amount of the asset to the estimated future undiscounted cash flows. To review our real estate assets for recoverability, we consider current market conditions, as well as our intent with respect to holding or disposing of the asset. Our intent with regard to the underlying assets might change as market conditions change. Fair value is determined through various valuation techniques, including discounted cash flow models, applying a capitalization rate to estimated NOI of a property, quoted market values and third-party appraisals, where considered necessary. The use of projected future cash flows is based on assumptions that are consistent with our estimates of future expectations and the
39
strategic plan we use to manage our underlying business. If our analysis indicates that the carrying value of a property that we expect to hold is not recoverable on an undiscounted cash flow basis, we recognize an impairment charge for the amount by which the carrying value exceeds the current estimated fair value of the property. Assumptions and estimates used in the recoverability analyses for future cash flows, including market rents, discount rates and capitalization rates are complex and subjective. Changes in economic and operating conditions or our intent with regard to our investment that occurs subsequent to our impairment analyses could impact these assumptions and result in future impairment.
Capitalization of Costs
During the land development and construction periods (including renovating and rehabilitating), we capitalize interest, insurance, real estate taxes and certain general and administrative costs of the personnel performing development, renovations and rehabilitation if such costs are incremental and identifiable to a specific activity to get the asset ready for its intended use. The ability to specifically identify internal personnel costs associated with development and the determination of when a development project is substantially complete and capitalization must cease, requires a high degree of judgment and failure to accurately assess these costs and timing could result in the misstatement of asset values and expenses. Capitalized costs are included in the investment basis of real estate assets.
See Note 2 to the Consolidated Financial Statements.
FUNDS FROM OPERATIONS ATTRIBUTABLE TO COMMON STOCKHOLDERS/UNITHOLDERS (“FFO”)
FFO is a non-GAAP financial measure that is commonly used in the real estate industry. The most directly comparable GAAP measure to FFO is net earnings.
The National Association of Real Estate Investment Trusts (“NAREIT”) defines FFO as earnings computed under GAAP to exclude historical cost depreciation and gains and losses from the sales, along with impairment charges, of previously depreciated properties. We also consider the gains on revaluation of equity investments upon acquisition of a controlling interest and the gain recognized from a partial sale of our investment to be similar as a gain from the sale of previously depreciated properties under the NAREIT definition of FFO. We exclude similar adjustments from our unconsolidated entities and the third parties’ share of our consolidated ventures.
Our FFO Measures
Our FFO measures begin with NAREIT’s definition and we make certain adjustments to reflect our business and the way that management plans and executes our business strategy. While not infrequent or unusual, the additional items we adjust for in calculating FFO, as modified by Prologis and Core FFO, both as defined below, are subject to significant fluctuations from period to period. Although these items may have a material impact on our operations and are reflected in our financial statements, the removal of the effects of these items allows us to better understand the core operating performance of our properties over the long term. These items have both positive and negative short-term effects on our results of operations in inconsistent and unpredictable directions that are not relevant to our long-term outlook.
We calculate our FFO measures based on our proportionate ownership share of both our unconsolidated and consolidated ventures. We reflect our share of our FFO measures for unconsolidated ventures by applying our average ownership percentage for the period to the applicable reconciling items on an entity by entity basis. We reflect our share for consolidated ventures in which we do not own 100% of the equity by adjusting our FFO measures to remove the noncontrolling interests share of the applicable reconciling items based on our average ownership percentage for the applicable periods.
These FFO measures are used by management as supplemental financial measures of operating performance and we believe that it is important that stockholders, potential investors and financial analysts understand the measures management uses. We do not use our FFO measures as, nor should they be considered to be, alternatives to net earnings computed under GAAP, as indicators of our operating performance, as alternatives to cash from operating activities computed under GAAP or as indicators of our ability to fund our cash needs.
We analyze our operating performance primarily by the rental revenues of our real estate and the revenues from our strategic capital business, net of operating, administrative and financing expenses. This income stream is not directly impacted by fluctuations in the market value of our investments in real estate or debt securities.
FFO, as modified by Prologis attributable to common stockholders and unitholders (“FFO, as modified by Prologis”)
To arrive at FFO, as modified by Prologis, we adjust the NAREIT defined FFO measure to exclude:
|
• |
deferred income tax benefits and deferred income tax expenses recognized by our subsidiaries; |
|
• |
current income tax expense related to acquired tax liabilities that were recorded as deferred tax liabilities in an acquisition, to the extent the expense is offset with a deferred income tax benefit in earnings that is excluded from our defined FFO measure; |
40
|
• |
unhedged foreign currency exchange gains and losses resulting from debt transactions between us and our foreign consolidated subsidiaries and our foreign unconsolidated entities; |
|
• |
foreign currency exchange gains and losses from the remeasurement (based on current foreign currency exchange rates) of certain third party debt of our foreign consolidated subsidiaries and our foreign unconsolidated entities; and |
|
• |
mark-to-market adjustments associated with derivative financial instruments. |
We use FFO, as modified by Prologis, so that management, analysts and investors are able to evaluate our performance against other REITs that do not have similar operations or operations in jurisdictions outside the U.S.
Core FFO attributable to common stockholders and unitholders (“Core FFO”)
In addition to FFO, as modified by Prologis, we also use Core FFO. To arrive at Core FFO, we adjust FFO, as modified by Prologis, to exclude the following recurring and nonrecurring items that we recognized directly in FFO, as modified by Prologis:
|
• |
gains or losses from contribution or sale of land or development properties that were developed with the intent to contribute or sell; |
|
• |
income tax expense related to the sale of investments in real estate and third-party acquisition costs related to the acquisition of real estate; |
|
• |
impairment charges recognized related to our investments in real estate generally as a result of our change in intent to contribute or sell these properties; |
|
• |
gains or losses from the early extinguishment of debt and redemption and repurchase of preferred stock; and |
|
• |
expenses related to natural disasters. |
We use Core FFO, including by segment and region, to: (i) assess our operating performance as compared to similar real estate companies and the industry in general, (ii) evaluate our performance and the performance of our properties in comparison with expected results and results of previous periods, relative to resource allocation decisions; (iii) evaluate the performance of our management; (iv) budget and forecast future results to assist in the allocation of resources; (v) provide guidance to the financial markets to understand our expected operating performance; and (v) evaluate how a specific potential investment will impact our future results.
Limitations on the use of our FFO measures
While we believe our modified FFO measures are important supplemental measures, neither NAREIT’s nor our measures of FFO should be used alone because they exclude significant economic components of net earnings computed under GAAP and are, therefore, limited as an analytical tool. Accordingly, these are only a few of the many measures we use when analyzing our business. Some of these limitations are:
|
• |
The current income tax expenses and acquisition costs that are excluded from our modified FFO measures represent the taxes and transaction costs that are payable. |
|
• |
Depreciation and amortization of real estate assets are economic costs that are excluded from FFO. FFO is limited, as it does not reflect the cash requirements that may be necessary for future replacements of the real estate assets. Furthermore, the amortization of capital expenditures and leasing costs necessary to maintain the operating performance of logistics facilities are not reflected in FFO. |
|
• |
Gains or losses from non-development property acquisitions and dispositions or impairment charges related to expected dispositions represent changes in value of the properties. By excluding these gains and losses, FFO does not capture realized changes in the value of acquired or disposed properties arising from changes in market conditions. |
|
• |
The deferred income tax benefits and expenses that are excluded from our modified FFO measures result from the creation of a deferred income tax asset or liability that may have to be settled at some future point. Our modified FFO measures do not currently reflect any income or expense that may result from such settlement. |
|
• |
The foreign currency exchange gains and losses that are excluded from our modified FFO measures are generally recognized based on movements in foreign currency exchange rates through a specific point in time. The ultimate settlement of our foreign currency-denominated net assets is indefinite as to timing and amount. Our FFO measures are limited in that they do not reflect the current period changes in these net assets that result from periodic foreign currency exchange rate movements. |
|
• |
The gains and losses on extinguishment of debt that we exclude from our Core FFO, may provide a benefit or cost to us as we may be settling our debt at less or more than our future obligation. |
|
• |
The natural disaster expenses that we exclude from Core FFO are costs that we have incurred. |
41
We compensate for these limitations by using our FFO measures only in conjunction with net earnings computed under GAAP when making our decisions. This information should be read with our complete Consolidated Financial Statements prepared under GAAP. To assist investors in compensating for these limitations, we reconcile our modified FFO measures to our net earnings computed under GAAP for years ended December 31 as follows (in millions).
|
|
|
2016 |
|
|
2015 |
|
|
2014 |
|
|||
|
FFO |
|
|
|
|
|
|
|
|
|
|
|
|
|
Reconciliation of net earnings to FFO measures: |
|
|
|
|
|
|
|
|
|
|
|
|
|
Net earnings attributable to common stockholders |
|
$ |
1,203 |
|
|
$ |
863 |
|
|
$ |
622 |
|
|
|
|
|
|
|
|
|
|
|
|
|
|
|
|
Add (deduct) NAREIT defined adjustments: |
|
|
|
|
|
|
|
|
|
|
|
|
|
Real estate related depreciation and amortization |
|
|
900 |
|
|
|
855 |
|
|
|
618 |
|
|
Gains on dispositions of investments in real estate properties, net |
|
|
(423 |
) |
|
|
(501 |
) |
|
|
(553 |
) |
|
Reconciling items related to noncontrolling interests |
|
|
(105 |
) |
|
|
(78 |
) |
|
|
48 |
|
|
Our share of reconciling items included in earnings from unconsolidated entities |
|
|
162 |
|
|
|
185 |
|
|
|
186 |
|
|
NAREIT defined FFO |
|
|
1,737 |
|
|
|
1,324 |
|
|
|
921 |
|
|
|
|
|
|
|
|
|
|
|
|
|
|
|
|
Add (deduct) our modified adjustments: |
|
|
|
|
|
|
|
|
|
|
|
|
|
Unrealized foreign currency and derivative losses (gains), net |
|
|
(8 |
) |
|
|
1 |
|
|
|
19 |
|
|
Deferred income tax benefit, net |
|
|
(5 |
) |
|
|
(5 |
) |
|
|
(87 |
) |
|
Current income tax expense related to acquired tax liabilities |
|
|
- |
|
|
|
4 |
|
|
|
30 |
|
|
Reconciling items related to noncontrolling interests |
|
|
1 |
|
|
|
(1 |
) |
|
|
- |
|
|
Our share of reconciling items included in earnings from unconsolidated entities |
|
|
(23 |
) |
|
|
(14 |
) |
|
|
5 |
|
|
FFO, as modified by Prologis |
|
|
1,702 |
|
|
|
1,309 |
|
|
|
888 |
|
|
|
|
|
|
|
|
|
|
|
|
|
|
|
|
Adjustments to arrive at Core FFO: |
|
|
|
|
|
|
|
|
|
|
|
|
|
Gains on dispositions of development properties and land, net |
|
|
(334 |
) |
|
|
(258 |
) |
|
|
(173 |
) |
|
Current income tax expense on dispositions |
|
|
24 |
|
|
|
- |
|
|
|
15 |
|
|
Acquisition expenses |
|
|
4 |
|
|
|
47 |
|
|
|
4 |
|
|
Losses (gains) on early extinguishment of debt and repurchase of preferred stock, net |
|
|
(2 |
) |
|
|
86 |
|
|
|
172 |
|
|
Reconciling items related to noncontrolling interests |
|
|
4 |
|
|
|
(11 |
) |
|
|
- |
|
|
Our share of reconciling items included in earnings from unconsolidated entities |
|
|
2 |
|
|
|
8 |
|
|
|
47 |
|
|
Core FFO |
|
$ |
1,400 |
|
|
$ |
1,181 |
|
|
$ |
953 |
|
ITEM 7A. Quantitative and Qualitative Disclosures About Market Risk
We are exposed to the impact of foreign exchange-related variability and earnings volatility on our foreign investments and interest rate changes. See our risk factors in Item 1A. Risk Factors, specifically: The depreciation in the value of the foreign currency in countries where we have a significant investment may adversely affect our results of operations and financial position and We may be unable to refinance our debt or our cash flow may be insufficient to make required debt payments. See also Notes 2 and 16 in the Consolidated Financial Statements in Item 8. Financial Statements and Supplementary Data for more information about our foreign operations and derivative financial instruments.
We monitor our market risk exposures using a sensitivity analysis. Our sensitivity analysis estimates the exposure to market risk sensitive instruments assuming a hypothetical 10% adverse change in exchange or interest rates at December 31, 2016. The results of the sensitivity analysis are summarized in the following sections. The sensitivity analysis is of limited predictive value. As a result, revenues and expenses, as well as our ultimate realized gains or losses with respect to interest rate and foreign currency exchange rate fluctuations will depend on the exposures that arise during a future period, hedging strategies at the time and the prevailing interest and foreign currency exchange rates.
Foreign Currency Risk
We are exposed to foreign exchange-related variability of investments and earnings from our foreign investments. Foreign currency market risk is the possibility that our financial results or financial position could be better or worse than planned because of changes in foreign currency exchange rates. At December 31, 2016, after consideration of our derivative and nonderivative financial instruments, we had net equity of approximately $1.6 billion denominated in a currency other than the U.S. dollar representing 7.9% of total net equity. Based on our sensitivity analysis, a 10% reduction in exchange rates would cause a reduction of $161 million to our net equity.
At December 31, 2016, we had foreign currency forward contracts, which were designated and qualify as net investment hedges, with an aggregate notional amount of $146 million to hedge a portion of our investments in Canada and the U.K. On the basis of our sensitivity analysis, a weakening of the U.S. dollar against the British pound sterling or Canadian dollar by 10% would result in a $15 million negative change in our cash flows on settlement. In addition, we also have British pound sterling, Canadian dollar, euro and Japanese yen forward and option contracts, which were not designated as hedges, and have an aggregate notional amount of $457 million to mitigate risk associated with the translation of the projected earnings of our subsidiaries in Canada, Europe and Japan. A
42
weakening of the U.S. dollar against these currencies by 10% would result in a $46 million negative change in our net income and cash flows on settlement.
Interest Rate Risk
We also are exposed to the impact of interest rate changes on future earnings and cash flows. At December 31, 2016, we had $1.8 billion of variable rate debt outstanding, of which $1.5 billion was outstanding on our term loans, $279 million was outstanding on secured mortgage debt and $35 million was outstanding on our credit facilities. At December 31, 2016, we had interest rate swap agreements to fix $276 million (CAD $372 million) of our Canadian term loan. During the year ended December 31, 2016, we had weighted average daily outstanding borrowings of $126 million on our variable rate credit facilities. On the basis of our sensitivity analysis, a 10% adverse change in interest rates based on our average outstanding variable rate debt balances not subject to interest rate swap agreements during the period would result in additional annual interest expense of $2 million, which equates to a change in interest rates of 11 basis points.
ITEM 8. Financial Statements and Supplementary Data
The Consolidated Balance Sheets of Prologis, Inc. and Prologis, L.P. at December 31, 2016, and 2015, the Consolidated Statements of Income of Prologis, Inc. and Prologis, L.P., the Consolidated Statements of Comprehensive Income of Prologis, Inc. and Prologis, L.P., the Consolidated Statements of Equity of Prologis, Inc., the Consolidated Statements of Capital of Prologis, L.P. and the Consolidated Statements Cash Flows of Prologis, Inc. and Prologis, L.P. for each of the years in the three-year period ended December 31, 2016, Notes to Consolidated Financial Statements and Schedule III — Real Estate and Accumulated Depreciation, together with the reports of KPMG LLP, independent registered public accounting firm, are included under Item 15 of this report and are incorporated herein by reference. Selected unaudited quarterly financial data are presented in Note 20 of the Consolidated Financial Statements.
ITEM 9. Changes in and Disagreements with Accountants on Accounting and Financial Disclosure
None.
ITEM 9A. Controls and Procedures
Controls and Procedures (The Parent)
Prologis, Inc. carried out an evaluation under the supervision and with the participation of management, including the Chief Executive Officer and Chief Financial Officer, of the effectiveness of the disclosure controls and procedures (as defined in Rule 13a-15(e) under the Securities and Exchange Act of 1934 (the “Exchange Act”)) at December 31, 2016. Based on this evaluation, the Chief Executive Officer and the Chief Financial Officer have concluded that the disclosure controls and procedures are effective to ensure that information required to be disclosed by us in reports that we file or submit under the Exchange Act is recorded, processed, summarized and reported within the time periods specified in the SEC rules and forms. Subsequent to December 31, 2016, there were no significant changes in the internal controls or in other factors that could significantly affect these controls, including any corrective actions with regard to significant deficiencies and material weaknesses.
Changes in Internal Control over Financial Reporting
There has been no change in our internal control over financial reporting (as such term is defined in Rules 13a-15(f) and 15(d)-15(f) under the Exchange Act) that occurred during the quarter ended December 31, 2016, that has materially affected, or is reasonably likely to materially affect, our internal control over financial reporting.
Management’s Annual Report on Internal Control over Financial Reporting
We are responsible for establishing and maintaining adequate internal control over financial reporting as defined in Rules 13a-15(f) and 15d-15(f) under the Exchange Act.
Under the supervision and with the participation of management, including the Chief Executive Officer and Chief Financial Officer, an evaluation of the effectiveness of the internal control over financial reporting was conducted at December 31, 2016, based on the criteria described in “Internal Control — Integrated Framework” (2013) issued by the Committee of Sponsoring Organizations of the Treadway Commission. Based on this assessment, management determined that, at December 31, 2016, the internal control over financial reporting was effective.
Our internal control over financial reporting at December 31, 2016, has been audited by KPMG LLP, an independent registered public accounting firm, as stated in their attestation report which is included herein.
Limitations of the Effectiveness of Controls
Management’s assessment included an evaluation of the design of the internal control over financial reporting and testing of the operational effectiveness of the internal control over financial reporting. The internal control over financial reporting is a process designed to provide reasonable assurance regarding the reliability of financial reporting and the preparation of financial statements for external purposes in accordance with GAAP. Because of its inherent limitations, internal control over financial reporting may not prevent
43
or detect misstatements. Also, projections of any evaluation of effectiveness to future periods are subject to the risk that controls may become inadequate because of changes in conditions, or that the degree of compliance with the policies or procedures may deteriorate.
Controls and Procedures (The Operating Partnership)
Prologis, L.P. carried out an evaluation under the supervision and with the participation of management, including the Chief Executive Officer and Chief Financial Officer, of the effectiveness of the disclosure controls and procedures (as defined in Rule 13a-15(e) under the Exchange Act) at December 31, 2016. Based on this evaluation, the Chief Executive Officer and the Chief Financial Officer have concluded that the disclosure controls and procedures are effective to ensure that information required to be disclosed by us in reports that we file or submit under the Exchange Act is recorded, processed, summarized and reported within the time periods specified in the SEC rules and forms. Subsequent to December 31, 2016, there were no significant changes in the internal controls or in other factors that could significantly affect these controls, including any corrective actions with regard to significant deficiencies and material weaknesses.
Changes in Internal Control over Financial Reporting
There has been no change in our internal control over financial reporting (as such term is defined in Rules 13a-15(f) and 15(d)-15(f) under the Exchange Act) that occurred during the quarter ended December 31, 2016, that has materially affected, or is reasonably likely to materially affect, our internal control over financial reporting.
Management’s Annual Report on Internal Control over Financial Reporting
We are responsible for establishing and maintaining adequate internal control over financial reporting as defined in Rules 13a-15(f) and 15d-15(f) under the Exchange Act.
Under the supervision and with the participation of management, including the Chief Executive Officer and Chief Financial Officer, an evaluation of the effectiveness of the internal control over financial reporting was conducted at December 31, 2016, based on the criteria described in “Internal Control — Integrated Framework” (2013) issued by the Committee of Sponsoring Organizations of the Treadway Commission. Based on this assessment, management determined that, at December 31, 2016, the internal control over financial reporting was effective.
Limitations of the Effectiveness of Controls
Management’s assessment included an evaluation of the design of the internal control over financial reporting and testing of the operational effectiveness of the internal control over financial reporting. The internal control over financial reporting is a process designed to provide reasonable assurance regarding the reliability of financial reporting and the preparation of financial statements for external purposes in accordance with GAAP. Because of its inherent limitations, internal control over financial reporting may not prevent or detect misstatements. Also, projections of any evaluation of effectiveness to future periods are subject to the risk that controls may become inadequate because of changes in conditions, or that the degree of compliance with the policies or procedures may deteriorate.
None.
ITEM 10. Directors, Executive Officers and Corporate Governance
The information required by this item is incorporated herein by reference to, including relevant sections in our 2017 Proxy Statement, under the captions entitled Board of Directors and Corporate Governance; Executive Officers; Executive Compensation; Director Compensation; Security Ownership; Equity Compensation Plans and Additional Information or will be provided in an amendment filed on Form 10-K/A.
ITEM 11. Executive Compensation
The information required by this item is incorporated herein by reference to the relevant sections in our 2017 Proxy Statement, under the captions entitled Board of Directors and Corporate Governance; Executive Officers; Executive Compensation and Director Compensation or will be provided in an amendment filed on Form 10-K/A.
ITEM 12. Security Ownership of Certain Beneficial Owners and Management and Related Stockholder Matters
The information required by this item is incorporated herein by reference to the relevant sections in our 2017 Proxy Statement, under the captions entitled Security Ownership and Equity Compensation Plans or will be provided in an amendment filed on Form 10-K/A.
44
ITEM 13. Certain Relationships and Related Transactions, and Director Independence
The information required by this item is incorporated herein by reference to the relevant sections in our 2017 Proxy Statement, under the caption entitled Board of Directors and Corporate Governance or will be provided in an amendment filed on Form 10-K/A.
ITEM 14. Principal Accounting Fees and Services
The information required by this item is incorporated herein by reference to the relevant sections in our 2017 Proxy Statement, under the caption entitled Audit Matters or will be provided in an amendment filed on Form 10-K/A.
ITEM 15. Exhibits, Financial Statements and Schedules
The following documents are filed as a part of this report:
(a) Financial Statements and Schedules:
1. Financial Statements:
See Index to the Consolidated Financial Statements and Schedule III on page 46 of this report, which is incorporated herein by reference.
2. Financial Statement Schedules:
Schedule III — Real Estate and Accumulated Depreciation
All other schedules have been omitted since the required information is presented in the Consolidated Financial Statements and the related Notes or is not applicable.
(b) Exhibits: The Exhibits required by Item 601 of Regulation S-K are listed in the Index to the Exhibits on pages 116 to 121 of this report, which is incorporated herein by reference.
(c) Financial Statements: See Index to the Consolidated Financial Statements and Schedule III on page 46 of this report, which is incorporated by reference.
Not Applicable.
45
INDEX TO THE CONSOLIDATED FINANCIAL STATEMENTS AND SCHEDULE III
|
|
Page Number |
|
Prologis, Inc. and Prologis, L.P.: |
|
|
47 |
|
|
Prologis, Inc.: |
|
|
50 |
|
|
51 |
|
|
52 |
|
|
53 |
|
|
54 |
|
|
Prologis, L.P.: |
|
|
55 |
|
|
56 |
|
|
57 |
|
|
58 |
|
|
59 |
|
|
Prologis, Inc. and Prologis, L.P.: |
|
|
60 |
|
|
60 |
|
|
60 |
|
|
68 |
|
|
69 |
|
|
71 |
|
|
74 |
|
|
75 |
|
|
75 |
|
|
76 |
|
|
80 |
|
|
81 |
|
|
82 |
|
|
83 |
|
|
86 |
|
|
87 |
|
|
89 |
|
|
92 |
|
|
93 |
|
|
95 |
|
|
96 |
|
|
98 |
|
|
100 |
46
REPORT OF INDEPENDENT REGISTERED PUBLIC ACCOUNTING FIRM
The Board of Directors and Stockholders
Prologis, Inc.:
We have audited the accompanying consolidated balance sheets of Prologis, Inc. and subsidiaries (the “Company”) as of December 31, 2016 and 2015, and the related consolidated statements of income, comprehensive income, equity, and cash flows for each of the years in the three-year period ended December 31, 2016. These consolidated financial statements are the responsibility of Prologis, Inc.’s management. Our responsibility is to express an opinion on these consolidated financial statements based on our audits.
We conducted our audits in accordance with the standards of the Public Company Accounting Oversight Board (United States). Those standards require that we plan and perform the audit to obtain reasonable assurance about whether the financial statements are free of material misstatement. An audit includes examining, on a test basis, evidence supporting the amounts and disclosures in the financial statements. An audit also includes assessing the accounting principles used and significant estimates made by management, as well as evaluating the overall financial statement presentation. We believe that our audits provide a reasonable basis for our opinion.
In our opinion, the consolidated financial statements referred to above present fairly, in all material respects, the financial position of Prologis, Inc. and subsidiaries as of December 31, 2016 and 2015, and the results of their operations and their cash flows for each of the years in the three-year period ended December 31, 2016, in conformity with U.S. generally accepted accounting principles.
As discussed in Note 2 to the consolidated financial statements, the Company changed its method of accounting for discontinued
operations as of January 1, 2014, on a prospective basis, due to the adoption of Accounting Standards Update 2014-08.
As discussed in Note 2 to the consolidated financial statements, during 2016 the Company has changed its method for classifying distributions received from equity method investees in the statements of cash flows for all periods presented, on a retrospective basis, due to the early adoption of Accounting Standards Update 2016-15.
We also have audited, in accordance with the standards of the Public Company Accounting Oversight Board (United States), Prologis, Inc.’s internal control over financial reporting as of December 31, 2016, based on criteria established in Internal Control — Integrated Framework (2013) issued by the Committee of Sponsoring Organizations of the Treadway Commission (COSO), and our report dated February 14, 2017 expressed an unqualified opinion on the effectiveness of Prologis, Inc.’s internal control over financial reporting.
/s/ KPMG LLP
Denver, Colorado
February 14, 2017
47
REPORT OF INDEPENDENT REGISTERED PUBLIC ACCOUNTING FIRM
The Partners
Prologis, L.P.:
We have audited the accompanying consolidated balance sheets of Prologis, L.P. and subsidiaries (the “Company”) as of December 31, 2016 and 2015, and the related consolidated statements of income, comprehensive income, capital, and cash flows for each of the years in the three-year period ended December 31, 2016. These consolidated financial statements are the responsibility of Prologis, L.P.’s management. Our responsibility is to express an opinion on these consolidated financial statements based on our audits.
We conducted our audits in accordance with the standards of the Public Company Accounting Oversight Board (United States). Those standards require that we plan and perform the audit to obtain reasonable assurance about whether the financial statements are free of material misstatement. An audit includes examining, on a test basis, evidence supporting the amounts and disclosures in the financial statements. An audit also includes assessing the accounting principles used and significant estimates made by management, as well as evaluating the overall financial statement presentation. We believe that our audits provide a reasonable basis for our opinion.
As discussed in Note 2 to the consolidated financial statements, the Company changed its method of accounting for discontinued operations as of January 1, 2014, on a prospective basis, due to the adoption of Accounting Standards Update 2014-08.
As discussed in Note 2 to the consolidated financial statements, during 2016 the Operating Partnership has changed its method for classifying distributions received from equity method investees in the statements of cash flows for all periods presented, on a retrospective basis, due to the early adoption of Accounting Standards Update 2016-15.
In our opinion, the consolidated financial statements referred to above present fairly, in all material respects, the financial position of Prologis, L.P. and subsidiaries as of December 31, 2016 and 2015, and the results of their operations and their cash flows for each of the years in the three-year period ended December 31, 2016, in conformity with U.S. generally accepted accounting principles.
/s/ KPMG LLP
Denver, Colorado
February 14, 2017
48
REPORT OF INDEPENDENT REGISTERED PUBLIC ACCOUNTING FIRM
The Board of Directors and Stockholders
Prologis, Inc.:
We have audited Prologis, Inc.’s internal control over financial reporting as of December 31, 2016, based on criteria established in Internal Control — Integrated Framework (2013) issued by the Committee of Sponsoring Organizations of the Treadway Commission (COSO). Prologis, Inc.’s management is responsible for maintaining effective internal control over financial reporting and for its assessment of the effectiveness of internal control over financial reporting, included in the accompanying Management’s Annual Report on Internal Control over Financial Reporting. Our responsibility is to express an opinion on Prologis, Inc.’s internal control over financial reporting based on our audit.
We conducted our audit in accordance with the standards of the Public Company Accounting Oversight Board (United States). Those standards require that we plan and perform the audit to obtain reasonable assurance about whether effective internal control over financial reporting was maintained in all material respects. Our audit included obtaining an understanding of internal control over financial reporting, assessing the risk that a material weakness exists, and testing and evaluating the design and operating effectiveness of internal control based on the assessed risk. Our audit also included performing such other procedures as we considered necessary in the circumstances. We believe that our audit provides a reasonable basis for our opinion.
A company’s internal control over financial reporting is a process designed to provide reasonable assurance regarding the reliability of financial reporting and the preparation of financial statements for external purposes in accordance with generally accepted accounting principles. A company’s internal control over financial reporting includes those policies and procedures that (1) pertain to the maintenance of records that, in reasonable detail, accurately and fairly reflect the transactions and dispositions of the assets of the company; (2) provide reasonable assurance that transactions are recorded as necessary to permit preparation of financial statements in accordance with generally accepted accounting principles, and that receipts and expenditures of the company are being made only in accordance with authorizations of management and directors of the company; and (3) provide reasonable assurance regarding prevention or timely detection of unauthorized acquisition, use, or disposition of the company’s assets that could have a material effect on the financial statements.
Because of its inherent limitations, internal control over financial reporting may not prevent or detect misstatements. Also, projections of any evaluation of effectiveness to future periods are subject to the risk that controls may become inadequate because of changes in conditions, or that the degree of compliance with the policies or procedures may deteriorate.
In our opinion, Prologis, Inc. maintained, in all material respects, effective internal control over financial reporting as of December 31, 2016, based on criteria established in Internal Control — Integrated Framework (2013) issued by the Committee of Sponsoring Organizations of the Treadway Commission (COSO).
We also have audited, in accordance with the standards of the Public Company Accounting Oversight Board (United States), the consolidated balance sheets of Prologis, Inc. and subsidiaries as of December 31, 2016 and 2015, and the related consolidated statements of income, comprehensive income, equity, and cash flows for each of the years in the three-year period ended December 31, 2016, and our report dated February 14, 2017 expressed an unqualified opinion on those consolidated financial statements.
/s/ KPMG LLP
Denver, Colorado
February 14, 2017
49
(In thousands, except per share data)
|
|
Year Ended December 31, |
|
|||||
|
|
2016 |
|
|
2015 |
|
||
|
ASSETS |
|
|
|
|
|
|
|
|
Investments in real estate properties |
$ |
27,119,330 |
|
|
$ |
27,521,368 |
|
|
Less accumulated depreciation |
|
3,758,372 |
|
|
|
3,274,284 |
|
|
Net investments in real estate properties |
|
23,360,958 |
|
|
|
24,247,084 |
|
|
Investments in and advances to unconsolidated entities |
|
4,230,429 |
|
|
|
4,755,620 |
|
|
Assets held for sale or contribution |
|
322,139 |
|
|
|
378,423 |
|
|
Notes receivable backed by real estate |
|
32,100 |
|
|
|
235,050 |
|
|
Net investments in real estate |
|
27,945,626 |
|
|
|
29,616,177 |
|
|
|
|
|
|
|
|
|
|
|
Cash and cash equivalents |
|
807,316 |
|
|
|
264,080 |
|
|
Other assets |
|
1,496,990 |
|
|
|
1,514,510 |
|
|
Total assets |
$ |
30,249,932 |
|
|
$ |
31,394,767 |
|
|
|
|
|
|
|
|
|
|
|
LIABILITIES AND EQUITY |
|
|
|
|
|
|
|
|
Liabilities: |
|
|
|
|
|
|
|
|
Debt |
$ |
10,608,294 |
|
|
$ |
11,626,831 |
|
|
Accounts payable and accrued expenses |
|
556,179 |
|
|
|
712,725 |
|
|
Other liabilities |
|
627,319 |
|
|
|
634,375 |
|
|
Total liabilities |
|
11,791,792 |
|
|
|
12,973,931 |
|
|
|
|
|
|
|
|
|
|
|
Equity: |
|
|
|
|
|
|
|
|
Prologis, Inc. stockholders’ equity: |
|
|
|
|
|
|
|
|
Series Q preferred stock at stated liquidation preference of $50 per share; $0.01 par value; 1,565 shares issued and outstanding and 100,000 preferred shares authorized at December 31, 2016, and 2015 |
|
78,235 |
|
|
|
78,235 |
|
|
Common stock; $0.01 par value; 528,671 shares and 524,512 shares issued and outstanding at December 31, 2016, and 2015, respectively |
|
5,287 |
|
|
|
5,245 |
|
|
Additional paid-in capital |
|
19,455,039 |
|
|
|
19,302,367 |
|
|
Accumulated other comprehensive loss |
|
(937,473 |
) |
|
|
(791,429 |
) |
|
Distributions in excess of net earnings |
|
(3,610,007 |
) |
|
|
(3,926,483 |
) |
|
Total Prologis, Inc. stockholders’ equity |
|
14,991,081 |
|
|
|
14,667,935 |
|
|
Noncontrolling interests |
|
3,467,059 |
|
|
|
3,752,901 |
|
|
Total equity |
|
18,458,140 |
|
|
|
18,420,836 |
|
|
Total liabilities and equity |
$ |
30,249,932 |
|
|
$ |
31,394,767 |
|
The accompanying notes are an integral part of these Consolidated Financial Statements.
50
CONSOLIDATED STATEMENTS OF INCOME
(In thousands, except per share amounts)
|
|
|
Year Ended December 31, |
|
|||||||||
|
|
|
2016 |
|
|
2015 |
|
|
2014 |
|
|||
|
Revenues: |
|
|
|
|
|
|
|
|
|
|
|
|
|
Rental |
|
$ |
1,734,844 |
|
|
$ |
1,536,117 |
|
|
$ |
1,178,609 |
|
|
Rental recoveries |
|
|
485,565 |
|
|
|
437,070 |
|
|
|
348,740 |
|
|
Strategic capital |
|
|
294,552 |
|
|
|
210,362 |
|
|
|
219,871 |
|
|
Development management and other |
|
|
18,174 |
|
|
|
13,525 |
|
|
|
13,567 |
|
|
Total revenues |
|
|
2,533,135 |
|
|
|
2,197,074 |
|
|
|
1,760,787 |
|
|
Expenses: |
|
|
|
|
|
|
|
|
|
|
|
|
|
Rental |
|
|
568,870 |
|
|
|
544,182 |
|
|
|
430,289 |
|
|
Strategic capital |
|
|
128,506 |
|
|
|
108,422 |
|
|
|
115,430 |
|
|
General and administrative |
|
|
222,067 |
|
|
|
217,227 |
|
|
|
229,332 |
|
|
Depreciation and amortization |
|
|
930,985 |
|
|
|
880,373 |
|
|
|
642,461 |
|
|
Other |
|
|
14,329 |
|
|
|
66,698 |
|
|
|
23,467 |
|
|
Total expenses |
|
|
1,864,757 |
|
|
|
1,816,902 |
|
|
|
1,440,979 |
|
|
|
|
|
|
|
|
|
|
|
|
|
|
|
|
Operating income |
|
|
668,378 |
|
|
|
380,172 |
|
|
|
319,808 |
|
|
|
|
|
|
|
|
|
|
|
|
|
|
|
|
Other income (expense): |
|
|
|
|
|
|
|
|
|
|
|
|
|
Earnings from unconsolidated entities, net |
|
|
206,307 |
|
|
|
159,262 |
|
|
|
134,288 |
|
|
Interest expense |
|
|
(303,146 |
) |
|
|
(301,363 |
) |
|
|
(308,885 |
) |
|
Interest and other income, net |
|
|
8,101 |
|
|
|
25,484 |
|
|
|
25,768 |
|
|
Gains on dispositions of investments in real estate and revaluation of equity investments upon acquisition of a controlling interest, net |
|
|
757,398 |
|
|
|
758,887 |
|
|
|
725,790 |
|
|
Foreign currency and derivative gains (losses), net |
|
|
7,582 |
|
|
|
12,466 |
|
|
|
(17,841 |
) |
|
Gains (losses) on early extinguishment of debt, net |
|
|
2,484 |
|
|
|
(86,303 |
) |
|
|
(165,300 |
) |
|
Total other income |
|
|
678,726 |
|
|
|
568,433 |
|
|
|
393,820 |
|
|
Earnings before income taxes |
|
|
1,347,104 |
|
|
|
948,605 |
|
|
|
713,628 |
|
|
Total income tax expense (benefit) |
|
|
54,564 |
|
|
|
23,090 |
|
|
|
(25,656 |
) |
|
Consolidated net earnings |
|
|
1,292,540 |
|
|
|
925,515 |
|
|
|
739,284 |
|
|
Less net earnings attributable to noncontrolling interests |
|
|
82,608 |
|
|
|
56,076 |
|
|
|
103,101 |
|
|
Net earnings attributable to controlling interests |
|
|
1,209,932 |
|
|
|
869,439 |
|
|
|
636,183 |
|
|
Less preferred stock dividends |
|
|
6,714 |
|
|
|
6,651 |
|
|
|
7,431 |
|
|
Loss on preferred stock repurchase |
|
|
- |
|
|
|
- |
|
|
|
6,517 |
|
|
Net earnings attributable to common stockholders |
|
$ |
1,203,218 |
|
|
$ |
862,788 |
|
|
$ |
622,235 |
|
|
|
|
|
|
|
|
|
|
|
|
|
|
|
|
Weighted average common shares outstanding – Basic |
|
|
526,103 |
|
|
|
521,241 |
|
|
|
499,583 |
|
|
Weighted average common shares outstanding – Diluted |
|
|
546,666 |
|
|
|
533,944 |
|
|
|
506,391 |
|
|
|
|
|
|
|
|
|
|
|
|
|
|
|
|
Net earnings per share attributable to common stockholders – Basic |
|
$ |
2.29 |
|
|
$ |
1.66 |
|
|
$ |
1.25 |
|
|
|
|
|
|
|
|
|
|
|
|
|
|
|
|
Net earnings per share attributable to common stockholders – Diluted |
|
$ |
2.27 |
|
|
$ |
1.64 |
|
|
$ |
1.24 |
|
|
|
|
|
|
|
|
|
|
|
|
|
|
|
|
Dividends per common share |
|
$ |
1.68 |
|
|
$ |
1.52 |
|
|
$ |
1.32 |
|
The accompanying notes are an integral part of these Consolidated Financial Statements.
51
CONSOLIDATED STATEMENTS OF COMPREHENSIVE INCOME
(In thousands)
|
|
|
Year Ended December 31, |
|
|||||||||
|
|
|
2016 |
|
|
2015 |
|
|
2014 |
|
|||
|
Consolidated net earnings |
|
$ |
1,292,540 |
|
|
$ |
925,515 |
|
|
$ |
739,284 |
|
|
Other comprehensive income (loss): |
|
|
|
|
|
|
|
|
|
|
|
|
|
Foreign currency translation losses, net |
|
|
(135,958 |
) |
|
|
(208,901 |
) |
|
|
(171,401 |
) |
|
Unrealized losses on derivative contracts, net |
|
|
(1,349 |
) |
|
|
(17,457 |
) |
|
|
(6,498 |
) |
|
Comprehensive income |
|
|
1,155,233 |
|
|
|
699,157 |
|
|
|
561,385 |
|
|
Net earnings attributable to noncontrolling interests |
|
|
(82,608 |
) |
|
|
(56,076 |
) |
|
|
(103,101 |
) |
|
Other comprehensive loss (gain) attributable to noncontrolling interests |
|
|
(8,737 |
) |
|
|
35,266 |
|
|
|
13,237 |
|
|
Comprehensive income attributable to common stockholders |
|
$ |
1,063,888 |
|
|
$ |
678,347 |
|
|
$ |
471,521 |
|
The accompanying notes are an integral part of these Consolidated Financial Statements.
52
CONSOLIDATED STATEMENTS OF EQUITY
(In thousands)
|
|
|
|
|
|
Common Stock |
|
|
|
|
|
|
Accumulated |
|
|
Distributions |
|
|
|
|
|
|
|
|
|
|||||||
|
|
|
|
|
|
Number |
|
|
|
|
|
|
Additional |
|
|
Other |
|
|
in Excess of |
|
|
Non- |
|
|
|
|
|
|||||
|
|
Preferred |
|
|
of |
|
|
Par |
|
|
Paid-in |
|
|
Comprehensive |
|
|
Net |
|
|
controlling |
|
|
Total |
|
||||||||
|
|
Stock |
|
|
Shares |
|
|
Value |
|
|
Capital |
|
|
Income (Loss) |
|
|
Earnings |
|
|
Interests |
|
|
Equity |
|
||||||||
|
Balance at January 1, 2014 |
$ |
100,000 |
|
|
|
498,799 |
|
|
$ |
4,988 |
|
|
$ |
17,974,509 |
|
|
$ |
(435,675 |
) |
|
$ |
(3,932,664 |
) |
|
$ |
465,295 |
|
|
$ |
14,176,453 |
|
|
Consolidated net earnings |
|
- |
|
|
|
- |
|
|
|
- |
|
|
|
- |
|
|
|
- |
|
|
|
636,183 |
|
|
|
103,101 |
|
|
|
739,284 |
|
|
Effect of equity compensation plans |
|
- |
|
|
|
1,383 |
|
|
|
14 |
|
|
|
88,424 |
|
|
|
- |
|
|
|
- |
|
|
|
450 |
|
|
|
88,888 |
|
|
Issuance of stock in at-the-market program, net of issuance costs |
|
- |
|
|
|
3,316 |
|
|
|
33 |
|
|
|
140,102 |
|
|
|
- |
|
|
|
- |
|
|
|
- |
|
|
|
140,135 |
|
|
Repurchase of preferred sock |
|
(21,765 |
) |
|
|
- |
|
|
|
- |
|
|
|
639 |
|
|
|
- |
|
|
|
(6,517 |
) |
|
|
- |
|
|
|
(27,643 |
) |
|
Issuance of stock from exercise of warrant |
|
- |
|
|
|
6,000 |
|
|
|
60 |
|
|
|
213,780 |
|
|
|
- |
|
|
|
- |
|
|
|
- |
|
|
|
213,840 |
|
|
Formation of Prologis U.S. Logistics Venture |
|
- |
|
|
|
- |
|
|
|
- |
|
|
|
13,721 |
|
|
|
- |
|
|
|
- |
|
|
|
442,251 |
|
|
|
455,972 |
|
|
Consolidation of Prologis North American Industrial Fund |
|
- |
|
|
|
- |
|
|
|
- |
|
|
|
- |
|
|
|
12,507 |
|
|
|
- |
|
|
|
554,493 |
|
|
|
567,000 |
|
|
Capital contributions |
|
- |
|
|
|
- |
|
|
|
- |
|
|
|
- |
|
|
|
- |
|
|
|
- |
|
|
|
14,464 |
|
|
|
14,464 |
|
|
Settlement of noncontrolling interests |
|
- |
|
|
|
- |
|
|
|
- |
|
|
|
33,803 |
|
|
|
- |
|
|
|
- |
|
|
|
(36,243 |
) |
|
|
(2,440 |
) |
|
Foreign currency translation losses, net |
|
- |
|
|
|
- |
|
|
|
- |
|
|
|
- |
|
|
|
(167,950 |
) |
|
|
- |
|
|
|
(13,214 |
) |
|
|
(181,164 |
) |
|
Unrealized losses and amortization on derivative contracts, net |
|
- |
|
|
|
- |
|
|
|
- |
|
|
|
- |
|
|
|
(9,219 |
) |
|
|
- |
|
|
|
(23 |
) |
|
|
(9,242 |
) |
|
Distributions and allocations |
|
- |
|
|
|
- |
|
|
|
- |
|
|
|
2,031 |
|
|
|
- |
|
|
|
(671,495 |
) |
|
|
(322,484 |
) |
|
|
(991,948 |
) |
|
Balance at December 31, 2014 |
$ |
78,235 |
|
|
|
509,498 |
|
|
$ |
5,095 |
|
|
$ |
18,467,009 |
|
|
$ |
(600,337 |
) |
|
$ |
(3,974,493 |
) |
|
$ |
1,208,090 |
|
|
$ |
15,183,599 |
|
|
Consolidated net earnings |
|
- |
|
|
|
- |
|
|
|
- |
|
|
|
- |
|
|
|
- |
|
|
|
869,439 |
|
|
|
56,076 |
|
|
|
925,515 |
|
|
Effect of equity compensation plans |
|
- |
|
|
|
1,475 |
|
|
|
15 |
|
|
|
57,454 |
|
|
|
- |
|
|
|
- |
|
|
|
26,234 |
|
|
|
83,703 |
|
|
Issuance of stock in at-the-market program, net of issuance costs |
|
- |
|
|
|
1,662 |
|
|
|
16 |
|
|
|
71,532 |
|
|
|
- |
|
|
|
- |
|
|
|
- |
|
|
|
71,548 |
|
|
Issuance of stock upon conversion of exchangeable debt |
|
- |
|
|
|
11,872 |
|
|
|
119 |
|
|
|
502,613 |
|
|
|
- |
|
|
|
- |
|
|
|
- |
|
|
|
502,732 |
|
|
Issuance of units related to KTR transaction |
|
- |
|
|
|
- |
|
|
|
- |
|
|
|
- |
|
|
|
- |
|
|
|
- |
|
|
|
181,170 |
|
|
|
181,170 |
|
|
Issuance of units related to other acquisitions |
|
- |
|
|
|
- |
|
|
|
- |
|
|
|
- |
|
|
|
- |
|
|
|
- |
|
|
|
371,570 |
|
|
|
371,570 |
|
|
Capital contributions |
|
- |
|
|
|
- |
|
|
|
- |
|
|
|
- |
|
|
|
- |
|
|
|
- |
|
|
|
2,355,596 |
|
|
|
2,355,596 |
|
|
Foreign currency translation losses, net |
|
- |
|
|
|
- |
|
|
|
- |
|
|
|
- |
|
|
|
(173,852 |
) |
|
|
- |
|
|
|
(35,049 |
) |
|
|
(208,901 |
) |
|
Unrealized losses and amortization on derivative contracts, net |
|
- |
|
|
|
- |
|
|
|
- |
|
|
|
- |
|
|
|
(17,240 |
) |
|
|
- |
|
|
|
(217 |
) |
|
|
(17,457 |
) |
|
Reallocation of equity |
|
- |
|
|
|
- |
|
|
|
- |
|
|
|
202,812 |
|
|
|
- |
|
|
|
(15,894 |
) |
|
|
(186,918 |
) |
|
|
- |
|
|
Distributions and other |
|
- |
|
|
|
5 |
|
|
|
- |
|
|
|
947 |
|
|
|
- |
|
|
|
(805,535 |
) |
|
|
(223,651 |
) |
|
|
(1,028,239 |
) |
|
Balance at December 31, 2015 |
$ |
78,235 |
|
|
|
524,512 |
|
|
$ |
5,245 |
|
|
$ |
19,302,367 |
|
|
$ |
(791,429 |
) |
|
$ |
(3,926,483 |
) |
|
$ |
3,752,901 |
|
|
$ |
18,420,836 |
|
|
Consolidated net earnings |
|
- |
|
|
|
- |
|
|
|
- |
|
|
|
- |
|
|
|
- |
|
|
|
1,209,932 |
|
|
|
82,608 |
|
|
|
1,292,540 |
|
|
Effect of equity compensation plans |
|
- |
|
|
|
2,282 |
|
|
|
23 |
|
|
|
91,191 |
|
|
|
- |
|
|
|
- |
|
|
|
26,483 |
|
|
|
117,697 |
|
|
Issuance of units related to acquisitions |
|
- |
|
|
|
- |
|
|
|
- |
|
|
|
- |
|
|
|
- |
|
|
|
- |
|
|
|
3,162 |
|
|
|
3,162 |
|
|
Conversion of noncontrolling interests |
|
- |
|
|
|
1,877 |
|
|
|
19 |
|
|
|
52,237 |
|
|
|
- |
|
|
|
- |
|
|
|
(52,256 |
) |
|
|
- |
|
|
Foreign currency translation gains (losses), net |
|
- |
|
|
|
- |
|
|
|
- |
|
|
|
- |
|
|
|
(144,730 |
) |
|
|
- |
|
|
|
8,772 |
|
|
|
(135,958 |
) |
|
Unrealized losses on derivative contracts, net |
|
- |
|
|
|
- |
|
|
|
- |
|
|
|
- |
|
|
|
(1,314 |
) |
|
|
- |
|
|
|
(35 |
) |
|
|
(1,349 |
) |
|
Reallocation of equity |
|
- |
|
|
|
- |
|
|
|
- |
|
|
|
8,657 |
|
|
|
- |
|
|
|
- |
|
|
|
(8,657 |
) |
|
|
- |
|
|
Distributions and other |
|
- |
|
|
|
- |
|
|
|
- |
|
|
|
587 |
|
|
|
- |
|
|
|
(893,456 |
) |
|
|
(345,919 |
) |
|
|
(1,238,788 |
) |
|
Balance at December 31, 2016 |
$ |
78,235 |
|
|
|
528,671 |
|
|
$ |
5,287 |
|
|
$ |
19,455,039 |
|
|
$ |
(937,473 |
) |
|
$ |
(3,610,007 |
) |
|
$ |
3,467,059 |
|
|
$ |
18,458,140 |
|
The accompanying notes are an integral part of these Consolidated Financial Statements.
53
CONSOLIDATED STATEMENTS OF CASH FLOWS
(In thousands)
|
|
|
Years Ended December 31, |
|
|||||||||
|
|
|
2016 |
|
|
2015 |
|
|
2014 |
|
|||
|
Operating activities: |
|
|
|
|
|
|
|
|
|
|
|
|
|
Consolidated net earnings |
|
$ |
1,292,540 |
|
|
$ |
925,515 |
|
|
$ |
739,284 |
|
|
Adjustments to reconcile net earnings to net cash provided by operating activities: |
|
|
|
|
|
|
|
|
|
|
|
|
|
Straight-lined rents and amortization of above and below market leases |
|
|
(93,608 |
) |
|
|
(59,619 |
) |
|
|
(14,392 |
) |
|
Equity-based compensation awards |
|
|
60,341 |
|
|
|
53,665 |
|
|
|
57,478 |
|
|
Depreciation and amortization |
|
|
930,985 |
|
|
|
880,373 |
|
|
|
642,461 |
|
|
Earnings from unconsolidated entities, net |
|
|
(206,307 |
) |
|
|
(159,262 |
) |
|
|
(134,288 |
) |
|
Distributions from unconsolidated entities |
|
|
286,651 |
|
|
|
284,664 |
|
|
|
294,890 |
|
|
Net changes in operating receivables from unconsolidated entities |
|
|
14,823 |
|
|
|
(38,185 |
) |
|
|
(7,503 |
) |
|
Amortization of debt premiums, net of deferred financing costs |
|
|
(15,137 |
) |
|
|
(31,841 |
) |
|
|
(7,324 |
) |
|
Gains on dispositions of investments in real estate and revaluation of equity investments upon acquisition of a controlling interest, net |
|
|
(757,398 |
) |
|
|
(758,887 |
) |
|
|
(725,790 |
) |
|
Unrealized foreign currency and derivative losses (gains), net |
|
|
(8,052 |
) |
|
|
(1,019 |
) |
|
|
22,571 |
|
|
Losses (gains) on early extinguishment of debt, net |
|
|
(2,484 |
) |
|
|
86,303 |
|
|
|
165,300 |
|
|
Deferred income tax benefit |
|
|
(5,525 |
) |
|
|
(5,057 |
) |
|
|
(87,240 |
) |
|
Increase in accounts receivable and other assets |
|
|
(106,337 |
) |
|
|
(64,749 |
) |
|
|
(93 |
) |
|
Increase (decrease) in accounts payable and accrued expenses and other liabilities |
|
|
26,513 |
|
|
|
4,426 |
|
|
|
(50,881 |
) |
|
Net cash provided by operating activities |
|
|
1,417,005 |
|
|
|
1,116,327 |
|
|
|
894,473 |
|
|
Investing activities: |
|
|
|
|
|
|
|
|
|
|
|
|
|
Real estate development |
|
|
(1,641,560 |
) |
|
|
(1,339,904 |
) |
|
|
(1,064,220 |
) |
|
Real estate acquisitions |
|
|
(458,516 |
) |
|
|
(890,183 |
) |
|
|
(612,330 |
) |
|
KTR transaction, net of cash received |
|
|
- |
|
|
|
(4,809,499 |
) |
|
|
- |
|
|
Tenant improvements and lease commissions on previously leased space |
|
|
(165,933 |
) |
|
|
(154,564 |
) |
|
|
(133,957 |
) |
|
Nondevelopment capital expenditures |
|
|
(101,677 |
) |
|
|
(83,351 |
) |
|
|
(78,610 |
) |
|
Proceeds from dispositions and contributions of real estate properties |
|
|
2,826,408 |
|
|
|
2,795,249 |
|
|
|
2,285,488 |
|
|
Investments in and advances to unconsolidated entities |
|
|
(265,951 |
) |
|
|
(474,420 |
) |
|
|
(756,416 |
) |
|
Acquisition of a controlling interest in unconsolidated co-investment ventures, net of cash received |
|
|
- |
|
|
|
- |
|
|
|
(590,390 |
) |
|
Return of investment from unconsolidated entities |
|
|
776,550 |
|
|
|
29,406 |
|
|
|
84,135 |
|
|
Proceeds from repayment of notes receivable backed by real estate |
|
|
202,950 |
|
|
|
9,866 |
|
|
|
188,000 |
|
|
Proceeds from the settlement of net investment hedges |
|
|
79,767 |
|
|
|
129,149 |
|
|
|
31,409 |
|
|
Payments on the settlement of net investment hedges |
|
|
- |
|
|
|
(981 |
) |
|
|
(18,370 |
) |
|
Net cash provided by (used in) investing activities |
|
|
1,252,038 |
|
|
|
(4,789,232 |
) |
|
|
(665,261 |
) |
|
Financing activities: |
|
|
|
|
|
|
|
|
|
|
|
|
|
Proceeds from issuance of common stock |
|
|
39,470 |
|
|
|
90,258 |
|
|
|
378,247 |
|
|
Distributions paid on common and preferred stock |
|
|
(893,455 |
) |
|
|
(804,697 |
) |
|
|
(672,190 |
) |
|
Repurchase of preferred stock |
|
|
- |
|
|
|
- |
|
|
|
(27,643 |
) |
|
Noncontrolling interests contributions |
|
|
2,168 |
|
|
|
2,355,367 |
|
|
|
468,280 |
|
|
Noncontrolling interests distributions |
|
|
(343,550 |
) |
|
|
(215,740 |
) |
|
|
(315,426 |
) |
|
Purchase of noncontrolling interests |
|
|
(3,083 |
) |
|
|
(2,560 |
) |
|
|
(2,440 |
) |
|
Tax paid for shares withheld |
|
|
(8,570 |
) |
|
|
(12,298 |
) |
|
|
(12,990 |
) |
|
Debt and equity issuance costs paid |
|
|
(20,123 |
) |
|
|
(32,012 |
) |
|
|
(23,420 |
) |
|
Net proceeds from (payments on) credit facilities |
|
|
33,435 |
|
|
|
(7,970 |
) |
|
|
(717,369 |
) |
|
Repurchase and payments of debt |
|
|
(2,301,647 |
) |
|
|
(3,156,294 |
) |
|
|
(4,205,806 |
) |
|
Proceeds from issuance of debt |
|
|
1,369,890 |
|
|
|
5,381,862 |
|
|
|
4,779,950 |
|
|
Net cash provided by (used in) financing activities |
|
|
(2,125,465 |
) |
|
|
3,595,916 |
|
|
|
(350,807 |
) |
|
|
|
|
|
|
|
|
|
|
|
|
|
|
|
Effect of foreign currency exchange rate changes on cash |
|
|
(342 |
) |
|
|
(9,623 |
) |
|
|
(18,842 |
) |
|
Net increase (decrease) in cash and cash equivalents |
|
|
543,236 |
|
|
|
(86,612 |
) |
|
|
(140,437 |
) |
|
Cash and cash equivalents, beginning of year |
|
|
264,080 |
|
|
|
350,692 |
|
|
|
491,129 |
|
|
Cash and cash equivalents, end of year |
|
$ |
807,316 |
|
|
$ |
264,080 |
|
|
$ |
350,692 |
|
See Note 19 for information on noncash investing and financing activities and other information.
The accompanying notes are an integral part of these Consolidated Financial Statements.
54
(In thousands)
|
|
Year Ended December 31, |
|
|||||
|
|
2016 |
|
|
2015 |
|
||
|
ASSETS |
|
|
|
|
|
|
|
|
Investments in real estate properties |
$ |
27,119,330 |
|
|
$ |
27,521,368 |
|
|
Less accumulated depreciation |
|
3,758,372 |
|
|
|
3,274,284 |
|
|
Net investments in real estate properties |
|
23,360,958 |
|
|
|
24,247,084 |
|
|
Investments in and advances to unconsolidated entities |
|
4,230,429 |
|
|
|
4,755,620 |
|
|
Assets held for sale or contribution |
|
322,139 |
|
|
|
378,423 |
|
|
Notes receivable backed by real estate |
|
32,100 |
|
|
|
235,050 |
|
|
Net investments in real estate |
|
27,945,626 |
|
|
|
29,616,177 |
|
|
|
|
|
|
|
|
|
|
|
Cash and cash equivalents |
|
807,316 |
|
|
|
264,080 |
|
|
Other assets |
|
1,496,990 |
|
|
|
1,514,510 |
|
|
Total assets |
$ |
30,249,932 |
|
|
$ |
31,394,767 |
|
|
|
|
|
|
|
|
|
|
|
LIABILITIES AND CAPITAL |
|
|
|
|
|
|
|
|
Liabilities: |
|
|
|
|
|
|
|
|
Debt |
$ |
10,608,294 |
|
|
$ |
11,626,831 |
|
|
Accounts payable and accrued expenses |
|
556,179 |
|
|
|
712,725 |
|
|
Other liabilities |
|
627,319 |
|
|
|
634,375 |
|
|
Total liabilities |
|
11,791,792 |
|
|
|
12,973,931 |
|
|
|
|
|
|
|
|
|
|
|
Capital: |
|
|
|
|
|
|
|
|
Partners’ capital: |
|
|
|
|
|
|
|
|
General partner – preferred |
|
78,235 |
|
|
|
78,235 |
|
|
General partner – common |
|
14,912,846 |
|
|
|
14,589,700 |
|
|
Limited partners – common |
|
150,173 |
|
|
|
186,683 |
|
|
Limited partners – Class A common |
|
244,417 |
|
|
|
245,991 |
|
|
Total partners’ capital |
|
15,385,671 |
|
|
|
15,100,609 |
|
|
Noncontrolling interests |
|
3,072,469 |
|
|
|
3,320,227 |
|
|
Total capital |
|
18,458,140 |
|
|
|
18,420,836 |
|
|
Total liabilities and capital |
$ |
30,249,932 |
|
|
$ |
31,394,767 |
|
The accompanying notes are an integral part of these Consolidated Financial Statements.
55
CONSOLIDATED STATEMENTS OF INCOME
(In thousands, except per unit amounts)
|
|
|
Year Ended December 31, |
|
|||||||||
|
|
|
2016 |
|
|
2015 |
|
|
2014 |
|
|||
|
Revenues: |
|
|
|
|
|
|
|
|
|
|
|
|
|
Rental |
|
$ |
1,734,844 |
|
|
$ |
1,536,117 |
|
|
$ |
1,178,609 |
|
|
Rental recoveries |
|
|
485,565 |
|
|
|
437,070 |
|
|
|
348,740 |
|
|
Strategic capital |
|
|
294,552 |
|
|
|
210,362 |
|
|
|
219,871 |
|
|
Development management and other |
|
|
18,174 |
|
|
|
13,525 |
|
|
|
13,567 |
|
|
Total revenues |
|
|
2,533,135 |
|
|
|
2,197,074 |
|
|
|
1,760,787 |
|
|
Expenses: |
|
|
|
|
|
|
|
|
|
|
|
|
|
Rental |
|
|
568,870 |
|
|
|
544,182 |
|
|
|
430,289 |
|
|
Strategic capital |
|
|
128,506 |
|
|
|
108,422 |
|
|
|
115,430 |
|
|
General and administrative |
|
|
222,067 |
|
|
|
217,227 |
|
|
|
229,332 |
|
|
Depreciation and amortization |
|
|
930,985 |
|
|
|
880,373 |
|
|
|
642,461 |
|
|
Other |
|
|
14,329 |
|
|
|
66,698 |
|
|
|
23,467 |
|
|
Total expenses |
|
|
1,864,757 |
|
|
|
1,816,902 |
|
|
|
1,440,979 |
|
|
|
|
|
|
|
|
|
|
|
|
|
|
|
|
Operating income |
|
|
668,378 |
|
|
|
380,172 |
|
|
|
319,808 |
|
|
|
|
|
|
|
|
|
|
|
|
|
|
|
|
Other income (expense): |
|
|
|
|
|
|
|
|
|
|
|
|
|
Earnings from unconsolidated entities, net |
|
|
206,307 |
|
|
|
159,262 |
|
|
|
134,288 |
|
|
Interest expense |
|
|
(303,146 |
) |
|
|
(301,363 |
) |
|
|
(308,885 |
) |
|
Interest and other income, net |
|
|
8,101 |
|
|
|
25,484 |
|
|
|
25,768 |
|
|
Gains on dispositions of investments in real estate and revaluation of equity investments upon acquisition of a controlling interest, net |
|
|
757,398 |
|
|
|
758,887 |
|
|
|
725,790 |
|
|
Foreign currency and derivative gains (losses), net |
|
|
7,582 |
|
|
|
12,466 |
|
|
|
(17,841 |
) |
|
Losses on early extinguishment of debt, net |
|
|
2,484 |
|
|
|
(86,303 |
) |
|
|
(165,300 |
) |
|
Total other income |
|
|
678,726 |
|
|
|
568,433 |
|
|
|
393,820 |
|
|
Earnings before income taxes |
|
|
1,347,104 |
|
|
|
948,605 |
|
|
|
713,628 |
|
|
Total income tax expense (benefit) |
|
|
54,564 |
|
|
|
23,090 |
|
|
|
(25,656 |
) |
|
Consolidated net earnings |
|
|
1,292,540 |
|
|
|
925,515 |
|
|
|
739,284 |
|
|
Less net earnings attributable to noncontrolling interests |
|
|
48,307 |
|
|
|
44,950 |
|
|
|
100,900 |
|
|
Net earnings attributable to controlling interests |
|
|
1,244,233 |
|
|
|
880,565 |
|
|
|
638,384 |
|
|
Less preferred unit distributions |
|
|
6,714 |
|
|
|
6,651 |
|
|
|
7,431 |
|
|
Loss on preferred unit repurchase |
|
|
- |
|
|
|
- |
|
|
|
6,517 |
|
|
Net earnings attributable to common unitholders |
|
$ |
1,237,519 |
|
|
$ |
873,914 |
|
|
$ |
624,436 |
|
|
|
|
|
|
|
|
|
|
|
|
|
|
|
|
Weighted average common units outstanding – Basic |
|
|
532,326 |
|
|
|
525,912 |
|
|
|
501,349 |
|
|
Weighted average common units outstanding – Diluted |
|
|
546,666 |
|
|
|
533,944 |
|
|
|
506,391 |
|
|
|
|
|
|
|
|
|
|
|
|
|
|
|
|
Net earnings per unit attributable to common unitholders – Basic |
|
$ |
2.29 |
|
|
$ |
1.66 |
|
|
$ |
1.25 |
|
|
|
|
|
|
|
|
|
|
|
|
|
|
|
|
Net earnings per unit attributable to common unitholders – Diluted |
|
$ |
2.27 |
|
|
$ |
1.64 |
|
|
$ |
1.24 |
|
|
|
|
|
|
|
|
|
|
|
|
|
|
|
|
Distributions per common unit |
|
$ |
1.68 |
|
|
$ |
1.52 |
|
|
$ |
1.32 |
|
The accompanying notes are an integral part of these Consolidated Financial Statements.
56
CONSOLIDATED STATEMENTS OF COMPREHENSIVE INCOME
(In thousands)
|
|
|
Year Ended December 31, |
|
|||||||||
|
|
|
2016 |
|
|
2015 |
|
|
2014 |
|
|||
|
Consolidated net earnings |
|
$ |
1,292,540 |
|
|
$ |
925,515 |
|
|
$ |
739,284 |
|
|
Other comprehensive income (loss): |
|
|
|
|
|
|
|
|
|
|
|
|
|
Foreign currency translation losses, net |
|
|
(135,958 |
) |
|
|
(208,901 |
) |
|
|
(171,401 |
) |
|
Unrealized losses on derivative contracts, net |
|
|
(1,349 |
) |
|
|
(17,457 |
) |
|
|
(6,498 |
) |
|
Comprehensive income |
|
|
1,155,233 |
|
|
|
699,157 |
|
|
|
561,385 |
|
|
Net earnings attributable to noncontrolling interests |
|
|
(48,307 |
) |
|
|
(44,950 |
) |
|
|
(100,900 |
) |
|
Other comprehensive loss (gain) attributable to noncontrolling interests |
|
|
(12,601 |
) |
|
|
32,862 |
|
|
|
12,666 |
|
|
Comprehensive income attributable to common unitholders |
|
$ |
1,094,325 |
|
|
$ |
687,069 |
|
|
$ |
473,151 |
|
The accompanying notes are an integral part of these Consolidated Financial Statements.
57
CONSOLIDATED STATEMENTS OF CAPITAL
(In thousands)
|
|
General Partner |
|
|
Limited Partners |
|
|
Non- |
|
|
|
|
|
|||||||||||||||||||||||||||
|
|
Preferred |
|
|
Common |
|
|
Common |
|
|
Class A Common |
|
|
controlling |
|
|
|
|
|
|||||||||||||||||||||
|
|
Units |
|
|
Amount |
|
|
Units |
|
|
Amount |
|
|
Units |
|
|
Amount |
|
|
Units |
|
|
Amount |
|
|
Interests |
|
|
Total |
|
||||||||||
|
Balance at January 1, 2014 |
|
2,000 |
|
|
$ |
100,000 |
|
|
|
498,799 |
|
|
$ |
13,611,158 |
|
|
|
1,767 |
|
|
$ |
48,209 |
|
|
|
- |
|
|
$ |
- |
|
|
$ |
417,086 |
|
|
$ |
14,176,453 |
|
|
Consolidated net earnings |
|
- |
|
|
|
- |
|
|
|
- |
|
|
|
636,183 |
|
|
|
- |
|
|
|
2,201 |
|
|
|
- |
|
|
|
- |
|
|
|
100,900 |
|
|
|
739,284 |
|
|
Effect of equity compensation plans |
|
- |
|
|
|
- |
|
|
|
1,383 |
|
|
|
88,438 |
|
|
|
- |
|
|
|
450 |
|
|
|
- |
|
|
|
- |
|
|
|
- |
|
|
|
88,888 |
|
|
Issuance of units in exchange for contribution of at-the-market offering proceeds |
|
- |
|
|
|
- |
|
|
|
3,316 |
|
|
|
140,135 |
|
|
|
- |
|
|
|
- |
|
|
|
- |
|
|
|
- |
|
|
|
- |
|
|
|
140,135 |
|
|
Repurchase of preferred units |
|
(435 |
) |
|
|
(21,765 |
) |
|
|
- |
|
|
|
(5,878 |
) |
|
|
- |
|
|
|
- |
|
|
|
- |
|
|
|
- |
|
|
|
- |
|
|
|
(27,643 |
) |
|
Issuance of units in exchange for proceeds from exercise of warrant |
|
- |
|
|
|
- |
|
|
|
6,000 |
|
|
|
213,840 |
|
|
|
- |
|
|
|
- |
|
|
|
- |
|
|
|
- |
|
|
|
- |
|
|
|
213,840 |
|
|
Formation of Prologis U.S. Logistics Venture |
|
- |
|
|
|
- |
|
|
|
- |
|
|
|
13,721 |
|
|
|
- |
|
|
|
- |
|
|
|
- |
|
|
|
- |
|
|
|
442,251 |
|
|
|
455,972 |
|
|
Consolidation of Prologis North American Industrial Fund |
|
- |
|
|
|
- |
|
|
|
- |
|
|
|
12,507 |
|
|
|
- |
|
|
|
- |
|
|
|
- |
|
|
|
- |
|
|
|
554,493 |
|
|
|
567,000 |
|
|
Capital contributions |
|
- |
|
|
|
- |
|
|
|
- |
|
|
|
- |
|
|
|
- |
|
|
|
- |
|
|
|
- |
|
|
|
- |
|
|
|
14,464 |
|
|
|
14,464 |
|
|
Settlement of noncontrolling interests |
|
- |
|
|
|
- |
|
|
|
- |
|
|
|
33,803 |
|
|
|
- |
|
|
|
- |
|
|
|
- |
|
|
|
- |
|
|
|
(36,243 |
) |
|
|
(2,440 |
) |
|
Foreign currency translation losses, net |
|
- |
|
|
|
- |
|
|
|
- |
|
|
|
(167,950 |
) |
|
|
- |
|
|
|
(548 |
) |
|
|
- |
|
|
|
- |
|
|
|
(12,666 |
) |
|
|
(181,164 |
) |
|
Unrealized losses and amortization on derivative contracts, net |
|
- |
|
|
|
- |
|
|
|
- |
|
|
|
(9,219 |
) |
|
|
- |
|
|
|
(23 |
) |
|
|
- |
|
|
|
- |
|
|
|
- |
|
|
|
(9,242 |
) |
|
Distributions and allocations |
|
- |
|
|
|
- |
|
|
|
- |
|
|
|
(669,464 |
) |
|
|
- |
|
|
|
(2,100 |
) |
|
|
- |
|
|
|
- |
|
|
|
(320,384 |
) |
|
|
(991,948 |
) |
|
Balance at December 31, 2014 |
|
1,565 |
|
|
$ |
78,235 |
|
|
|
509,498 |
|
|
$ |
13,897,274 |
|
|
|
1,767 |
|
|
$ |
48,189 |
|
|
|
- |
|
|
$ |
- |
|
|
$ |
1,159,901 |
|
|
$ |
15,183,599 |
|
|
Consolidated net earnings |
|
- |
|
|
|
- |
|
|
|
- |
|
|
|
869,439 |
|
|
|
- |
|
|
|
7,733 |
|
|
|
- |
|
|
|
3,393 |
|
|
|
44,950 |
|
|
|
925,515 |
|
|
Effect of equity compensation plans |
|
- |
|
|
|
- |
|
|
|
1,475 |
|
|
|
57,469 |
|
|
|
303 |
|
|
|
26,234 |
|
|
|
- |
|
|
|
- |
|
|
|
- |
|
|
|
83,703 |
|
|
Issuance of units in exchange for contribution of at-the-market offering proceeds |
|
- |
|
|
|
- |
|
|
|
1,662 |
|
|
|
71,548 |
|
|
|
- |
|
|
|
- |
|
|
|
- |
|
|
|
- |
|
|
|
- |
|
|
|
71,548 |
|
|
Issuance of units upon conversion of exchangeable debt |
|
- |
|
|
|
- |
|
|
|
11,872 |
|
|
|
502,732 |
|
|
|
- |
|
|
|
- |
|
|
|
- |
|
|
|
- |
|
|
|
- |
|
|
|
502,732 |
|
|
Issuance of units related to KTR transaction |
|
- |
|
|
|
- |
|
|
|
- |
|
|
|
- |
|
|
|
4,500 |
|
|
|
181,170 |
|
|
|
- |
|
|
|
- |
|
|
|
- |
|
|
|
181,170 |
|
|
Issuance of units related to other acquisitions |
|
- |
|
|
|
- |
|
|
|
- |
|
|
|
- |
|
|
|
157 |
|
|
|
6,534 |
|
|
|
8,894 |
|
|
|
365,036 |
|
|
|
- |
|
|
|
371,570 |
|
|
Capital contributions |
|
- |
|
|
|
- |
|
|
|
- |
|
|
|
- |
|
|
|
- |
|
|
|
- |
|
|
|
- |
|
|
|
- |
|
|
|
2,355,596 |
|
|
|
2,355,596 |
|
|
Foreign currency translation losses, net |
|
- |
|
|
|
- |
|
|
|
- |
|
|
|
(173,852 |
) |
|
|
- |
|
|
|
(1,520 |
) |
|
|
- |
|
|
|
(667 |
) |
|
|
(32,862 |
) |
|
|
(208,901 |
) |
|
Unrealized losses and amortization on derivative contracts, net |
|
- |
|
|
|
- |
|
|
|
- |
|
|
|
(17,240 |
) |
|
|
- |
|
|
|
(151 |
) |
|
|
- |
|
|
|
(66 |
) |
|
|
- |
|
|
|
(17,457 |
) |
|
Reallocation of capital |
|
- |
|
|
|
- |
|
|
|
- |
|
|
|
186,918 |
|
|
|
- |
|
|
|
(70,965 |
) |
|
|
- |
|
|
|
(115,953 |
) |
|
|
- |
|
|
|
- |
|
|
Distributions and other |
|
- |
|
|
|
- |
|
|
|
5 |
|
|
|
(804,588 |
) |
|
|
(16 |
) |
|
|
(10,541 |
) |
|
|
- |
|
|
|
(5,752 |
) |
|
|
(207,358 |
) |
|
|
(1,028,239 |
) |
|
Balance at December 31, 2015 |
|
1,565 |
|
|
$ |
78,235 |
|
|
|
524,512 |
|
|
$ |
14,589,700 |
|
|
|
6,711 |
|
|
$ |
186,683 |
|
|
|
8,894 |
|
|
$ |
245,991 |
|
|
$ |
3,320,227 |
|
|
$ |
18,420,836 |
|
|
Consolidated net earnings |
|
- |
|
|
|
- |
|
|
|
- |
|
|
|
1,209,932 |
|
|
|
- |
|
|
|
14,232 |
|
|
|
- |
|
|
|
20,069 |
|
|
|
48,307 |
|
|
|
1,292,540 |
|
|
Effect of equity compensation plans |
|
- |
|
|
|
- |
|
|
|
2,282 |
|
|
|
91,214 |
|
|
|
440 |
|
|
|
26,483 |
|
|
|
- |
|
|
|
- |
|
|
|
- |
|
|
|
117,697 |
|
|
Issuance of units related to acquisitions |
|
- |
|
|
|
- |
|
|
|
- |
|
|
|
- |
|
|
|
71 |
|
|
|
3,162 |
|
|
|
- |
|
|
|
- |
|
|
|
- |
|
|
|
3,162 |
|
|
Conversion of limited partners units |
|
- |
|
|
|
- |
|
|
|
1,877 |
|
|
|
52,256 |
|
|
|
(1,877 |
) |
|
|
(52,256 |
) |
|
|
- |
|
|
|
- |
|
|
|
- |
|
|
|
- |
|
|
Foreign currency translation gains (losses), net |
|
- |
|
|
|
- |
|
|
|
- |
|
|
|
(144,730 |
) |
|
|
- |
|
|
|
(1,457 |
) |
|
|
- |
|
|
|
(2,372 |
) |
|
|
12,601 |
|
|
|
(135,958 |
) |
|
Unrealized losses on derivative contracts, net |
|
- |
|
|
|
- |
|
|
|
- |
|
|
|
(1,314 |
) |
|
|
- |
|
|
|
(13 |
) |
|
|
- |
|
|
|
(22 |
) |
|
|
- |
|
|
|
(1,349 |
) |
|
Reallocation of capital |
|
- |
|
|
|
- |
|
|
|
- |
|
|
|
8,657 |
|
|
|
- |
|
|
|
(12,414 |
) |
|
|
- |
|
|
|
3,757 |
|
|
|
- |
|
|
|
- |
|
|
Distributions and other |
|
- |
|
|
|
- |
|
|
|
- |
|
|
|
(892,869 |
) |
|
|
(22 |
) |
|
|
(14,247 |
) |
|
|
- |
|
|
|
(23,006 |
) |
|
|
(308,666 |
) |
|
|
(1,238,788 |
) |
|
Balance at December 31, 2016 |
|
1,565 |
|
|
$ |
78,235 |
|
|
|
528,671 |
|
|
$ |
14,912,846 |
|
|
|
5,323 |
|
|
$ |
150,173 |
|
|
|
8,894 |
|
|
$ |
244,417 |
|
|
$ |
3,072,469 |
|
|
$ |
18,458,140 |
|
The accompanying notes are an integral part of these Consolidated Financial Statements.
58
CONSOLIDATED STATEMENTS OF CASH FLOWS
(In thousands)
|
|
|
Years Ended December 31, |
|
|||||||||
|
|
|
2016 |
|
|
2015 |
|
|
2014 |
|
|||
|
Operating activities: |
|
|
|
|
|
|
|
|
|
|
|
|
|
Consolidated net earnings |
|
$ |
1,292,540 |
|
|
$ |
925,515 |
|
|
$ |
739,284 |
|
|
Adjustments to reconcile net earnings to net cash provided by operating activities: |
|
|
|
|
|
|
|
|
|
|
|
|
|
Straight-lined rents and amortization of above and below market leases |
|
|
(93,608 |
) |
|
|
(59,619 |
) |
|
|
(14,392 |
) |
|
Equity-based compensation awards |
|
|
60,341 |
|
|
|
53,665 |
|
|
|
57,478 |
|
|
Depreciation and amortization |
|
|
930,985 |
|
|
|
880,373 |
|
|
|
642,461 |
|
|
Earnings from unconsolidated entities, net |
|
|
(206,307 |
) |
|
|
(159,262 |
) |
|
|
(134,288 |
) |
|
Distributions from unconsolidated entities |
|
|
286,651 |
|
|
|
284,664 |
|
|
|
294,890 |
|
|
Net changes in operating receivables from unconsolidated entities |
|
|
14,823 |
|
|
|
(38,185 |
) |
|
|
(7,503 |
) |
|
Amortization of debt premiums, net of deferred financing costs |
|
|
(15,137 |
) |
|
|
(31,841 |
) |
|
|
(7,324 |
) |
|
Gains on dispositions of investments in real estate and revaluation of equity investments upon acquisition of a controlling interest, net |
|
|
(757,398 |
) |
|
|
(758,887 |
) |
|
|
(725,790 |
) |
|
Unrealized foreign currency and derivative losses (gains), net |
|
|
(8,052 |
) |
|
|
(1,019 |
) |
|
|
22,571 |
|
|
Losses on early extinguishment of debt, net |
|
|
(2,484 |
) |
|
|
86,303 |
|
|
|
165,300 |
|
|
Deferred income tax benefit |
|
|
(5,525 |
) |
|
|
(5,057 |
) |
|
|
(87,240 |
) |
|
Increase in accounts receivable and other assets |
|
|
(106,337 |
) |
|
|
(64,749 |
) |
|
|
(93 |
) |
|
Increase (decrease) in accounts payable and accrued expenses and other liabilities |
|
|
26,513 |
|
|
|
4,426 |
|
|
|
(50,881 |
) |
|
Net cash provided by operating activities |
|
|
1,417,005 |
|
|
|
1,116,327 |
|
|
|
894,473 |
|
|
Investing activities: |
|
|
|
|
|
|
|
|
|
|
|
|
|
Real estate development |
|
|
(1,641,560 |
) |
|
|
(1,339,904 |
) |
|
|
(1,064,220 |
) |
|
Real estate acquisitions |
|
|
(458,516 |
) |
|
|
(890,183 |
) |
|
|
(612,330 |
) |
|
KTR transaction, net of cash received |
|
|
- |
|
|
|
(4,809,499 |
) |
|
|
- |
|
|
Tenant improvements and lease commissions on previously leased space |
|
|
(165,933 |
) |
|
|
(154,564 |
) |
|
|
(133,957 |
) |
|
Nondevelopment capital expenditures |
|
|
(101,677 |
) |
|
|
(83,351 |
) |
|
|
(78,610 |
) |
|
Proceeds from dispositions and contributions of real estate properties |
|
|
2,826,408 |
|
|
|
2,795,249 |
|
|
|
2,285,488 |
|
|
Investments in and advances to unconsolidated entities |
|
|
(265,951 |
) |
|
|
(474,420 |
) |
|
|
(756,416 |
) |
|
Acquisition of a controlling interest in unconsolidated co-investment ventures, net of cash received |
|
|
- |
|
|
|
- |
|
|
|
(590,390 |
) |
|
Return of investment from unconsolidated entities |
|
|
776,550 |
|
|
|
29,406 |
|
|
|
84,135 |
|
|
Proceeds from repayment of notes receivable backed by real estate |
|
|
202,950 |
|
|
|
9,866 |
|
|
|
188,000 |
|
|
Proceeds from the settlement of net investment hedges |
|
|
79,767 |
|
|
|
129,149 |
|
|
|
31,409 |
|
|
Payments on the settlement of net investment hedges |
|
|
- |
|
|
|
(981 |
) |
|
|
(18,370 |
) |
|
Net cash provided by (used in) investing activities |
|
|
1,252,038 |
|
|
|
(4,789,232 |
) |
|
|
(665,261 |
) |
|
Financing activities: |
|
|
|
|
|
|
|
|
|
|
|
|
|
Proceeds from issuance of common partnership units in exchange for contributions from Prologis, Inc. |
|
|
39,470 |
|
|
|
90,258 |
|
|
|
378,247 |
|
|
Distributions paid on common and preferred units |
|
|
(931,559 |
) |
|
|
(820,989 |
) |
|
|
(674,344 |
) |
|
Repurchase of preferred units |
|
|
- |
|
|
|
- |
|
|
|
(27,643 |
) |
|
Noncontrolling interests contributions |
|
|
2,168 |
|
|
|
2,355,367 |
|
|
|
468,280 |
|
|
Noncontrolling interests distributions |
|
|
(306,297 |
) |
|
|
(199,845 |
) |
|
|
(313,272 |
) |
|
Purchase of noncontrolling interests |
|
|
(2,232 |
) |
|
|
(2,163 |
) |
|
|
(2,440 |
) |
|
Tax paid for shares of the Parent withheld |
|
|
(8,570 |
) |
|
|
(12,298 |
) |
|
|
(12,990 |
) |
|
Debt and capital issuance costs paid |
|
|
(20,123 |
) |
|
|
(32,012 |
) |
|
|
(23,420 |
) |
|
Net proceeds from (payments on) credit facilities |
|
|
33,435 |
|
|
|
(7,970 |
) |
|
|
(717,369 |
) |
|
Repurchase and payments of debt |
|
|
(2,301,647 |
) |
|
|
(3,156,294 |
) |
|
|
(4,205,806 |
) |
|
Proceeds from issuance of debt |
|
|
1,369,890 |
|
|
|
5,381,862 |
|
|
|
4,779,950 |
|
|
Net cash provided by (used in) financing activities |
|
|
(2,125,465 |
) |
|
|
3,595,916 |
|
|
|
(350,807 |
) |
|
|
|
|
|
|
|
|
|
|
|
|
|
|
|
Effect of foreign currency exchange rate changes on cash |
|
|
(342 |
) |
|
|
(9,623 |
) |
|
|
(18,842 |
) |
|
Net increase (decrease) in cash and cash equivalents |
|
|
543,236 |
|
|
|
(86,612 |
) |
|
|
(140,437 |
) |
|
Cash and cash equivalents, beginning of year |
|
|
264,080 |
|
|
|
350,692 |
|
|
|
491,129 |
|
|
Cash and cash equivalents, end of year |
|
$ |
807,316 |
|
|
$ |
264,080 |
|
|
$ |
350,692 |
|
See Note 19 for information on noncash investing and financing activities and other information.
The accompanying notes are an integral part of these Consolidated Financial Statements.
59
PROLOGIS, INC. AND PROLOGIS, L.P.
NOTES TO THE CONSOLIDATED FINANCIAL STATEMENTS
NOTE 1. DESCRIPTION OF THE BUSINESS
Prologis, Inc. (or the “Parent”) commenced operations as a fully integrated real estate company in 1997, elected to be taxed as a real estate investment trust (“REIT”) under the Internal Revenue Code of 1986, as amended (the “Internal Revenue Code”), and believes the current organization and method of operation will enable it to maintain its status as a REIT. The Parent is the general partner of Prologis, L.P. (or the “Operating Partnership”). Through the Operating Partnership, we are engaged in the ownership, acquisition, development and management of logistics properties in the world’s primary population centers and in those supported by extensive transportation infrastructure. Our current business strategy consists of two operating business segments: Real Estate Operations and Strategic Capital. Our Real Estate Operations segment represents the ownership and development of logistics properties. Our Strategic Capital segment represents the management of co-investment ventures and other unconsolidated entities. See Note 18 for further discussion of our business segments. Unless otherwise indicated, the Notes to the Consolidated Financial Statements apply to both the Parent and the Operating Partnership. The terms “the Company,” “Prologis,” “we,” “our” or “us” means the Parent and Operating Partnership collectively.
For each share of common stock or preferred stock the Parent issues, the Operating Partnership issues a corresponding common or preferred partnership unit, as applicable, to the Parent in exchange for the contribution of the proceeds from the stock issuance. At December 31, 2016, the Parent owned an approximate 97.42% common general partnership interest in the Operating Partnership and 100% of the preferred units in the Operating Partnership. The remaining approximate 2.58% common limited partnership interests, which include 8.9 million Class A common limited partnership units (“Class A Units”) in the Operating Partnership, are owned by unaffiliated investors and certain current and former directors and officers of the Parent. Each partner’s percentage interest in the Operating Partnership is determined based on the number of Operating Partnership units held, including the number of Operating Partnership units into which Class A Units are convertible, compared to total Operating Partnership units outstanding at each period end and is used as the basis for the allocation of net income or loss to each partner. At the end of each reporting period, a capital adjustment is made in the Operating Partnership to reflect the appropriate ownership interest for each of the common unitholders. These adjustments are reflected in the line items Reallocation of Equity in the Consolidated Statement of Equity and Reallocation of Capital in the Consolidated Statement of Capital.
As the sole general partner of the Operating Partnership, the Parent has complete responsibility and discretion in the day-to-day management and control of the Operating Partnership and we operate the Parent and the Operating Partnership as one enterprise. The management of the Parent consists of the same members as the management of the Operating Partnership. These members are officers of the Parent and employees of the Operating Partnership or one of its subsidiaries. As general partner with control of the Operating Partnership, the Parent consolidates the Operating Partnership. Because the Parent’s only significant asset is its investment in the Operating Partnership, the assets and liabilities of the Parent and the Operating Partnership are the same on their respective financial statements.
Information with respect to the square footage, number of buildings and acres of land is unaudited.
NOTE 2. SUMMARY OF SIGNIFICANT ACCOUNTING POLICIES
Basis of Presentation and Consolidation. The accompanying Consolidated Financial Statements are prepared in accordance with United States (“U.S.”) generally accepted accounting principles (“GAAP”) and are presented in our reporting currency, the U.S. dollar. All material intercompany transactions with consolidated entities have been eliminated.
We consolidate all entities that are wholly owned and those in which we own less than 100% of the equity but control, as well as any variable interest entities in which we are the primary beneficiary. We evaluate our ability to control an entity and whether the entity is a variable interest entity and we are the primary beneficiary through consideration of substantive terms of the arrangement to identify which enterprise has the power to direct the activities of the entity that most significantly impacts the entity’s economic performance and the obligation to absorb losses of the entity or the right to receive benefits from the entity.
For entities that are not defined as variable interest entities (“VIEs”), we first consider whether we are the general partner or the limited partner (or the equivalent in such investments that are not structured as partnerships). We consolidate entities in which we are the general partner and the limited partners in such entities do not have rights that would preclude control. For entities in which we are the general partner but do not control the entity as the other partners hold substantive participating or kick-out rights, we apply the equity method of accounting since as the general partner we have the ability to influence the venture. For ventures for which we are a limited partner or our investment is in an entity that is not structured similar to a partnership, we consider factors such as ownership interest, voting control, authority to make decisions, and contractual and substantive participating rights of the partners. In instances where the factors indicate that we control the venture, we consolidate the entity.
Reclassifications. Certain amounts included in the Consolidated Financial Statements for 2015 and 2014 have been reclassified to conform to the 2016 financial statement presentation.
Use of Estimates. GAAP requires us to make estimates and assumptions that affect the reported amounts of assets and liabilities, disclosure of contingent assets and liabilities at the date of the financial statements, and revenues and expenses during the reporting
60
PROLOGIS, INC. AND PROLOGIS, L.P.
NOTES TO THE CONSOLIDATED FINANCIAL STATEMENTS (CONTINUED)
period. Although we believe the assumptions and estimates we made are reasonable and appropriate, as discussed in the applicable sections throughout the Consolidated Financial Statements, different assumptions and estimates could materially impact our reported results.
Foreign Operations. The U.S. dollar is the functional currency for our consolidated subsidiaries and unconsolidated entities operating in the U.S. and Mexico and certain of our consolidated subsidiaries that operate as holding companies for foreign investments. The functional currency for our consolidated subsidiaries and unconsolidated entities operating in countries other than the U.S. and Mexico is the principal currency in which the entity’s assets, liabilities, income and expenses are denominated, which may be different from the local currency of the country of incorporation or where the entity conducts its operations.
The functional currencies of our consolidated subsidiaries and unconsolidated entities generally include the Brazilian real, British pound sterling, Canadian dollar, Chinese renminbi, euro, Japanese yen and Singapore dollar. We take part in business transactions denominated in these and other local currencies where we operate.
For our consolidated subsidiaries whose functional currency is not the U.S. dollar, we translate their financial statements into the U.S. dollar at the time we consolidate those subsidiaries’ financial statements. Generally, assets and liabilities are translated at the exchange rate in effect at the balance sheet date. The resulting translation adjustments are included in Accumulated Other Comprehensive Loss (“AOCI”) in the Consolidated Balance Sheets. Certain balance sheet items, primarily equity and capital-related accounts, are reflected at the historical exchange rate. Income statement accounts are translated using the average exchange rate for the period and income statement accounts that represent significant nonrecurring transactions are translated at the rate in effect at the date of the transaction. We translate our share of the net earnings or losses of our unconsolidated entities whose functional currency is not the U.S. dollar at the average exchange rate for the period.
We and certain of our consolidated subsidiaries have intercompany and third-party debt that is not denominated in the entity’s functional currency. When the debt is remeasured against the functional currency of the entity, a gain or loss can result. The resulting adjustment is reflected in results of operations, unless it is intercompany debt that is deemed to be long-term in nature and then the adjustment is reflected as a cumulative translation adjustment in AOCI.
Business Combinations. When we acquire a business or individual operating properties, we allocate the purchase price to the various components of the acquisition based on the fair value of the acquired assets and assumed liabilities, including an allocation to the individual buildings acquired. We generally acquire operating properties that meet the definition of a business and we expense transaction costs as incurred. The initial allocation of the purchase price is based on management’s preliminary assessment, which may differ when final information becomes available. Subsequent adjustments made to the initial purchase price allocation are made within the allocation period, not to exceed one year.
When we obtain control of an unconsolidated entity, we account for the acquisition in accordance with the guidance for a business combination achieved in stages. We remeasure our previously held interest in the unconsolidated entity at its acquisition-date fair value and recognize the resulting gain or loss, if any, in earnings at the acquisition date.
We allocate the purchase price using primarily Level 2 and Level 3 inputs (further defined in Fair Value Measurements below) as follows:
Investments in Real Estate Properties. We value operating properties as if vacant. We estimate fair value generally by applying an income approach methodology using a discounted cash flow analysis. Key assumptions in the discounted cash flow analysis include market rents, growth rates and discount and capitalization rates. We determine discount and capitalization rates by market based on recent transactions and other market data. The fair value of land is generally based on relevant market data, such as a comparison of the subject site to similar parcels that have recently been sold or are currently being offered on the market for sale.
Lease Intangibles. We determine the portion of the purchase price related to intangible assets and liabilities as follows:
|
• |
Above and Below Market Leases. We recognize an asset or liability for acquired in-place leases with favorable or unfavorable rents based on our estimate of current market rents of the applicable markets. The value is recorded in either Other Assets or Other Liabilities, as appropriate, and is amortized over the term of the respective leases, including any bargain renewal options, to rental revenues. |
|
• |
Foregone Rent. We calculate the value of the revenue and recovery of costs foregone during a reasonable lease-up period, as if the space was vacant, in each of the applicable markets. The values are recorded in Other Assets and amortized over the remaining life of the respective leases to amortization expense. |
|
• |
Leasing Commissions. We recognize an asset for leasing commissions upon the acquisition of in-place leases based on our estimate of the cost to lease space in the applicable markets. The value is recorded in Other Assets and amortized over the remaining life of the respective leases to amortization expense. |
61
PROLOGIS, INC. AND PROLOGIS, L.P.
NOTES TO THE CONSOLIDATED FINANCIAL STATEMENTS (CONTINUED)
Debt. We estimate the fair value of debt based on contractual future cash flows discounted using borrowing spreads and market interest rates that would be available to us for the issuance of debt with similar terms and remaining maturities. In the case of publicly traded debt, we estimate the fair value based on available market data. Any discount or premium to the principal amount is included in the carrying value and amortized to interest expense over the remaining term of the related debt using the effective interest method.
Noncontrolling Interests. We estimate the portion of the fair value of the net assets owned by third parties based on the fair value of the consolidated net assets, principally real estate properties and debt.
Working Capital. We estimate fair value of other acquired assets and assumed liabilities on the best information available.
Fair Value Measurements. The objective of fair value is to determine the price that would be received on the sale of an asset or paid to transfer a liability in an orderly transaction between market participants at the measurement date (the exit price). We estimate fair value using available market information and valuation methodologies we believe to be appropriate for these purposes. Considerable judgment and a high degree of subjectivity are involved in developing these estimates and, accordingly, they are not necessarily indicative of amounts that we would realize on disposition. The fair value hierarchy consists of three broad levels:
|
• |
Level 1 — Quoted prices (unadjusted) in active markets for identical assets or liabilities that the entity can access at the measurement date. |
|
• |
Level 2 — Inputs other than quoted prices included within Level 1 that are observable for the asset or liability, either directly or indirectly. |
|
• |
Level 3 — Unobservable inputs for the asset or liability. |
Recurring Fair Value Measurements. We estimate the fair value of our financial instruments using available market information and valuation methodologies we believe to be appropriate for these purposes as follows:
|
• |
Debt. We estimate the fair value of our senior notes and exchangeable senior notes for disclosure purposes based on quoted market prices for the same (Level 1) or similar (Level 2) issues when current quoted market prices are available. We estimate the fair value of our credit facilities, term loans, secured mortgage debt and assessment bonds by discounting the future cash flows using rates and borrowing spreads currently available to us (Level 3). |
|
• |
Derivatives. We determine the fair value of our derivative instruments using widely accepted valuation techniques including discounted cash flow analysis on the expected cash flows of each derivative. This analysis reflects the contractual terms of the derivatives, including the period to maturity, and uses observable market-based inputs, including interest rate curves, foreign exchange rates, and implied volatilities. We determine the fair values of our interest rate swaps using the market standard methodology of netting the discounted future fixed cash receipts or payments and the discounted expected variable cash payments. We base the variable cash payments on an expectation of future interest rates, or forward curves, derived from observable market interest rate curves. We base the fair values of our net investment hedges on the change in the spot rate at the end of the period as compared with the strike price at inception. |
We incorporate credit valuation adjustments to appropriately reflect both our nonperformance risk and the respective counterparty’s nonperformance risk in the fair value measurements. In adjusting the fair value of our derivative contracts for the effect of nonperformance risk, we consider the impact of netting and any applicable credit enhancements, such as collateral postings, thresholds, mutual puts and guarantees.
We have determined that the majority of the inputs used to value our derivatives fall within Level 2 of the fair value hierarchy. Although the credit valuation adjustments associated with our derivatives utilize Level 3 inputs, such as estimates of current credit spreads to evaluate the likelihood of default by us and our counterparties, we assess the significance of the impact of the credit valuation adjustments on the overall valuation of our derivative positions and have determined that the credit valuation adjustments are not significant to the overall valuation of our derivatives.
Nonrecurring Fair Value Measurements. Assets measured at fair value on a nonrecurring basis generally consist of real estate assets and investments in and advances to unconsolidated entities that were subject to impairment charges related to our change of intent to sell the investments and through our recoverability analysis discussed below. We estimate fair value based on expected sales prices in the market (Level 2).
Real Estate Assets. Real estate assets are carried at depreciated cost. We capitalize costs incurred in developing, renovating, rehabilitating and improving real estate assets as part of the investment basis of real estate assets. We expense costs for repairs and maintenance of the real estate assets as incurred.
During the land development and construction periods of qualifying projects, we capitalize interest costs, insurance, real estate taxes and general and administrative costs of the personnel performing the development, renovation, and rehabilitation; if such costs are incremental and identifiable to a specific activity to ready the asset for its intended use. We capitalize transaction costs related to the
62
PROLOGIS, INC. AND PROLOGIS, L.P.
NOTES TO THE CONSOLIDATED FINANCIAL STATEMENTS (CONTINUED)
acquisition of land for future development. We capitalize costs incurred to successfully originate a lease that result directly from and are essential to acquire that lease, including internal costs that are incremental and identifiable as leasing activities. Leasing costs that meet the requirements for capitalization are presented as a component of Other Assets.
We charge the depreciable portions of real estate assets to depreciation expense on a straight-line basis over the respective estimated useful lives. Depreciation commences when the asset is ready for its intended use, which we define as the earlier of stabilization (90% occupied) or one year after completion of construction. We generally use the following useful lives: 5 to 7 years for capital improvements, 10 years for standard tenant improvements, 25 years for depreciable land improvements, 30 years for operating properties acquired and 40 years for operating properties we develop. We depreciate building improvements on land parcels subject to ground leases over the shorter of the estimated building improvement life or the contractual term of the underlying ground lease. Capitalized leasing costs are amortized over the estimated remaining lease term. Our weighted average lease term on leases signed during 2016, based on square feet for all leases, was five years.
We assess the carrying values of our respective real estate assets, whenever events or changes in circumstances indicate that the carrying amounts of these assets may not be fully recoverable. We measure the recoverability of the asset by comparison of the carrying amount of the asset to the estimated future undiscounted cash flows. If our analysis indicates that the carrying value of the real estate property is not recoverable on an undiscounted cash flow basis, we recognize an impairment charge for the amount by which the carrying value exceeds the current estimated fair value of the real estate property.
We estimate the future undiscounted cash flows and fair value based on our intent as follows:
|
• |
for real estate properties that we intend to hold long-term; including land held for development, properties currently under development and operating buildings; recoverability is assessed based on the estimated undiscounted future net rental income from operating the property and the terminal value, including anticipated costs to develop; |
|
• |
for real estate properties we intend to sell, including properties currently under development and operating buildings; recoverability is assessed based on proceeds from disposition that are estimated based on future net rental income of the property, expected market capitalization rates and anticipated costs to develop; |
|
• |
for land parcels we intend to sell, recoverability is assessed based on estimated proceeds from disposition; and |
|
• |
for costs incurred related to the potential acquisition of land or development of a real estate property, recoverability is assessed based on the probability that the acquisition or development is likely to occur at the measurement date. |
Assets Held for Sale or Contribution. We classify a property as held for sale or contribution when certain criteria are met, in accordance with GAAP. Assets classified as held for sale are expected to be sold to a third party and assets classified as held for contribution are newly developed assets we intend to contribute to an unconsolidated co-investment venture or to a third party within twelve months. At such time, the respective assets and liabilities are presented separately in the Consolidated Balance Sheets and depreciation is no longer recognized. Assets held for sale or contribution are reported at the lower of their carrying amount or their estimated fair value less the costs to sell the assets.
Investments in Unconsolidated Entities. We present our investments in certain entities under the equity method. We use the equity method when we have the ability to exercise significant influence over operating and financial policies of the venture but do not have control of the entity. Under the equity method, we initially recognize these investments (including advances) in the balance sheet at our cost, including formation costs and net of deferred gains from the contribution of properties, if applicable. We subsequently adjust the accounts to reflect our proportionate share of net earnings or losses recognized and accumulated other comprehensive income or loss, distributions received, contributions made and certain other adjustments, as appropriate. When circumstances indicate there may have been a reduction in the value of an equity investment, we evaluate whether the loss in value is other than temporary. If we conclude it is other than temporary, we recognize an impairment charge to reflect the equity investment at fair value.
Cash and Cash Equivalents. We consider all cash on hand, demand deposits with financial institutions and short-term highly liquid investments with original maturities of three months or less to be cash equivalents. Our cash and cash equivalents are financial instruments that are exposed to concentrations of credit risk. We invest our cash with high-credit quality institutions. Cash balances may be invested in money market accounts that are not insured. We have not realized any losses in such cash investments or accounts and believe that we are not exposed to any significant credit risk.
Derivative Financial Instruments. We may use derivative financial instruments for the purpose of managing foreign currency exchange rate and interest rate risk. We do not use derivative financial instruments for trading or speculative purposes. All of our derivative financial instruments are customized derivative transactions and are not exchange-traded. Management reviews our hedging program, derivative positions, and overall risk management strategy on a regular basis. We only enter into transactions that we believe will be highly effective at offsetting the underlying risk. Our use of derivatives involves the risk that counterparties may default on a derivative contract. We establish exposure limits for each counterparty to minimize this risk and provide counterparty diversification. Substantially all of our derivative exposures are with counterparties that have long-term credit ratings of single-A or better. We enter into master agreements with counterparties that generally allow for netting of certain exposures; thereby significantly reducing the
63
PROLOGIS, INC. AND PROLOGIS, L.P.
NOTES TO THE CONSOLIDATED FINANCIAL STATEMENTS (CONTINUED)
actual loss that would be incurred should a counterparty fail to perform its contractual obligations. To mitigate pre-settlement risk, minimum credit standards become more stringent as the duration of the derivative financial instrument increases. On the basis of these factors, we consider the risk of counterparty default to be minimal.
We recognize all derivatives at fair value within the line items Other Assets or Other Liabilities, as applicable. We do not net our derivative position by counterparty for purposes of balance sheet presentation and disclosure. Derivatives can be designated as fair value hedges, cash flow hedges or hedges of net investments in foreign operations. The accounting for gains and losses that result from changes in the fair values of derivative instruments depends on whether the derivatives are designated as, and qualify as, hedging instruments. For derivatives that will be accounted for as hedging instruments, at inception of the transaction, we formally designate and document the financial instrument as a hedge of a specific underlying exposure, the risk management objective and the strategy for undertaking the hedge transaction. In addition, we formally assess both at inception and at least quarterly thereafter, the effectiveness of our hedging transactions. Changes in the fair value of derivatives that are designated and qualify as cash flow hedges and hedges of net investments in foreign operations are recorded in AOCI. The ineffective portion of a derivative financial instrument's change in fair value, if any, is immediately recognized in earnings. Due to the high degree of effectiveness between the hedging instruments and the underlying exposures hedged, fluctuations in the value of the derivative instruments will generally be offset by changes in the fair values or cash flows of the underlying exposures being hedged. We also use derivatives that are not designated as hedges (and may not meet the hedge accounting requirements) to manage certain risk. The changes in fair values of derivatives that were not designated or did not qualify as hedging instruments are immediately recognized in earnings. For cash flow hedges, we reclassify changes in the fair value of derivatives into the applicable line item in the Consolidated Statements of Income in which the hedged items are recorded in the same period that the underlying hedged items affect earnings.
Foreign Currency. We primarily manage our foreign currency exposure by borrowing in the currencies in which we invest. In certain circumstances, we may issue debt in a currency that is not the same functional currency of the borrowing entity to offset the translation and economic exposures related to our net investment in international subsidiaries. To mitigate the impact in earnings of translation from the fluctuations in exchange rates, we may designate the debt as a nonderivative financial instrument hedge. We also hedge our investments in certain international subsidiaries using foreign currency derivative contracts (net investment hedges) to offset the translation and economic exposures related to our investments in these subsidiaries by locking in a forward exchange rate at the inception of the hedge. To the extent we have an effective hedging relationship, we report all changes in fair value of the hedged portion of the nonderivative financial instruments and net investment hedges in equity in the foreign currency translation component of AOCI. These amounts offset the translation adjustments on the underlying net assets of our foreign investments, which we also record in AOCI. The foreign currency translation changes of the portion of the nonderivative financial instruments that are not designated as hedges are recorded directly in earnings within the line item Foreign Currency and Derivative Gains (Losses), Net in the Consolidated Statements of Income. We recognize ineffectiveness, if any, in earnings at the time the ineffectiveness occurred.
We may use foreign currency option contracts, including puts, calls and collars to mitigate foreign currency exchange rate risk associated with the translation of our projected earnings of our international subsidiaries, principally in Canada, Europe and Japan. Put option contracts provide us with the option to exchange foreign currency for U.S. dollars at a fixed exchange rate if the foreign currency were to depreciate against the U.S. dollar. Call option contracts create an obligation to exchange foreign currency for U.S. dollars at a fixed exchange rate if the foreign currency were to appreciate against the U.S. dollar. Collar option contracts combine the put and call options into one contract to effectively lock in a range around the rate at which net operating income of our subsidiaries will be translated into U.S. dollars. Foreign currency option contracts are not designated as hedges as they do not meet hedge accounting requirements. Changes in the fair value of non-hedge designated derivatives are recorded directly in earnings within the line item Foreign Currency and Derivative Gains (Losses), Net.
We may also use foreign currency forwards designed as cash flow hedges to mitigate foreign currency exchange rate risk associated with payments in a currency that is not the functional currency of our foreign subsidiaries. To the extent we have an effective hedging relationship, we report all changes in fair value of the hedged portion of the foreign currency forwards cash flow hedges in AOCI. We recognize ineffectiveness, if any, in earnings at the time the ineffectiveness occurred.
Interest Rate. Our interest rate risk management strategy is to limit the impact of future interest rate changes on earnings and cash flows as well as to stabilize interest expense and manage our exposure to interest rate movements. We primarily accomplish this by issuing fixed rate debt with staggering maturities. We may enter into interest rate swap agreements, which allow us to borrow on a fixed rate basis for longer-term debt issuances. We typically designate our interest rate swap and interest rate cap agreements as cash flow hedges as these derivative instruments may be used to manage the interest rate risk on potential future debt issuances or to fix the interest rate on variable rate debt issuances. The maximum length of time that we hedge our exposure to future cash flows is typically 10 years or less. We have entered into interest rate swap agreements that allow us to receive variable-rate amounts from a counterparty in exchange for us making fixed-rate payments over the life of our agreements without the exchange of the underlying notional amount.
We report the effective portion of the gain or loss on the derivative as a component of AOCI, and reclassify it to Interest Expense in the Consolidated Statements of Income over the corresponding period of the hedged item. To the extent the hedged debt is paid off early, we write off the remaining balance in AOCI and we recognize the amount in Interest Expense in the Consolidated Statements of Income. We recognize losses on a derivative representing hedge ineffectiveness in Interest Expense at the time the ineffectiveness occurred.
64
PROLOGIS, INC. AND PROLOGIS, L.P.
NOTES TO THE CONSOLIDATED FINANCIAL STATEMENTS (CONTINUED)
Costs of Raising Capital. We treat costs incurred in connection with the issuance of common and preferred stock as a reduction to additional paid-in capital. We capitalize costs incurred in connection with the issuance of debt. Costs related to our credit facilities are included in Other Assets and costs related to all our other debt are recorded as a direct reduction of the liability. Costs associated with debt modifications are expensed when incurred.
AOCI. For the Parent, we include AOCI as a separate component of stockholders' equity in the Consolidated Balance Sheets. For the Operating Partnership, AOCI is included in partners’ capital in the Consolidated Balance Sheets. Any reference to AOCI in this document is referring to the component of stockholders’ equity for the Parent and partners’ capital for the Operating Partnership.
Noncontrolling Interests. Noncontrolling interests represent the share of consolidated entities owned by third parties. We recognize each noncontrolling holder’s respective share of the estimated fair value of the net assets at the date of formation or acquisition. Noncontrolling interests are subsequently adjusted for the noncontrolling holder’s share of additional contributions, distributions and their share of the net earnings or losses of each respective consolidated entity. We allocate net income to noncontrolling interests based on the weighted-average ownership interest during the period. The net income that is not attributable to us is reflected in the line item Net Earnings Attributable to Noncontrolling Interests. We do not recognize a gain or loss on transactions with a consolidated entity in which we do not own 100% of the equity, but we reflect the difference in cash received or paid from the noncontrolling interests carrying amount as paid-in-capital.
Certain limited partnership interests are exchangeable into our common stock. Common stock issued upon exchange of a holder’s noncontrolling interest is accounted for at the carrying value of the surrendered limited partnership interest.
Revenue Recognition.
Rental Revenues. We lease our operating properties to customers under agreements that are classified as operating leases. We recognize the total minimum lease payments provided for under the leases on a straight-line basis over the lease term. Generally, under the terms of our leases, the majority of our rental expenses are recovered from our customers. We reflect amounts recovered from customers as revenues in the period that the applicable expenses are incurred. We make a provision for possible loss if the collection of a receivable balance is considered doubtful.
Strategic Capital Revenues. Strategic capital revenues include revenues we earn from the management services we provide to unconsolidated entities. These fees are determined in accordance with the terms specific to each arrangement and may include property and asset management fees or transactional fees for leasing, acquisition, development, construction, financing, legal and tax services provided. We may also earn incentive returns (called “promotes”) based on third-party investor returns over time, which may be during the duration of the venture or at the time of liquidation. We recognize fees when they are earned, fixed and determinable. We report these fees in Strategic Capital Revenues. The fees we earn to develop properties within these ventures are reflected in Development Management and Other Revenues on a percentage of completion basis.
We also earned fees from ventures that we consolidate. Upon consolidation these fees were eliminated from our earnings and the third party share of these fees were recognized as a reduction of Net Earnings Attributable to Noncontrolling Interests.
Gains (Losses) on Dispositions of Investments in Real Estate. We recognize gains on the disposition of real estate when the recognition criteria have been met, generally at the time the risks and rewards and title have transferred and we no longer have substantial continuing involvement with the real estate sold. We recognize losses from the disposition of real estate when known.
When we contribute a property to an unconsolidated entity in which we have an ownership interest, we do not recognize a portion of the gain realized. The amount of gain not recognized, based on our ownership interest in the entity acquiring the property, is deferred by recognizing a reduction to our investment in the applicable unconsolidated entity. We adjust our proportionate share of net earnings or losses recognized in future periods to reflect the entities’ recorded depreciation expense as if it were computed on our lower basis in the contributed properties rather than on the entity’s basis.
When a property that we originally contributed to an unconsolidated entity is disposed of to a third party, we recognize the amount of the gain we previously deferred, along with our proportionate share of the gain recognized by the unconsolidated entity. If our ownership interest in an unconsolidated entity decreases and the decrease is expected to be permanent, we recognize the amounts relating to previously deferred gains to coincide with our new ownership interest.
Rental Expenses. Rental expenses primarily include the cost of our property management personnel, utilities, repairs and maintenance, property insurance and real estate taxes.
Strategic Capital Expenses. Strategic capital expenses generally include the direct expenses associated with the asset management of the unconsolidated co-investment ventures provided by our employees who are assigned to our Strategic Capital segment. In addition, in order to achieve efficiencies and economies of scale, all of our property management functions are provided by property management personnel who are assigned to our Real Estate Operations segment. These individuals perform the property-level management of the properties in our owned and managed portfolio, which include properties we consolidate and those we manage that are owned by the unconsolidated co-investment ventures. We allocate the costs of our property management to the properties we
65
PROLOGIS, INC. AND PROLOGIS, L.P.
NOTES TO THE CONSOLIDATED FINANCIAL STATEMENTS (CONTINUED)
consolidate (included in Rental Expenses) and the properties owned by the unconsolidated co-investment ventures (included in Strategic Capital Expenses) by using the square feet owned by the respective portfolios.
Equity-Based Compensation. We account for equity-based compensation by measuring the cost of employee services received in exchange for an award of an equity instrument based on the fair value of the award on the grant date. We recognize the cost of the award on a straight-line basis over the period during which an employee is required to provide service in exchange for the award, generally the vesting period.
Income Taxes. Under the Internal Revenue Code, REITs are generally not required to pay federal income taxes if they distribute 100% of their taxable income and meet certain income, asset and stockholder tests. If we fail to qualify as a REIT in any taxable year, we will be subject to federal income taxes at regular corporate rates (including any alternative minimum tax) and may not be able to qualify as a REIT for the four subsequent taxable years. Even as a REIT, we may be subject to certain state and local taxes on our own income and property, and to federal income and excise taxes on our undistributed taxable income.
We have elected taxable REIT subsidiary (“TRS”) status for some of our consolidated subsidiaries. This allows us to provide services that would otherwise be considered impermissible for REITs. Many of the foreign countries in which we have operations do not recognize REITs or do not accord REIT status under their respective tax laws to our entities that operate in their jurisdiction. In the U.S., we are taxed in certain states in which we operate. Accordingly, we recognize income tax expense for the federal and state income taxes incurred by our TRSs, taxes incurred in certain states and foreign jurisdictions, and interest and penalties associated with our unrecognized tax benefit liabilities.
We evaluate tax positions taken in the Consolidated Financial Statements under the interpretation for accounting for uncertainty in income taxes. As a result of this evaluation, we may recognize a tax benefit from an uncertain tax position only if it is more likely than not that the tax position will be sustained on examination by taxing authorities.
We recognize deferred income taxes in certain taxable entities. For federal income tax purposes, certain acquisitions have been treated as tax-free transactions resulting in a carry-over basis in assets and liabilities. For financial reporting purposes and in accordance with purchase accounting, we record all of the acquired assets and assumed liabilities at the estimated fair value at the date of acquisition. For our taxable subsidiaries, including certain international jurisdictions, we recognize the deferred income tax liabilities that represent the tax effect of the difference between the tax basis carried over and the fair value of the tangible and intangible assets at the date of acquisition. Any subsequent increases or decreases to the deferred income tax liability recorded in connection with these acquisitions, related to tax uncertainties acquired, are reflected in earnings.
If taxable income is generated in these subsidiaries, we recognize a benefit in earnings as a result of the reversal of the deferred income tax liability previously recorded at the acquisition date and we record current income tax expense representing the entire current income tax liability. If the reversal of the deferred income tax liability results from a sale or contribution of assets, the classification of the reversal to the Consolidated Statement of Income is based on the taxability of the transaction. We record the reversal to deferred income tax benefit as a taxable transaction if we dispose of the asset. We record the reversal as Gains on Dispositions of Investments in Real Estate and Revaluation of Equity Investments Upon Acquisition of a Controlling Interest, Net as a non-taxable transaction if we dispose of the asset along with the entity that owns the asset.
Deferred income tax expense is generally a function of the period’s temporary differences (items that are treated differently for tax purposes than for financial reporting purposes) and the utilization of tax net operating losses (“NOL”) generated in prior years that had been previously recognized as deferred income tax assets. We provide for a valuation allowance for deferred income tax assets if we believe all or some portion of the deferred income tax asset may not be realized. Any increase or decrease in the valuation allowance that results from a change in circumstances that causes a change in the estimated ability to realize the related deferred income tax asset is included in deferred tax expense.
Environmental Costs. We incur certain environmental remediation costs, including cleanup costs, consulting fees for environmental studies and investigations, monitoring costs, and legal costs relating to cleanup, litigation defense, and the pursuit of responsible third parties. We expense costs incurred in connection with operating properties and properties previously sold. We capitalize costs related to undeveloped land as development costs and include any expected future environmental liabilities at the time of acquisition. We include costs incurred for properties to be disposed in the cost of the properties upon disposition. We maintain a liability for the estimated costs of environmental remediation expected to be incurred in connection with undeveloped land, operating properties and properties previously sold that we adjust as appropriate as information becomes available.
New Accounting Pronouncements.
New Accounting Standards Adopted
In August 2016, the Financial Accounting Standards Board (“FASB”) issued an accounting standard update that provides guidance for areas in which there is diversity in how certain cash receipts and payments are presented and classified in the statements of cash flows. The update clarifies the classification methodology within the statements of cash flows for eight specific topics. In 2016, we early adopted the standard in its entirety on a retrospective basis, and we determined that the only clarification to significantly impact us was the classification of distributions received from equity method investments. The update allows for the election to classify distributions
66
PROLOGIS, INC. AND PROLOGIS, L.P.
NOTES TO THE CONSOLIDATED FINANCIAL STATEMENTS (CONTINUED)
received from equity method investments based on either a cumulative earnings approach or a nature of distribution approach. We have elected the nature of distribution approach, in which cash flows generated from the operations of an unconsolidated entity are classified as a return on investment (cash inflow from operating activities) and cash flows that are generated from property sales, debt refinancing or sales of our investments are classified as a return of investment (cash inflow from investing activities). We adopted this approach based on the information available to us to determine the nature of the underlying activity that generated the distributions from unconsolidated entities. As a result of our adoption of this standard, we reclassified $140.6 million and $177.0 million of distributions from our unconsolidated entities into Net Cash Provided by Operating Activities that was previously reported as Net Cash Provided by (Used in) Investing Activities for the years ended December 31, 2015, and 2014, respectively.
In March 2016, the FASB issued an accounting standard update that amends the stock compensation requirements in existing GAAP. The update simplifies certain aspects of accounting for share-based payment transactions, including income tax consequences, statutory tax withholding requirements, forfeitures and classification of taxes paid to a tax authority by us when we withhold shares to cover employee withholding tax payments for certain stock compensation plans in the statements of cash flows. We adopted the standard in its entirety on a retrospective basis in 2016. As a result of our adoption of this standard, we reclassified payments of $12.3 million and $13.0 million from Net Cash Provided by Operating Activities to Net Cash Provided by (Used in) Financing Activities for the years ended December 31, 2015, and 2014, respectively.
In February 2015, the FASB issued an accounting standard update that amends the consolidation requirements in existing GAAP. Under the update, all entities, including limited partnerships and similar legal entities, are now within the scope of consolidation guidance, unless a scope exception applies. We adopted this standard on a modified retrospective basis on January 1, 2016, and the adoption did not have a significant effect on the Consolidated Financial Statements, however the Operating Partnership and certain of our consolidated co-investment ventures now qualify as VIEs under the new guidance, which required additional disclosures. See Note 12 for additional information about our VIEs.
New Accounting Standards Issued but not yet Adopted
In January 2017, the FASB issued an accounting standard update that clarifies the definition of a business. The update adds further guidance that assists preparers in evaluating whether a transaction will be accounted for as an acquisition of an asset or a business. We expect most of our acquisitions of operating properties and portfolios of operating properties to qualify as asset acquisitions under the standard which permits the capitalization of acquisition costs to the basis of the acquired buildings. This standard is effective for periods beginning after December 31, 2017, however we plan to adopt this standard in 2017 for the annual and interim reporting periods beginning after December 31, 2016. We do not expect the adoption to have a significant impact on the Consolidated Financial Statements.
In May 2014, the FASB issued an accounting standard that requires companies to use a five step model to determine when to recognize revenue from customer contracts in an effort to increase consistency and comparability throughout global capital markets and across industries. We are evaluating each of our revenue streams and related accounting policy under the standard. Rental revenues and recoveries earned from leasing our operating properties will be evaluated with the adoption of the lease accounting standard (discussed below). Our evaluation under the revenue recognition standard also includes sales to third parties and unconsolidated co-investment ventures as well as recurring fees and promotes earned from our co-investment ventures. For sales to third parties, primarily a result of disposition of real estate in exchange for cash with few contingencies, we do not expect the standard to significantly impact the recognition of or accounting for these sales. Due to our continuing involvement through our equity ownership in our unconsolidated co-investment ventures, we are evaluating the accounting for sales to unconsolidated co-investment ventures under the standard. Additionally, while we do not expect changes in the recognition of recurring fees earned from the co-investment ventures, we are evaluating both the timing and measurement of promotes earned from co-investment ventures under the standard that may result in recognizing such fees when they are probable of being earned. The standard is effective for us on January 1, 2018. In addition to the recognition changes discussed above, expanded quantitative and qualitative disclosures regarding revenue recognition will be required for contracts that are subject to the standard. We expect to adopt the standard on a modified retrospective basis.
In February 2016, the FASB issued an accounting standard that provides the principles for the recognition, measurement, presentation and disclosure of leases.
The accounting for lessors will remain largely unchanged from current GAAP; however, the standard requires that lessors expense, on an as-incurred basis, certain initial direct costs that are not incremental in negotiating a lease. Under existing standards, certain of these costs are capitalizable and therefore this new standard may result in certain of these costs being expensed as incurred after adoption. This standard may also impact the timing, recognition and disclosures related to our rental recoveries from tenants earned from leasing our operating properties.
Under the standard, lessees apply a dual approach, classifying leases as either finance or operating leases. A lessee is required to record a right-of-use asset and a lease liability for all leases with a term of greater than 12 months, regardless of their lease classification. Based on our real estate leases, we are a lessee on ground leases in certain markets and office space leases. Due to the length of the lease terms of certain ground leases, it is likely they will be classified as finance leases under the standard. At December 31, 2016, we have approximately 90 ground and office space leases that will require us to measure and record a right-of-use asset and a lease liability upon adoption of the standard. Details of our future minimum rental payments under these ground and office space leases are disclosed in Note 4.
67
PROLOGIS, INC. AND PROLOGIS, L.P.
NOTES TO THE CONSOLIDATED FINANCIAL STATEMENTS (CONTINUED)
The standard is effective for us on January 1, 2019. We are assessing the practical expedients available for implementation under the standard. If the practical expedients are elected, we would not be required to reassess (i) whether an expired or existing contract meets the definition of a lease, (ii) the lease classification at the adoption date for expired or existing leases, and (iii) whether costs previously capitalized as initial direct costs would continue to be amortized. The standard will also require new disclosures within the notes accompanying our consolidated financial statements. We will continue to assess the method of adoption and the overall impact the adoption will have on the Consolidated Financial Statements.
KTR Capital Partners and Its Affiliates
On May 29, 2015, we acquired the high quality real estate assets and operating platform with high profile customers and comparable market composition to ours from KTR Capital Partners and its affiliates (“KTR”). The portfolio consisted of 315 operating properties, aggregating 59.0 million square feet, 3.6 million square feet of properties under development and land parcels that will support an estimated build out of 6.8 million square feet. The properties were acquired by our consolidated co-investment venture Prologis U.S. Logistics Venture (“USLV”), of which we own 55%. The transaction was funded through cash (which included the contribution of $2.3 billion from our venture partner and the proceeds from the issuance of debt, as detailed in Note 9), the assumption of secured mortgage debt and the issuance of 4.5 million common limited partnership units in the Operating Partnership. We incurred $24.7 million of acquisition costs that are included in Other Expenses during 2015.
The allocation of the purchase price required a significant amount of judgment and was based on our valuations, estimates and assumptions of the acquisition date fair value of the tangible and intangible assets acquired and liabilities assumed. The adjustments finalizing the purchase price allocation during the measurement period were not considered to be material to our financial position or results of operations.
The allocation of the purchase price was as follows (in thousands):
|
Investments in real estate properties |
|
$ |
5,441,384 |
|
|
Intangible assets, net of intangible liabilities |
|
|
332,708 |
|
|
Accounts receivable and other assets |
|
|
8,062 |
|
|
Debt, including premium |
|
|
(735,172 |
) |
|
Accounts payable, accrued expenses and other liabilities |
|
|
(56,313 |
) |
|
Total estimated purchase price |
|
|
4,990,669 |
|
|
Our venture partner’s share of purchase price |
|
|
(2,253,234 |
) |
|
Common limited partnership units issued in the Operating Partnership |
|
|
(181,170 |
) |
|
Prologis share of cash purchase price |
|
$ |
2,556,265 |
|
The following unaudited pro forma financial information presents our results as though the KTR transaction had been completed on January 1, 2014. The pro forma information does not reflect the actual results of operations had the transaction actually been completed on January 1, 2014, and it is not indicative of future operating results. The results for the year ended December 31, 2015, include approximately seven months of actual results for the transaction, the acquisition expenses, and five months of pro forma adjustments. Actual results in 2015 include rental revenues and rental expenses of the properties acquired of $235.7 million and $56.9 million, respectively, representing the period from acquisition through December 31, 2015.
The following amounts are in thousands, except per share amounts:
|
|
|
2015 |
|
|
2014 |
|
||
|
Total revenues |
|
$ |
2,358,643 |
|
|
$ |
2,064,724 |
|
|
Net earnings attributable to common stockholders |
|
$ |
866,753 |
|
|
$ |
537,861 |
|
|
Net earnings per share attributable to common stockholders – Basic |
|
$ |
1.66 |
|
|
$ |
1.08 |
|
|
Net earnings per share attributable to common stockholders – Diluted |
|
$ |
1.65 |
|
|
$ |
1.07 |
|
These results include certain adjustments, primarily: (i) decreased revenues from the amortization of the net assets from the acquired leases with net favorable rents relative to estimated market rents; (ii) increased depreciation and amortization expense resulting from the adjustment of real estate assets to estimated fair value and recognition of intangible assets related to in-place leases; and (iii) additional interest expense attributable to the debt issued to finance our cash portion of the acquisition offset by lower interest expense due to the accretion of the fair value adjustment of debt.
Acquisition of a Controlling Interest in Prologis North American Industrial Fund
During 2014, we increased our ownership in Prologis North American Industrial Fund (“NAIF”) from 23.1% to 66.1% by acquiring the equity units from all but one partner for an aggregate of $679.0 million. This included the acquisition of $46.8 million of equity units on October 20, 2014, that resulted in our gaining control over NAIF, based on the rights of the limited partners, and therefore we began
68
PROLOGIS, INC. AND PROLOGIS, L.P.
NOTES TO THE CONSOLIDATED FINANCIAL STATEMENTS (CONTINUED)
consolidating NAIF at that date and recognized a gain of $201.3 million in Gains on Dispositions of Investments in Real Estate and Revaluation of Equity Investments upon Acquisition of a Controlling Interest, Net.
The total purchase price was $1.1 billion, which included our investment in NAIF at the time of consolidation. The adjustments finalizing the purchase price allocation during the measurement period were not considered to be material to our financial position or results of operations.
The allocation of the purchase price was as follows (in thousands):
|
Investments in real estate properties |
|
$ |
2,658,252 |
|
|
Intangible assets, net of intangible liabilities |
|
|
138,185 |
|
|
Cash |
|
|
87,780 |
|
|
Accounts receivable and other assets |
|
|
5,664 |
|
|
Debt, including premium |
|
|
(1,195,213 |
) |
|
Accounts payable, accrued expenses and other liabilities |
|
|
(57,655 |
) |
|
Noncontrolling interests |
|
|
(554,493 |
) |
|
Total purchase price |
|
$ |
1,082,520 |
|
Actual results in 2014 included rental revenues and rental expenses of the properties acquired in the NAIF acquisition of $49.2 million and $13.3 million, respectively, offset by the impact of noncontrolling interests.
Investments in real estate properties consisted of the following at December 31 (dollars and square feet in thousands):
|
|
Square Feet |
|
|
Number of Buildings |
|
|
|
|
|||||||||||||||
|
|
2016 |
|
|
2015 |
|
|
2016 |
|
|
2015 |
|
|
2016 |
|
|
2015 |
|
||||||
|
Operating properties: |
|
|
|
|
|
|
|
|
|
|
|
|
|
|
|
|
|
|
|
|
|
|
|
|
Buildings and improvements |
|
331,210 |
|
|
|
333,830 |
|
|
|
1,776 |
|
|
|
1,872 |
|
|
$ |
17,905,914 |
|
|
$ |
17,861,693 |
|
|
Improved land |
|
|
|
|
|
|
|
|
|
|
|
|
|
|
|
|
|
6,037,543 |
|
|
|
5,874,052 |
|
|
Development portfolio, including land costs: |
|
|
|
|
|
|
|
|
|
|
|
|
|
|
|
|
|
|
|
|
|
|
|
|
Prestabilized |
|
8,256 |
|
|
|
12,598 |
|
|
|
29 |
|
|
|
28 |
|
|
|
798,233 |
|
|
|
918,099 |
|
|
Properties under development |
|
19,539 |
|
|
|
19,630 |
|
|
|
60 |
|
|
|
63 |
|
|
|
633,849 |
|
|
|
954,804 |
|
|
Land (1) |
|
|
|
|
|
|
|
|
|
|
|
|
|
|
|
|
|
1,218,904 |
|
|
|
1,359,794 |
|
|
Other real estate investments (2) |
|
|
|
|
|
|
|
|
|
|
|
|
|
|
|
|
|
524,887 |
|
|
|
552,926 |
|
|
Total investments in real estate properties |
|
|
|
|
|
|
|
|
|
|
|
|
|
|
|
|
|
27,119,330 |
|
|
|
27,521,368 |
|
|
Less accumulated depreciation |
|
|
|
|
|
|
|
|
|
|
|
|
|
|
|
|
|
3,758,372 |
|
|
|
3,274,284 |
|
|
Net investments in real estate properties |
|
|
|
|
|
|
|
|
|
|
|
|
|
|
|
|
$ |
23,360,958 |
|
|
$ |
24,247,084 |
|
|
(1) |
Included in our investments in real estate at December 31, 2016, and 2015 were 5,892 and 7,404 acres of land, respectively. |
|
(2) |
Included in other real estate investments are: (i) non-logistics real estate; (ii) land parcels that are ground leased to third parties; (iii) our corporate office buildings; (iv) infrastructure costs related to projects we are developing on behalf of others; (v) costs related to future development projects, including purchase options on land; and (vi) earnest money deposits associated with potential acquisitions. |
At December 31, 2016, we owned real estate assets in the U.S. and other Americas (Canada and Mexico), Europe (Austria, Belgium, the Czech Republic, France, Germany, Hungary, Italy, the Netherlands, Poland, Slovakia, Spain, Sweden and the United Kingdom (“U.K.”)) and Asia (China, Japan and Singapore).
Acquisitions
The following table summarizes our acquisitions of properties from third parties for the years ended December 31 (dollars and square feet in thousands):
|
|
|
2016 |
|
|
2015 |
|
|
2014 |
|
|||
|
Number of operating properties |
|
|
9 |
|
|
|
52 |
|
|
|
8 |
|
|
Square feet |
|
|
1,823 |
|
|
|
7,375 |
|
|
|
1,004 |
|
|
Real estate acquisition value (1) |
|
$ |
411,706 |
|
|
$ |
1,042,562 |
|
|
$ |
548,201 |
|
|
(1) |
Value includes the acquisition of 776, 690, and 1,040 acres of land in 2016, 2015 and 2014, respectively. |
69
PROLOGIS, INC. AND PROLOGIS, L.P.
NOTES TO THE CONSOLIDATED FINANCIAL STATEMENTS (CONTINUED)
The table above does not include the properties acquired in the KTR transaction, as this transaction is explained in Note 3.
Dispositions
The following table summarizes our real estate disposition activity for the years ended December 31 (dollars and square feet in thousands):
|
|
2016 |
|
|
2015 |
|
|
2014 |
|
|||
|
Contributions to unconsolidated co-investment ventures |
|
|
|
|
|
|
|
|
|
|
|
|
Number of properties |
|
35 |
|
|
|
31 |
|
|
|
126 |
|
|
Square feet |
|
11,624 |
|
|
|
8,355 |
|
|
|
25,247 |
|
|
Net proceeds (1) |
$ |
1,231,878 |
|
|
$ |
835,385 |
|
|
$ |
1,825,311 |
|
|
Net gains on contributions (1) |
$ |
267,441 |
|
|
$ |
148,987 |
|
|
$ |
188,268 |
|
|
Dispositions to third parties |
|
|
|
|
|
|
|
|
|
|
|
|
Number of properties |
|
172 |
|
|
|
136 |
|
|
|
145 |
|
|
Square feet |
|
20,360 |
|
|
|
23,024 |
|
|
|
19,856 |
|
|
Net proceeds (1) |
$ |
1,760,048 |
|
|
$ |
2,352,645 |
|
|
$ |
1,365,318 |
|
|
Net gains on dispositions (1) |
$ |
353,668 |
|
|
$ |
609,900 |
|
|
$ |
336,203 |
|
|
|
|
|
|
|
|
|
|
|
|
|
|
|
Total net gains on contributions and dispositions |
$ |
621,109 |
|
|
$ |
758,887 |
|
|
$ |
524,471 |
|
|
Gains on redemptions of investments in co-investment ventures (2) |
|
136,289 |
|
|
|
- |
|
|
|
- |
|
|
Gains on revaluation of equity investments upon acquisition of a controlling interest, net (3) |
|
- |
|
|
|
- |
|
|
|
201,319 |
|
|
Total gains on dispositions of investments in real estate, net |
$ |
757,398 |
|
|
$ |
758,887 |
|
|
$ |
725,790 |
|
|
(1) |
Includes the disposition of land parcels. |
|
(2) |
See Note 5 for more information on these transactions. |
|
(3) |
See Note 3 for more information on this transaction. |
In 2014, we launched the initial public offering of FIBRA Prologis, a Mexican REIT. In connection with the offering, FIBRA Prologis purchased 177 properties aggregating 29.7 million square feet (12.6 million square feet related to our wholly owned portfolio, 7.6 million square feet from our consolidated co-investment venture Prologis Mexico Fondo Logistico (“AFORES”) and 9.5 million square feet from our unconsolidated co-investment venture Prologis Mexico Industrial Fund). Also in 2014, AFORES contributed its remaining operating properties and the balance of its secured debt to FIBRA Prologis. The difference between the amount received and the noncontrolling interests balance related to the properties contributed was $34.6 million, and was adjusted through equity with no gain or loss recognized. On the basis of this transaction, we recognized a gain on disposition of investments in real estate of $52.5 million; current tax expense of $32.4 million; deferred tax benefit of $55.5 million; and earnings attributable to noncontrolling interest of $61.0 million.
Operating Lease Agreements
We lease our operating properties and certain land parcels to customers under agreements that are generally classified as operating leases. Our weighted average lease term remaining, based on square feet for all leases in effect at December 31, 2016, was four years.
The following table summarizes our minimum lease payments on leases with lease periods greater than one year for space in our operating properties, pre-stabilized development properties and leases of land subject to ground leases at December 31, 2016 (in thousands):
|
2017 |
|
$ |
1,633,990 |
|
|
2018 |
|
|
1,488,049 |
|
|
2019 |
|
|
1,239,683 |
|
|
2020 |
|
|
1,038,305 |
|
|
2021 |
|
|
809,961 |
|
|
Thereafter |
|
|
2,391,452 |
|
|
Total |
|
$ |
8,601,440 |
|
These amounts do not reflect future rental revenues from the renewal or replacement of existing leases and exclude reimbursements of operating expenses.
70
PROLOGIS, INC. AND PROLOGIS, L.P.
NOTES TO THE CONSOLIDATED FINANCIAL STATEMENTS (CONTINUED)
We have entered into operating ground leases as a lessee on certain land parcels, primarily on-tarmac facilities and office space with remaining lease terms of 1 to 73 years. The following table summarizes our future minimum rental payments under non-cancelable operating leases in effect at December 31, 2016 (in thousands):
|
2017 |
|
$ |
30,976 |
|
|
2018 |
|
|
32,035 |
|
|
2019 |
|
|
29,520 |
|
|
2020 |
|
|
28,379 |
|
|
2021 |
|
|
24,480 |
|
|
Thereafter |
|
|
332,835 |
|
|
Total |
|
$ |
478,225 |
|
NOTE 5. UNCONSOLIDATED ENTITIES
Summary of Investments
We have investments in entities through a variety of ventures. We co-invest in entities that own multiple properties with partners and investors and provide asset and property management services to these entities, which we refer to as co-investment ventures. These entities may be consolidated or unconsolidated, depending on the structure, our partner’s participation and other rights and our level of control of the entity. This note details our investments in unconsolidated co-investment ventures, which are accounted for using the equity method of accounting. See Note 12 for more detail regarding our consolidated investments.
We also have other ventures, generally with one partner and that we do not manage, which we account for using the equity method. We refer to our investments in all entities accounted for using the equity method, both unconsolidated co-investment ventures and other ventures, collectively, as unconsolidated entities.
The following table summarizes our investments in and advances to our unconsolidated entities at December 31 (in thousands):
|
|
|
2016 |
|
|
2015 |
|
||
|
Unconsolidated co-investment ventures |
|
$ |
4,057,524 |
|
|
$ |
4,585,427 |
|
|
Other ventures |
|
|
172,905 |
|
|
|
170,193 |
|
|
Totals |
|
$ |
4,230,429 |
|
|
$ |
4,755,620 |
|
Unconsolidated Co-Investment Ventures
The following table summarizes our investments in the individual co-investment ventures at December 31 (dollars in thousands):
|
|
|
Ownership Percentage |
|
|
Investment in and Advances to |
|
||||||||||
|
Co-Investment Venture |
|
2016 |
|
|
2015 |
|
|
2016 |
|
|
2015 |
|
||||
|
Prologis Targeted U.S. Logistics Fund, L.P. (“USLF”) (1) |
|
|
14.9 |
% |
|
|
22.5 |
% |
|
$ |
434,818 |
|
|
$ |
689,408 |
|
|
FIBRA Prologis (2) (3) |
|
|
45.9 |
% |
|
|
45.9 |
% |
|
|
547,744 |
|
|
|
569,800 |
|
|
Prologis Brazil Logistics Partners Fund I, L.P. (“Brazil Fund”) and related joint ventures (4) |
|
various |
|
|
various |
|
|
|
297,300 |
|
|
|
216,668 |
|
||
|
Europe Logistics Venture 1, FCP-FIS (“ELV”) (5) (6) |
|
|
15.0 |
% |
|
|
15.0 |
% |
|
|
48,289 |
|
|
|
53,960 |
|
|
Prologis European Logistics Partners Sàrl (“PELP”) (5) |
|
|
50.0 |
% |
|
|
50.0 |
% |
|
|
1,623,707 |
|
|
|
1,762,291 |
|
|
Prologis European Properties Fund II, FCP-FIS (“PEPF II”) |
|
|
31.2 |
% |
|
|
31.3 |
% |
|
|
344,200 |
|
|
|
410,984 |
|
|
Prologis Targeted Europe Logistics Fund, FCP-FIS (“PTELF”) (1) (6) |
|
|
23.5 |
% |
|
|
41.6 |
% |
|
|
310,118 |
|
|
|
480,401 |
|
|
Nippon Prologis REIT, Inc. (“NPR”) (7) (8) |
|
|
15.1 |
% |
|
|
15.1 |
% |
|
|
348,570 |
|
|
|
300,822 |
|
|
Prologis China Logistics Venture I, LP and II, LP (Prologis China Logistics Venture) (5) |
|
|
15.0 |
% |
|
|
15.0 |
% |
|
|
102,778 |
|
|
|
101,093 |
|
|
Totals |
|
|
|
|
|
|
|
|
|
$ |
4,057,524 |
|
|
$ |
4,585,427 |
|
|
(1) |
During 2016, we redeemed a portion of our investment in PTELF and USLF for €275.0 million ($311.1 million) and $300.0 million, respectively, and recorded a gain of $136.3 million, which is included in Gains on the Dispositions of Investments in Real Estate and Revaluation of Equity Investments Upon Acquisition of a Controlling Interest, Net. The amounts received for the redemptions were included in Return of Investment from Unconsolidated Entities in the Consolidated Statements of Cash Flows. |
|
(2) |
At December 31, 2016, we owned 291.1 million units of FIBRA Prologis that had a closing price of Ps 29.69 ($1.44) per unit on the Mexican Stock Exchange. |
71
PROLOGIS, INC. AND PROLOGIS, L.P.
NOTES TO THE CONSOLIDATED FINANCIAL STATEMENTS (CONTINUED)
|
(3) |
We have granted FIBRA Prologis a right of first refusal with respect to stabilized properties that we plan to sell in Mexico. |
|
(4) |
We have a 50% ownership interest in and consolidate an entity that in turn owns 50% of several entities that we account for on the equity method. Also, we have additional investments in other unconsolidated entities in Brazil that we account for on the equity method with various ownership interests ranging from 5% to 50%. |
|
(5) |
We have one partner in each of these co-investment ventures. |
|
(6) |
In January 2017, we sold our investment in ELV to our fund partner and ELV contributed its properties to PTELF in exchange for equity interests. |
|
(7) |
At December 31, 2016, we owned 0.3 million units of NPR that had a closing price of ¥238,900 ($2,041) per share on the Tokyo Stock Exchange. At December 31, 2016 and 2015, we had receivables from NPR of $96.9 million and $85.2 million, respectively, related to customer security deposits that originated through a leasing company owned by us that pertain to properties owned by NPR. We have a corresponding payable to NPR’s customers in Other Liabilities. |
|
(8) |
For any properties we develop and plan to sell in Japan, we have committed to offer those properties to NPR. |
The amounts recognized in Strategic Capital Revenues and Earnings from Unconsolidated Entities, Net depend on the size and operations of the co-investment ventures, the timing of revenues earned through promotes during the life of a venture or upon liquidation, as well as fluctuations in foreign currency exchange rates. We recognized Strategic Capital Expenses for direct costs associated with the asset management of these ventures and allocated property-level management costs for the properties owned by the ventures. Our ownership interest in these ventures also impacts the earnings we recognize.
The following table summarizes the amounts we recognized in the Consolidated Statements of Income related to the unconsolidated co-investment ventures for the years ended December 31 (in thousands):
|
|
|
2016 |
|
|
2015 |
|
|
2014 |
|
|||
|
Strategic capital revenues and other revenues: |
|
|
|
|
|
|
|
|
|
|
|
|
|
U.S. |
|
$ |
37,911 |
|
|
$ |
36,964 |
|
|
$ |
81,351 |
|
|
Other Americas |
|
|
22,777 |
|
|
|
22,516 |
|
|
|
13,003 |
|
|
Europe |
|
|
184,956 |
|
|
|
112,675 |
|
|
|
86,487 |
|
|
Asia |
|
|
46,521 |
|
|
|
35,453 |
|
|
|
37,509 |
|
|
Total strategic capital revenues |
|
|
292,165 |
|
|
|
207,608 |
|
|
|
218,350 |
|
|
Development management and other revenues |
|
|
11,006 |
|
|
|
7,467 |
|
|
|
5,424 |
|
|
Total strategic capital revenues and other revenues |
|
$ |
303,171 |
|
|
$ |
215,075 |
|
|
$ |
223,774 |
|
|
|
|
|
|
|
|
|
|
|
|
|
|
|
|
Earnings from unconsolidated co-investment ventures, net: |
|
|
|
|
|
|
|
|
|
|
|
|
|
U.S. |
|
$ |
10,441 |
|
|
$ |
7,124 |
|
|
$ |
16,420 |
|
|
Other Americas |
|
|
27,155 |
|
|
|
28,842 |
|
|
|
(7,824 |
) |
|
Europe |
|
|
137,652 |
|
|
|
106,656 |
|
|
|
108,430 |
|
|
Asia |
|
|
16,629 |
|
|
|
12,780 |
|
|
|
14,022 |
|
|
Total earnings from unconsolidated co-investment ventures, net |
|
$ |
191,877 |
|
|
$ |
155,402 |
|
|
$ |
131,048 |
|
|
|
|
|
|
|
|
|
|
|
|
|
|
|
The following table summarizes the promotes earned and recognized in Strategic Capital Revenues for the years ended December 31 (in thousands):
|
|
|
2016 |
|
|
2015 |
|
|
2014 |
|
|||
|
Strategic capital – promote revenues |
|
|
|
|
|
|
|
|
|
|
|
|
|
Total promote (1) |
|
$ |
99,766 |
|
|
$ |
56,637 |
|
|
$ |
42,132 |
|
|
Less: Prologis’ share |
|
|
11,222 |
|
|
|
27,175 |
|
|
|
10,852 |
|
|
Net promote recognized (third-party share) in strategic capital revenues |
|
$ |
88,544 |
|
|
$ |
29,462 |
|
|
$ |
31,280 |
|
|
(1) |
We earned promotes from PTELF and PEPF II in 2016, PELP and ELV in 2015 and USLF in 2014, each based on the venture’s cumulative returns to the investors over the last three years. |
Approximately 40% of promote revenues are paid as a combination of cash and stock awards pursuant to the terms of the Prologis Promote Plan and expensed through Strategic Capital Expenses. See Note 13 for more information on this plan.
72
PROLOGIS, INC. AND PROLOGIS, L.P.
NOTES TO THE CONSOLIDATED FINANCIAL STATEMENTS (CONTINUED)
The following tables summarize the operating information and financial position of our unconsolidated co-investment ventures (not our proportionate share), at December 31 and for the years ended December 31 as presented at our adjusted basis derived from the ventures’ GAAP information:
|
(dollars and square feet in millions) |
|
2016 |
|
|
2015 |
|
|
2014 |
|
|||
|
U.S.: |
|
|
|
|
|
|
|
|
|
|
|
|
|
Number of ventures |
|
|
1 |
|
|
|
1 |
|
|
|
1 |
|
|
Number of properties owned |
|
|
369 |
|
|
|
391 |
|
|
|
392 |
|
|
Square feet |
|
|
50 |
|
|
|
50 |
|
|
|
50 |
|
|
Total assets |
|
$ |
4,238 |
|
|
$ |
4,408 |
|
|
$ |
4,403 |
|
|
Third-party debt |
|
$ |
1,414 |
|
|
$ |
1,433 |
|
|
$ |
1,594 |
|
|
Total liabilities |
|
$ |
1,540 |
|
|
$ |
1,550 |
|
|
$ |
1,697 |
|
|
Our investment balance (1) |
|
$ |
435 |
|
|
$ |
690 |
|
|
$ |
712 |
|
|
Our weighted average ownership (2) |
|
|
14.9 |
% |
|
|
22.5 |
% |
|
|
24.3 |
% |
|
Other Americas: |
|
|
|
|
|
|
|
|
|
|
|
|
|
Number of ventures |
|
|
2 |
|
|
|
2 |
|
|
|
2 |
|
|
Number of properties owned |
|
|
213 |
|
|
|
205 |
|
|
|
198 |
|
|
Square feet |
|
|
42 |
|
|
|
39 |
|
|
|
37 |
|
|
Total assets |
|
$ |
2,793 |
|
|
$ |
2,482 |
|
|
$ |
2,653 |
|
|
Third-party debt |
|
$ |
739 |
|
|
$ |
657 |
|
|
$ |
679 |
|
|
Total liabilities |
|
$ |
814 |
|
|
$ |
708 |
|
|
$ |
717 |
|
|
Our investment balance (1) |
|
$ |
845 |
|
|
$ |
786 |
|
|
$ |
825 |
|
|
Our weighted average ownership (2) |
|
|
43.9 |
% |
|
|
43.8 |
% |
|
|
42.9 |
% |
|
Europe: |
|
|
|
|
|
|
|
|
|
|
|
|
|
Number of ventures |
|
|
4 |
|
|
|
4 |
|
|
|
4 |
|
|
Number of properties owned |
|
|
700 |
|
|
|
688 |
|
|
|
636 |
|
|
Square feet |
|
|
163 |
|
|
|
159 |
|
|
|
148 |
|
|
Total assets |
|
$ |
10,853 |
|
|
$ |
11,343 |
|
|
$ |
11,440 |
|
|
Third-party debt |
|
$ |
2,446 |
|
|
$ |
2,640 |
|
|
$ |
2,621 |
|
|
Total liabilities |
|
$ |
3,283 |
|
|
$ |
3,584 |
|
|
$ |
3,501 |
|
|
Our investment balance (1) |
|
$ |
2,327 |
|
|
$ |
2,707 |
|
|
$ |
2,773 |
|
|
Our weighted average ownership (2) |
|
|
35.1 |
% |
|
|
38.9 |
% |
|
|
38.8 |
% |
|
Asia: |
|
|
|
|
|
|
|
|
|
|
|
|
|
Number of ventures |
|
|
2 |
|
|
|
2 |
|
|
|
2 |
|
|
Number of properties owned |
|
|
85 |
|
|
|
66 |
|
|
|
52 |
|
|
Square feet |
|
|
36 |
|
|
|
29 |
|
|
|
26 |
|
|
Total assets |
|
$ |
5,173 |
|
|
$ |
4,320 |
|
|
$ |
4,120 |
|
|
Third-party debt |
|
$ |
1,947 |
|
|
$ |
1,520 |
|
|
$ |
1,637 |
|
|
Total liabilities |
|
$ |
2,239 |
|
|
$ |
1,751 |
|
|
$ |
1,734 |
|
|
Our investment balance (1) |
|
$ |
451 |
|
|
$ |
402 |
|
|
$ |
356 |
|
|
Our weighted average ownership (2) |
|
|
15.1 |
% |
|
|
15.0 |
% |
|
|
15.0 |
% |
|
Totals: |
|
|
|
|
|
|
|
|
|
|
|
|
|
Number of ventures |
|
|
9 |
|
|
|
9 |
|
|
|
9 |
|
|
Number of properties owned |
|
|
1,367 |
|
|
|
1,350 |
|
|
|
1,278 |
|
|
Square feet |
|
|
291 |
|
|
|
277 |
|
|
|
261 |
|
|
Total assets |
|
$ |
23,057 |
|
|
$ |
22,553 |
|
|
$ |
22,616 |
|
|
Third-party debt |
|
$ |
6,546 |
|
|
$ |
6,250 |
|
|
$ |
6,531 |
|
|
Total liabilities |
|
$ |
7,876 |
|
|
$ |
7,593 |
|
|
$ |
7,649 |
|
|
Our investment balance (1) |
|
$ |
4,058 |
|
|
$ |
4,585 |
|
|
$ |
4,666 |
|
|
Our weighted average ownership (2) |
|
|
27.9 |
% |
|
|
31.6 |
% |
|
|
32.0 |
% |
73
PROLOGIS, INC. AND PROLOGIS, L.P.
NOTES TO THE CONSOLIDATED FINANCIAL STATEMENTS (CONTINUED)
|
|
2016 |
|
|
2015 |
|
|
2014 (3) |
|
||||
|
Revenues: |
|
|
|
|
|
|
|
|
|
|
|
|
|
U.S. |
|
$ |
395 |
|
|
$ |
382 |
|
|
$ |
541 |
|
|
Other Americas |
|
|
242 |
|
|
|
228 |
|
|
|
170 |
|
|
Europe |
|
|
964 |
|
|
|
947 |
|
|
|
1,001 |
|
|
Asia: |
|
|
342 |
|
|
|
275 |
|
|
|
280 |
|
|
Total revenues |
|
$ |
1,943 |
|
|
$ |
1,832 |
|
|
$ |
1,992 |
|
|
|
|
|
|
|
|
|
|
|
|
|
|
|
|
Net earnings: |
|
|
|
|
|
|
|
|
|
|
|
|
|
U.S. |
|
$ |
57 |
|
|
$ |
35 |
|
|
$ |
55 |
|
|
Other Americas |
|
|
71 |
|
|
|
78 |
|
|
|
(1 |
) |
|
Europe |
|
|
333 |
|
|
|
261 |
|
|
|
268 |
|
|
Asia |
|
|
101 |
|
|
|
77 |
|
|
|
86 |
|
|
Total net earnings |
|
$ |
562 |
|
|
$ |
451 |
|
|
$ |
408 |
|
|
(1) |
The difference between our ownership interest of a venture’s equity and our investment balance at December 31, 2016, 2015 and 2014, results principally from three types of transactions: (i) deferring a portion of the gains we recognize from a contribution of a property to a venture ($469.9 million, $430.7 million and $322.9 million, respectively); (ii) recording additional costs associated with our investment in the venture ($124.1 million, $122.1 million and $117.5 million respectively); and (iii) advances to a venture ($166.1 million, $189.7 million and $125.7 million, respectively). |
|
(2) |
Represents our weighted average ownership interest in all co-investment ventures based on each entity’s contribution of total assets, before depreciation, net of other liabilities. |
|
(3) |
We had significant activity with our U.S. and Other Americas unconsolidated co-investment ventures in 2014 as explained in Notes 3 and 4. We began consolidating NAIF in 2014. We formed and invested in FIBRA Prologis in 2014 and in connection with this transaction, we concluded our unconsolidated co-investment venture in Mexico. |
Equity Commitments Related to Certain Unconsolidated Co-Investment Ventures
Certain co-investment ventures have equity commitments from us and our venture partners. Our venture partners fulfill their equity commitment with cash. We may fulfill our equity commitment through contributions of properties or cash. The venture may obtain financing for the properties and therefore the acquisition price of additional investments that the venture could make may be more than the equity commitment. Depending on market conditions, the investment objectives of the ventures, our liquidity needs and other factors, we may make additional contributions of properties or additional cash investments in these ventures through the remaining commitment period.
The following table summarizes the remaining equity commitments at December 31, 2016 (in millions):
|
|
|
Equity Commitments |
|
|
Expiration Date for Remaining Commitments |
|||||||||
|
|
|
Prologis |
|
|
Venture Partners |
|
|
Total |
|
|
|
|||
|
Prologis Targeted U.S. Logistics Fund |
|
$ |
- |
|
|
$ |
180 |
|
|
$ |
180 |
|
|
2017 |
|
Prologis Targeted Europe Logistics Fund (1) |
|
|
- |
|
|
|
243 |
|
|
|
243 |
|
|
2017 |
|
Prologis China Logistics Venture |
|
|
294 |
|
|
|
1,665 |
|
|
|
1,959 |
|
|
2017 |
|
Total |
|
$ |
294 |
|
|
$ |
2,088 |
|
|
$ |
2,382 |
|
|
|
|
(1) |
Equity commitments are denominated in euro and reported in U.S. dollars based on an exchange rate of $1.05 U.S. dollars to the euro. |
NOTE 6. ASSETS HELD FOR SALE OR CONTRIBUTION
We have investments in certain real estate properties that met the criteria to be classified as held for sale or contribution at December 31, 2016 and 2015. These properties are expected to be sold to third parties or contributed to unconsolidated co-investment ventures within twelve months. The amounts included in Assets Held for Sale or Contribution represented real estate investment balances and the related assets and liabilities for each property.
74
PROLOGIS, INC. AND PROLOGIS, L.P.
NOTES TO THE CONSOLIDATED FINANCIAL STATEMENTS (CONTINUED)
Assets held for sale or contribution consisted of the following (dollars and square feet in thousands):
|
|
|
2016 |
|
|
2015 |
|
||
|
Number of operating properties |
|
|
13 |
|
|
|
17 |
|
|
Square feet |
|
|
4,167 |
|
|
|
5,065 |
|
|
Total assets held for sale or contribution |
|
$ |
322,139 |
|
|
$ |
378,423 |
|
|
Total liabilities associated with assets held for sale or contribution – included in Other Liabilities |
|
$ |
4,984 |
|
|
$ |
6,874 |
|
NOTE 7. NOTES RECEIVABLE BACKED BY REAL ESTATE
The following table summarizes information about our notes receivable backed by real estate (dollars in thousands):
|
|
|
Balance Outstanding |
|
|
Interest Rates |
|
Maturity Dates |
|
|
Balance at January 1, 2016 |
|
$ |
235,050 |
|
|
2.0% – 10.0% |
|
February 2016 – April 2017 |
|
Additions |
|
|
- |
|
|
|
|
|
|
Repayments |
|
|
(202,950 |
) |
|
|
|
|
|
Balance at December 31, 2016 |
|
$ |
32,100 |
|
|
5.8% – 10.0% |
|
April 2017 – December 2017 |
NOTE 8. OTHER ASSETS AND OTHER LIABILITIES
The following table summarizes our other assets, net of amortization and depreciation, if applicable, at December 31 (in thousands):
|
|
|
2016 |
|
|
2015 |
|
||
|
Leasing commissions |
|
$ |
286,821 |
|
|
$ |
229,645 |
|
|
Rent leveling |
|
|
285,824 |
|
|
|
226,239 |
|
|
Acquired lease intangibles |
|
|
267,907 |
|
|
|
433,949 |
|
|
Prepaid assets |
|
|
120,361 |
|
|
|
107,000 |
|
|
Accounts receivable |
|
|
110,918 |
|
|
|
89,611 |
|
|
Fixed assets |
|
|
102,830 |
|
|
|
94,178 |
|
|
Value added taxes receivable |
|
|
94,713 |
|
|
|
86,115 |
|
|
Derivative assets |
|
|
47,114 |
|
|
|
53,579 |
|
|
Management contracts |
|
|
41,993 |
|
|
|
46,293 |
|
|
Other notes receivable |
|
|
35,824 |
|
|
|
41,262 |
|
|
Deferred income taxes |
|
|
14,052 |
|
|
|
14,650 |
|
|
Other |
|
|
88,633 |
|
|
|
91,989 |
|
|
Totals |
|
$ |
1,496,990 |
|
|
$ |
1,514,510 |
|
The following table summarizes our other liabilities, net of amortization, if applicable, at December 31 (in thousands):
|
|
|
2016 |
|
|
2015 |
|
||
|
Tenant security deposits |
|
$ |
206,301 |
|
|
$ |
190,160 |
|
|
Unearned rents |
|
|
90,233 |
|
|
|
77,730 |
|
|
Income tax liabilities |
|
|
68,666 |
|
|
|
81,125 |
|
|
Acquired lease intangibles |
|
|
31,707 |
|
|
|
55,976 |
|
|
Environmental liabilities |
|
|
24,572 |
|
|
|
21,484 |
|
|
Deferred income |
|
|
21,629 |
|
|
|
29,197 |
|
|
Value added taxes payable |
|
|
15,888 |
|
|
|
10,272 |
|
|
Derivative liabilities |
|
|
1,268 |
|
|
|
13,729 |
|
|
Other |
|
|
167,055 |
|
|
|
154,702 |
|
|
Totals |
|
$ |
627,319 |
|
|
$ |
634,375 |
|
75
PROLOGIS, INC. AND PROLOGIS, L.P.
NOTES TO THE CONSOLIDATED FINANCIAL STATEMENTS (CONTINUED)
The following table summarizes the expected future amortization of leasing commissions and foregone rent into amortization expense and above and below market leases and rent leveling net assets into rental revenues, all based on the balances at December 31, 2016 (in thousands):
|
|
|
Amortization Expense |
|
|
Net (Increase) Decrease to Rental Revenues |
|
||
|
2017 |
|
$ |
135,263 |
|
|
$ |
(24,939 |
) |
|
2018 |
|
|
98,435 |
|
|
|
25,795 |
|
|
2019 |
|
|
76,315 |
|
|
|
40,306 |
|
|
2020 |
|
|
59,969 |
|
|
|
46,465 |
|
|
2021 |
|
|
44,137 |
|
|
|
41,831 |
|
|
Thereafter |
|
|
106,325 |
|
|
|
158,943 |
|
|
Totals |
|
$ |
520,444 |
|
|
$ |
288,401 |
|
All debt is incurred by the Operating Partnership. The Parent does not have any indebtedness, but guarantees the unsecured debt of the Operating Partnership.
The following table summarizes our debt at December 31 (dollars in thousands):
|
|
|
2016 |
|
|
2015 |
|
||||||||||
|
|
|
Weighted Average Interest Rate (1) |
|
|
Amount Outstanding (2) |
|
|
Weighted Average Interest Rate (1) |
|
|
Amount Outstanding |
|
||||
|
Credit facilities |
|
|
1.0 |
% |
|
$ |
35,023 |
|
|
- |
|
|
$ |
- |
|
|
|
Senior notes (3) |
|
|
3.3 |
% |
|
|
6,417,492 |
|
|
|
3.3 |
% |
|
|
6,516,392 |
|
|
Term loans |
|
|
1.4 |
% |
|
|
1,484,523 |
|
|
|
2.1 |
% |
|
|
2,100,009 |
|
|
Unsecured other (4) |
|
|
6.1 |
% |
|
|
14,478 |
|
|
|
6.2 |
% |
|
|
15,448 |
|
|
Secured mortgages (5) |
|
|
4.9 |
% |
|
|
979,585 |
|
|
|
5.1 |
% |
|
|
1,172,473 |
|
|
Secured mortgages of consolidated entities (6) |
|
|
3.0 |
% |
|
|
1,677,193 |
|
|
|
2.9 |
% |
|
|
1,822,509 |
|
|
Totals |
|
|
3.2 |
% |
|
$ |
10,608,294 |
|
|
|
3.2 |
% |
|
$ |
11,626,831 |
|
|
(1) |
The interest rates presented represent the effective interest rates (including amortization of debt issuance costs and the noncash premiums or discounts) at the end of the period for the debt outstanding. |
|
(2) |
Included in the outstanding balances are borrowings denominated in non-U.S. dollars, principally: euro ($3.3 billion), Japanese yen ($1.3 billion), Canadian dollars ($0.4 billion) and British pound sterling ($0.2 billion). |
|
(3) |
Notes are due January 2018 to June 2026 with effective interest rates ranging from 1.5% to 7.6% at December 31, 2016. |
|
(4) |
The balance at December 31, 2016, represents primarily assessment bonds that are due November 2019 to September 2033 with effective interest rates ranging from 4.5% to 7.9%. The assessment bonds are issued by municipalities and guaranteed by us as a means of financing infrastructure and secured by assessments (similar to property taxes) on various underlying real estate properties with an aggregate undepreciated cost of $737.4 million at December 31, 2016. |
|
(5) |
Debt is due May 2018 to December 2025 with effective interest rates ranging from 0.4% to 7.8% at December 31, 2016. The debt is secured by 145 real estate properties with an aggregate undepreciated cost of $2.4 billion at December 31, 2016. |
|
(6) |
Debt is due July 2017 to December 2027 with effective interest rates ranging from 2.4% to 5.3% at December 31, 2016. The debt is secured by 208 real estate properties with an aggregate undepreciated cost of $3.0 billion at December 31, 2016. |
Credit Facilities
We have a global senior credit facility (the “Global Facility”), under which we may draw in British pounds sterling, Canadian dollars, euro, Japanese yen and U.S. dollars on a revolving basis. In 2016, we renewed and amended the Global Facility to increase our availability from $2.3 billion to $3.0 billion (subject to currency fluctuations). We have the ability to increase the Global Facility to $3.8 billion, subject to currency fluctuations and obtaining additional lender commitments. Pricing under the Global Facility, including the spread over LIBOR, facility fees and letter of credit fees, varies based on the public debt ratings of the Operating Partnership. The Global Facility is scheduled to mature in April 2020; however, we may extend the maturity date for six months on two occasions, subject to the satisfaction of certain conditions and payment of extension fees.
76
PROLOGIS, INC. AND PROLOGIS, L.P.
NOTES TO THE CONSOLIDATED FINANCIAL STATEMENTS (CONTINUED)
We also have a ¥45 billion ($384.4 million at December 31, 2016) Japanese yen revolver (the “Revolver”) with availability to increase to ¥56.5 billion ($482.6 million at December 31, 2016), subject to obtaining additional lender commitments. Pricing under the Revolver, including the spread over LIBOR, facility fees and letter of credit fees, varies based on the public debt ratings of the Operating Partnership. The Revolver is scheduled to mature in May 2018.
We refer to the Global Facility and the Revolver, collectively, as our “Credit Facilities.”
The following table summarizes information about our Credit Facilities (dollars in millions):
|
|
|
2016 |
|
|
2015 |
|
|
2014 |
|
|||
|
For the years ended December 31: |
|
|
|
|
|
|
|
|
|
|
|
|
|
Weighted average daily interest rate |
|
|
1.4 |
% |
|
|
1.1 |
% |
|
|
1.1 |
% |
|
Weighted average daily borrowings |
|
$ |
128 |
|
|
$ |
261 |
|
|
$ |
182 |
|
|
Maximum borrowings outstanding at any month-end |
|
$ |
307 |
|
|
$ |
942 |
|
|
$ |
742 |
|
|
At December 31: |
|
|
|
|
|
|
|
|
|
|
|
|
|
Aggregate lender – commitments |
|
$ |
3,306 |
|
|
$ |
2,662 |
|
|
$ |
2,742 |
|
|
Less: |
|
|
|
|
|
|
|
|
|
|
|
|
|
Borrowings outstanding |
|
|
35 |
|
|
|
- |
|
|
|
- |
|
|
Outstanding letters of credit |
|
|
36 |
|
|
|
32 |
|
|
|
35 |
|
|
Current availability |
|
$ |
3,235 |
|
|
$ |
2,630 |
|
|
$ |
2,707 |
|
Senior Notes
The senior notes are unsecured and our obligations are effectively subordinated in certain respects to any of our debt that is secured by a lien on real property, to the extent of the value of such real property. The senior notes require interest payments be made quarterly, semi-annually or annually. All of the senior notes are redeemable at any time at our option, subject to certain prepayment penalties. Such repurchase and other terms are governed by the provisions of indenture agreements, various note purchase agreements or trust deeds.
During the years ended December 31 we issued the following senior notes (dollars and euros in thousands):
|
|
|
Principal Amount |
|
|
Stated Interest Rate |
|
|
Effective Interest Rate |
|
|
Maturity Date |
|||||||
|
2015 |
|
|
|
|
|
|
|
|
|
|
|
|
|
|
|
|
|
|
|
May 2015 (1) |
|
€ |
700,000 |
|
|
$ |
785,470 |
|
|
|
1.4% |
|
|
|
1.5% |
|
|
May 2021 |
|
October 2015 |
|
|
|
|
|
$ |
750,000 |
|
|
|
3.8% |
|
|
|
4.0% |
|
|
November 2025 |
|
|
|
|
|
|
|
|
|
|
|
|
|
|
|
|
|
|
|
|
|
2014 |
|
|
|
|
|
|
|
|
|
|
|
|
|
|
|
|
|
|
|
February 2014 (1) |
|
€ |
700,000 |
|
|
$ |
959,420 |
|
|
|
3.4% |
|
|
|
3.5% |
|
|
February 2024 |
|
June 2014 (1) |
|
€ |
500,000 |
|
|
$ |
680,550 |
|
|
|
3.0% |
|
|
|
3.1% |
|
|
June 2026 |
|
October 2014 (1) |
|
€ |
600,000 |
|
|
$ |
756,420 |
|
|
|
1.4% |
|
|
|
1.4% |
|
|
October 2020 |
|
(1) |
This debt is denominated in euro and the exchange rate used to calculate into U.S. dollar was the effective rate at the date of the transaction. |
77
PROLOGIS, INC. AND PROLOGIS, L.P.
NOTES TO THE CONSOLIDATED FINANCIAL STATEMENTS (CONTINUED)
The following table summarizes our outstanding term loans at December 31 (dollars and borrowing currency in thousands):
|
Term Loan |
Borrowing Currency |
|
Initial Borrowing Date |
|
Lender Commitment at 2016 |
|
|
Amount Outstanding at 2016 |
|
|
Amount Outstanding at 2015 |
|
|
Interest Rate |
|
Maturity Date |
||||||
|
|
|
|
|
|
Borrowing Currency |
|
USD |
|
|
USD |
|
|
USD |
|
|
|
|
|
||||
|
2014 Yen Term Loan (1) |
JPY |
|
May 2014 |
|
|
|
|
|
|
|
|
$ |
- |
|
|
$ |
339,858 |
|
|
LIBOR plus 1.20% |
|
|
|
Euro Term Loan (2) |
USD, EUR, JPY and GBP |
|
June 2014 |
|
€ |
500,000 |
|
$ |
525,000 |
|
|
|
193,293 |
|
|
|
561,879 |
|
|
LIBOR plus 0.98% |
|
June 2017 |
|
Senior Term Loan (3) |
USD |
|
May 2015 |
|
|
|
|
|
|
|
|
|
- |
|
|
|
400,000 |
|
|
LIBOR plus 1.00% |
|
|
|
2015 Yen Term Loan (1) |
JPY |
|
June 2015 |
|
|
|
|
|
|
|
|
|
- |
|
|
|
539,906 |
|
|
LIBOR plus 1.10% |
|
|
|
2015 Canadian Term Loan |
CAD |
|
December 2015 |
|
$ |
371,925 |
|
$ |
276,322 |
|
|
|
276,322 |
|
|
|
267,872 |
|
|
CDOR rate plus 1.50% |
|
February 2023 |
|
Yen Term Loan (1) |
JPY |
|
August 2016 |
|
¥ |
120,000,000 |
|
$ |
1,025,057 |
|
|
|
1,025,057 |
|
|
|
- |
|
|
Yen LIBOR plus 0.65% |
|
August 2022 and 2023 |
|
Subtotal |
|
|
|
|
|
|
|
|
|
|
|
|
1,494,672 |
|
|
|
2,109,515 |
|
|
|
|
|
|
Debt issuance costs, net |
|
|
|
|
|
|
|
|
|
|
|
|
(10,149 |
) |
|
|
(9,506 |
) |
|
|
|
|
|
Totals |
|
|
|
|
|
|
|
|
|
|
|
$ |
1,484,523 |
|
|
$ |
2,100,009 |
|
|
|
|
|
|
(1) |
In March 2016, we entered into an unsecured senior term loan agreement under which we could draw in Japanese yen and borrowed ¥11.2 billion ($99.5 million). In August 2016, we entered into a separate unsecured senior term loan agreement (the “Yen Term Loan”) under which we can draw in Japanese yen, of which ¥50.0 billion ($427.1 million at December 31, 2016) matures in August 2022 and ¥70.0 billion ($597.9 million at December 31, 2016) matures in August 2023. We may increase the borrowings up to ¥200.0 billion ($1.7 billion at December 31, 2016), subject to obtaining additional lender commitments. In the third quarter of 2016, we borrowed on the Yen Term Loan ($1.2 billion) and used the proceeds to repay and cancel the previous outstanding Japanese yen term loans entered into in 2014 and 2015 and 2016. The Yen Term Loan was fully drawn at December 31, 2016. |
|
(2) |
We may increase the borrowings up to €1.0 billion ($1.1 billion at December 31, 2016), subject to obtaining additional lender commitments. We may pay down and reborrow on this term loan. We may extend the maturity date twice, by one year each, subject to the satisfaction of certain conditions and payment of an extension fee. |
|
(3) |
We entered into the Senior Term Loan in connection with the KTR transaction and initially borrowed $1.0 billion. During 2016, we paid down the remaining balance and cancelled Senior Term Loan. |
Secured Mortgage Debt
During 2016, we issued secured mortgage debt totaling $152.6 million. The debt has a stated interest rate of 3.3% (an effective interest rate of 3.5%) and matures in January 2022.
TMK bonds are a financing vehicle in Japan for special purposes companies known as TMKs. In 2016, we issued ¥25.7 billion ($244.6 million) of new TMK bonds and paid off or transferred substantially all of our outstanding TMK bonds leaving one TMK bond outstanding for ¥20.0 billion ($170.8 million at December 31, 2016). During 2015, we issued new TMK bonds totaling ¥23.0 billion ($191.0 million).
Debt Covenants
We have approximately $6.5 billion of senior notes and $1.5 billion of term loans outstanding at December 31, 2016, under three separate indentures, as supplemented, and are subject to certain financial covenants. We are also subject to financial covenants under our Credit Facilities and certain secured mortgage debt. At December 31, 2016, we were in compliance with all of our debt covenants.
78
PROLOGIS, INC. AND PROLOGIS, L.P.
NOTES TO THE CONSOLIDATED FINANCIAL STATEMENTS (CONTINUED)
Principal payments due on our debt, for each year through the period ending December 31, 2026, and thereafter were as follows at December 31, 2016 (in thousands):
|
|
Unsecured |
|
|
|
|
|
|
|
||||||||||||
|
|
|
Credit |
|
|
Senior |
|
|
Term Loans |
|
|
Secured |
|
|
|
|
|
||||
|
Maturity |
|
Facilities |
|
|
Notes |
|
|
and Other |
|
|
Mortgage Debt |
|
|
Total |
|
|||||
|
2017 (1) (2) |
|
$ |
- |
|
|
$ |
- |
|
|
$ |
194,150 |
|
|
$ |
428,196 |
|
|
$ |
622,346 |
|
|
2018 |
|
|
35,023 |
|
|
|
175,000 |
|
|
|
961 |
|
|
|
570,291 |
|
|
|
781,275 |
|
|
2019 |
|
|
- |
|
|
|
618,294 |
|
|
|
1,084 |
|
|
|
446,360 |
|
|
|
1,065,738 |
|
|
2020 |
|
|
- |
|
|
|
831,071 |
|
|
|
1,190 |
|
|
|
428,725 |
|
|
|
1,260,986 |
|
|
2021 |
|
|
- |
|
|
|
1,237,871 |
|
|
|
1,012 |
|
|
|
141,548 |
|
|
|
1,380,431 |
|
|
2022 |
|
|
- |
|
|
|
737,870 |
|
|
|
427,886 |
|
|
|
163,172 |
|
|
|
1,328,928 |
|
|
2023 |
|
|
- |
|
|
|
850,000 |
|
|
|
874,916 |
|
|
|
174,624 |
|
|
|
1,899,540 |
|
|
2024 |
|
|
- |
|
|
|
737,870 |
|
|
|
911 |
|
|
|
133,308 |
|
|
|
872,089 |
|
|
2025 |
|
|
- |
|
|
|
750,000 |
|
|
|
976 |
|
|
|
134,727 |
|
|
|
885,703 |
|
|
2026 |
|
|
- |
|
|
|
527,050 |
|
|
|
696 |
|
|
|
1,223 |
|
|
|
528,969 |
|
|
Thereafter |
|
|
- |
|
|
|
- |
|
|
|
5,368 |
|
|
|
1,161 |
|
|
|
6,529 |
|
|
Subtotal |
|
|
35,023 |
|
|
|
6,465,026 |
|
|
|
1,509,150 |
|
|
|
2,623,335 |
|
|
|
10,632,534 |
|
|
Premiums (discounts), net |
|
|
- |
|
|
|
(19,573 |
) |
|
|
- |
|
|
|
43,286 |
|
|
|
23,713 |
|
|
Debt issuance costs, net |
|
|
- |
|
|
|
(27,961 |
) |
|
|
(10,149 |
) |
|
|
(9,843 |
) |
|
|
(47,953 |
) |
|
Totals |
|
$ |
35,023 |
|
|
$ |
6,417,492 |
|
|
$ |
1,499,001 |
|
|
$ |
2,656,778 |
|
|
$ |
10,608,294 |
|
|
(1) |
We expect to repay the amounts maturing in 2017 with cash generated from operations, proceeds from dispositions of wholly owned real estate properties, or as necessary, with borrowings on our Credit Facilities. |
|
(2) |
Included in 2017 maturities is the Euro Term Loan that can be extended until 2019. |
Interest Expense
The following table summarizes the components of interest expense for the years ended December 31 (in thousands):
|
|
|
2016 |
|
|
2015 |
|
|
2014 |
|
|||
|
Gross interest expense |
|
$ |
383,098 |
|
|
$ |
394,012 |
|
|
$ |
377,666 |
|
|
Amortization of premium, net |
|
|
(30,596 |
) |
|
|
(45,253 |
) |
|
|
(21,440 |
) |
|
Amortization of debt issuance costs |
|
|
15,459 |
|
|
|
13,412 |
|
|
|
14,116 |
|
|
Interest expense before capitalization |
|
$ |
367,961 |
|
|
$ |
362,171 |
|
|
$ |
370,342 |
|
|
Capitalized amounts |
|
|
(64,815 |
) |
|
|
(60,808 |
) |
|
|
(61,457 |
) |
|
Net interest expense |
|
$ |
303,146 |
|
|
$ |
301,363 |
|
|
$ |
308,885 |
|
|
Total cash paid for interest, net of amounts capitalized |
|
$ |
322,442 |
|
|
$ |
345,916 |
|
|
$ |
258,441 |
|
Early Extinguishment of Debt
In 2014 and 2015, we repurchased or repaid certain debt before the maturity date in an effort to reduce our borrowing costs and extend our debt maturities. As a result, we recognize gains or losses represented by the difference between the recorded debt (including premiums and discounts and related debt issuance costs) and the consideration we paid to retire the debt, including fees.
79
PROLOGIS, INC. AND PROLOGIS, L.P.
NOTES TO THE CONSOLIDATED FINANCIAL STATEMENTS (CONTINUED)
The following table summarizes the activity related to the repurchase of debt and net loss on early extinguishment of debt for the years ending December 31 (in millions):
|
|
|
2015 |
|
|
2014 |
|
||
|
Senior notes: |
|
|
|
|
|
|
|
|
|
Original principal amount |
|
$ |
709.7 |
|
|
$ |
1,290.4 |
|
|
Cash purchase price |
|
$ |
789.0 |
|
|
$ |
1,460.3 |
|
|
Term loans: |
|
|
|
|
|
|
|
|
|
Original principal amount |
|
$ |
600.0 |
|
|
$ |
- |
|
|
Cash repayment price |
|
$ |
600.0 |
|
|
$ |
- |
|
|
Secured mortgage debt: |
|
|
|
|
|
|
|
|
|
Original principal amount |
|
$ |
571.5 |
|
|
$ |
528.0 |
|
|
Cash repayment price |
|
$ |
595.5 |
|
|
$ |
531.2 |
|
|
Total: |
|
|
|
|
|
|
|
|
|
Original principal amount |
|
$ |
1,881.2 |
|
|
$ |
1,818.4 |
|
|
Cash purchase / repayment price |
|
$ |
1,984.5 |
|
|
$ |
1,991.5 |
|
|
Losses on early extinguishment of debt |
|
$ |
86.3 |
|
|
$ |
165.3 |
|
During 2016, we repaid certain debt at the earliest available payment date with no prepayment costs. As a result, we recorded a gain of $2.5 million, which related to premiums associated with the extinguished debt, net of remaining debt issuance costs.
Exchangeable Senior Notes
We had exchangeable senior notes that were issued by the Operating Partnership and were exchangeable into common stock of the Parent. The accounting for the exchangeable senior notes required us to separate the fair value of the derivative instrument (exchange feature) from the debt instrument and account for it separately as a derivative. During the reporting periods, any adjustments to the fair value of the derivative were recorded in earnings as Foreign Currency and Derivative Gains (Losses), Net. The derivative on the debt instrument was amortized over the term of the exchangeable notes. During March 2015, the holders of the exchangeable notes exchanged $459.8 million of their notes for 11.9 million shares of common stock of the Parent and $0.2 million of their notes for cash.
The fair value of the exchange option was $43.0 million immediately before the exchange in March 2015. When the debt was exchanged into common stock, the value of the derivative associated with the debt was reclassified to Additional Paid-In Capital. We recognized unrealized gains of $8.3 million during the first quarter of 2015 and unrealized losses of $10.3 million for the year ended December 31, 2014 on the change in fair value of the derivative instrument associated with the exchangeable debt.
NOTE 10. STOCKHOLDERS’ EQUITY OF PROLOGIS, INC.
Shares Authorized
At December 31, 2016, 1.1 billion shares were authorized to be issued by the Parent, of which 1.0 billion shares represent common stock. Our board of directors (the “Board”) may, without stockholder approval, classify or reclassify any unissued shares of our stock from time to time by setting or changing the preferences, conversion or other rights, voting powers, restrictions, limitations as to distributions, qualifications and terms or conditions of redemption of such shares.
Common Stock
We issued 1.7 million and 3.3 million shares of common stock under our at-the-market program during 2015 and 2014, respectively, which generated $71.5 million and $140.1 million in net proceeds, respectively. We have an equity distribution agreement that allows us to sell up to $750.0 million aggregate gross sales proceeds of shares of common stock, of which $535.2 million remains available for sale, through six designated agents, who earn a fee of up to 2% of the gross proceeds, as agreed to on a transaction-by-transaction basis.
Under the 2012 Long-Term Incentive Plan (the “LTIP”), certain of our employees and outside directors are able to participate in equity-based compensation plans. See Note 13 for additional information on this plan. We received gross proceeds for the issuance of common stock upon the exercise of stock options of $39.5 million, $18.2 million and $25.8 million, for the years ended December 31, 2016, 2015 and 2014, respectfully. See Note 13 for additional information on this plan.
Preferred Stock
At December 31, 2016, and 2015 our Series Q preferred stock outstanding had a dividend rate of 8.54%, and will be redeemable at our option on or after November 13, 2026. Holders have, subject to certain conditions, limited voting rights and all holders are entitled to receive cumulative preferential dividends based on liquidation preference. The dividends are payable quarterly in arrears on the last
80
PROLOGIS, INC. AND PROLOGIS, L.P.
NOTES TO THE CONSOLIDATED FINANCIAL STATEMENTS (CONTINUED)
day of each quarter. Dividends are payable when, and if, they have been declared by the Board, out of funds legally available for the payment of dividends.
Ownership Restrictions
For us to qualify as a REIT, five or fewer individuals may not own more than 50% of the value of our outstanding stock at any time during the last half of our taxable year. Therefore, our charter restricts beneficial ownership (or ownership generally attributed to a person under the REIT rules), by a person, or persons acting as a group, of issued and outstanding common and preferred stock that would cause that person to own or be deemed to own more than 9.8% (by value or number of shares, whichever is more restrictive) of our issued and outstanding capital stock. Furthermore, subject to certain exceptions, no person shall at any time directly or indirectly acquire ownership of more than 25% of any of the preferred stock. These provisions assist us in protecting and preserving our REIT status and protect the interests of stockholders in takeover transactions by preventing the acquisition of a substantial block of outstanding shares of stock.
Shares of stock owned by a person or group of people in excess of these limits are subject to redemption by us. The provision does not apply where a majority of the Board, in its sole and absolute discretion, waives such limit after determining that our status as a REIT for federal income tax purposes will not be jeopardized.
Dividends
To comply with the REIT requirements of the Internal Revenue Code, we are generally required to make common and preferred stock dividends (other than capital gain distributions) to our stockholders in amounts that together at least equal (i) the sum of (a) 90% of our “REIT taxable income” computed without regard to the dividends paid deduction and net capital gains and (b) 90% of the net income (after tax), if any, from foreclosure property, minus (ii) certain excess non-cash income. Our common stock distribution policy is to distribute a percentage of our cash flow that ensures that we will meet the distribution requirements of the Internal Revenue Code and that allows us to also retain cash to meet other needs, such as capital improvements and other investment activities.
Our tax return for the year ended December 31, 2016, has not been filed. The taxability information presented for our dividends paid in 2016 is based on management’s estimate. Our tax returns for open tax years have not been examined by the Internal Revenue Service, other than those discussed in Note 14. Consequently, the taxability of dividends is subject to change.
In 2016, 2015 and 2014, we paid all of our dividends in cash. The following summarizes the taxability of our common and preferred stock dividends for the years ended December 31:
|
|
|
2016 (1) |
|
|
2015 |
|
|
2014 |
|
|||
|
Common Stock: |
|
|
|
|
|
|
|
|
|
|
|
|
|
Ordinary income |
|
$ |
0.60 |
|
|
$ |
0.36 |
|
|
$ |
0.29 |
|
|
Qualified dividend |
|
|
0.15 |
|
|
|
0.08 |
|
|
|
0.41 |
|
|
Capital gains |
|
|
0.93 |
|
|
|
1.08 |
|
|
|
0.62 |
|
|
Total distribution |
|
$ |
1.68 |
|
|
$ |
1.52 |
|
|
$ |
1.32 |
|
|
Preferred Stock – Series Q: |
|
|
|
|
|
|
|
|
|
|
|
|
|
Ordinary income |
|
$ |
2.02 |
|
|
$ |
0.77 |
|
|
$ |
0.71 |
|
|
Qualified dividend |
|
|
0.29 |
|
|
|
0.62 |
|
|
|
1.01 |
|
|
Capital gains |
|
|
1.96 |
|
|
|
2.88 |
|
|
|
2.55 |
|
|
Total dividend |
|
$ |
4.27 |
|
|
$ |
4.27 |
|
|
$ |
4.27 |
|
|
(1) |
Taxability for 2016 is estimated. |
Common stock dividends are characterized for federal income tax purposes as ordinary income, qualified dividend, capital gains, non-taxable return of capital or a combination of the four. Common stock dividends that exceed our current and accumulated earnings and profits (calculated for tax purposes) constitute a return of capital rather than a dividend and generally reduce the stockholder’s basis in the common stock. To the extent that a dividend exceeds both current and accumulated earnings and profits and the stockholder’s basis in the common stock, it will generally be treated as a gain from the sale or exchange of that stockholder’s common stock. At the beginning of each year, we notify our stockholders of the taxability of the common stock dividends paid during the preceding year.
Pursuant to the terms of our preferred stock, we are restricted from declaring or paying any dividend with respect to our common stock unless and until all cumulative dividends with respect to the preferred stock have been paid and sufficient funds have been set aside for dividends that have been declared for the relevant dividend period with respect to the preferred stock.
NOTE 11. PARTNERS’ CAPITAL OF PROLOGIS, L.P.
Distributions paid to the common limited partnership units and the taxability of those distributions are similar to the Parent’s common stock disclosed above.
81
PROLOGIS, INC. AND PROLOGIS, L.P.
NOTES TO THE CONSOLIDATED FINANCIAL STATEMENTS (CONTINUED)
In May 2015, we issued 4.5 million common limited partnership units in the Operating Partnership in connection with the KTR transaction. See Note 3 for more details on the transaction.
In connection with the acquisition of a portfolio of properties in October 2015, we issued 0.2 million common limited partnership units and 8.9 million Class A Units. The number of units issued was based upon an agreed upon price and had a per unit weighted average fair value at the date of issuance of $41.06. The Class A Units generally have the same rights as the existing common units of the Operating Partnership, except that the Class A Units are entitled to a quarterly distribution equal to $0.64665 per unit so long as the common units receive a quarterly distribution of at least $0.40 per unit (in the event the common units receive a quarterly distribution of less than $0.40 per unit, the Class A Unit distribution would be reduced by a proportionate amount). Class A Units are convertible into common units at an initial conversion rate of one-for-one. The conversion rate will be increased or decreased to the extent that, at the time of conversion, the net present value of the distributions paid with respect to the Class A Units are less or more than the distributions paid on common units from the time of issuance of the Class A Units until the time of conversion. At December 31, 2016, the Class A Units were convertible into 8.7 million common units. The Operating Partnership may redeem the Class A Units at any time after October 7, 2025, for an amount in cash equal to the then-current number of the common units into which the Class A Units are convertible, multiplied by $43.11, subject to the holders’ right to convert the Class A Units into common units.
Distributions paid on the common units and Class A Units, and the taxability of those distributions, are similar to dividends paid on the Parent’s common stock disclosed above.
NOTE 12. NONCONTROLLING INTERESTS
Prologis, L.P.
We report noncontrolling interests related to several entities we consolidate but of which we do not own 100% of the equity. These entities include two real estate partnerships that have issued limited partnership units to third parties. Depending on the specific partnership agreements, these limited partnership units are redeemable for cash or, at our option into shares of the Parent’s common stock, generally at a rate of one share of common stock to one unit. We also consolidate several entities in which we do not own 100% of the equity and the units of these entities are not exchangeable into our common stock.
As discussed in Note 1, the Parent has complete responsibility, power and discretion in the day-to-day management of the Operating Partnership. The Parent, through its majority interest, has the right to receive benefits from and incur losses of the Operating Partnership. In addition, the Operating Partnership does not have either substantive liquidation rights or substantive kick-out rights without cause or substantive participating rights that could be exercised by a simple majority of noncontrolling interests. The absence of such rights renders the Operating Partnership as a VIE. Accordingly, the Parent is the primary beneficiary of and consolidates the Operating Partnership.
Prologis, Inc.
The noncontrolling interests of the Parent include the noncontrolling interests presented in the Operating Partnership, as well as the common limited partnership units in the Operating Partnership that are not owned by the Parent.
The following table summarizes our ownership percentages and noncontrolling interests and the consolidated entities’ total assets and total liabilities at December 31 (dollars in thousands):
|
|
|
Our Ownership Percentage |
|
|
Noncontrolling Interests |
|
|
Total Assets |
|
|
Total Liabilities |
|
||||||||||||||||||||
|
|
|
2016 |
|
|
2015 |
|
|
2016 |
|
|
2015 |
|
|
2016 |
|
|
2015 |
|
|
2016 |
|
|
2015 |
|
||||||||
|
Prologis U.S. Logistics Venture |
|
|
55.0 |
% |
|
|
55.0 |
% |
|
$ |
2,424,800 |
|
|
$ |
2,677,642 |
|
|
$ |
6,201,278 |
|
|
$ |
6,788,968 |
|
|
$ |
797,593 |
|
|
$ |
847,084 |
|
|
Prologis North American Industrial Fund (1) |
|
|
66.1 |
% |
|
|
66.1 |
% |
|
|
486,648 |
|
|
|
490,444 |
|
|
|
2,479,072 |
|
|
|
2,619,241 |
|
|
|
1,038,708 |
|
|
|
1,165,617 |
|
|
Prologis Brazil Logistics Partners Fund I (1) (2) |
|
|
50.0 |
% |
|
|
50.0 |
% |
|
|
61,836 |
|
|
|
49,313 |
|
|
|
131,581 |
|
|
|
100,836 |
|
|
|
720 |
|
|
|
192 |
|
|
Other consolidated entities (3) |
|
various |
|
|
various |
|
|
|
99,185 |
|
|
|
102,828 |
|
|
|
866,821 |
|
|
|
985,188 |
|
|
|
34,073 |
|
|
|
42,811 |
|
||
|
Prologis, L.P. noncontrolling interests |
|
|
|
|
|
|
|
|
|
|
3,072,469 |
|
|
|
3,320,227 |
|
|
|
9,678,752 |
|
|
|
10,494,233 |
|
|
|
1,871,094 |
|
|
|
2,055,704 |
|
|
Limited partners in Prologis, L.P. (4) (5) |
|
|
|
|
|
|
|
|
|
|
394,590 |
|
|
|
432,674 |
|
|
|
- |
|
|
|
- |
|
|
|
- |
|
|
|
- |
|
|
Prologis, Inc. noncontrolling interests |
|
|
|
|
|
|
|
|
|
$ |
3,467,059 |
|
|
$ |
3,752,901 |
|
|
$ |
9,678,752 |
|
|
$ |
10,494,233 |
|
|
$ |
1,871,094 |
|
|
$ |
2,055,704 |
|
82
PROLOGIS, INC. AND PROLOGIS, L.P.
NOTES TO THE CONSOLIDATED FINANCIAL STATEMENTS (CONTINUED)
|
lack the power to direct the significant activities of these ventures that most significantly impact the venture’s economic performance. We have both the power to direct the significant activities and the obligation to absorb losses and the rights to receive benefits from these ventures. As a result, we are the primary beneficiary of both ventures and consistent with prior reporting periods, we consolidate each venture within our financial statements. |
|
(2) |
The assets of the Brazil Fund are primarily investments in unconsolidated entities of $113.1 million and $103.1 million at December 31, 2016 and 2015, respectively. For additional information on our unconsolidated investments, see Note 5. |
|
(3) |
This line item includes our two partnerships that have issued limited partnership units to third parties, as discussed above, along with various other consolidated entities. At December 31, 2016 and 2015, limited partnership units were exchangeable into cash or, at our option, 1.8 million shares of the Parent’s common stock. In 2015, 52 thousand limited partnership units were redeemed for cash of $3.2 million. All of these outstanding limited partnership units receive quarterly cash distributions equal to the quarterly dividends paid on our common stock pursuant to the terms of the applicable partnership agreements. |
|
(4) |
We had 8.9 million of Class A Units that were convertible into 8.7 million and 8.8 million common limited partnership units of the Operating Partnership at December 31, 2016 and 2015, respectively. They were issued in the fourth quarter of 2015. See Note 11 for further discussion of our Class A Units. |
|
(5) |
At December 31, 2016 and 2015, excluding the Class A Units, there were common limited partnership units in the Operating Partnership that were exchangeable into cash or, at our option, 4.6 million and 6.4 million shares of the Parent’s common stock with a fair value of $241.8 million and $275.0 million, respectively, based on the closing stock price of the Parent’s common stock. In 2015, we issued 4.7 million common limited partnership units in the Operating Partnership, principally in connection with the KTR transaction, and in 2016 unitholders exchanged 1.9 million common limited partnership units into an equal number of shares of the Parent’s common stock with a value of $52.2 million. At December 31, 2016 and 2015, there were 2.2 million and 1.2 million LTIP Units (as defined in Note 13) outstanding, respectively, associated with our long-term compensation plan that are exchangeable into common units of the Operating Partnership and redeemable into the Parent’s common stock after they vest and other applicable conditions are met. All of these outstanding limited partnership units receive quarterly cash distributions equal to the quarterly distributions paid on our common stock pursuant to the terms of the partnership agreement. |
NOTE 13. LONG-TERM COMPENSATION
The 2012 LTIP provides for grants of awards to officers, directors, employees, and consultants of the Parent or its subsidiaries. Awards can be in the form of stock options (non-qualified options and incentive stock options), stock appreciation rights and full value awards (restricted stock, restricted stock units (“RSUs”), Operating Partnership units (“LTIP Units”), special outperformance plan type of LTIP Units and cash incentive awards). An LTIP Unit represents a partnership interest in the Operating Partnership. After vesting and the satisfaction of certain conditions, an LTIP Unit may be exchangeable for a common unit in the Operating Partnership and then redeemable for a share of common stock (or cash at the election of the Operating Partnership). No participant can be granted more than 1.5 million shares of common stock under the 2012 LTIP in any one calendar year. Awards may be made under the 2012 LTIP until it is terminated by the Board or until the ten-year anniversary of the effective date of the plan.
We have 27.2 million shares reserved for issuance, of which 19.4 million shares of common stock were available for future issuance at December 31, 2016. Each LTIP Unit counts as one share of common stock for purposes of calculating the limit on shares that may be issued.
Prologis Outperformance Plan (“POP” formerly “OPP”)
We allocate participation points to participants under our POP corresponding to three-year performance periods beginning January 1. The fair value of the awards are measured at the beginning of the performance period and amortized over the applicable performance period. POP awards are earned to the extent our total stockholder return (“TSR”) for the performance period exceeds the TSR for the Morgan Stanley Capital International (“MSCI”) US REIT Index for the same period plus 100 basis points (the “Index”). If this outperformance hurdle is met, the compensation pool is equal to 3% of the excess value created, subject to a maximum of the greater of $75 million or 0.5% of our equity market capitalization at the start of the performance period. Each participant is eligible to receive a percentage of the total compensation pool based on the number of participation points allocated to the participant. If the performance criteria are met, the participants’ points will generally be paid in the form of common stock or POP LTIP Units (as discussed below). If the performance criteria are not met, the participants’ points will be forfeited. Awards earned cannot be paid to participants unless our absolute TSR, as defined in the plan, is positive for the performance period. If we outperform the Index, but the absolute TSR is not positive, payment will be delayed until such time as our absolute TSR becomes positive. If after seven years our absolute TSR has not become positive, the awards will be forfeited.
The POP was amended in 2016. Starting with the 2016 – 2018 performance period, if the relevant performance thresholds are met, participants can earn POP awards for their share of an aggregate performance pool up to $75 million. If earned, these POP awards will be paid after the end of the initial three-year performance period. If our levels of outperformance warrant an aggregate performance pool greater than $75 million, then participants can earn their share of the additional award amount in excess of $75 million up to the Capitalization Cap (the “Excess Award Amount”) during the course of a three-year period after the end of the initial performance period.
83
PROLOGIS, INC. AND PROLOGIS, L.P.
NOTES TO THE CONSOLIDATED FINANCIAL STATEMENTS (CONTINUED)
One-third of this Excess Award Amount can be earned at the end of each of the three years after the initial performance period, if our performance meets or exceeds the Index in each of such three years. POP continues to include certain positive TSR requirements, which must be met before participants can be paid awards under POP. In addition, participants will not be able to sell or transfer any equity they receive as initial or excess POP awards until three years after the end of the initial performance period. This amendment impacted the 2016 POP awards, but not the previously issued awards.
We use a Monte Carlo valuation model to value the points allocated under the POP. Participants can elect to choose the form of payment of awards earned, if any, in common stock of the Parent or POP LTIP Units. If and as elected by the participant, POP participation points are exchanged for POP LTIP Units. If the performance criteria are not met, the POP LTIP Units will be forfeited. At December 31, 2016, all awards are equity classified.
The following table details the assumptions using a Monte Carlo valuation model of each grant based on the year it was granted (dollars in thousands):
|
|
|
2016 |
|
|
2015 |
|
|
2014 |
|
|||
|
Risk free interest rate |
|
|
0.99 |
% |
|
|
0.86 |
% |
|
|
0.67 |
% |
|
Expected volatility |
|
|
20.5 |
% |
|
|
28.0 |
% |
|
|
38.0 |
% |
|
Aggregate fair value |
|
$ |
26,600 |
|
|
$ |
26,500 |
|
|
$ |
23,100 |
|
The performance criteria was met for the 2014 – 2016 performance period, which resulted in an aggregate performance pool of $62.2 million awarded in January 2017 in the form of either vested RSUs or POP LTIP Units.
The performance criteria were not met for the 2012 – 2014 and 2013 – 2015 performance periods, therefore, no awards were earned and the awards were forfeited for such performance periods. As the POP has market-based performance criteria, there is no adjustment to the expense previously recognized at the completion of the performance period regardless of the outcome.
Prologis Promote Plan (“PPP”)
Under the PPP, we establish a compensation pool equal to 40% of the promotes earned by Prologis that represents the third-party portion of the promotes. The awards may be settled in some combination of cash, RSUs or for certain participants LTIP Units. The RSUs and LTIP Units have a three-year vesting period.
The following table details the equity awards granted under the PPP for the year ended December 31 (in thousands):
|
|
|
2016 |
|
|
2015 |
|
|
2014 |
|
|||
|
RSUs granted |
|
|
77 |
|
|
|
- |
|
|
|
57 |
|
|
Grant date fair value of RSUs granted |
|
$ |
4,126 |
|
|
$ |
- |
|
|
$ |
2,327 |
|
|
LTIP Units granted |
|
|
197 |
|
|
|
- |
|
|
|
113 |
|
|
Grant date fair value of LTIP Units granted |
|
$ |
8,984 |
|
|
$ |
- |
|
|
$ |
4,692 |
|
Restricted Stock Units (“RSUs”)
In addition to the RSUs granted under the PPP, we grant RSUs to certain employees, generally on an annual basis. Each RSU represents the right to receive one share of common stock of the Parent and generally vests over a continued service period. The RSUs earn cash dividends during the vesting period and are, therefore, considered participating securities. We charge the value of the dividend to retained earnings. The fair value of the RSU is generally based on the market price of the Parent’s common stock on the date the award is granted and is charged to compensation expense over the service period, which is generally three years.
The following table summarizes the activity for RSUs for the year ended December 31, 2016 (units in thousands):
|
|
|
Number of RSUs |
|
|
Weighted Average Grant-Date Fair Value |
|
|
Number of RSUs Vested |
|
|||
|
Balance at January 1, 2016 |
|
|
1,626 |
|
|
$ |
42.21 |
|
|
|
109 |
|
|
Granted |
|
|
843 |
|
|
|
38.53 |
|
|
|
|
|
|
Vested and distributed |
|
|
(807 |
) |
|
|
41.70 |
|
|
|
|
|
|
Forfeited |
|
|
(45 |
) |
|
|
41.08 |
|
|
|
|
|
|
Balance at December 31, 2016 |
|
|
1,617 |
|
|
$ |
40.58 |
|
|
|
125 |
|
Total remaining compensation cost related to RSUs outstanding at December 31, 2016, was $31.4 million, prior to adjustments for capitalized amounts due to our development and leasing activities. The remaining compensation cost will be recognized through 2019, with a weighted average period of 1.4 years.
84
PROLOGIS, INC. AND PROLOGIS, L.P.
NOTES TO THE CONSOLIDATED FINANCIAL STATEMENTS (CONTINUED)
Operating Partnership Long-Term Incentive Plan Units (“LTIP Units”)
LTIP Units are valued based on the market price of the Parent’s common stock on the date the award is granted and generally vest ratably over three years. Distributions are paid with respect to the LTIP Units during the vesting period and, therefore, such LTIP Units are considered participating securities. The value of the distribution is charged to Net Income Attributable to Noncontrolling Interests in the Operating Partnership.
The following table summarizes the activity for LTIP Units for the year ended December 31, 2016 (units in thousands):
|
|
|
Number of LTIP Units |
|
|
Weighted Average Grant-Date Fair Value |
|
|
Number of LTIP Units Vested |
|
|||
|
Balance at January 1, 2016 |
|
|
1,244 |
|
|
$ |
42.21 |
|
|
|
303 |
|
|
Granted |
|
|
975 |
|
|
|
39.01 |
|
|
|
|
|
|
Balance at December 31, 2016 |
|
|
2,219 |
|
|
$ |
40.81 |
|
|
|
743 |
|
Total remaining compensation cost related to LTIP Units at December 31, 2016, was $38.6 million, prior to adjustments for capitalized amounts due to our development and leasing activities. The remaining compensation cost will be recognized through 2019, with a weighted average period of 1.4 years.
Prologis Outperformance Plan Operating Partnership Long-Term Incentive Plan Units (“POP LTIP Units” formerly “OPP LTIP Units”)
At December 31, 2016, we had 0.8 million, 1.4 million and 1.3 million POP LTIP Units outstanding for the 2016 – 2018, 2015 – 2017 and 2014 – 2016 performance periods, respectively. The following table summarizes the activity for the POP LTIP Units for the year ended December 31, 2016 (units in thousands):
|
|
|
Number of POP LTIP Units |
|
|
|
Balance at January 1, 2016 |
|
|
3,464 |
|
|
Granted |
|
|
953 |
|
|
Forfeited |
|
|
(927 |
) |
|
Balance at December 31, 2016 |
|
|
3,490 |
|
Stock Options
We have 2.1 million stock options outstanding and exercisable at December 31, 2016, with a weighted average exercise price of $36.14 and a weighted average life of 2.5 years. The aggregate intrinsic value of exercised options was $45.6 million, $13.7 million, and $5.8 million for the years ended December 31, 2016, 2015 and 2014, respectively. No stock options were granted in the three-year period ended December 31, 2016.
Other Plans
The Prologis 401(k) Plan (the “401(k) Plan”) provides for matching employer contributions of $0.50 for every dollar contributed by an employee, up to 6% of the employee’s annual compensation (within the statutory compensation limit). In the 401(k) Plan, vesting in the matching employer contributions is based on the employee’s years of service, with 100% vesting at the completion of one year of service. Our contributions under the matching provisions were $2.7 million, $2.5 million and $2.2 million for 2016, 2015 and 2014, respectively.
We have a non-qualified savings plan that allows highly compensated employees the opportunity to defer the receipt and income taxation of a certain portion of their compensation in excess of the amount permitted under the 401(k) Plan. There has been no employer matching in the three-year period ended December 31, 2016.
85
PROLOGIS, INC. AND PROLOGIS, L.P.
NOTES TO THE CONSOLIDATED FINANCIAL STATEMENTS (CONTINUED)
Components of Earnings Before Income Taxes
The following table summarizes the components of earnings before income taxes for the years ended December 31 (in thousands):
|
|
|
2016 |
|
|
2015 |
|
|
2014 |
|
|||
|
Domestic |
|
$ |
719,018 |
|
|
$ |
511,025 |
|
|
$ |
390,874 |
|
|
International |
|
|
628,086 |
|
|
|
437,580 |
|
|
|
322,754 |
|
|
Earnings before income taxes |
|
$ |
1,347,104 |
|
|
$ |
948,605 |
|
|
$ |
713,628 |
|
Summary of Current and Deferred Income Taxes
The following table summarizes the components of the provision for income taxes for the years ended December 31 (in thousands):
|
|
|
2016 |
|
|
2015 |
|
|
2014 |
|
|||
|
Current income tax expense (benefit): |
|
|
|
|
|
|
|
|
|
|
|
|
|
U.S. federal |
|
$ |
7,153 |
|
|
$ |
(11,633 |
) |
|
$ |
(6,585 |
) |
|
International |
|
|
38,493 |
|
|
|
27,494 |
|
|
|
52,155 |
|
|
State and local |
|
|
14,443 |
|
|
|
12,286 |
|
|
|
16,014 |
|
|
Total current tax expense |
|
|
60,089 |
|
|
|
28,147 |
|
|
|
61,584 |
|
|
|
|
|
|
|
|
|
|
|
|
|
|
|
|
Deferred income tax expense (benefit): |
|
|
|
|
|
|
|
|
|
|
|
|
|
U.S. federal |
|
|
(3,306 |
) |
|
|
(810 |
) |
|
|
(27,374 |
) |
|
International |
|
|
(2,219 |
) |
|
|
(4,247 |
) |
|
|
(59,866 |
) |
|
Total deferred tax benefit |
|
|
(5,525 |
) |
|
|
(5,057 |
) |
|
|
(87,240 |
) |
|
Total income tax expense (benefit) |
|
$ |
54,564 |
|
|
$ |
23,090 |
|
|
$ |
(25,656 |
) |
Current Income Taxes
Current income tax expense recognized during 2016 is principally due to tax triggered upon the contribution of assets to our Mexico and Japan co-investment ventures and third party sales from our U.S.TRS. Contributions to our co-investment ventures were not significant during 2015, as such there was a limited impact on current income tax expense. Current income tax expense during 2014 is principally due to taxes triggered upon the contribution of the initial portfolio of properties of certain wholly-owned and AFORES entities to FIBRA Prologis. Current income tax expense during 2015 and 2014 was netted against a current benefit recognized during each year as a result of the operating losses generated by our U.S. TRS.
For the years ended December 31, 2016, 2015 and 2014, we recognized a net expense of $0.3 million and $3.0 million and a net benefit of $1.1 million for uncertain tax positions, respectively.
During the years ended December 31, 2016, 2015 and 2014, cash paid for income taxes, net of refunds, was $29.3 million, $24.1 million and $105.4 million, respectively.
Deferred Income Taxes
The deferred income tax benefits recognized in 2016, 2015 and 2014 were primarily due to a reduction in book basis of the real estate as compared to the tax basis and the reversal of deferred tax liabilities from the contribution and dispositions of properties. The deferred tax liabilities were originally recorded at the time of acquisition. The majority of the deferred tax benefit we recognized in 2014 was due to the reversal of deferred tax liabilities in connection with the initial contribution of properties to FIBRA Prologis and due to the expiration of the holding period on properties previously acquired with existing built-in-gains.
86
PROLOGIS, INC. AND PROLOGIS, L.P.
NOTES TO THE CONSOLIDATED FINANCIAL STATEMENTS (CONTINUED)
The following table summarizes the deferred income tax assets and liabilities at December 31 (in thousands):
|
|
|
2016 |
|
|
2015 |
|
||
|
Gross deferred income tax assets: |
|
|
|
|
|
|
|
|
|
Net operating loss carryforwards (1) |
|
$ |
350,909 |
|
|
$ |
321,144 |
|
|
Basis difference – real estate properties |
|
|
56,827 |
|
|
|
89,856 |
|
|
Basis difference – equity investments and intangibles |
|
|
4,666 |
|
|
|
15,593 |
|
|
Section 163(j) interest limitation |
|
|
40,766 |
|
|
|
32,684 |
|
|
Capital loss carryforward |
|
|
25,145 |
|
|
|
25,282 |
|
|
Other – temporary differences |
|
|
5,578 |
|
|
|
8,993 |
|
|
Total gross deferred income tax assets |
|
|
483,891 |
|
|
|
493,552 |
|
|
Valuation allowance |
|
|
(456,699 |
) |
|
|
(467,440 |
) |
|
Gross deferred income tax assets, net of valuation allowance |
|
|
27,192 |
|
|
|
26,112 |
|
|
Gross deferred income tax liabilities: |
|
|
|
|
|
|
|
|
|
Basis difference – real estate properties |
|
|
70,914 |
|
|
|
82,160 |
|
|
Basis difference – equity investments and intangibles |
|
|
6,864 |
|
|
|
6,170 |
|
|
Other – temporary differences |
|
|
1,028 |
|
|
|
993 |
|
|
Total gross deferred income tax liabilities |
|
|
78,806 |
|
|
|
89,323 |
|
|
Net deferred income tax liabilities |
|
$ |
51,614 |
|
|
$ |
63,211 |
|
|
(1) |
At December 31, 2016, we had NOL carryforwards as follows (in thousands): |
|
|
|
U.S. |
|
|
Europe |
|
|
Mexico |
|
|
Japan |
|
|
Other |
|
|||||
|
|
Gross NOL carryforward |
$ |
97,565 |
|
|
$ |
640,431 |
|
|
$ |
371,284 |
|
|
$ |
115,154 |
|
|
$ |
48,318 |
|
|
|
Tax-effected NOL carryforward |
|
36,597 |
|
|
|
162,067 |
|
|
|
117,633 |
|
|
|
23,001 |
|
|
|
11,611 |
|
|
|
Valuation allowance |
|
(36,597 |
) |
|
|
(146,684 |
) |
|
|
(117,633 |
) |
|
|
(23,001 |
) |
|
|
(11,611 |
) |
|
|
Net deferred tax asset – NOL carryforward |
$ |
- |
|
|
$ |
15,383 |
|
|
$ |
- |
|
|
$ |
- |
|
|
$ |
- |
|
|
|
Expiration periods |
2023 – 2036 |
|
|
2017 – indefinite |
|
|
2017 – 2027 |
|
|
2017 – 2025 |
|
|
2017 – indefinite |
|
|||||
The deferred tax asset valuation allowance at December 31, 2016, is adequate to reduce the total deferred tax asset to an amount that we estimate will more likely than not be realized.
Liability for Uncertain Tax Positions
During the years ended December 31, 2016, 2015 and 2014, we believe that we have complied with the REIT requirements of the Internal Revenue Code. The statute of limitations for our tax returns is generally three years. As such, our tax returns that remain subject to examination would be primarily from 2013 and thereafter.
The liability for uncertain tax positions was $3.0 million, $3.3 million and $0.3 million for the years ended December 31, 2016, 2015 and 2014, respectively, and principally consisted of estimated federal income tax liabilities and included accrued interest and penalties.
NOTE 15. EARNINGS PER COMMON SHARE OR UNIT
We determine basic earnings per share or unit based on the weighted average number of shares of common stock or units outstanding during the period. We compute diluted earnings per share or unit based on the weighted average number of shares or units outstanding combined with the incremental weighted average effect from all outstanding potentially dilutive instruments.
87
PROLOGIS, INC. AND PROLOGIS, L.P.
NOTES TO THE CONSOLIDATED FINANCIAL STATEMENTS (CONTINUED)
The computation of our basic and diluted earnings per share and unit for the years ended December 31 (in thousands, except per share and unit amounts) is as follows:
|
Prologis, Inc. |
|
2016 |
|
|
2015 |
|
|
2014 |
|
|||
|
Net earnings attributable to common stockholders – Basic |
|
$ |
1,203,218 |
|
|
$ |
862,788 |
|
|
$ |
622,235 |
|
|
Net earnings attributable to exchangeable limited partnership units (1) |
|
|
37,079 |
|
|
|
13,120 |
|
|
|
3,636 |
|
|
Gains, net of expenses, associated with exchangeable debt assumed exchanged (2) |
|
|
- |
|
|
|
(1,614 |
) |
|
|
- |
|
|
Adjusted net earnings attributable to common stockholders – Diluted |
|
$ |
1,240,297 |
|
|
$ |
874,294 |
|
|
$ |
625,871 |
|
|
|
|
|
|
|
|
|
|
|
|
|
|
|
|
Weighted average common shares outstanding – Basic |
|
|
526,103 |
|
|
|
521,241 |
|
|
|
499,583 |
|
|
Incremental weighted average effect on exchange of limited partnership units (1) |
|
|
16,833 |
|
|
|
8,569 |
|
|
|
3,501 |
|
|
Incremental weighted average effect of equity awards and warrant |
|
|
3,730 |
|
|
|
1,961 |
|
|
|
3,307 |
|
|
Incremental weighted average effect on exchangeable debt assumed exchanged (2) |
|
|
- |
|
|
|
2,173 |
|
|
|
- |
|
|
Weighted average common shares outstanding – Diluted (3) |
|
|
546,666 |
|
|
|
533,944 |
|
|
|
506,391 |
|
|
|
|
|
|
|
|
|
|
|
|
|
|
|
|
Net earnings per share attributable to common stockholders: |
|
|
|
|
|
|
|
|
|
|
|
|
|
Basic |
|
$ |
2.29 |
|
|
$ |
1.66 |
|
|
$ |
1.25 |
|
|
Diluted |
|
$ |
2.27 |
|
|
$ |
1.64 |
|
|
$ |
1.24 |
|
|
Prologis, L.P. |
|
2016 |
|
|
2015 |
|
|
2014 |
|
|||
|
Net earnings attributable to common unitholders |
|
$ |
1,237,519 |
|
|
$ |
873,914 |
|
|
$ |
624,436 |
|
|
Net earnings attributable to Class A convertible common unitholders |
|
|
(20,069 |
) |
|
|
(3,393 |
) |
|
|
- |
|
|
Net earnings attributable to common unitholders – Basic |
|
$ |
1,217,450 |
|
|
$ |
870,521 |
|
|
$ |
624,436 |
|
|
Net earnings attributable to Class A convertible common unitholders |
|
|
20,069 |
|
|
|
3,393 |
|
|
|
- |
|
|
Net earnings attributable to exchangeable limited partnership units |
|
|
2,778 |
|
|
|
1,994 |
|
|
|
1,435 |
|
|
Gain, net of expenses, associated with exchangeable debt assumed exchanged (2) |
|
|
- |
|
|
|
(1,614 |
) |
|
|
- |
|
|
Adjusted net earnings attributable to common unitholders – Diluted |
|
$ |
1,240,297 |
|
|
$ |
874,294 |
|
|
$ |
625,871 |
|
|
|
|
|
|
|
|
|
|
|
|
|
|
|
|
Weighted average common partnership units outstanding – Basic |
|
|
532,326 |
|
|
|
525,912 |
|
|
|
501,349 |
|
|
Incremental weighted average effect on exchange of Class A convertible units |
|
|
8,775 |
|
|
|
2,050 |
|
|
|
- |
|
|
Incremental weighted average effect on exchange of limited partnership units |
|
|
1,835 |
|
|
|
1,848 |
|
|
|
1,735 |
|
|
Incremental weighted average effect of equity awards and warrant of Prologis, Inc. |
|
|
3,730 |
|
|
|
1,961 |
|
|
|
3,307 |
|
|
Incremental weighted average effect on exchangeable debt assumed exchanged (2) |
|
|
- |
|
|
|
2,173 |
|
|
|
- |
|
|
Weighted average common partnership units outstanding – Diluted (3) |
|
|
546,666 |
|
|
|
533,944 |
|
|
|
506,391 |
|
|
|
|
|
|
|
|
|
|
|
|
|
|
|
|
Net earnings per unit attributable to common unitholders: |
|
|
|
|
|
|
|
|
|
|
|
|
|
Basic |
|
$ |
2.29 |
|
|
$ |
1.66 |
|
|
$ |
1.25 |
|
|
Diluted |
|
$ |
2.27 |
|
|
$ |
1.64 |
|
|
$ |
1.24 |
|
|
(1) |
Earnings allocated to the exchangeable Operating Partnership units not held by the Parent have been included in the numerator and exchangeable Operating Partnership units have been included in the denominator for the purpose of computing diluted earnings per share for all periods as the per share and unit amount is the same. |
|
(2) |
In March 2015, the exchangeable debt was settled primarily through the issuance of common stock. The adjustment in 2015 assumes the exchange occurred on January 1, 2015. |
|
(3) |
Our total potentially dilutive shares and units outstanding consisted of the following: |
|
|
|
2016 |
|
|
2015 |
|
|
2014 |
|
|||
|
|
Total weighted average potentially dilutive limited partnership units |
|
10,610 |
|
|
|
3,898 |
|
|
|
1,932 |
|
|
|
Total potentially dilutive stock awards |
|
8,444 |
|
|
|
7,299 |
|
|
|
14,366 |
|
|
|
Total weighted average potentially dilutive shares and units from exchangeable debt |
|
- |
|
|
|
2,173 |
|
|
|
11,879 |
|
|
|
Total Prologis, L.P. |
|
19,054 |
|
|
|
13,370 |
|
|
|
28,177 |
|
|
|
Limited partners in Prologis, L.P. |
|
6,223 |
|
|
|
4,671 |
|
|
|
1,766 |
|
|
|
Total Prologis, Inc. |
|
25,277 |
|
|
|
18,041 |
|
|
|
29,943 |
|
88
PROLOGIS, INC. AND PROLOGIS, L.P.
NOTES TO THE CONSOLIDATED FINANCIAL STATEMENTS (CONTINUED)
NOTE 16. FINANCIAL INSTRUMENTS AND FAIR VALUE MEASUREMENTS
Derivative Financial Instruments
In the normal course of business, our operations are exposed to market risks, including the effect of changes in foreign currency exchange rates and interest rates. To manage these risks, we may enter into various derivative contracts, such as foreign currency contracts to manage foreign currency exposure, and interest rate swaps to manage the effect of interest rate fluctuations. We do not use derivative financial instruments for trading or speculative purposes. All of our derivative financial instruments are customized derivative transactions and are not exchange-traded. Management reviews our hedging program, derivative positions and overall risk management strategy on a regular basis. We enter into only those transactions we believe will be highly effective at offsetting the underlying risk.
See Note 2 for additional information about our derivative financial instrument policy.
The following table presents the fair value and classification of our derivative instruments at December 31 (in thousands):
|
|
|
2016 |
|
|
2015 |
|
||||||||||
|
|
|
Asset |
|
|
Liability |
|
|
Asset |
|
|
Liability |
|
||||
|
Net investment hedges |
|
|
|
|
|
|
|
|
|
|
|
|
|
|
|
|
|
Canadian dollar denominated |
|
$ |
1,245 |
|
|
$ |
- |
|
|
$ |
- |
|
|
$ |
- |
|
|
Pound sterling denominated |
|
|
7,439 |
|
|
|
- |
|
|
|
33,471 |
|
|
|
- |
|
|
|
|
|
|
|
|
|
|
|
|
|
|
|
|
|
|
|
|
Forwards and options |
|
|
|
|
|
|
|
|
|
|
|
|
|
|
|
|
|
Euro denominated (1) |
|
|
10,933 |
|
|
|
- |
|
|
|
11,711 |
|
|
|
84 |
|
|
Pound sterling denominated (1) |
|
|
16,985 |
|
|
|
- |
|
|
|
4,241 |
|
|
|
745 |
|
|
Yen denominated (1) |
|
|
9,246 |
|
|
|
1,071 |
|
|
|
832 |
|
|
|
717 |
|
|
Other (1) |
|
|
831 |
|
|
|
197 |
|
|
|
3,324 |
|
|
|
88 |
|
|
|
|
|
|
|
|
|
|
|
|
|
|
|
|
|
|
|
|
Interest rate hedges |
|
|
435 |
|
|
|
- |
|
|
|
- |
|
|
|
12,095 |
|
|
|
|
|
|
|
|
|
|
|
|
|
|
|
|
|
|
|
|
Total fair value of derivatives |
|
$ |
47,114 |
|
|
$ |
1,268 |
|
|
$ |
53,579 |
|
|
$ |
13,729 |
|
|
(1) |
As discussed in Note 2, these foreign currency contracts are not designated as hedges, with the exception of cash flow hedges denominated in pesos, which matured in 2016. |
Foreign Currency
The following tables summarize the activity in our foreign currency contracts for the years ended December 31 (in millions, except for weighted average forward rates and number of active contracts):
|
2016 |
Foreign Currency Contracts |
|
|||||||||||||||||||||||||
|
|
Net Investment Hedges |
|
|
Forwards and Options |
|
||||||||||||||||||||||
|
Local Currency |
CAD |
|
|
GBP |
|
|
JPY |
|
|
EUR |
|
|
GBP |
|
|
JPY |
|
|
Other |
|
|||||||
|
Notional amounts at January 1 |
$ |
- |
|
|
£ |
238 |
|
|
¥ |
- |
|
|
€ |
275 |
|
|
£ |
97 |
|
|
¥ |
12,840 |
|
|
|
|
|
|
New contracts |
|
133 |
|
|
|
90 |
|
|
|
11,189 |
|
|
|
369 |
|
|
|
- |
|
|
|
15,460 |
|
|
|
|
|
|
Matured, expired or settled contracts |
|
- |
|
|
|
(297 |
) |
|
|
(11,189 |
) |
|
|
(470 |
) |
|
|
(49 |
) |
|
|
(12,800 |
) |
|
|
|
|
|
Notional amounts at December 31 |
$ |
133 |
|
|
£ |
31 |
|
|
¥ |
- |
|
|
€ |
174 |
|
|
£ |
48 |
|
|
¥ |
15,500 |
|
|
|
|
|
|
|
|
|
|
|
|
|
|
|
|
|
|
|
|
|
|
|
|
|
|
|
|
|
|
|
|
|
|
|
|
Foreign Currency Contracts |
|
|||||||||||||||||||||||||
|
U.S. Dollar |
Net Investment Hedges |
|
|
Forwards and Options (1) |
|
||||||||||||||||||||||
|
Notional amounts at January 1 |
$ |
- |
|
|
$ |
386 |
|
|
$ |
- |
|
|
$ |
310 |
|
|
$ |
148 |
|
|
$ |
109 |
|
|
$ |
50 |
|
|
New contracts |
|
100 |
|
|
|
131 |
|
|
|
99 |
|
|
|
413 |
|
|
|
- |
|
|
|
146 |
|
|
|
15 |
|
|
Matured, expired or settled contracts |
|
- |
|
|
|
(471 |
) |
|
|
(99 |
) |
|
|
(526 |
) |
|
|
(70 |
) |
|
|
(111 |
) |
|
|
(27 |
) |
|
Notional amounts at December 31 |
$ |
100 |
|
|
$ |
46 |
|
|
$ |
- |
|
|
$ |
197 |
|
|
$ |
78 |
|
|
$ |
144 |
|
|
$ |
38 |
|
|
|
|
|
|
|
|
|
|
|
|
|
|
|
|
|
|
|
|
|
|
|
|
|
|
|
|
|
|
|
Weighted average forward rate at December 31 |
|
1.33 |
|
|
|
1.51 |
|
|
|
- |
|
|
|
1.13 |
|
|
|
1.54 |
|
|
|
107.68 |
|
|
|
|
|
|
Active contracts at December 31 |
|
2 |
|
|
|
2 |
|
|
|
- |
|
|
|
24 |
|
|
|
8 |
|
|
|
30 |
|
|
|
16 |
|
89
PROLOGIS, INC. AND PROLOGIS, L.P.
NOTES TO THE CONSOLIDATED FINANCIAL STATEMENTS (CONTINUED)
|
|
Foreign Currency Contracts |
|
||||||||||||||||||||||||||||||
|
|
|
Net Investment Hedges |
|
|
Forwards and Options |
|
||||||||||||||||||||||||||
|
Local Currency |
|
CAD |
|
|
EUR |
|
|
GBP |
|
|
JPY |
|
|
EUR |
|
|
GBP |
|
|
JPY |
|
|
Other |
|
||||||||
|
Notional amounts at January 1 |
|
$ |
- |
|
|
€ |
300 |
|
|
£ |
238 |
|
|
¥ |
24,136 |
|
|
€ |
284 |
|
|
£ |
- |
|
|
¥ |
- |
|
|
|
|
|
|
New contracts |
|
|
394 |
|
|
|
- |
|
|
|
118 |
|
|
|
43,373 |
|
|
|
333 |
|
|
|
199 |
|
|
|
18,740 |
|
|
|
|
|
|
Matured, expired or settled contracts |
|
|
(394 |
) |
|
|
(300 |
) |
|
|
(118 |
) |
|
|
(67,509 |
) |
|
|
(342 |
) |
|
|
(102 |
) |
|
|
(5,900 |
) |
|
|
|
|
|
Notional amounts at December 31 |
|
$ |
- |
|
|
€ |
- |
|
|
£ |
238 |
|
|
¥ |
- |
|
|
€ |
275 |
|
|
£ |
97 |
|
|
¥ |
12,840 |
|
|
|
|
|
|
|
|
|
|
|
|
|
|
|
|
|
|
|
|
|
|
|
|
|
|
|
|
|
|
|
|
|
|
|
|
|
|
|
|
|
|
Foreign Currency Contracts |
|
|||||||||||||||||||||||||||||
|
U.S. Dollar |
|
Net Investment Hedges |
|
|
Forwards and Options (1) |
|
||||||||||||||||||||||||||
|
Notional amounts at January 1 |
|
$ |
- |
|
|
$ |
400 |
|
|
$ |
400 |
|
|
$ |
250 |
|
|
$ |
354 |
|
|
$ |
- |
|
|
$ |
- |
|
|
$ |
- |
|
|
New contracts |
|
|
298 |
|
|
|
- |
|
|
|
186 |
|
|
|
353 |
|
|
|
375 |
|
|
|
300 |
|
|
|
159 |
|
|
|
71 |
|
|
Matured, expired or settled contracts |
|
|
(298 |
) |
|
|
(400 |
) |
|
|
(200 |
) |
|
|
(603 |
) |
|
|
(419 |
) |
|
|
(152 |
) |
|
|
(50 |
) |
|
|
(21 |
) |
|
Notional amounts at December 31 |
|
$ |
- |
|
|
$ |
- |
|
|
$ |
386 |
|
|
$ |
- |
|
|
$ |
310 |
|
|
$ |
148 |
|
|
$ |
109 |
|
|
$ |
50 |
|
|
2014 |
|
Foreign Currency Contracts |
|
|||||||||||||
|
|
|
Net Investment Hedges |
|
|
Forwards and Options |
|
||||||||||
|
Local Currency |
|
EUR |
|
|
GBP |
|
|
JPY |
|
|
EUR |
|
||||
|
Notional amounts at January 1 |
|
€ |
600 |
|
|
£ |
- |
|
|
¥ |
24,136 |
|
|
€ |
- |
|
|
New contracts |
|
|
1,746 |
|
|
|
238 |
|
|
|
79,010 |
|
|
|
365 |
|
|
Matured, expired or settled contracts |
|
|
(2,046 |
) |
|
|
- |
|
|
|
(79,010 |
) |
|
|
(81 |
) |
|
Notional amounts at December 31 |
|
€ |
300 |
|
|
£ |
238 |
|
|
¥ |
24,136 |
|
|
€ |
284 |
|
|
|
|
|
|
|
|
|
|
|
|
|
|
|
|
|
|
|
|
|
|
Foreign Currency Contracts |
|
|||||||||||||
|
U.S. Dollar |
|
Net Investment Hedges |
|
|
Forwards and Options (1) |
|
||||||||||
|
Notional amounts at January 1 |
|
$ |
800 |
|
|
$ |
- |
|
|
$ |
250 |
|
|
$ |
- |
|
|
New contracts |
|
|
2,354 |
|
|
|
400 |
|
|
|
769 |
|
|
|
464 |
|
|
Matured, expired or settled contracts |
|
|
(2,754 |
) |
|
|
- |
|
|
|
(769 |
) |
|
|
(110 |
) |
|
Notional amounts at December 31 |
|
$ |
400 |
|
|
$ |
400 |
|
|
$ |
250 |
|
|
$ |
354 |
|
|
(1) |
During 2016, 2015 and 2014, we exercised 49, 32 and 3 option contracts and realized gains of $3.0 million, $14.6 million and $1.1 million, respectively, in Foreign Currency and Derivative Gains (Losses), Net. |
We recognized unrealized gains of $19.1 million, $22.1 million and $7.7 million in Foreign Currency and Derivative Gains (Losses), Net from the change in value of our outstanding foreign currency option contracts for the years ended December 31, 2016, 2015 and 2014, respectively.
We had no ineffectiveness on our foreign currency derivative contracts during 2016, 2015 or 2014.
Interest Rate
The following table summarizes the activity in our interest rate swaps for the years ended December 31 (in millions):
|
|
|
2016 (1) |
|
|
2015 |
|
|
2014 |
|
|||
|
Notional amounts at January 1 |
|
$ |
1,196 |
|
|
$ |
398 |
|
|
$ |
71 |
|
|
New contracts |
|
|
- |
|
|
|
1,158 |
|
|
|
398 |
|
|
Matured, expired or settled contracts |
|
|
(925 |
) |
|
|
(360 |
) |
|
|
(71 |
) |
|
Notional amounts at December 31 |
|
$ |
271 |
|
|
$ |
1,196 |
|
|
$ |
398 |
|
|
(1) |
We had three interest rate swaps hedges outstanding at December 31, 2016. |
In January 2016, the Bank of Japan introduced negative interest rates. As a result, our two Japanese yen denominated interest rate hedges related to the 2015 yen term loan no longer qualified for hedge accounting due to a zero percent floor mismatch in the hedging relationship. These interest rate hedges were designated as cash flow hedges at December 31, 2015, and the change in fair value was recorded in Other Comprehensive Income. We began recording the change in fair value of these interest rate hedges to the Consolidated Statements of Income when the hedges no longer qualified for hedge accounting.
In August 2016, we entered into the Yen Term Loan and repaid our 2014, 2015 and 2016 yen term loans. At that time, we settled the outstanding contracts related to the previously outstanding term loans for $26.3 million. The fair value of the contracts that qualified for hedge accounting at the date of repayment was recorded to AOCI and will be amortized to Interest Expense over the life of the original term loans. We had $13.7 million remaining in AOCI at December 31, 2016. The change in fair value on the unhedged portion of the
90
PROLOGIS, INC. AND PROLOGIS, L.P.
NOTES TO THE CONSOLIDATED FINANCIAL STATEMENTS (CONTINUED)
contracts was recorded in the Consolidated Statements of Income. During the year ended December 31, 2016, we recorded a loss of $9.9 million, respectively, in Foreign Currency and Derivative Gains (Losses), Net. See Note 9 for further discussion of the Yen Term Loan.
During 2015, we entered into two contracts with a notional amount of $526.3 million (¥65.0 billion) to effectively fix the interest rate on the 2015 yen term loan (see above for discussion on the settlement of these contracts) and three contracts with a notional amount of CAD $371.9 million ($271.2 million) to effectively fix the interest rate on the Canadian term loan. In the third quarter of 2015, we entered into two contracts with a notional amount of $360.0 million to effectively fix the interest rate at the three month LIBOR rate of 2.3% on expected future debt issuances. These contracts were settled in the fourth quarter of 2015 when we entered into $750.0 million of senior notes. We recorded a loss of $11.0 million associated with these derivatives that will be amortized to Interest Expense, in accordance with our policy.
During 2014, we entered into two contracts with a notional amount of $398.3 million (¥40.9 billion) to effectively fix the interest rate on the 2014 yen term loan. See above for discussion on the settlement of these contracts.
See Note 9 for more information on our term loans.
Other Comprehensive Income
The change in Other Comprehensive Income in the Consolidated Statements of Comprehensive Income during the periods presented is due to the translation on consolidation of the financial statements into U.S. dollars of our consolidated subsidiaries whose functional currency is not the U.S. dollar for which we recorded losses of $304.0 million, $594.0 million and $614.8 million for the years ended December 31, 2016, 2015 and 2014, respectively. It also includes the change in fair value for the effective portion of our derivative and nonderivative instruments that have been designated as hedges.
The following table presents the gains and (losses) associated with the change in fair value for the effective portion of our derivative and nonderivative hedging instruments included in Other Comprehensive Income for the years ended December 31 (in thousands):
|
|
|
2016 |
|
|
2015 |
|
|
2014 |
|
|||
|
Derivative net investment hedges (1) |
|
$ |
55,460 |
|
|
$ |
63,934 |
|
|
$ |
122,164 |
|
|
Interest rate and cash flow hedges (2) |
|
|
(551 |
) |
|
|
(21,714 |
) |
|
|
(804 |
) |
|
Our share of derivatives from unconsolidated co-investment ventures |
|
|
(798 |
) |
|
|
4,257 |
|
|
|
(5,694 |
) |
|
Total derivative instruments |
|
|
54,111 |
|
|
|
46,477 |
|
|
|
115,666 |
|
|
Nonderivative net investment hedges (3) |
|
|
112,591 |
|
|
|
321,148 |
|
|
|
321,196 |
|
|
Total derivative and nonderivative hedging instruments |
|
$ |
166,702 |
|
|
$ |
367,625 |
|
|
$ |
436,862 |
|
|
(1) |
We received $79.8 million, $128.2 million and $13.0 million for the years ended December 31, 2016, 2015 and 2014, respectively, on the settlement of net investment hedges. |
|
(2) |
The amount reclassified to interest expense was $5.5 million for 2016 and for 2015 and 2014 the amounts were not considered significant. For the next 12 months from December 31, 2016, we estimate an additional expense of $5.4 million will be reclassified to Interest Expense. |
|
(3) |
At December 31, 2016, 2015 and 2014, we had €3.2 billion ($3.4 billion), €3.2 billion ($3.5 billion) and €2.5 million ($3.0 billion) of debt, net of accrued interest, respectively, designated as nonderivative financial instrument hedges of our net investment in international subsidiaries. We had €97.6 million ($118.5 million) of debt that was not designated as a nonderivative financial instrument hedge at December 31, 2014. We recognized unrealized gains of $10.0 million and $7.7 million in Foreign Currency and Derivative Gains (Losses), Net on the unhedged portion of our debt for the years ended December 31, 2015 and 2014, respectively. There were no unrealized gains or losses recognized for the year ended December 31, 2016. |
Fair Value Measurements
We have estimated the fair value of our financial instruments using available market information and valuation methodologies we believe to be appropriate for these purposes. Considerable judgment and a high degree of subjectivity are involved in developing these estimates and, accordingly, they are not necessarily indicative of amounts that we would realize on disposition. See Note 2 for more information on our fair value measurements policy.
Fair Value Measurements on a Recurring Basis
At December 31, 2016 and 2015, other than the derivatives discussed previously, we did not have any significant financial assets or financial liabilities that were measured at fair value on a recurring basis in the Consolidated Financial Statements. All of our derivatives held at December 31, 2016 and 2015, were classified as Level 2 of the fair value hierarchy.
91
PROLOGIS, INC. AND PROLOGIS, L.P.
NOTES TO THE CONSOLIDATED FINANCIAL STATEMENTS (CONTINUED)
Fair Value Measurements on Nonrecurring Basis
No assets met the criteria to be measured at fair value on a nonrecurring basis at December 31, 2016 or 2015.
Fair Value of Financial Instruments
At December 31, 2016 and 2015, the carrying amounts of certain financial instruments, including cash and cash equivalents, restricted cash, accounts and notes receivable, accounts payable and accrued expenses were representative of their fair values because of the short-term nature of these instruments.
The differences in the fair value of our debt from the carrying value in the table below are the result of differences in interest rates or borrowing spreads that were available to us at December 31, 2016 and 2015, as compared with those in effect when the debt was issued or assumed, including reduced borrowing spreads due to our improved credit ratings. The senior notes and many of the issues of secured mortgage debt contain pre-payment penalties or yield maintenance provisions that could make the cost of refinancing the debt at lower rates exceed the benefit that would be derived from doing so.
The following table reflects the carrying amounts and estimated fair values of our debt at December 31 (in thousands):
|
|
|
2016 |
|
|
2015 |
|
||||||||||
|
|
|
Carrying Value |
|
|
Fair Value |
|
|
Carrying Value |
|
|
Fair Value |
|
||||
|
Credit Facilities |
|
$ |
35,023 |
|
|
$ |
35,061 |
|
|
$ |
- |
|
|
$ |
- |
|
|
Senior notes |
|
|
6,417,492 |
|
|
|
6,935,485 |
|
|
|
6,516,392 |
|
|
|
6,801,118 |
|
|
Term loans and unsecured other |
|
|
1,499,001 |
|
|
|
1,510,661 |
|
|
|
2,115,457 |
|
|
|
2,128,270 |
|
|
Secured mortgages |
|
|
979,585 |
|
|
|
1,055,020 |
|
|
|
1,172,473 |
|
|
|
1,262,778 |
|
|
Secured mortgages of consolidated entities |
|
|
1,677,193 |
|
|
|
1,683,489 |
|
|
|
1,822,509 |
|
|
|
1,825,361 |
|
|
Total debt |
|
$ |
10,608,294 |
|
|
$ |
11,219,716 |
|
|
$ |
11,626,831 |
|
|
$ |
12,017,527 |
|
NOTE 17. COMMITMENTS AND CONTINGENCIES
Environmental Matters
A majority of the properties we acquire, including land, are subjected to environmental reviews either by us or the previous owners. In addition, we may incur environmental remediation costs associated with certain land parcels we acquire in connection with the development of the land. We have acquired certain properties that may have been leased to or previously owned by companies that discharged hazardous materials. We establish a liability at the time of acquisition to cover such costs and adjust the liabilities as appropriate when additional information becomes available. We record our environmental liabilities in Other Liabilities. We purchase various environmental insurance policies to mitigate our exposure to environmental liabilities. We are not aware of any environmental liabilities that would have a material adverse effect on our business, financial condition or results of operations.
Indemnification Agreements
We may enter into agreements whereby we indemnify certain co-investment ventures, or our venture partners, outside of the U.S. for taxes that may be assessed with respect to certain properties we contributed to these ventures. Our contributions to these ventures are generally structured as contributions of shares of companies that own the real estate assets. Accordingly, the capital gains associated with the step up in the value of the underlying real estate assets, for tax purposes, are deferred and transferred at contribution. We have generally indemnified these ventures to the extent that the ventures: (i) incur capital gains or withholding tax as a result of a direct sale of the real estate asset, as opposed to a transaction in which the shares of the company owning the real estate asset are transferred or sold or (ii) are required to grant a discount to the buyer of shares under a share transfer transaction as a result of the ventures transferring the embedded capital gain tax liability to the buyer of the shares in the transaction. The agreements limit the amount that is subject to our indemnification with respect to each property to 100% of the actual tax liabilities related to the capital gains that are deferred and transferred by us to the ventures at the time of the initial contribution less any deferred tax assets transferred with the property.
The outcome under these agreements is uncertain as it depends on the method and timing of dissolution of the related venture or disposition of any properties by the venture. We record liabilities related to the indemnification agreements in Other Liabilities. We continue to monitor these agreements and the likelihood of the sale of assets that would result in recognition and will adjust the potential liability in the future as facts and circumstances dictate.
Off-Balance Sheet Liabilities
We have issued performance and surety bonds and standby letters of credit in connection with certain development projects. Performance and surety bonds are commonly required by public agencies from real estate developers. Performance and surety bonds
92
PROLOGIS, INC. AND PROLOGIS, L.P.
NOTES TO THE CONSOLIDATED FINANCIAL STATEMENTS (CONTINUED)
are renewable and expire on the completion of the improvements and infrastructure. At December 31, 2016, and 2015 we had approximately $123.5 million and $131.1 million, respectively, outstanding under such arrangements.
We may be required under capital commitments or we may choose to make additional capital contributions to certain of our unconsolidated entities, representing our proportionate ownership interest, should additional capital contributions be necessary to fund development or acquisition costs, repayment of debt or operation shortfalls. See Note 5 for further discussion related to equity commitments to our unconsolidated entities.
Litigation
From time to time, we are party to a variety of legal proceedings arising in the ordinary course of business. We believe that, with respect to any such matters that we are currently a party to, the ultimate disposition of any such matter will not have material adverse effect on our business, financial position or results of operations.
Our current business strategy includes two operating segments: Real Estate Operations and Strategic Capital. We generate revenues, earnings, net operating income and cash flows through our segments, as follows:
|
• |
Real Estate Operations. This operating segment represents the ownership and development of operating properties and is the largest component of our revenues and earnings. We collect rent from our customers through operating leases, including reimbursements for the majority of our property operating costs. Each operating property is considered to be an individual operating segment with similar economic characteristics; these properties are combined within the reportable segment based on geographic location. Our Real Estate Operations segment also includes development activities that lead to rental operations, including land held for development and properties currently under development. Within this line of business, we capitalize on the following: (i) the land that we currently own; (ii) the development expertise of our local teams; (iii) our customer relationships; and (iv) our in-depth knowledge in connection with our development activities. Land we own and lease to customers under ground leases is also included in this segment. |
|
• |
Strategic Capital. This operating segment represents the management of unconsolidated co-investment ventures. We generate strategic capital revenues from our unconsolidated co-investment ventures through asset management and property management services and we earn additional revenues by providing leasing, acquisition, construction, development, financing and disposition services. Depending on the structure of the venture and the returns provided to our partners, we also earn revenues through promotes during the life of a venture or upon liquidation. Each unconsolidated co-investment venture we manage is considered to be an individual operating segment with similar economic characteristics; these ventures are combined within the reportable segment based on geographic location. |
Reconciliations are presented below for: (i) each reportable business segment’s revenues from external customers to Total Revenues; (ii) each reportable business segment’s net operating income from external customers to Operating Income and Earnings Before Income Taxes; and (iii) each reportable business segment’s assets to Total Assets. Our chief operating decision makers rely primarily on net operating income and similar measures to make decisions about allocating resources and assessing segment performance. The applicable components of Total Revenues, Operating Income, Earnings Before Income Taxes and Total Assets are allocated to each reportable business segment’s revenues, net operating income and assets. Items that are not directly assignable to a segment, such as certain corporate income and expenses, are not allocated but reflected as reconciling items. The following reconciliations are presented in thousands:
93
PROLOGIS, INC. AND PROLOGIS, L.P.
NOTES TO THE CONSOLIDATED FINANCIAL STATEMENTS (CONTINUED)
|
|
|
Years Ended December 31, |
|
|||||||||
|
|
|
|
2016 |
|
|
|
2015 |
|
|
|
2014 |
|
|
Revenues: |
|
|
|
|
|
|
|
|
|
|
|
|
|
Real estate operations: |
|
|
|
|
|
|
|
|
|
|
|
|
|
U.S. |
|
$ |
2,040,308 |
|
|
$ |
1,801,858 |
|
|
$ |
1,306,194 |
|
|
Other Americas |
|
|
58,541 |
|
|
|
57,535 |
|
|
|
97,370 |
|
|
Europe |
|
|
76,759 |
|
|
|
69,527 |
|
|
|
74,413 |
|
|
Asia |
|
|
62,975 |
|
|
|
57,792 |
|
|
|
62,939 |
|
|
Total Real Estate Operations segment |
|
|
2,238,583 |
|
|
|
1,986,712 |
|
|
|
1,540,916 |
|
|
Strategic capital: |
|
|
|
|
|
|
|
|
|
|
|
|
|
U.S. |
|
|
39,360 |
|
|
|
39,396 |
|
|
|
84,178 |
|
|
Other Americas |
|
|
22,777 |
|
|
|
22,288 |
|
|
|
10,990 |
|
|
Europe |
|
|
185,495 |
|
|
|
112,793 |
|
|
|
86,549 |
|
|
Asia |
|
|
46,920 |
|
|
|
35,885 |
|
|
|
38,154 |
|
|
Total Strategic Capital segment |
|
|
294,552 |
|
|
|
210,362 |
|
|
|
219,871 |
|
|
|
|
|
|
|
|
|
|
|
|
|
|
|
|
Total revenues |
|
$ |
2,533,135 |
|
|
$ |
2,197,074 |
|
|
$ |
1,760,787 |
|
|
|
|
|
|
|
|
|
|
|
|
|
|
|
|
Segment net operating income: |
|
|
|
|
|
|
|
|
|
|
|
|
|
Real estate operations: |
|
|
|
|
|
|
|
|
|
|
|
|
|
U.S. |
|
$ |
1,520,571 |
|
|
$ |
1,256,188 |
|
|
$ |
932,151 |
|
|
Other Americas |
|
|
38,136 |
|
|
|
38,280 |
|
|
|
69,120 |
|
|
Europe |
|
|
55,563 |
|
|
|
39,672 |
|
|
|
40,627 |
|
|
Asia |
|
|
41,114 |
|
|
|
41,692 |
|
|
|
45,262 |
|
|
Total Real Estate Operations segment |
|
|
1,655,384 |
|
|
|
1,375,832 |
|
|
|
1,087,160 |
|
|
Strategic capital: |
|
|
|
|
|
|
|
|
|
|
|
|
|
U.S. |
|
|
(1,622 |
) |
|
|
(1,925 |
) |
|
|
38,101 |
|
|
Other Americas |
|
|
12,755 |
|
|
|
13,277 |
|
|
|
1,911 |
|
|
Europe |
|
|
142,975 |
|
|
|
86,264 |
|
|
|
56,869 |
|
|
Asia |
|
|
11,938 |
|
|
|
4,324 |
|
|
|
7,560 |
|
|
Total Strategic Capital segment |
|
|
166,046 |
|
|
|
101,940 |
|
|
|
104,441 |
|
|
|
|
|
|
|
|
|
|
|
|
|
|
|
|
Total segment net operating income |
|
|
1,821,430 |
|
|
|
1,477,772 |
|
|
|
1,191,601 |
|
|
|
|
|
|
|
|
|
|
|
|
|
|
|
|
Reconciling items: |
|
|
|
|
|
|
|
|
|
|
|
|
|
General and administrative expenses |
|
|
222,067 |
|
|
|
217,227 |
|
|
|
229,332 |
|
|
Depreciation and amortization expenses |
|
|
930,985 |
|
|
|
880,373 |
|
|
|
642,461 |
|
|
Operating income |
|
|
668,378 |
|
|
|
380,172 |
|
|
|
319,808 |
|
|
Earnings from unconsolidated entities, net |
|
|
206,307 |
|
|
|
159,262 |
|
|
|
134,288 |
|
|
Interest expense |
|
|
(303,146 |
) |
|
|
(301,363 |
) |
|
|
(308,885 |
) |
|
Interest and other income, net |
|
|
8,101 |
|
|
|
25,484 |
|
|
|
25,768 |
|
|
Gains on dispositions of investments in real estate and revaluation of equity investments upon acquisition of a controlling interest, net |
|
|
757,398 |
|
|
|
758,887 |
|
|
|
725,790 |
|
|
Foreign currency and derivative gains (losses), net |
|
|
7,582 |
|
|
|
12,466 |
|
|
|
(17,841 |
) |
|
Gains (losses) on early extinguishment of debt, net |
|
|
2,484 |
|
|
|
(86,303 |
) |
|
|
(165,300 |
) |
|
Earnings before income taxes |
|
$ |
1,347,104 |
|
|
$ |
948,605 |
|
|
$ |
713,628 |
|
94
PROLOGIS, INC. AND PROLOGIS, L.P.
NOTES TO THE CONSOLIDATED FINANCIAL STATEMENTS (CONTINUED)
|
|
December 31, |
|
||||||
|
|
|
|
2016 |
|
|
|
2015 |
|
|
Assets: |
|
|
|
|
|
|
|
|
|
Real estate operations: |
|
|
|
|
|
|
|
|
|
U.S. |
|
$ |
21,286,422 |
|
|
$ |
22,030,457 |
|
|
Other Americas |
|
|
978,476 |
|
|
|
919,381 |
|
|
Europe |
|
|
1,346,589 |
|
|
|
1,291,991 |
|
|
Asia |
|
|
936,462 |
|
|
|
1,157,401 |
|
|
Total Real Estate Operations segment |
|
|
24,547,949 |
|
|
|
25,399,230 |
|
|
Strategic capital (1): |
|
|
|
|
|
|
|
|
|
U.S. |
|
|
18,090 |
|
|
|
19,363 |
|
|
Europe |
|
|
47,635 |
|
|
|
49,960 |
|
|
Asia |
|
|
1,301 |
|
|
|
2,005 |
|
|
Total Strategic Capital segment |
|
|
67,026 |
|
|
|
71,328 |
|
|
Total segment assets |
|
|
24,614,975 |
|
|
|
25,470,558 |
|
|
|
|
|
|
|
|
|
|
|
|
Reconciling items: |
|
|
|
|
|
|
|
|
|
Investments in and advances to unconsolidated entities |
|
|
4,230,429 |
|
|
|
4,755,620 |
|
|
Assets held for sale or contribution |
|
|
322,139 |
|
|
|
378,423 |
|
|
Notes receivable backed by real estate |
|
|
32,100 |
|
|
|
235,050 |
|
|
Cash and cash equivalents |
|
|
807,316 |
|
|
|
264,080 |
|
|
Other assets |
|
|
242,973 |
|
|
|
291,036 |
|
|
Total reconciling items |
|
|
5,634,957 |
|
|
|
5,924,209 |
|
|
Total assets |
|
$ |
30,249,932 |
|
|
$ |
31,394,767 |
|
|
(1) |
Represents management contracts and goodwill recorded in connection with business combinations associated with the Strategic Capital segment. Goodwill was $25.3 million at December 31, 2016 and 2015. |
NOTE 19. SUPPLEMENTAL CASH FLOW INFORMATION
Our significant noncash investing and financing activities for the years ended December 31, 2016, 2015 and 2014 included the following:
|
• |
We capitalized $25.8 million, $22.7 million and $21.6 million of equity-based compensation expense resulting from our development and leasing activities during 2016, 2015 and 2014, respectively. |
|
• |
In 2016, we issued 1.9 million shares of the Parent’s common stock upon redemption of an equal number of common limited partnership units in the Operating Partnership as disclosed in Note 12. |
|
• |
We received $135.3 million and $65.3 million of ownership interests in certain unconsolidated entities as a portion of our proceeds from the contribution of properties to these entities during 2016 and 2015, respectively. |
|
• |
During 2015, we assumed $290.7 million of secured mortgage debt in connection with the acquisition of real estate properties. Also, as partial consideration for the disposition of some properties acquired during 2015, the buyer assumed debt of $170.1 million. |
|
• |
In 2015, common limited partnership units were issued as partial consideration for the acquisition of properties as disclosed in Note 12. |
|
• |
See Notes 3, 9 and 12 for information related to the KTR transaction in May 2015. |
|
• |
We received $235.1 million of notes receivable backed by real estate in exchange for the disposition of real estate in 2015. See Note 7 for more information on our notes receivable backed by real estate. |
|
• |
Holders of our exchangeable senior notes exchanged the majority of their notes into common stock of the Parent in March 2015 as disclosed in Note 9. |
|
• |
As partial consideration for properties we contributed to FIBRA Prologis and the conclusion of an unconsolidated co-investment venture during 2014, we received equity valued at $609.7 million and FIBRA Prologis assumed $345.1 million of secured debt. See Note 4 for additional information about this transaction. |
|
• |
See Note 3 for information related to acquisitions of controlling interests in our unconsolidated co-investment ventures in 2014. |
95
PROLOGIS, INC. AND PROLOGIS, L.P.
NOTES TO THE CONSOLIDATED FINANCIAL STATEMENTS (CONTINUED)
NOTE 20. SELECTED QUARTERLY FINANCIAL DATA (UNAUDITED)
The following table details our selected quarterly financial data (in thousands, except per share and unit data):
|
|
|
Three Months Ended, |
|
|||||||||||||
|
Prologis, Inc. |
|
March 31, |
|
|
June 30, |
|
|
September 30, |
|
|
December 31, |
|
||||
|
2016: |
|
|
|
|
|
|
|
|
|
|
|
|
|
|
|
|
|
Rental revenues |
|
$ |
437,104 |
|
|
$ |
426,150 |
|
|
$ |
435,868 |
|
|
$ |
435,722 |
|
|
Rental recoveries |
|
$ |
117,012 |
|
|
$ |
119,981 |
|
|
$ |
124,409 |
|
|
$ |
124,163 |
|
|
Total revenues |
|
$ |
606,300 |
|
|
$ |
602,155 |
|
|
$ |
704,565 |
|
|
$ |
620,115 |
|
|
Rental expenses |
|
$ |
(146,581 |
) |
|
$ |
(140,725 |
) |
|
$ |
(140,514 |
) |
|
$ |
(141,050 |
) |
|
Operating income |
|
$ |
129,198 |
|
|
$ |
142,348 |
|
|
$ |
232,624 |
|
|
$ |
164,208 |
|
|
Consolidated net earnings |
|
$ |
222,805 |
|
|
$ |
295,791 |
|
|
$ |
307,242 |
|
|
$ |
466,702 |
|
|
Net earnings attributable to common stockholders |
|
$ |
208,041 |
|
|
$ |
275,383 |
|
|
$ |
279,255 |
|
|
$ |
440,539 |
|
|
Net earnings per share attributable to common stockholders – Basic (1) |
|
$ |
0.40 |
|
|
$ |
0.52 |
|
|
$ |
0.53 |
|
|
$ |
0.83 |
|
|
Net earnings per share attributable to common stockholders – Diluted (1) (2) |
|
$ |
0.39 |
|
|
$ |
0.52 |
|
|
$ |
0.52 |
|
|
$ |
0.82 |
|
|
2015: |
|
|
|
|
|
|
|
|
|
|
|
|
|
|
|
|
|
Rental revenues |
|
$ |
324,547 |
|
|
$ |
357,828 |
|
|
$ |
418,116 |
|
|
$ |
435,626 |
|
|
Rental recoveries |
|
$ |
94,255 |
|
|
$ |
103,616 |
|
|
$ |
114,639 |
|
|
$ |
124,560 |
|
|
Total revenues |
|
$ |
462,847 |
|
|
$ |
510,404 |
|
|
$ |
580,622 |
|
|
$ |
643,201 |
|
|
Rental expenses |
|
$ |
(127,095 |
) |
|
$ |
(125,820 |
) |
|
$ |
(140,284 |
) |
|
$ |
(150,983 |
) |
|
Operating income |
|
$ |
83,881 |
|
|
$ |
87,348 |
|
|
$ |
103,392 |
|
|
$ |
105,551 |
|
|
Consolidated net earnings |
|
$ |
351,312 |
|
|
$ |
140,260 |
|
|
$ |
307,186 |
|
|
$ |
126,757 |
|
|
Net earnings attributable to common stockholders |
|
$ |
345,206 |
|
|
$ |
140,240 |
|
|
$ |
258,979 |
|
|
$ |
118,363 |
|
|
Net earnings per share attributable to common stockholders – Basic (1) |
|
$ |
0.67 |
|
|
$ |
0.27 |
|
|
$ |
0.49 |
|
|
$ |
0.23 |
|
|
Net earnings per share attributable to common stockholders – Diluted (1) (2) |
|
$ |
0.65 |
|
|
$ |
0.27 |
|
|
$ |
0.49 |
|
|
$ |
0.23 |
|
|
|
|
|
|
|
|
|
|
|
|
|
|
|
|
|
|
|
|
Prologis, L.P. |
|
|
|
|
|
|
|
|
|
|
|
|
|
|
|
|
|
2016: |
|
|
|
|
|
|
|
|
|
|
|
|
|
|
|
|
|
Rental revenues |
|
$ |
437,104 |
|
|
$ |
426,150 |
|
|
$ |
435,868 |
|
|
$ |
435,722 |
|
|
Rental recoveries |
|
$ |
117,012 |
|
|
$ |
119,981 |
|
|
$ |
124,409 |
|
|
$ |
124,163 |
|
|
Total revenues |
|
$ |
606,300 |
|
|
$ |
602,155 |
|
|
$ |
704,565 |
|
|
$ |
620,115 |
|
|
Rental expenses |
|
$ |
(146,581 |
) |
|
$ |
(140,725 |
) |
|
$ |
(140,514 |
) |
|
$ |
(141,050 |
) |
|
Operating income |
|
$ |
129,198 |
|
|
$ |
142,348 |
|
|
$ |
232,624 |
|
|
$ |
164,208 |
|
|
Consolidated net earnings |
|
$ |
222,805 |
|
|
$ |
295,791 |
|
|
$ |
307,242 |
|
|
$ |
466,702 |
|
|
Net earnings attributable to common unitholders |
|
$ |
214,275 |
|
|
$ |
283,699 |
|
|
$ |
286,943 |
|
|
$ |
452,602 |
|
|
Net earnings per unit attributable to common unitholders – Basic (1) |
|
$ |
0.40 |
|
|
$ |
0.52 |
|
|
$ |
0.53 |
|
|
$ |
0.83 |
|
|
Net earnings per unit attributable to common unitholders – Diluted (1) (2) |
|
$ |
0.39 |
|
|
$ |
0.52 |
|
|
$ |
0.52 |
|
|
$ |
0.82 |
|
|
2015: |
|
|
|
|
|
|
|
|
|
|
|
|
|
|
|
|
|
Rental revenues |
|
$ |
324,547 |
|
|
$ |
357,828 |
|
|
$ |
418,116 |
|
|
$ |
435,626 |
|
|
Rental recoveries |
|
$ |
94,255 |
|
|
$ |
103,616 |
|
|
$ |
114,639 |
|
|
$ |
124,560 |
|
|
Total revenues |
|
$ |
462,847 |
|
|
$ |
510,404 |
|
|
$ |
580,622 |
|
|
$ |
643,201 |
|
|
Rental expenses |
|
$ |
(127,095 |
) |
|
$ |
(125,820 |
) |
|
$ |
(140,284 |
) |
|
$ |
(150,983 |
) |
|
Operating income |
|
$ |
83,881 |
|
|
$ |
87,348 |
|
|
$ |
103,392 |
|
|
$ |
105,551 |
|
|
Consolidated net earnings |
|
$ |
351,312 |
|
|
$ |
140,260 |
|
|
$ |
307,186 |
|
|
$ |
126,757 |
|
|
Net earnings attributable to common unitholders |
|
$ |
346,488 |
|
|
$ |
141,538 |
|
|
$ |
262,155 |
|
|
$ |
123,733 |
|
|
Net earnings per unit attributable to common unitholders – Basic (1) |
|
$ |
0.67 |
|
|
$ |
0.27 |
|
|
$ |
0.49 |
|
|
$ |
0.23 |
|
|
Net earnings per unit attributable to common unitholders – Diluted (1) (2) |
|
$ |
0.65 |
|
|
$ |
0.27 |
|
|
$ |
0.49 |
|
|
$ |
0.23 |
|
|
(1) |
Quarterly earnings per common share or unit amounts may not total to the annual amounts due to rounding and the changes in the number of weighted common shares or units outstanding included in the calculation of basic and diluted shares or units. |
96
PROLOGIS, INC. AND PROLOGIS, L.P.
NOTES TO THE CONSOLIDATED FINANCIAL STATEMENTS (CONTINUED)
97
REPORT OF INDEPENDENT REGISTERED PUBLIC ACCOUNTING FIRM
The Board of Directors and Stockholders
Prologis, Inc.:
Under date of February 14, 2017, we reported on the consolidated balance sheets of Prologis, Inc. and subsidiaries as of December 31, 2016 and 2015 and the related consolidated statements of income, comprehensive income, equity, and cash flows for each of the years in the three-year period ended December 31, 2016. In connection with our audits of the aforementioned consolidated financial statements, we also audited the related financial statement schedule, Schedule III — Real Estate and Accumulated Depreciation (Schedule III). Schedule III is the responsibility of Prologis, Inc.’s management. Our responsibility is to express an opinion on Schedule III based on our audits.
In our opinion, Schedule III — Real Estate and Accumulated Depreciation, when considered in relation to the basic consolidated financial statements taken as a whole, presents fairly, in all material respects, the information set forth therein.
/s/ KPMG LLP
Denver, Colorado
February 14, 2017
98
REPORT OF INDEPENDENT REGISTERED PUBLIC ACCOUNTING FIRM
The Partners
Prologis, L.P.:
Under date of February 14, 2017, we reported on the consolidated balance sheets of Prologis, L.P. and subsidiaries as of December 31, 2016 and 2015 and the related consolidated statements of income, comprehensive income, capital, and cash flows for each of the years in the three-year period ended December 31, 2016. In connection with our audits of the aforementioned consolidated financial statements, we also audited the related financial statement schedule, Schedule III — Real Estate and Accumulated Depreciation (Schedule III). Schedule III is the responsibility of Prologis, L.P.’s management. Our responsibility is to express an opinion on Schedule III based on our audits.
In our opinion, Schedule III — Real Estate and Accumulated Depreciation, when considered in relation to the basic consolidated financial statements taken as a whole, presents fairly, in all material respects, the information set forth therein.
/s/ KPMG LLP
Denver, Colorado
February 14, 2017
99
PROLOGIS, INC. AND PROLOGIS, L.P.
SCHEDULE III – REAL ESTATE AND ACCUMULATED DEPRECIATION
DECEMBER 31, 2016
(In thousands of U.S. dollars, as applicable)
|
|
|
|
|
|
|
Initial Cost to Prologis |
|
|
Costs Capitalized |
|
|
Gross Amounts at Which Carried at December 31, 2016 |
|
|
|
|
|
|
|
|||||||||||||||
|
Description |
|
No. of Bldgs. |
|
Encum- brances |
|
Land |
|
|
Building & Improvements |
|
|
Subsequent to Acquisition |
|
|
Land |
|
|
Building & Improvements |
|
|
Total (a,b) |
|
|
Accumulated Depreciation (c) |
|
|
Date of Construction/ Acquisition |
|||||||
|
Industrial Operating Properties (d) |
|
|
|
|
|
|
|
|
|
|
|
|
|
|
|
|
|
|
|
|
|
|
|
|
|
|
|
|
|
|
|
|
|
|
|
|
|
|
|
|
|
|
|
|
|
|
|
|
|
|
|
|
|
|
|
|
|
|
|
|
|
|
|
|
|
|
|
|
|
|
|
North American Markets |
|
|
|
|
|
|
|
|
|
|
|
|
|
|
|
|
|
|
|
|
|
|
|
|
|
|
|
|
|
|
|
|
|
|
|
United States: |
|
|
|
|
|
|
|
|
|
|
|
|
|
|
|
|
|
|
|
|
|
|
|
|
|
|
|
|
|
|
|
|
|
|
|
Atlanta, Georgia |
|
|
|
|
|
|
|
|
|
|
|
|
|
|
|
|
|
|
|
|
|
|
|
|
|
|
|
|
|
|
|
|
|
|
|
Atlanta Airport Distribution Center |
|
4 |
|
(d) |
|
|
4,759 |
|
|
|
13,591 |
|
|
|
998 |
|
|
|
4,759 |
|
|
|
14,589 |
|
|
|
19,348 |
|
|
|
(1,487 |
) |
|
2014, 2015 |
|
Atlanta NE at Sugarloaf |
|
1 |
|
(d) |
|
|
620 |
|
|
|
2,499 |
|
|
|
73 |
|
|
|
620 |
|
|
|
2,572 |
|
|
|
3,192 |
|
|
|
(214 |
) |
|
2014 |
|
Atlanta NE Distribution Center |
|
8 |
|
(d) |
|
|
5,582 |
|
|
|
3,047 |
|
|
|
32,175 |
|
|
|
6,276 |
|
|
|
34,528 |
|
|
|
40,804 |
|
|
|
(20,201 |
) |
|
1996, 1997 |
|
Atlanta South Business Park |
|
9 |
|
|
|
|
5,353 |
|
|
|
28,895 |
|
|
|
4,341 |
|
|
|
5,353 |
|
|
|
33,236 |
|
|
|
38,589 |
|
|
|
(6,832 |
) |
|
2011 |
|
Atlanta West Distribution Center |
|
6 |
|
(d) |
|
|
13,420 |
|
|
|
43,556 |
|
|
|
8,732 |
|
|
|
13,420 |
|
|
|
52,288 |
|
|
|
65,708 |
|
|
|
(9,893 |
) |
|
1994, 2006, 2012, 2015 |
|
Berkeley Lake Distribution Center |
|
1 |
|
(d) |
|
|
2,046 |
|
|
|
8,712 |
|
|
|
1,204 |
|
|
|
2,046 |
|
|
|
9,916 |
|
|
|
11,962 |
|
|
|
(2,659 |
) |
|
2006 |
|
Breckenridge Distribution Center |
|
1 |
|
(d) |
|
|
1,645 |
|
|
|
6,627 |
|
|
|
277 |
|
|
|
1,645 |
|
|
|
6,904 |
|
|
|
8,549 |
|
|
|
(555 |
) |
|
2014 |
|
Buford Distribution Center |
|
2 |
|
|
|
|
2,659 |
|
|
|
8,847 |
|
|
|
6,101 |
|
|
|
2,659 |
|
|
|
14,948 |
|
|
|
17,607 |
|
|
|
(2,190 |
) |
|
2007, 2015 |
|
Carter-Pacific Business Center |
|
3 |
|
(d) |
|
|
1,484 |
|
|
|
5,965 |
|
|
|
440 |
|
|
|
1,484 |
|
|
|
6,405 |
|
|
|
7,889 |
|
|
|
(712 |
) |
|
2014 |
|
Cobb Place Distribution Center |
|
2 |
|
|
|
|
2,970 |
|
|
|
12,702 |
|
|
|
1,721 |
|
|
|
2,970 |
|
|
|
14,423 |
|
|
|
17,393 |
|
|
|
(2,439 |
) |
|
2012 |
|
Douglas Hill Distribution Center |
|
4 |
|
|
|
|
11,599 |
|
|
|
46,826 |
|
|
|
4,820 |
|
|
|
11,677 |
|
|
|
51,568 |
|
|
|
63,245 |
|
|
|
(19,347 |
) |
|
2005 |
|
Hartsfield East Distribution Center |
|
1 |
|
|
|
|
697 |
|
|
|
6,466 |
|
|
|
654 |
|
|
|
697 |
|
|
|
7,120 |
|
|
|
7,817 |
|
|
|
(1,131 |
) |
|
2011 |
|
Horizon Distribution Center |
|
2 |
|
(d) |
|
|
7,364 |
|
|
|
36,015 |
|
|
|
1,659 |
|
|
|
7,364 |
|
|
|
37,674 |
|
|
|
45,038 |
|
|
|
(4,744 |
) |
|
2006, 2015 |
|
Midland Distribution Center |
|
1 |
|
|
|
|
1,919 |
|
|
|
7,679 |
|
|
|
1,547 |
|
|
|
1,919 |
|
|
|
9,226 |
|
|
|
11,145 |
|
|
|
(3,304 |
) |
|
2006 |
|
Northeast Industrial Center |
|
2 |
|
|
|
|
2,821 |
|
|
|
12,176 |
|
|
|
1,707 |
|
|
|
2,821 |
|
|
|
13,883 |
|
|
|
16,704 |
|
|
|
(2,899 |
) |
|
2012 |
|
Northmont Industrial Center |
|
1 |
|
|
|
|
566 |
|
|
|
3,209 |
|
|
|
1,741 |
|
|
|
566 |
|
|
|
4,950 |
|
|
|
5,516 |
|
|
|
(3,614 |
) |
|
1994 |
|
Olympic Industrial Center |
|
2 |
|
|
|
|
2,156 |
|
|
|
8,941 |
|
|
|
545 |
|
|
|
2,156 |
|
|
|
9,486 |
|
|
|
11,642 |
|
|
|
(1,088 |
) |
|
2014 |
|
Park I-75 South |
|
2 |
|
(d) |
|
|
11,393 |
|
|
|
18,808 |
|
|
|
35,508 |
|
|
|
11,406 |
|
|
|
54,303 |
|
|
|
65,709 |
|
|
|
(5,061 |
) |
|
2013, 2015 |
|
Park I-85 |
|
4 |
|
|
|
|
6,391 |
|
|
|
11,585 |
|
|
|
26,264 |
|
|
|
6,465 |
|
|
|
37,775 |
|
|
|
44,240 |
|
|
|
(1,485 |
) |
|
2015 |
|
Peachtree Corners Business Center |
|
5 |
|
(d) |
|
|
5,750 |
|
|
|
20,670 |
|
|
|
3,960 |
|
|
|
5,750 |
|
|
|
24,630 |
|
|
|
30,380 |
|
|
|
(6,394 |
) |
|
1994, 2015 |
|
Piedmont Ct. Distribution Center |
|
2 |
|
|
|
|
885 |
|
|
|
5,013 |
|
|
|
4,269 |
|
|
|
885 |
|
|
|
9,282 |
|
|
|
10,167 |
|
|
|
(6,465 |
) |
|
1997 |
|
Riverside Distribution Center (ATL) |
|
4 |
|
(d) |
|
|
3,306 |
|
|
|
16,600 |
|
|
|
4,462 |
|
|
|
3,329 |
|
|
|
21,039 |
|
|
|
24,368 |
|
|
|
(11,251 |
) |
|
1999, 2014 |
|
Royal 85 Industrial Center |
|
3 |
|
|
|
|
3,306 |
|
|
|
16,859 |
|
|
|
776 |
|
|
|
3,306 |
|
|
|
17,635 |
|
|
|
20,941 |
|
|
|
(1,081 |
) |
|
2015 |
|
Savannah Logistics Center |
|
2 |
|
(d) |
|
|
5,114 |
|
|
|
46,844 |
|
|
|
343 |
|
|
|
5,114 |
|
|
|
47,187 |
|
|
|
52,301 |
|
|
|
(2,665 |
) |
|
2015 |
|
Southfield-KRDC Industrial SG |
|
1 |
|
|
|
|
1,551 |
|
|
|
8,621 |
|
|
|
524 |
|
|
|
1,551 |
|
|
|
9,145 |
|
|
|
10,696 |
|
|
|
(2,705 |
) |
|
2011 |
|
Southside Distribution Center |
|
1 |
|
|
|
|
1,186 |
|
|
|
2,859 |
|
|
|
590 |
|
|
|
1,186 |
|
|
|
3,449 |
|
|
|
4,635 |
|
|
|
(952 |
) |
|
2011 |
|
Suwanee Creek Distribution Center |
|
2 |
|
|
|
|
1,045 |
|
|
|
4,201 |
|
|
|
492 |
|
|
|
1,045 |
|
|
|
4,693 |
|
|
|
5,738 |
|
|
|
(791 |
) |
|
2010, 2013 |
|
Tradeport Distribution Center |
|
3 |
|
(d) |
|
|
1,464 |
|
|
|
4,563 |
|
|
|
9,663 |
|
|
|
1,479 |
|
|
|
14,211 |
|
|
|
15,690 |
|
|
|
(8,957 |
) |
|
1994, 1996 |
|
Weaver Distribution Center |
|
2 |
|
|
|
|
935 |
|
|
|
5,182 |
|
|
|
2,439 |
|
|
|
935 |
|
|
|
7,621 |
|
|
|
8,556 |
|
|
|
(5,742 |
) |
|
1995 |
|
Westfork Industrial Center |
|
3 |
|
(d) |
|
|
6,216 |
|
|
|
19,382 |
|
|
|
823 |
|
|
|
6,216 |
|
|
|
20,205 |
|
|
|
26,421 |
|
|
|
(1,306 |
) |
|
2015 |
|
Atlanta, Georgia |
|
84 |
|
|
|
|
116,202 |
|
|
|
436,940 |
|
|
|
158,848 |
|
|
|
117,099 |
|
|
|
594,891 |
|
|
|
711,990 |
|
|
|
(138,164 |
) |
|
|
|
|
|
|
|
|
|
|
|
|
|
|
|
|
|
|
|
|
|
|
|
|
|
|
|
|
|
|
|
|
|
|
|
|
|
|
|
Austin, Texas |
|
|
|
|
|
|
|
|
|
|
|
|
|
|
|
|
|
|
|
|
|
|
|
|
|
|
|
|
|
|
|
|
|
|
|
Corridor Park Corporate Center |
|
4 |
|
(d) |
|
|
4,579 |
|
|
|
18,358 |
|
|
|
622 |
|
|
|
4,579 |
|
|
|
18,980 |
|
|
|
23,559 |
|
|
|
(1,535 |
) |
|
2014 |
|
MET 4-12 LTD |
|
1 |
|
|
|
|
4,300 |
|
|
|
20,456 |
|
|
|
294 |
|
|
|
4,300 |
|
|
|
20,750 |
|
|
|
25,050 |
|
|
|
(4,125 |
) |
|
2011 |
|
MET PHASE 1 95 LTD |
|
4 |
|
|
|
|
5,593 |
|
|
|
17,211 |
|
|
|
1,519 |
|
|
|
5,593 |
|
|
|
18,730 |
|
|
|
24,323 |
|
|
|
(3,961 |
) |
|
2011 |
|
Montopolis Distribution Center |
|
1 |
|
|
|
|
580 |
|
|
|
3,384 |
|
|
|
2,628 |
|
|
|
580 |
|
|
|
6,012 |
|
|
|
6,592 |
|
|
|
(4,882 |
) |
|
1994 |
|
Riverside Distribution Center (AUS) |
|
1 |
|
|
|
|
1,849 |
|
|
|
7,195 |
|
|
|
93 |
|
|
|
1,849 |
|
|
|
7,288 |
|
|
|
9,137 |
|
|
|
(435 |
) |
|
2015 |
|
Southpark Corporate Center |
|
3 |
|
|
|
|
1,470 |
|
|
|
5,834 |
|
|
|
227 |
|
|
|
1,470 |
|
|
|
6,061 |
|
|
|
7,531 |
|
|
|
(484 |
) |
|
2014 |
|
Walnut Creek Corporate Center |
|
17 |
|
(d) |
|
|
11,152 |
|
|
|
46,510 |
|
|
|
1,643 |
|
|
|
11,206 |
|
|
|
48,099 |
|
|
|
59,305 |
|
|
|
(7,089 |
) |
|
1994, 2014 |
|
Austin, Texas |
|
31 |
|
|
|
|
29,523 |
|
|
|
118,948 |
|
|
|
7,026 |
|
|
|
29,577 |
|
|
|
125,920 |
|
|
|
155,497 |
|
|
|
(22,511 |
) |
|
|
|
|
|
|
|
|
|
|
|
|
|
|
|
|
|
|
|
|
|
|
|
|
|
|
|
|
|
|
|
|
|
|
|
|
|
|
|
Baltimore/Washington DC |
|
|
|
|
|
|
|
|
|
|
|
|
|
|
|
|
|
|
|
|
|
|
|
|
|
|
|
|
|
|
|
|
|
|
|
1901 Park 100 Drive |
|
1 |
|
(d) |
|
|
2,409 |
|
|
|
7,227 |
|
|
|
1,178 |
|
|
|
2,409 |
|
|
|
8,405 |
|
|
|
10,814 |
|
|
|
(3,306 |
) |
|
2006 |
|
Airport Commons Distribution Center |
|
2 |
|
(d) |
|
|
2,320 |
|
|
|
- |
|
|
|
10,671 |
|
|
|
2,360 |
|
|
|
10,631 |
|
|
|
12,991 |
|
|
|
(5,474 |
) |
|
1997 |
|
Beltway Distribution |
|
1 |
|
|
|
|
9,211 |
|
|
|
33,922 |
|
|
|
909 |
|
|
|
9,211 |
|
|
|
34,831 |
|
|
|
44,042 |
|
|
|
(7,016 |
) |
|
2011 |
|
BWI Cargo Center E |
|
1 |
|
|
|
|
- |
|
|
|
10,725 |
|
|
|
115 |
|
|
|
- |
|
|
|
10,840 |
|
|
|
10,840 |
|
|
|
(7,174 |
) |
|
2011 |
|
Corcorde Industrial Center |
|
4 |
|
(d) |
|
|
1,538 |
|
|
|
8,717 |
|
|
|
5,104 |
|
|
|
1,538 |
|
|
|
13,821 |
|
|
|
15,359 |
|
|
|
(9,946 |
) |
|
1995 |
|
Corridor Industrial Center |
|
1 |
|
|
|
|
1,921 |
|
|
|
7,224 |
|
|
|
365 |
|
|
|
1,921 |
|
|
|
7,589 |
|
|
|
9,510 |
|
|
|
(1,515 |
) |
|
2011 |
|
Crysen Industrial Center |
|
1 |
|
|
|
|
2,285 |
|
|
|
6,267 |
|
|
|
656 |
|
|
|
2,285 |
|
|
|
6,923 |
|
|
|
9,208 |
|
|
|
(1,599 |
) |
|
2011 |
|
Gateway Business Center |
|
8 |
|
|
|
|
22,025 |
|
|
|
25,117 |
|
|
|
21,843 |
|
|
|
22,261 |
|
|
|
46,724 |
|
|
|
68,985 |
|
|
|
(4,062 |
) |
|
2012, 2014 |
|
Gateway Distribution Center |
|
3 |
|
|
|
|
2,523 |
|
|
|
5,715 |
|
|
|
5,217 |
|
|
|
3,163 |
|
|
|
10,292 |
|
|
|
13,455 |
|
|
|
(3,229 |
) |
|
1998, 2012 |
|
Granite Hill Distribution Center |
|
2 |
|
|
|
|
2,959 |
|
|
|
9,344 |
|
|
|
74 |
|
|
|
2,959 |
|
|
|
9,418 |
|
|
|
12,377 |
|
|
|
(2,413 |
) |
|
2011 |
|
Greenwood Industrial Center |
|
3 |
|
|
|
|
6,828 |
|
|
|
24,253 |
|
|
|
2,912 |
|
|
|
6,828 |
|
|
|
27,165 |
|
|
|
33,993 |
|
|
|
(5,534 |
) |
|
2011 |
|
Hampton Central Distribution Center |
|
3 |
|
(d) |
|
|
8,928 |
|
|
|
26,787 |
|
|
|
1,090 |
|
|
|
8,928 |
|
|
|
27,877 |
|
|
|
36,805 |
|
|
|
(2,214 |
) |
|
2014 |
|
IAD Cargo Center 5 |
|
1 |
|
|
|
|
- |
|
|
|
43,060 |
|
|
|
96 |
|
|
|
- |
|
|
|
43,156 |
|
|
|
43,156 |
|
|
|
(39,338 |
) |
|
2011 |
|
Meadowridge Distribution Center |
|
3 |
|
(d) |
|
|
7,827 |
|
|
|
18,076 |
|
|
|
8,397 |
|
|
|
7,972 |
|
|
|
26,328 |
|
|
|
34,300 |
|
|
|
(4,959 |
) |
|
1998, 2014 |
|
Meadowridge Industrial Center |
|
3 |
|
|
|
|
4,845 |
|
|
|
20,576 |
|
|
|
4,564 |
|
|
|
4,845 |
|
|
|
25,140 |
|
|
|
29,985 |
|
|
|
(4,891 |
) |
|
2011 |
|
Patuxent Range Road |
|
2 |
|
|
|
|
2,281 |
|
|
|
9,638 |
|
|
|
1,630 |
|
|
|
2,281 |
|
|
|
11,268 |
|
|
|
13,549 |
|
|
|
(2,490 |
) |
|
2011 |
|
Preston Court |
|
1 |
|
|
|
|
2,326 |
|
|
|
10,146 |
|
|
|
331 |
|
|
|
2,326 |
|
|
|
10,477 |
|
|
|
12,803 |
|
|
|
(2,181 |
) |
|
2011 |
|
ProLogis Park - Dulles |
|
7 |
|
(d) |
|
|
16,703 |
|
|
|
35,291 |
|
|
|
854 |
|
|
|
16,703 |
|
|
|
36,145 |
|
|
|
52,848 |
|
|
|
(4,850 |
) |
|
2012, 2014 |
|
Troy Hill Distribution Center |
|
3 |
|
|
|
|
9,179 |
|
|
|
30,415 |
|
|
|
741 |
|
|
|
9,179 |
|
|
|
31,156 |
|
|
|
40,335 |
|
|
|
(3,570 |
) |
|
2012, 2014 |
|
White Marsh Distribution Center |
|
1 |
|
|
|
|
4,714 |
|
|
|
6,955 |
|
|
|
625 |
|
|
|
4,714 |
|
|
|
7,580 |
|
|
|
12,294 |
|
|
|
(256 |
) |
|
2015 |
|
Baltimore/Washington DC |
|
51 |
|
|
|
|
110,822 |
|
|
|
339,455 |
|
|
|
67,372 |
|
|
|
111,883 |
|
|
|
405,766 |
|
|
|
517,649 |
|
|
|
(116,017 |
) |
|
|
|
|
|
|
|
|
|
|
|
|
|
|
|
|
|
|
|
|
|
|
|
|
|
|
|
|
|
|
|
|
|
|
|
|
|
|
100
PROLOGIS, INC. AND PROLOGIS, L.P.
SCHEDULE III – REAL ESTATE AND ACCUMULATED DEPRECIATION
DECEMBER 31, 2016
(In thousands of U.S. dollars, as applicable)
|
|
|
|
|
|
|
|
|
Initial Cost to Prologis |
|
|
Costs Capitalized |
|
|
Gross Amounts at Which Carried at December 31, 2016 |
|
|
|
|
|
|
|
|||||||||||||||
|
Description |
|
No. of Bldgs. |
|
|
Encum- brances |
|
Land |
|
|
Building & Improvements |
|
|
Subsequent to Acquisition |
|
|
Land |
|
|
Building & Improvements |
|
|
Total (a,b) |
|
|
Accumulated Depreciation (c) |
|
|
Date of Construction/ Acquisition |
||||||||
|
Central & Eastern, Pennsylvania |
|
|
|
|
|
|
|
|
|
|
|
|
|
|
|
|
|
|
|
|
|
|
|
|
|
|
|
|
|
|
|
|
|
|
|
|
|
Carlisle Distribution Center |
|
9 |
|
|
|
|
|
92,681 |
|
|
|
328,514 |
|
|
|
45,559 |
|
|
|
92,707 |
|
|
|
374,047 |
|
|
|
466,754 |
|
|
|
(38,465 |
) |
|
2012, 2013, 2015 |
|
|
Chambersburg Distribution Center |
|
1 |
|
|
|
|
|
4,188 |
|
|
|
17,796 |
|
|
|
138 |
|
|
|
4,188 |
|
|
|
17,934 |
|
|
|
22,122 |
|
|
|
(2,277 |
) |
|
2013 |
|
|
Harrisburg Distribution Center |
|
|
6 |
|
|
|
|
|
30,801 |
|
|
|
122,169 |
|
|
|
5,554 |
|
|
|
30,801 |
|
|
|
127,723 |
|
|
|
158,524 |
|
|
|
(18,167 |
) |
|
2004, 2013, 2015 |
|
Harrisburg Industrial Center |
|
1 |
|
|
|
|
|
782 |
|
|
|
6,190 |
|
|
|
1,837 |
|
|
|
782 |
|
|
|
8,027 |
|
|
|
8,809 |
|
|
|
(3,776 |
) |
|
2002 |
|
|
I-78 Distribution Center |
|
1 |
|
|
|
|
|
13,030 |
|
|
|
30,007 |
|
|
|
444 |
|
|
|
13,030 |
|
|
|
30,451 |
|
|
|
43,481 |
|
|
|
(5,670 |
) |
|
2011 |
|
|
I-81 Distribution Center |
|
1 |
|
|
|
|
|
1,822 |
|
|
|
21,583 |
|
|
|
377 |
|
|
|
1,822 |
|
|
|
21,960 |
|
|
|
23,782 |
|
|
|
(3,998 |
) |
|
2011 |
|
|
Kraft Distribution Center |
|
1 |
|
|
(d) |
|
|
7,450 |
|
|
|
22,457 |
|
|
|
20 |
|
|
|
7,450 |
|
|
|
22,477 |
|
|
|
29,927 |
|
|
|
(1,879 |
) |
|
2014 |
|
|
Lehigh Valley Distribution Center |
|
9 |
|
|
(d) |
|
|
32,520 |
|
|
|
88,519 |
|
|
|
50,908 |
|
|
|
32,782 |
|
|
|
139,165 |
|
|
|
171,947 |
|
|
|
(17,211 |
) |
|
2004, 2010, 2013, 2014, 2015 |
|
|
Northport Industrial Center |
|
1 |
|
|
(d) |
|
|
12,282 |
|
|
|
37,910 |
|
|
|
- |
|
|
|
12,282 |
|
|
|
37,910 |
|
|
|
50,192 |
|
|
|
(3,199 |
) |
|
2014 |
|
|
Park 33 Distribution Center |
|
2 |
|
|
|
|
|
28,947 |
|
|
|
47,081 |
|
|
|
41,468 |
|
|
|
31,231 |
|
|
|
86,265 |
|
|
|
117,496 |
|
|
|
(12,094 |
) |
|
2007,2014 |
|
|
PHL Cargo Center C2 |
|
1 |
|
|
|
|
|
- |
|
|
|
11,966 |
|
|
|
87 |
|
|
|
- |
|
|
|
12,053 |
|
|
|
12,053 |
|
|
|
(6,738 |
) |
|
2011 |
|
|
Quakertown Distribution Center |
|
1 |
|
|
|
|
|
6,966 |
|
|
|
- |
|
|
|
28,369 |
|
|
|
6,966 |
|
|
|
28,369 |
|
|
|
35,335 |
|
|
|
(7,035 |
) |
|
2006 |
|
|
Central & Eastern, Pennsylvania |
|
34 |
|
|
|
|
|
231,469 |
|
|
|
734,192 |
|
|
|
174,761 |
|
|
|
234,041 |
|
|
|
906,381 |
|
|
|
1,140,422 |
|
|
|
(120,509 |
) |
|
|
|
|
|
|
|
|
|
|
|
|
|
|
|
|
|
|
|
|
|
|
|
|
|
|
|
|
|
|
|
|
|
|
|
|
|
|
|
|
|
|
Central Valley, California |
|
|
|
|
|
|
|
|
|
|
|
|
|
|
|
|
|
|
|
|
|
|
|
|
|
|
|
|
|
|
|
|
|
|
|
|
|
Arch Road Logistics Center |
|
2 |
|
|
(d) |
|
|
9,492 |
|
|
|
38,060 |
|
|
|
2,314 |
|
|
|
9,492 |
|
|
|
40,374 |
|
|
|
49,866 |
|
|
|
(8,729 |
) |
|
2010 |
|
|
Central Valley Distribution Center |
|
2 |
|
|
(d) |
|
|
4,329 |
|
|
|
25,033 |
|
|
|
885 |
|
|
|
4,329 |
|
|
|
25,918 |
|
|
|
30,247 |
|
|
|
(2,205 |
) |
|
2014 |
|
|
Central Valley Industrial Center |
|
4 |
|
|
(d) |
|
|
13,064 |
|
|
|
58,080 |
|
|
|
9,062 |
|
|
|
13,473 |
|
|
|
66,733 |
|
|
|
80,206 |
|
|
|
(26,734 |
) |
|
1999, 2002, 2005, 2014 |
|
|
Chabot Commerce Center |
|
2 |
|
|
|
|
|
5,222 |
|
|
|
13,697 |
|
|
|
7,731 |
|
|
|
5,222 |
|
|
|
21,428 |
|
|
|
26,650 |
|
|
|
(6,173 |
) |
|
2011 |
|
|
Duck Creek Distribution Center |
|
1 |
|
|
(d) |
|
|
6,690 |
|
|
|
37,858 |
|
|
|
- |
|
|
|
6,690 |
|
|
|
37,858 |
|
|
|
44,548 |
|
|
|
(3,048 |
) |
|
2014 |
|
|
Manteca Distribution Center |
|
1 |
|
|
|
|
|
9,280 |
|
|
|
27,840 |
|
|
|
669 |
|
|
|
9,480 |
|
|
|
28,309 |
|
|
|
37,789 |
|
|
|
(10,673 |
) |
|
2005 |
|
|
Patterson Pass Business Center |
|
4 |
|
|
|
|
|
14,225 |
|
|
|
19,547 |
|
|
|
96,523 |
|
|
|
17,267 |
|
|
|
113,028 |
|
|
|
130,295 |
|
|
|
(7,398 |
) |
|
2007, 2012, 2015, 2016 |
|
|
Tracy II Distribution Center |
|
5 |
|
|
|
|
|
23,905 |
|
|
|
32,080 |
|
|
|
152,941 |
|
|
|
29,246 |
|
|
|
179,680 |
|
|
|
208,926 |
|
|
|
(31,106 |
) |
|
2007, 2009, 2012, 2013 |
|
|
Central Valley, California |
|
21 |
|
|
|
|
|
86,207 |
|
|
|
252,195 |
|
|
|
270,125 |
|
|
|
95,199 |
|
|
|
513,328 |
|
|
|
608,527 |
|
|
|
(96,066 |
) |
|
|
|
|
|
|
|
|
|
|
|
|
|
|
|
|
|
|
|
|
|
|
|
|
|
|
|
|
|
|
|
|
|
|
|
|
|
|
|
|
|
|
Charlotte, North Carolina |
|
|
|
|
|
|
|
|
|
|
|
|
|
|
|
|
|
|
|
|
|
|
|
|
|
|
|
|
|
|
|
|
|
|
|
|
|
Charlotte Distribution Center |
|
11 |
|
|
(d) |
|
|
6,596 |
|
|
|
8,206 |
|
|
|
30,225 |
|
|
|
8,114 |
|
|
|
36,913 |
|
|
|
45,027 |
|
|
|
(18,116 |
) |
|
1995, 1996, 1997, 1998, 2014 |
|
|
Northpark Distribution Center |
|
2 |
|
|
(d) |
|
|
1,183 |
|
|
|
6,707 |
|
|
|
3,287 |
|
|
|
1,184 |
|
|
|
9,993 |
|
|
|
11,177 |
|
|
|
(6,977 |
) |
|
1994, 1998 |
|
|
West Pointe Business Center |
|
6 |
|
|
(d) |
|
|
12,832 |
|
|
|
39,809 |
|
|
|
20,969 |
|
|
|
13,134 |
|
|
|
60,476 |
|
|
|
73,610 |
|
|
|
(8,672 |
) |
|
2006, 2012, 2014, 2015 |
|
|
Charlotte, North Carolina |
|
19 |
|
|
|
|
|
20,611 |
|
|
|
54,722 |
|
|
|
54,481 |
|
|
|
22,432 |
|
|
|
107,382 |
|
|
|
129,814 |
|
|
|
(33,765 |
) |
|
|
|
|
|
|
|
|
|
|
|
|
|
|
|
|
|
|
|
|
|
|
|
|
|
|
|
|
|
|
|
|
|
|
|
|
|
|
|
|
|
|
Chicago, Illinois |
|
|
|
|
|
|
|
|
|
|
|
|
|
|
|
|
|
|
|
|
|
|
|
|
|
|
|
|
|
|
|
|
|
|
|
|
|
Addison Business Center |
|
1 |
|
|
|
|
|
1,293 |
|
|
|
2,907 |
|
|
|
536 |
|
|
|
1,293 |
|
|
|
3,443 |
|
|
|
4,736 |
|
|
|
(835 |
) |
|
2011 |
|
|
Addison Distribution Center |
|
2 |
|
|
|
|
|
2,594 |
|
|
|
11,779 |
|
|
|
2,295 |
|
|
|
2,594 |
|
|
|
14,074 |
|
|
|
16,668 |
|
|
|
(4,012 |
) |
|
1997, 2015 |
|
|
Alsip Distribution Center |
|
1 |
|
|
|
|
|
4,895 |
|
|
|
9,710 |
|
|
|
250 |
|
|
|
4,895 |
|
|
|
9,960 |
|
|
|
14,855 |
|
|
|
(691 |
) |
|
2015 |
|
|
Arlington Heights Distribution Center |
|
2 |
|
|
|
|
|
5,263 |
|
|
|
10,361 |
|
|
|
3,568 |
|
|
|
5,264 |
|
|
|
13,928 |
|
|
|
19,192 |
|
|
|
(2,754 |
) |
|
2006, 2015 |
|
|
Aurora Distribution Center |
|
6 |
|
|
|
|
|
9,921 |
|
|
|
53,571 |
|
|
|
1,645 |
|
|
|
9,921 |
|
|
|
55,216 |
|
|
|
65,137 |
|
|
|
(4,509 |
) |
|
2015 |
|
|
Bedford Park Distribution Center |
|
2 |
|
|
(d) |
|
|
3,014 |
|
|
|
9,271 |
|
|
|
359 |
|
|
|
3,014 |
|
|
|
9,630 |
|
|
|
12,644 |
|
|
|
(697 |
) |
|
2015 |
|
|
Bensenville Distribution Center |
|
1 |
|
|
|
|
|
926 |
|
|
|
3,842 |
|
|
|
6,429 |
|
|
|
940 |
|
|
|
10,257 |
|
|
|
11,197 |
|
|
|
(7,769 |
) |
|
1997 |
|
|
Bensenville Industrial Park |
|
14 |
|
|
(d) |
|
|
43,455 |
|
|
|
111,007 |
|
|
|
9,495 |
|
|
|
43,455 |
|
|
|
120,502 |
|
|
|
163,957 |
|
|
|
(24,998 |
) |
|
2011, 2015 |
|
|
Bloomingdale 100 Business Center |
|
4 |
|
|
(d) |
|
|
6,563 |
|
|
|
26,145 |
|
|
|
1,784 |
|
|
|
6,563 |
|
|
|
27,929 |
|
|
|
34,492 |
|
|
|
(2,262 |
) |
|
2014 |
|
|
Bolingbrook Distribution Center |
|
13 |
|
|
(d) |
|
|
40,219 |
|
|
|
154,530 |
|
|
|
28,173 |
|
|
|
40,219 |
|
|
|
182,703 |
|
|
|
222,922 |
|
|
|
(29,862 |
) |
|
1999, 2006, 2014, 2015 |
|
|
Bridgeview Distribution Center |
|
4 |
|
|
|
|
|
1,662 |
|
|
|
6,882 |
|
|
|
170 |
|
|
|
1,662 |
|
|
|
7,052 |
|
|
|
8,714 |
|
|
|
(895 |
) |
|
2014 |
|
|
Chicago Industrial Portfolio |
|
1 |
|
|
|
|
|
1,330 |
|
|
|
2,876 |
|
|
|
428 |
|
|
|
1,330 |
|
|
|
3,304 |
|
|
|
4,634 |
|
|
|
(940 |
) |
|
2011 |
|
|
Cicero Distribution Center |
|
1 |
|
|
|
|
|
3,789 |
|
|
|
5,819 |
|
|
|
849 |
|
|
|
3,789 |
|
|
|
6,668 |
|
|
|
10,457 |
|
|
|
(762 |
) |
|
2015 |
|
|
Des Plaines Distribution Center |
|
4 |
|
|
|
|
|
8,022 |
|
|
|
17,145 |
|
|
|
4,129 |
|
|
|
8,023 |
|
|
|
21,273 |
|
|
|
29,296 |
|
|
|
(8,745 |
) |
|
1995, 1996, 2015 |
|
|
Elgin Distribution Center |
|
1 |
|
|
|
|
|
2,480 |
|
|
|
6,422 |
|
|
|
854 |
|
|
|
2,480 |
|
|
|
7,276 |
|
|
|
9,756 |
|
|
|
(404 |
) |
|
2015 |
|
|
Elk Grove Distribution Center |
|
14 |
|
|
(d) |
|
|
37,200 |
|
|
|
81,638 |
|
|
|
41,879 |
|
|
|
37,200 |
|
|
|
123,517 |
|
|
|
160,717 |
|
|
|
(48,437 |
) |
|
1995, 1996, 1997, 1999, 2006, 2009, 2015 |
|
|
Elk Grove Du Page |
|
21 |
|
|
|
|
|
14,830 |
|
|
|
64,408 |
|
|
|
13,911 |
|
|
|
14,830 |
|
|
|
78,319 |
|
|
|
93,149 |
|
|
|
(17,943 |
) |
|
2012 |
|
|
Elk Grove Village SG |
|
5 |
|
|
|
|
|
5,856 |
|
|
|
11,049 |
|
|
|
1,484 |
|
|
|
5,856 |
|
|
|
12,533 |
|
|
|
18,389 |
|
|
|
(3,484 |
) |
|
2011 |
|
|
Elmhurst Distribution Center |
|
1 |
|
|
|
|
|
1,862 |
|
|
|
3,263 |
|
|
|
472 |
|
|
|
1,862 |
|
|
|
3,735 |
|
|
|
5,597 |
|
|
|
(197 |
) |
|
2015 |
|
|
Franklin Park Distribution Center |
|
3 |
|
|
|
|
|
22,998 |
|
|
|
49,906 |
|
|
|
805 |
|
|
|
22,998 |
|
|
|
50,711 |
|
|
|
73,709 |
|
|
|
(2,516 |
) |
|
2015 |
|
|
Glendale Heights Distribution Center |
|
5 |
|
|
|
|
|
8,381 |
|
|
|
39,047 |
|
|
|
5,895 |
|
|
|
8,381 |
|
|
|
44,942 |
|
|
|
53,323 |
|
|
|
(17,374 |
) |
|
1999, 2015 |
|
|
Grand Rapids Distribution Center |
|
1 |
|
|
(d) |
|
|
839 |
|
|
|
1,516 |
|
|
|
16 |
|
|
|
839 |
|
|
|
1,532 |
|
|
|
2,371 |
|
|
|
(77 |
) |
|
2015 |
|
|
Gurnee Distribution Center |
|
2 |
|
|
|
|
|
2,353 |
|
|
|
5,579 |
|
|
|
298 |
|
|
|
2,353 |
|
|
|
5,877 |
|
|
|
8,230 |
|
|
|
(385 |
) |
|
2015 |
|
|
I-55 Distribution Center |
|
2 |
|
|
(d) |
|
|
5,383 |
|
|
|
25,504 |
|
|
|
36,018 |
|
|
|
11,786 |
|
|
|
55,119 |
|
|
|
66,905 |
|
|
|
(19,352 |
) |
|
2007 |
|
|
Itasca Distribution Center |
|
1 |
|
|
(d) |
|
|
1,222 |
|
|
|
5,178 |
|
|
|
1,077 |
|
|
|
1,222 |
|
|
|
6,255 |
|
|
|
7,477 |
|
|
|
(806 |
) |
|
2014 |
|
|
Itasca Industrial Portfolio |
|
1 |
|
|
|
|
|
1,044 |
|
|
|
1,920 |
|
|
|
229 |
|
|
|
1,044 |
|
|
|
2,149 |
|
|
|
3,193 |
|
|
|
(545 |
) |
|
2011 |
|
|
Kehoe Industrial Center |
|
2 |
|
|
|
|
|
2,975 |
|
|
|
7,876 |
|
|
|
545 |
|
|
|
2,975 |
|
|
|
8,421 |
|
|
|
11,396 |
|
|
|
(1,013 |
) |
|
2011, 2015 |
|
|
Kennicott Park Distribution Center |
|
1 |
|
|
|
|
|
811 |
|
|
|
2,996 |
|
|
|
24 |
|
|
|
811 |
|
|
|
3,020 |
|
|
|
3,831 |
|
|
|
(221 |
) |
|
2015 |
|
|
Kenosha Distribution Center |
|
2 |
|
|
|
|
|
14,484 |
|
|
|
117,728 |
|
|
|
521 |
|
|
|
14,484 |
|
|
|
118,249 |
|
|
|
132,733 |
|
|
|
(5,085 |
) |
|
2015 |
|
|
McCook Distribution Center |
|
1 |
|
|
|
|
|
1,968 |
|
|
|
6,784 |
|
|
|
281 |
|
|
|
1,968 |
|
|
|
7,065 |
|
|
|
9,033 |
|
|
|
(333 |
) |
|
2015 |
|
|
Melrose Park Distribution Center |
|
2 |
|
|
|
|
|
9,544 |
|
|
|
27,851 |
|
|
|
488 |
|
|
|
9,544 |
|
|
|
28,339 |
|
|
|
37,883 |
|
|
|
(1,390 |
) |
|
2015 |
|
|
Minooka Distribution Center |
|
3 |
|
|
|
|
|
18,420 |
|
|
|
67,250 |
|
|
|
18,437 |
|
|
|
19,404 |
|
|
|
84,703 |
|
|
|
104,107 |
|
|
|
(23,238 |
) |
|
2005, 2008, 2014 |
|
|
Mitchell Distribution Center |
|
1 |
|
|
|
|
|
1,236 |
|
|
|
7,004 |
|
|
|
4,355 |
|
|
|
1,236 |
|
|
|
11,359 |
|
|
|
12,595 |
|
|
|
(7,913 |
) |
|
1996 |
|
|
Mount Pleasant Distribution Center |
|
1 |
|
|
|
|
|
2,876 |
|
|
|
8,171 |
|
|
|
574 |
|
|
|
2,876 |
|
|
|
8,745 |
|
|
|
11,621 |
|
|
|
(399 |
) |
|
2015 |
|
|
NDP - Chicago |
|
1 |
|
|
|
|
|
461 |
|
|
|
1,362 |
|
|
|
78 |
|
|
|
461 |
|
|
|
1,440 |
|
|
|
1,901 |
|
|
|
(294 |
) |
|
2011 |
|
|
Northbrook Distribution Center |
|
1 |
|
|
|
|
|
2,056 |
|
|
|
8,227 |
|
|
|
4,015 |
|
|
|
2,056 |
|
|
|
12,242 |
|
|
|
14,298 |
|
|
|
(3,532 |
) |
|
2007 |
|
|
Northlake Distribution Center |
|
1 |
|
|
|
|
|
5,015 |
|
|
|
13,569 |
|
|
|
125 |
|
|
|
5,015 |
|
|
|
13,694 |
|
|
|
18,709 |
|
|
|
(760 |
) |
|
2015 |
|
101
PROLOGIS, INC. AND PROLOGIS, L.P.
SCHEDULE III – REAL ESTATE AND ACCUMULATED DEPRECIATION
DECEMBER 31, 2016
(In thousands of U.S. dollars, as applicable)
|
|
|
|
|
|
|
Initial Cost to Prologis |
|
|
Costs Capitalized |
|
|
Gross Amounts at Which Carried at December 31, 2016 |
|
|
|
|
|
|
|
|||||||||||||||
|
Description |
|
No. of Bldgs. |
|
Encum- brances |
|
Land |
|
|
Building & Improvements |
|
|
Subsequent to Acquisition |
|
|
Land |
|
|
Building & Improvements |
|
|
Total (a,b) |
|
|
Accumulated Depreciation (c) |
|
|
Date of Construction/ Acquisition |
|||||||
|
OHare Industrial Portfolio |
|
5 |
|
|
|
|
3,455 |
|
|
|
8,724 |
|
|
|
216 |
|
|
|
3,455 |
|
|
|
8,940 |
|
|
|
12,395 |
|
|
|
(2,387 |
) |
|
2011 |
|
Palatine Distribution Center |
|
1 |
|
|
|
|
497 |
|
|
|
2,723 |
|
|
|
299 |
|
|
|
497 |
|
|
|
3,022 |
|
|
|
3,519 |
|
|
|
(200 |
) |
|
2015 |
|
Pleasant Prairie Distribution Center |
|
2 |
|
|
|
|
3,293 |
|
|
|
16,321 |
|
|
|
3,597 |
|
|
|
3,293 |
|
|
|
19,918 |
|
|
|
23,211 |
|
|
|
(7,053 |
) |
|
1999, 2015 |
|
Remington Lakes Distribution Center |
|
1 |
|
|
|
|
2,382 |
|
|
|
11,657 |
|
|
|
901 |
|
|
|
2,382 |
|
|
|
12,558 |
|
|
|
14,940 |
|
|
|
(2,210 |
) |
|
2011 |
|
Romeoville Distribution Center |
|
7 |
|
(d) |
|
|
30,559 |
|
|
|
116,956 |
|
|
|
11,527 |
|
|
|
30,559 |
|
|
|
128,483 |
|
|
|
159,042 |
|
|
|
(38,273 |
) |
|
2005, 2015 |
|
S.C. Johnson & Son |
|
1 |
|
|
|
|
2,267 |
|
|
|
15,911 |
|
|
|
1,842 |
|
|
|
3,152 |
|
|
|
16,868 |
|
|
|
20,020 |
|
|
|
(4,287 |
) |
|
2008 |
|
Shiller Park Distribution Center |
|
17 |
|
|
|
|
17,339 |
|
|
|
33,001 |
|
|
|
3,350 |
|
|
|
17,339 |
|
|
|
36,351 |
|
|
|
53,690 |
|
|
|
(2,363 |
) |
|
2015 |
|
Touhy Cargo Terminal |
|
1 |
|
|
|
|
2,697 |
|
|
|
8,909 |
|
|
|
- |
|
|
|
2,697 |
|
|
|
8,909 |
|
|
|
11,606 |
|
|
|
(1,503 |
) |
|
2011 |
|
Tower Distribution Center |
|
1 |
|
|
|
|
2,050 |
|
|
|
1,279 |
|
|
|
5 |
|
|
|
2,050 |
|
|
|
1,284 |
|
|
|
3,334 |
|
|
|
(62 |
) |
|
2015 |
|
Waukegan Distribution Center |
|
1 |
|
|
|
|
2,451 |
|
|
|
9,438 |
|
|
|
506 |
|
|
|
2,451 |
|
|
|
9,944 |
|
|
|
12,395 |
|
|
|
(3,260 |
) |
|
2007 |
|
West Chicago Distribution Center |
|
2 |
|
|
|
|
3,125 |
|
|
|
12,764 |
|
|
|
4,971 |
|
|
|
3,125 |
|
|
|
17,735 |
|
|
|
20,860 |
|
|
|
(6,425 |
) |
|
2005, 2015 |
|
Willowbrook Distribution Center |
|
1 |
|
(d) |
|
|
855 |
|
|
|
3,134 |
|
|
|
23 |
|
|
|
855 |
|
|
|
3,157 |
|
|
|
4,012 |
|
|
|
(337 |
) |
|
2015 |
|
Windsor Court |
|
1 |
|
|
|
|
635 |
|
|
|
3,493 |
|
|
|
536 |
|
|
|
635 |
|
|
|
4,029 |
|
|
|
4,664 |
|
|
|
(880 |
) |
|
2011 |
|
Woodale Distribution Center |
|
1 |
|
|
|
|
263 |
|
|
|
1,490 |
|
|
|
599 |
|
|
|
263 |
|
|
|
2,089 |
|
|
|
2,352 |
|
|
|
(1,454 |
) |
|
1997 |
|
Woodridge Distribution Center |
|
15 |
|
(d) |
|
|
49,943 |
|
|
|
215,504 |
|
|
|
27,177 |
|
|
|
53,310 |
|
|
|
239,314 |
|
|
|
292,624 |
|
|
|
(83,241 |
) |
|
2005, 2007, 2015 |
|
Yohan Industrial Center |
|
3 |
|
|
|
|
4,219 |
|
|
|
12,306 |
|
|
|
1,685 |
|
|
|
4,219 |
|
|
|
13,991 |
|
|
|
18,210 |
|
|
|
(2,937 |
) |
|
2011 |
|
Chicago, Illinois |
|
189 |
|
|
|
|
423,270 |
|
|
|
1,463,703 |
|
|
|
249,725 |
|
|
|
434,925 |
|
|
|
1,701,773 |
|
|
|
2,136,698 |
|
|
|
(402,301 |
) |
|
|
|
|
|
|
|
|
|
|
|
|
|
|
|
|
|
|
|
|
|
|
|
|
|
|
|
|
|
|
|
|
|
|
|
|
|
|
|
Cincinnati, Ohio |
|
|
|
|
|
|
|
|
|
|
|
|
|
|
|
|
|
|
|
|
|
|
|
|
|
|
|
|
|
|
|
|
|
|
|
Airpark Distribution Center |
|
4 |
|
(d) |
|
|
5,851 |
|
|
|
21,846 |
|
|
|
15,049 |
|
|
|
6,831 |
|
|
|
35,915 |
|
|
|
42,746 |
|
|
|
(10,495 |
) |
|
1996, 2012, 2014 |
|
DAY Cargo Center |
|
5 |
|
|
|
|
- |
|
|
|
4,749 |
|
|
|
671 |
|
|
|
- |
|
|
|
5,420 |
|
|
|
5,420 |
|
|
|
(2,388 |
) |
|
2011 |
|
Fairfield Commerce Center |
|
1 |
|
(d) |
|
|
2,526 |
|
|
|
10,110 |
|
|
|
105 |
|
|
|
2,526 |
|
|
|
10,215 |
|
|
|
12,741 |
|
|
|
(870 |
) |
|
2014 |
|
Gateway International Distribution Center |
|
1 |
|
|
|
|
2,676 |
|
|
|
- |
|
|
|
18,534 |
|
|
|
2,695 |
|
|
|
18,515 |
|
|
|
21,210 |
|
|
|
(445 |
) |
|
2015 |
|
Monroe Park |
|
1 |
|
(d) |
|
|
7,222 |
|
|
|
29,606 |
|
|
|
506 |
|
|
|
7,222 |
|
|
|
30,112 |
|
|
|
37,334 |
|
|
|
(2,547 |
) |
|
2014 |
|
Mosteller Distribution Center |
|
1 |
|
(d) |
|
|
921 |
|
|
|
3,888 |
|
|
|
165 |
|
|
|
921 |
|
|
|
4,053 |
|
|
|
4,974 |
|
|
|
(379 |
) |
|
2014 |
|
Park I-275 |
|
4 |
|
(d) |
|
|
15,939 |
|
|
|
61,886 |
|
|
|
3,815 |
|
|
|
15,939 |
|
|
|
65,701 |
|
|
|
81,640 |
|
|
|
(9,244 |
) |
|
2008, 2012, 2014 |
|
Sharonville Distribution Center |
|
2 |
|
(d) |
|
|
1,202 |
|
|
|
- |
|
|
|
15,838 |
|
|
|
2,424 |
|
|
|
14,616 |
|
|
|
17,040 |
|
|
|
(7,486 |
) |
|
1997 |
|
West Chester Commerce Park I |
|
3 |
|
|
|
|
3,366 |
|
|
|
13,877 |
|
|
|
3,203 |
|
|
|
3,366 |
|
|
|
17,080 |
|
|
|
20,446 |
|
|
|
(2,581 |
) |
|
2012, 2014 |
|
Cincinnati, Ohio |
|
22 |
|
|
|
|
39,703 |
|
|
|
145,962 |
|
|
|
57,886 |
|
|
|
41,924 |
|
|
|
201,627 |
|
|
|
243,551 |
|
|
|
(36,435 |
) |
|
|
|
|
|
|
|
|
|
|
|
|
|
|
|
|
|
|
|
|
|
|
|
|
|
|
|
|
|
|
|
|
|
|
|
|
|
|
|
Columbus, Ohio |
|
|
|
|
|
|
|
|
|
|
|
|
|
|
|
|
|
|
|
|
|
|
|
|
|
|
|
|
|
|
|
|
|
|
|
Alum Creek Distribution Center |
|
3 |
|
(d) |
|
|
3,945 |
|
|
|
33,239 |
|
|
|
321 |
|
|
|
3,945 |
|
|
|
33,560 |
|
|
|
37,505 |
|
|
|
(1,871 |
) |
|
2015 |
|
Brookham Distribution Center |
|
2 |
|
|
|
|
5,964 |
|
|
|
23,858 |
|
|
|
5,130 |
|
|
|
5,965 |
|
|
|
28,987 |
|
|
|
34,952 |
|
|
|
(12,576 |
) |
|
2005 |
|
Capital Park South Distribution Center |
|
8 |
|
(d) |
|
|
10,077 |
|
|
|
39,631 |
|
|
|
32,697 |
|
|
|
10,470 |
|
|
|
71,935 |
|
|
|
82,405 |
|
|
|
(24,153 |
) |
|
1996, 2012, 2014 |
|
Columbus West Industrial Center |
|
1 |
|
|
|
|
427 |
|
|
|
2,407 |
|
|
|
202 |
|
|
|
427 |
|
|
|
2,609 |
|
|
|
3,036 |
|
|
|
(298 |
) |
|
2014 |
|
Corporate Park West |
|
1 |
|
(d) |
|
|
633 |
|
|
|
3,583 |
|
|
|
89 |
|
|
|
633 |
|
|
|
3,672 |
|
|
|
4,305 |
|
|
|
(327 |
) |
|
2014 |
|
Crosswinds Distribution Center |
|
1 |
|
|
|
|
3,058 |
|
|
|
17,758 |
|
|
|
500 |
|
|
|
3,058 |
|
|
|
18,258 |
|
|
|
21,316 |
|
|
|
(1,666 |
) |
|
2014 |
|
Etna Distribution Center |
|
2 |
|
(d) |
|
|
5,840 |
|
|
|
33,734 |
|
|
|
1,055 |
|
|
|
5,840 |
|
|
|
34,789 |
|
|
|
40,629 |
|
|
|
(2,954 |
) |
|
2014 |
|
International Street Commerce Center |
|
2 |
|
|
|
|
1,503 |
|
|
|
6,356 |
|
|
|
483 |
|
|
|
1,503 |
|
|
|
6,839 |
|
|
|
8,342 |
|
|
|
(1,312 |
) |
|
2012 |
|
South Park Distribution Center |
|
2 |
|
(d) |
|
|
3,343 |
|
|
|
15,182 |
|
|
|
3,627 |
|
|
|
3,343 |
|
|
|
18,809 |
|
|
|
22,152 |
|
|
|
(9,453 |
) |
|
1999, 2005 |
|
Westpointe Distribution Center |
|
2 |
|
|
|
|
1,446 |
|
|
|
7,601 |
|
|
|
1,764 |
|
|
|
1,446 |
|
|
|
9,365 |
|
|
|
10,811 |
|
|
|
(4,312 |
) |
|
2007 |
|
Columbus, Ohio |
|
24 |
|
|
|
|
36,236 |
|
|
|
183,349 |
|
|
|
45,868 |
|
|
|
36,630 |
|
|
|
228,823 |
|
|
|
265,453 |
|
|
|
(58,922 |
) |
|
|
|
|
|
|
|
|
|
|
|
|
|
|
|
|
|
|
|
|
|
|
|
|
|
|
|
|
|
|
|
|
|
|
|
|
|
|
|
Dallas/Fort Worth, Texas |
|
|
|
|
|
|
|
|
|
|
|
|
|
|
|
|
|
|
|
|
|
|
|
|
|
|
|
|
|
|
|
|
|
|
|
Arlington Corporate Center |
|
4 |
|
(d) |
|
|
9,380 |
|
|
|
41,744 |
|
|
|
450 |
|
|
|
9,380 |
|
|
|
42,194 |
|
|
|
51,574 |
|
|
|
(5,320 |
) |
|
2012, 2014, 2015 |
|
Dallas Corporate Center |
|
11 |
|
(d) |
|
|
6,449 |
|
|
|
5,441 |
|
|
|
35,845 |
|
|
|
6,645 |
|
|
|
41,090 |
|
|
|
47,735 |
|
|
|
(21,109 |
) |
|
1996, 1997, 1998, 1999, 2012 |
|
Dallas Corporate Center North Distribution Center |
|
2 |
|
|
|
|
6,014 |
|
|
|
- |
|
|
|
20,152 |
|
|
|
5,990 |
|
|
|
20,176 |
|
|
|
26,166 |
|
|
|
(301 |
) |
|
2015 |
|
DFW Cargo Center 1 |
|
1 |
|
|
|
|
- |
|
|
|
35,117 |
|
|
|
1,284 |
|
|
|
- |
|
|
|
36,401 |
|
|
|
36,401 |
|
|
|
(8,082 |
) |
|
2011 |
|
DFW Cargo Center 2 |
|
1 |
|
|
|
|
- |
|
|
|
27,916 |
|
|
|
221 |
|
|
|
- |
|
|
|
28,137 |
|
|
|
28,137 |
|
|
|
(5,964 |
) |
|
2011 |
|
DFW Cargo Center East |
|
3 |
|
|
|
|
- |
|
|
|
19,730 |
|
|
|
367 |
|
|
|
- |
|
|
|
20,097 |
|
|
|
20,097 |
|
|
|
(7,001 |
) |
|
2011 |
|
DFW Logistics Center 6 |
|
1 |
|
|
|
|
2,010 |
|
|
|
8,153 |
|
|
|
580 |
|
|
|
2,010 |
|
|
|
8,733 |
|
|
|
10,743 |
|
|
|
(418 |
) |
|
2015 |
|
Flower Mound Distribution Center |
|
1 |
|
(d) |
|
|
5,157 |
|
|
|
20,991 |
|
|
|
2,588 |
|
|
|
5,157 |
|
|
|
23,579 |
|
|
|
28,736 |
|
|
|
(8,198 |
) |
|
2007 |
|
Frankford Trade Center |
|
4 |
|
|
|
|
6,882 |
|
|
|
27,530 |
|
|
|
807 |
|
|
|
6,882 |
|
|
|
28,337 |
|
|
|
35,219 |
|
|
|
(938 |
) |
|
2015 |
|
Freeport Corporate Center |
|
6 |
|
(d) |
|
|
15,965 |
|
|
|
63,935 |
|
|
|
9,665 |
|
|
|
15,872 |
|
|
|
73,693 |
|
|
|
89,565 |
|
|
|
(9,737 |
) |
|
2012, 2014 |
|
Freeport Distribution Center |
|
4 |
|
|
|
|
1,393 |
|
|
|
5,549 |
|
|
|
6,289 |
|
|
|
1,440 |
|
|
|
11,791 |
|
|
|
13,231 |
|
|
|
(7,219 |
) |
|
1996, 1997, 1998 |
|
Gold Spike Distribution Center |
|
1 |
|
|
|
|
3,629 |
|
|
|
- |
|
|
|
18,094 |
|
|
|
3,629 |
|
|
|
18,094 |
|
|
|
21,723 |
|
|
|
(334 |
) |
|
2015 |
|
Great Southwest Corporate Center |
|
3 |
|
|
|
|
4,476 |
|
|
|
18,358 |
|
|
|
455 |
|
|
|
4,476 |
|
|
|
18,813 |
|
|
|
23,289 |
|
|
|
(1,625 |
) |
|
2014 |
|
Great Southwest Distribution Center |
|
22 |
|
(d) |
|
|
44,349 |
|
|
|
190,068 |
|
|
|
26,195 |
|
|
|
44,454 |
|
|
|
216,158 |
|
|
|
260,612 |
|
|
|
(67,964 |
) |
|
1995, 1996, 1997, 1999, 2000, 2005, 2012, 2014, 2015 |
|
Greater Dallas Industrial Portfolio |
|
3 |
|
|
|
|
3,525 |
|
|
|
16,375 |
|
|
|
1,713 |
|
|
|
3,525 |
|
|
|
18,088 |
|
|
|
21,613 |
|
|
|
(4,066 |
) |
|
2011 |
|
Heritage Business Park |
|
9 |
|
(d) |
|
|
20,153 |
|
|
|
93,145 |
|
|
|
29,179 |
|
|
|
20,153 |
|
|
|
122,324 |
|
|
|
142,477 |
|
|
|
(5,187 |
) |
|
2015 |
|
Lonestar Portfolio |
|
1 |
|
|
|
|
2,396 |
|
|
|
7,839 |
|
|
|
2,774 |
|
|
|
2,396 |
|
|
|
10,613 |
|
|
|
13,009 |
|
|
|
(2,655 |
) |
|
2011 |
|
Mesquite Distribution Center |
|
2 |
|
|
|
|
8,355 |
|
|
|
34,609 |
|
|
|
1,247 |
|
|
|
8,355 |
|
|
|
35,856 |
|
|
|
44,211 |
|
|
|
(4,450 |
) |
|
2012, 2014 |
|
Northgate Distribution Center |
|
10 |
|
(d) |
|
|
13,001 |
|
|
|
62,062 |
|
|
|
9,361 |
|
|
|
13,488 |
|
|
|
70,936 |
|
|
|
84,424 |
|
|
|
(23,775 |
) |
|
1999, 2005, 2008, 2012, 2014 |
|
Park 121 Distribution Center |
|
1 |
|
|
|
|
6,888 |
|
|
|
- |
|
|
|
14,628 |
|
|
|
7,662 |
|
|
|
13,854 |
|
|
|
21,516 |
|
|
|
(217 |
) |
|
2016 |
|
Riverside Drive Distribution Center |
|
1 |
|
(d) |
|
|
5,107 |
|
|
|
14,919 |
|
|
|
74 |
|
|
|
5,107 |
|
|
|
14,993 |
|
|
|
20,100 |
|
|
|
(1,020 |
) |
|
2015 |
|
ST Micro Distribution Center |
|
2 |
|
|
|
|
2,429 |
|
|
|
- |
|
|
|
17,317 |
|
|
|
4,026 |
|
|
|
15,720 |
|
|
|
19,746 |
|
|
|
(96 |
) |
|
2016 |
|
Stemmons Distribution Center |
|
1 |
|
|
|
|
272 |
|
|
|
1,544 |
|
|
|
1,018 |
|
|
|
272 |
|
|
|
2,562 |
|
|
|
2,834 |
|
|
|
(1,887 |
) |
|
1995 |
|
Stemmons Industrial Center |
|
8 |
|
|
|
|
1,653 |
|
|
|
10,526 |
|
|
|
6,697 |
|
|
|
1,653 |
|
|
|
17,223 |
|
|
|
18,876 |
|
|
|
(12,552 |
) |
|
1994, 1995, 1996, 1999 |
|
Trinity Mills Distribution Center |
|
1 |
|
(d) |
|
|
735 |
|
|
|
3,774 |
|
|
|
1,114 |
|
|
|
735 |
|
|
|
4,888 |
|
|
|
5,623 |
|
|
|
(2,907 |
) |
|
1999 |
|
Valwood Business Center |
|
5 |
|
(d) |
|
|
4,679 |
|
|
|
19,195 |
|
|
|
1,762 |
|
|
|
4,679 |
|
|
|
20,957 |
|
|
|
25,636 |
|
|
|
(6,034 |
) |
|
2001, 2006, 2014 |
102
PROLOGIS, INC. AND PROLOGIS, L.P.
SCHEDULE III – REAL ESTATE AND ACCUMULATED DEPRECIATION
DECEMBER 31, 2016
(In thousands of U.S. dollars, as applicable)
|
|
|
|
|
|
|
Initial Cost to Prologis |
|
|
Costs Capitalized |
|
|
Gross Amounts at Which Carried at December 31, 2016 |
|
|
|
|
|
|
|
|||||||||||||||
|
Description |
|
No. of Bldgs. |
|
Encum- brances |
|
Land |
|
|
Building & Improvements |
|
|
Subsequent to Acquisition |
|
|
Land |
|
|
Building & Improvements |
|
|
Total (a,b) |
|
|
Accumulated Depreciation (c) |
|
|
Date of Construction/ Acquisition |
|||||||
|
Valwood Distribution Center |
|
5 |
|
(d) |
|
|
4,742 |
|
|
|
20,629 |
|
|
|
1,860 |
|
|
|
4,742 |
|
|
|
22,489 |
|
|
|
27,231 |
|
|
|
(5,039 |
) |
|
1999, 2014 |
|
Valwood Industrial Center |
|
2 |
|
|
|
|
1,802 |
|
|
|
9,658 |
|
|
|
958 |
|
|
|
1,802 |
|
|
|
10,616 |
|
|
|
12,418 |
|
|
|
(2,564 |
) |
|
2011 |
|
Watersridge Distribution Center |
|
1 |
|
(d) |
|
|
1,939 |
|
|
|
11,365 |
|
|
|
103 |
|
|
|
1,939 |
|
|
|
11,468 |
|
|
|
13,407 |
|
|
|
(622 |
) |
|
2015 |
|
Dallas/Fort Worth, Texas |
|
116 |
|
|
|
|
183,380 |
|
|
|
770,172 |
|
|
|
212,797 |
|
|
|
186,469 |
|
|
|
979,880 |
|
|
|
1,166,349 |
|
|
|
(217,281 |
) |
|
|
|
|
|
|
|
|
|
|
|
|
|
|
|
|
|
|
|
|
|
|
|
|
|
|
|
|
|
|
|
|
|
|
|
|
|
|
|
Denver, Colorado |
|
|
|
|
|
|
|
|
|
|
|
|
|
|
|
|
|
|
|
|
|
|
|
|
|
|
|
|
|
|
|
|
|
|
|
Denver Business Center |
|
3 |
|
|
|
|
3,142 |
|
|
|
13,396 |
|
|
|
830 |
|
|
|
3,142 |
|
|
|
14,226 |
|
|
|
17,368 |
|
|
|
(2,507 |
) |
|
2012 |
|
Havana Distribution Center |
|
1 |
|
(d) |
|
|
1,421 |
|
|
|
5,657 |
|
|
|
330 |
|
|
|
1,421 |
|
|
|
5,987 |
|
|
|
7,408 |
|
|
|
(700 |
) |
|
2014 |
|
Pagosa Distribution Center |
|
1 |
|
(d) |
|
|
398 |
|
|
|
2,322 |
|
|
|
1,993 |
|
|
|
398 |
|
|
|
4,315 |
|
|
|
4,713 |
|
|
|
(3,249 |
) |
|
1993 |
|
Peoria Distribution Center |
|
2 |
|
(d) |
|
|
4,129 |
|
|
|
16,593 |
|
|
|
160 |
|
|
|
4,129 |
|
|
|
16,753 |
|
|
|
20,882 |
|
|
|
(1,392 |
) |
|
2014 |
|
Stapleton Business Center North |
|
2 |
|
|
|
|
8,930 |
|
|
|
- |
|
|
|
32,664 |
|
|
|
7,230 |
|
|
|
34,364 |
|
|
|
41,594 |
|
|
|
(1,869 |
) |
|
2014, 2015 |
|
Stapleton Business Center |
|
12 |
|
|
|
|
34,634 |
|
|
|
139,257 |
|
|
|
12,215 |
|
|
|
34,635 |
|
|
|
151,471 |
|
|
|
186,106 |
|
|
|
(58,668 |
) |
|
2005 |
|
Upland Distribution Center |
|
6 |
|
(d) |
|
|
4,064 |
|
|
|
19,035 |
|
|
|
6,180 |
|
|
|
4,077 |
|
|
|
25,202 |
|
|
|
29,279 |
|
|
|
(7,295 |
) |
|
1994, 1995, 2014 |
|
Upland Distribution Center II |
|
2 |
|
(d) |
|
|
1,396 |
|
|
|
5,349 |
|
|
|
2,183 |
|
|
|
1,409 |
|
|
|
7,519 |
|
|
|
8,928 |
|
|
|
(3,465 |
) |
|
1993, 2014 |
|
Denver, Colorado |
|
29 |
|
|
|
|
58,114 |
|
|
|
201,609 |
|
|
|
56,555 |
|
|
|
56,441 |
|
|
|
259,837 |
|
|
|
316,278 |
|
|
|
(79,145 |
) |
|
|
|
|
|
|
|
|
|
|
|
|
|
|
|
|
|
|
|
|
|
|
|
|
|
|
|
|
|
|
|
|
|
|
|
|
|
|
|
Houston, Texas |
|
|
|
|
|
|
|
|
|
|
|
|
|
|
|
|
|
|
|
|
|
|
|
|
|
|
|
|
|
|
|
|
|
|
|
Avondale Distribution Center |
|
1 |
|
|
|
|
2,231 |
|
|
|
5,044 |
|
|
|
451 |
|
|
|
2,231 |
|
|
|
5,495 |
|
|
|
7,726 |
|
|
|
(306 |
) |
|
2015 |
|
Blalock Distribution Center |
|
3 |
|
(d) |
|
|
5,032 |
|
|
|
21,983 |
|
|
|
3,340 |
|
|
|
5,031 |
|
|
|
25,324 |
|
|
|
30,355 |
|
|
|
(6,747 |
) |
|
2002, 2012 |
|
Cole Creek Distribution Center |
|
1 |
|
|
|
|
3,865 |
|
|
|
22,534 |
|
|
|
298 |
|
|
|
3,865 |
|
|
|
22,832 |
|
|
|
26,697 |
|
|
|
(1,111 |
) |
|
2015 |
|
IAH Cargo Center 1 |
|
1 |
|
|
|
|
- |
|
|
|
13,267 |
|
|
|
546 |
|
|
|
- |
|
|
|
13,813 |
|
|
|
13,813 |
|
|
|
(1,813 |
) |
|
2012 |
|
Jersey Village Corporate Center |
|
4 |
|
(d) |
|
|
17,971 |
|
|
|
73,062 |
|
|
|
2,905 |
|
|
|
17,830 |
|
|
|
76,108 |
|
|
|
93,938 |
|
|
|
(9,957 |
) |
|
2012, 2014 |
|
Kempwood Business Center |
|
4 |
|
|
|
|
1,746 |
|
|
|
9,894 |
|
|
|
3,819 |
|
|
|
1,746 |
|
|
|
13,713 |
|
|
|
15,459 |
|
|
|
(7,878 |
) |
|
2001 |
|
Northpark Distribution Center |
|
12 |
|
(d) |
|
|
15,015 |
|
|
|
37,139 |
|
|
|
36,813 |
|
|
|
15,015 |
|
|
|
73,952 |
|
|
|
88,967 |
|
|
|
(10,763 |
) |
|
2006, 2008, 2012, 2013, 2014 |
|
Perimeter Distribution Center |
|
2 |
|
|
|
|
676 |
|
|
|
4,604 |
|
|
|
1,131 |
|
|
|
745 |
|
|
|
5,666 |
|
|
|
6,411 |
|
|
|
(3,443 |
) |
|
1999 |
|
Pine Forest Business Center |
|
11 |
|
(d) |
|
|
6,042 |
|
|
|
27,639 |
|
|
|
9,861 |
|
|
|
6,042 |
|
|
|
37,500 |
|
|
|
43,542 |
|
|
|
(18,792 |
) |
|
1993, 1995, 2014 |
|
Pine North Distribution Center |
|
2 |
|
|
|
|
847 |
|
|
|
4,800 |
|
|
|
2,067 |
|
|
|
847 |
|
|
|
6,867 |
|
|
|
7,714 |
|
|
|
(3,889 |
) |
|
1999 |
|
Pinemont Distribution Center |
|
2 |
|
|
|
|
642 |
|
|
|
3,636 |
|
|
|
1,153 |
|
|
|
642 |
|
|
|
4,789 |
|
|
|
5,431 |
|
|
|
(2,976 |
) |
|
1999 |
|
Post Oak Business Center |
|
11 |
|
|
|
|
2,334 |
|
|
|
11,655 |
|
|
|
10,351 |
|
|
|
2,334 |
|
|
|
22,006 |
|
|
|
24,340 |
|
|
|
(16,351 |
) |
|
1993, 1994, 1996 |
|
Post Oak Distribution Center |
|
5 |
|
|
|
|
1,522 |
|
|
|
8,758 |
|
|
|
6,560 |
|
|
|
1,522 |
|
|
|
15,318 |
|
|
|
16,840 |
|
|
|
(11,915 |
) |
|
1993, 1994 |
|
Satsuma Station Distribution Center |
|
1 |
|
(d) |
|
|
3,088 |
|
|
|
22,389 |
|
|
|
190 |
|
|
|
3,088 |
|
|
|
22,579 |
|
|
|
25,667 |
|
|
|
(1,018 |
) |
|
2015 |
|
South Loop Distribution Center |
|
2 |
|
|
|
|
418 |
|
|
|
1,943 |
|
|
|
2,285 |
|
|
|
418 |
|
|
|
4,228 |
|
|
|
4,646 |
|
|
|
(3,106 |
) |
|
1994 |
|
Sugarland Corporate Center |
|
2 |
|
|
|
|
3,506 |
|
|
|
14,067 |
|
|
|
123 |
|
|
|
3,506 |
|
|
|
14,190 |
|
|
|
17,696 |
|
|
|
(1,173 |
) |
|
2014 |
|
West by Northwest Industrial Center |
|
9 |
|
(d) |
|
|
11,316 |
|
|
|
46,372 |
|
|
|
4,386 |
|
|
|
11,456 |
|
|
|
50,618 |
|
|
|
62,074 |
|
|
|
(9,179 |
) |
|
1993, 1994, 2012, 2014 |
|
White Street Distribution Center |
|
1 |
|
|
|
|
469 |
|
|
|
2,656 |
|
|
|
2,544 |
|
|
|
469 |
|
|
|
5,200 |
|
|
|
5,669 |
|
|
|
(3,797 |
) |
|
1995 |
|
Wingfoot Distribution Center |
|
2 |
|
|
|
|
1,976 |
|
|
|
8,606 |
|
|
|
3,480 |
|
|
|
1,976 |
|
|
|
12,086 |
|
|
|
14,062 |
|
|
|
(2,229 |
) |
|
2012, 2013 |
|
World Houston Distribution Center |
|
1 |
|
|
|
|
1,529 |
|
|
|
6,326 |
|
|
|
91 |
|
|
|
1,529 |
|
|
|
6,417 |
|
|
|
7,946 |
|
|
|
(950 |
) |
|
2012 |
|
Houston, Texas |
|
77 |
|
|
|
|
80,225 |
|
|
|
346,374 |
|
|
|
92,394 |
|
|
|
80,292 |
|
|
|
438,701 |
|
|
|
518,993 |
|
|
|
(117,393 |
) |
|
|
|
|
|
|
|
|
|
|
|
|
|
|
|
|
|
|
|
|
|
|
|
|
|
|
|
|
|
|
|
|
|
|
|
|
|
|
|
Indianapolis, Indiana |
|
|
|
|
|
|
|
|
|
|
|
|
|
|
|
|
|
|
|
|
|
|
|
|
|
|
|
|
|
|
|
|
|
|
|
Airport Business Center |
|
2 |
|
(d) |
|
|
1,667 |
|
|
|
6,445 |
|
|
|
464 |
|
|
|
1,667 |
|
|
|
6,909 |
|
|
|
8,576 |
|
|
|
(577 |
) |
|
2014 |
|
Airtech Park |
|
1 |
|
(d) |
|
|
7,305 |
|
|
|
29,001 |
|
|
|
467 |
|
|
|
7,305 |
|
|
|
29,468 |
|
|
|
36,773 |
|
|
|
(2,464 |
) |
|
2014 |
|
Eastside Distribution Center |
|
1 |
|
|
|
|
228 |
|
|
|
1,187 |
|
|
|
2,255 |
|
|
|
299 |
|
|
|
3,371 |
|
|
|
3,670 |
|
|
|
(2,188 |
) |
|
1995 |
|
North by Northeast Corporate Center |
|
1 |
|
|
|
|
1,058 |
|
|
|
- |
|
|
|
9,302 |
|
|
|
1,059 |
|
|
|
9,301 |
|
|
|
10,360 |
|
|
|
(5,718 |
) |
|
1995 |
|
North Plainfield Park Distribution Center |
|
1 |
|
(d) |
|
|
8,562 |
|
|
|
34,778 |
|
|
|
103 |
|
|
|
8,562 |
|
|
|
34,881 |
|
|
|
43,443 |
|
|
|
(2,925 |
) |
|
2014 |
|
Park 100 Industrial Center |
|
16 |
|
(d) |
|
|
9,360 |
|
|
|
38,402 |
|
|
|
23,790 |
|
|
|
9,360 |
|
|
|
62,192 |
|
|
|
71,552 |
|
|
|
(27,240 |
) |
|
1995, 2012 |
|
Park 267 |
|
1 |
|
|
|
|
3,705 |
|
|
|
15,695 |
|
|
|
948 |
|
|
|
3,705 |
|
|
|
16,643 |
|
|
|
20,348 |
|
|
|
(1,293 |
) |
|
2014 |
|
Shadeland Industrial Center |
|
3 |
|
|
|
|
428 |
|
|
|
2,431 |
|
|
|
3,459 |
|
|
|
429 |
|
|
|
5,889 |
|
|
|
6,318 |
|
|
|
(4,225 |
) |
|
1995 |
|
Indianapolis, Indiana |
|
26 |
|
|
|
|
32,313 |
|
|
|
127,939 |
|
|
|
40,788 |
|
|
|
32,386 |
|
|
|
168,654 |
|
|
|
201,040 |
|
|
|
(46,630 |
) |
|
|
|
|
|
|
|
|
|
|
|
|
|
|
|
|
|
|
|
|
|
|
|
|
|
|
|
|
|
|
|
|
|
|
|
|
|
|
|
Jacksonville, Florida |
|
|
|
|
|
|
|
|
|
|
|
|
|
|
|
|
|
|
|
|
|
|
|
|
|
|
|
|
|
|
|
|
|
|
|
JAX Cargo Center |
|
1 |
|
|
|
|
- |
|
|
|
2,892 |
|
|
|
176 |
|
|
|
- |
|
|
|
3,068 |
|
|
|
3,068 |
|
|
|
(1,423 |
) |
|
2011 |
|
Jacksonville, Florida |
|
1 |
|
|
|
|
- |
|
|
|
2,892 |
|
|
|
176 |
|
|
|
- |
|
|
|
3,068 |
|
|
|
3,068 |
|
|
|
(1,423 |
) |
|
|
|
|
|
|
|
|
|
|
|
|
|
|
|
|
|
|
|
|
|
|
|
|
|
|
|
|
|
|
|
|
|
|
|
|
|
|
|
Kansas City, Kansas |
|
|
|
|
|
|
|
|
|
|
|
|
|
|
|
|
|
|
|
|
|
|
|
|
|
|
|
|
|
|
|
|
|
|
|
MCI Cargo Center 1 |
|
1 |
|
|
|
|
- |
|
|
|
2,781 |
|
|
|
278 |
|
|
|
- |
|
|
|
3,059 |
|
|
|
3,059 |
|
|
|
(2,026 |
) |
|
2011 |
|
MCI Cargo Center 2 |
|
1 |
|
|
|
|
- |
|
|
|
11,630 |
|
|
|
- |
|
|
|
- |
|
|
|
11,630 |
|
|
|
11,630 |
|
|
|
(3,975 |
) |
|
2011 |
|
Kansas City, Kansas |
|
2 |
|
|
|
|
- |
|
|
|
14,411 |
|
|
|
278 |
|
|
|
- |
|
|
|
14,689 |
|
|
|
14,689 |
|
|
|
(6,001 |
) |
|
|
|
|
|
|
|
|
|
|
|
|
|
|
|
|
|
|
|
|
|
|
|
|
|
|
|
|
|
|
|
|
|
|
|
|
|
|
|
Las Vegas, Nevada |
|
|
|
|
|
|
|
|
|
|
|
|
|
|
|
|
|
|
|
|
|
|
|
|
|
|
|
|
|
|
|
|
|
|
|
Arrowhead Commerce Center |
|
15 |
|
(d) |
|
|
30,075 |
|
|
|
82,214 |
|
|
|
2,599 |
|
|
|
30,075 |
|
|
|
84,813 |
|
|
|
114,888 |
|
|
|
(4,433 |
) |
|
2015 |
|
Cameron Business Center |
|
1 |
|
|
|
|
1,963 |
|
|
|
3,626 |
|
|
|
343 |
|
|
|
1,963 |
|
|
|
3,969 |
|
|
|
5,932 |
|
|
|
(206 |
) |
|
2015 |
|
Las Vegas Corporate Center |
|
6 |
|
|
|
|
23,118 |
|
|
|
51,157 |
|
|
|
1,846 |
|
|
|
13,656 |
|
|
|
62,465 |
|
|
|
76,121 |
|
|
|
(3,813 |
) |
|
2014, 2015 |
|
Montessouri Distribution Center |
|
1 |
|
|
|
|
1,039 |
|
|
|
2,967 |
|
|
|
15 |
|
|
|
1,039 |
|
|
|
2,982 |
|
|
|
4,021 |
|
|
|
(184 |
) |
|
2015 |
|
North 15 Freeway Distribution Center |
|
1 |
|
|
|
|
2,638 |
|
|
|
9,887 |
|
|
|
1,731 |
|
|
|
2,655 |
|
|
|
11,601 |
|
|
|
14,256 |
|
|
|
(67 |
) |
|
2016 |
|
Pama Distribution Center |
|
1 |
|
(d) |
|
|
2,223 |
|
|
|
5,695 |
|
|
|
78 |
|
|
|
2,223 |
|
|
|
5,773 |
|
|
|
7,996 |
|
|
|
(292 |
) |
|
2015 |
|
Sunrise Industrial Park |
|
10 |
|
|
|
|
21,499 |
|
|
|
92,503 |
|
|
|
19,237 |
|
|
|
21,611 |
|
|
|
111,628 |
|
|
|
133,239 |
|
|
|
(13,142 |
) |
|
2011, 2013, 2014, 2016 |
|
Valley View Distribution Center |
|
1 |
|
|
|
|
2,420 |
|
|
|
258 |
|
|
|
8 |
|
|
|
2,420 |
|
|
|
266 |
|
|
|
2,686 |
|
|
|
(168 |
) |
|
2015 |
|
Warm Springs Distribution Center |
|
6 |
|
(d) |
|
|
8,897 |
|
|
|
39,055 |
|
|
|
606 |
|
|
|
8,897 |
|
|
|
39,661 |
|
|
|
48,558 |
|
|
|
(2,104 |
) |
|
2015 |
|
|
|
|
|
|
|
|
|
|
|
|
|
|
|
|
|
|
|
|
|
|
|
|
|
|
|
|
|
|
|
|
|
|
|
|
103
PROLOGIS, INC. AND PROLOGIS, L.P.
SCHEDULE III – REAL ESTATE AND ACCUMULATED DEPRECIATION
DECEMBER 31, 2016
(In thousands of U.S. dollars, as applicable)
|
|
|
|
|
|
|
Initial Cost to Prologis |
|
|
Costs Capitalized |
|
|
Gross Amounts at Which Carried at December 31, 2016 |
|
|
|
|
|
|
|
|||||||||||||||
|
Description |
|
No. of Bldgs. |
|
Encum- brances |
|
Land |
|
|
Building & Improvements |
|
|
Subsequent to Acquisition |
|
|
Land |
|
|
Building & Improvements |
|
|
Total (a,b) |
|
|
Accumulated Depreciation (c) |
|
|
Date of Construction/ Acquisition |
|||||||
|
West One Business Center |
|
4 |
|
|
|
|
2,468 |
|
|
|
13,985 |
|
|
|
5,614 |
|
|
|
2,468 |
|
|
|
19,599 |
|
|
|
22,067 |
|
|
|
(13,436 |
) |
|
1996 |
|
Las Vegas, Nevada |
|
46 |
|
|
|
|
96,340 |
|
|
|
301,347 |
|
|
|
32,077 |
|
|
|
87,007 |
|
|
|
342,757 |
|
|
|
429,764 |
|
|
|
(37,845 |
) |
|
|
|
|
|
|
|
|
|
|
|
|
|
|
|
|
|
|
|
|
|
|
|
|
|
|
|
|
|
|
|
|
|
|
|
|
|
|
|
Louisville, Kentucky |
|
|
|
|
|
|
|
|
|
|
|
|
|
|
|
|
|
|
|
|
|
|
|
|
|
|
|
|
|
|
|
|
|
|
|
Cedar Grove Distribution Center |
|
5 |
|
|
|
|
20,697 |
|
|
|
105,257 |
|
|
|
4,238 |
|
|
|
20,696 |
|
|
|
109,496 |
|
|
|
130,192 |
|
|
|
(17,257 |
) |
|
2005, 2008, 2012, 2015 |
|
Commerce Crossings Distribution Center |
|
1 |
|
|
|
|
1,912 |
|
|
|
7,649 |
|
|
|
284 |
|
|
|
1,912 |
|
|
|
7,933 |
|
|
|
9,845 |
|
|
|
(3,018 |
) |
|
2005 |
|
I-65 Meyer Distribution Center |
|
3 |
|
|
|
|
9,557 |
|
|
|
32,334 |
|
|
|
25,882 |
|
|
|
9,864 |
|
|
|
57,909 |
|
|
|
67,773 |
|
|
|
(11,615 |
) |
|
2006, 2012, 2015 |
|
New Cut Road Distribution Center |
|
1 |
|
|
|
|
2,711 |
|
|
|
11,694 |
|
|
|
803 |
|
|
|
2,711 |
|
|
|
12,497 |
|
|
|
15,208 |
|
|
|
(2,436 |
) |
|
2012 |
|
River Ridge Distribution Center |
|
1 |
|
|
|
|
8,102 |
|
|
|
69,329 |
|
|
|
303 |
|
|
|
8,102 |
|
|
|
69,632 |
|
|
|
77,734 |
|
|
|
(3,044 |
) |
|
2015 |
|
Louisville, Kentucky |
|
11 |
|
|
|
|
42,979 |
|
|
|
226,263 |
|
|
|
31,510 |
|
|
|
43,285 |
|
|
|
257,467 |
|
|
|
300,752 |
|
|
|
(37,370 |
) |
|
|
|
|
|
|
|
|
|
|
|
|
|
|
|
|
|
|
|
|
|
|
|
|
|
|
|
|
|
|
|
|
|
|
|
|
|
|
|
Memphis, Tennessee |
|
|
|
|
|
|
|
|
|
|
|
|
|
|
|
|
|
|
|
|
|
|
|
|
|
|
|
|
|
|
|
|
|
|
|
Delp Distribution Center |
|
3 |
|
|
|
|
1,068 |
|
|
|
10,546 |
|
|
|
1,036 |
|
|
|
1,068 |
|
|
|
11,582 |
|
|
|
12,650 |
|
|
|
(8,384 |
) |
|
1995 |
|
DeSoto Distribution Center |
|
3 |
|
(d) |
|
|
7,225 |
|
|
|
4,136 |
|
|
|
35,967 |
|
|
|
6,778 |
|
|
|
40,550 |
|
|
|
47,328 |
|
|
|
(9,042 |
) |
|
2007, 2014 |
|
Memphis Industrial Park |
|
2 |
|
|
|
|
3,252 |
|
|
|
14,448 |
|
|
|
1,693 |
|
|
|
3,252 |
|
|
|
16,141 |
|
|
|
19,393 |
|
|
|
(3,114 |
) |
|
2012 |
|
Olive Branch Distribution Center |
|
1 |
|
|
|
|
6,719 |
|
|
|
31,134 |
|
|
|
443 |
|
|
|
6,719 |
|
|
|
31,577 |
|
|
|
38,296 |
|
|
|
(6,611 |
) |
|
2012 |
|
Willow Lake Distribution Center |
|
1 |
|
|
|
|
613 |
|
|
|
3,474 |
|
|
|
109 |
|
|
|
613 |
|
|
|
3,583 |
|
|
|
4,196 |
|
|
|
(2,313 |
) |
|
1999 |
|
Memphis, Tennessee |
|
10 |
|
|
|
|
18,877 |
|
|
|
63,738 |
|
|
|
39,248 |
|
|
|
18,430 |
|
|
|
103,433 |
|
|
|
121,863 |
|
|
|
(29,464 |
) |
|
|
|
|
|
|
|
|
|
|
|
|
|
|
|
|
|
|
|
|
|
|
|
|
|
|
|
|
|
|
|
|
|
|
|
|
|
|
|
Nashville, Tennessee |
|
|
|
|
|
|
|
|
|
|
|
|
|
|
|
|
|
|
|
|
|
|
|
|
|
|
|
|
|
|
|
|
|
|
|
CentrePointe Distribution Center |
|
4 |
|
(d) |
|
|
7,507 |
|
|
|
15,042 |
|
|
|
16,220 |
|
|
|
9,067 |
|
|
|
29,702 |
|
|
|
38,769 |
|
|
|
(1,801 |
) |
|
2013, 2016 |
|
Elam Farms Park |
|
1 |
|
|
|
|
2,097 |
|
|
|
8,386 |
|
|
|
1,928 |
|
|
|
2,097 |
|
|
|
10,314 |
|
|
|
12,411 |
|
|
|
(1,758 |
) |
|
2013 |
|
I-40 Industrial Center |
|
4 |
|
|
|
|
3,075 |
|
|
|
15,333 |
|
|
|
5,611 |
|
|
|
3,075 |
|
|
|
20,944 |
|
|
|
24,019 |
|
|
|
(9,101 |
) |
|
1995, 1996, 1999, 2012 |
|
Interchange City Distribution Center |
|
11 |
|
(d) |
|
|
11,460 |
|
|
|
49,472 |
|
|
|
6,184 |
|
|
|
11,460 |
|
|
|
55,656 |
|
|
|
67,116 |
|
|
|
(8,538 |
) |
|
1999, 2012, 2014 |
|
Nashville North Distribution Center |
|
4 |
|
(d) |
|
|
6,194 |
|
|
|
44,587 |
|
|
|
839 |
|
|
|
6,194 |
|
|
|
45,426 |
|
|
|
51,620 |
|
|
|
(2,479 |
) |
|
2015 |
|
Southpark Distribution Center |
|
4 |
|
(d) |
|
|
11,834 |
|
|
|
47,335 |
|
|
|
1,583 |
|
|
|
11,834 |
|
|
|
48,918 |
|
|
|
60,752 |
|
|
|
(5,019 |
) |
|
2013 |
|
Nashville, Tennessee |
|
28 |
|
|
|
|
42,167 |
|
|
|
180,155 |
|
|
|
32,365 |
|
|
|
43,727 |
|
|
|
210,960 |
|
|
|
254,687 |
|
|
|
(28,696 |
) |
|
|
|
|
|
|
|
|
|
|
|
|
|
|
|
|
|
|
|
|
|
|
|
|
|
|
|
|
|
|
|
|
|
|
|
|
|
|
|
New Jersey/New York |
|
|
|
|
|
|
|
|
|
|
|
|
|
|
|
|
|
|
|
|
|
|
|
|
|
|
|
|
|
|
|
|
|
|
|
Brunswick Distribution Center |
|
2 |
|
|
|
|
870 |
|
|
|
4,928 |
|
|
|
3,665 |
|
|
|
870 |
|
|
|
8,593 |
|
|
|
9,463 |
|
|
|
(5,681 |
) |
|
1997 |
|
Carteret Distribution Center |
|
3 |
|
|
|
|
39,148 |
|
|
|
109,124 |
|
|
|
892 |
|
|
|
39,148 |
|
|
|
110,016 |
|
|
|
149,164 |
|
|
|
(6,225 |
) |
|
2015 |
|
CenterPoint Distribution Center |
|
1 |
|
|
|
|
2,839 |
|
|
|
12,490 |
|
|
|
1,851 |
|
|
|
2,839 |
|
|
|
14,341 |
|
|
|
17,180 |
|
|
|
(3,314 |
) |
|
2012 |
|
Clifton Distribution Center |
|
1 |
|
|
|
|
8,064 |
|
|
|
12,096 |
|
|
|
2,555 |
|
|
|
8,064 |
|
|
|
14,651 |
|
|
|
22,715 |
|
|
|
(3,165 |
) |
|
2010 |
|
Cranbury Business Park |
|
8 |
|
(d) |
|
|
43,056 |
|
|
|
91,129 |
|
|
|
4,561 |
|
|
|
43,056 |
|
|
|
95,690 |
|
|
|
138,746 |
|
|
|
(13,029 |
) |
|
2012, 2014 |
|
Dellamor |
|
7 |
|
|
|
|
6,710 |
|
|
|
35,478 |
|
|
|
2,669 |
|
|
|
6,710 |
|
|
|
38,147 |
|
|
|
44,857 |
|
|
|
(9,617 |
) |
|
2011 |
|
Docks Corner SG (Phase II) |
|
1 |
|
|
|
|
16,232 |
|
|
|
19,264 |
|
|
|
7,270 |
|
|
|
16,232 |
|
|
|
26,534 |
|
|
|
42,766 |
|
|
|
(9,747 |
) |
|
2011 |
|
Edison Distribution Center |
|
1 |
|
|
|
|
30,610 |
|
|
|
52,190 |
|
|
|
11,042 |
|
|
|
30,610 |
|
|
|
63,232 |
|
|
|
93,842 |
|
|
|
(1,789 |
) |
|
2015 |
|
Elizabeth Seaport II |
|
1 |
|
|
|
|
37,325 |
|
|
|
- |
|
|
|
38,131 |
|
|
|
40,896 |
|
|
|
34,560 |
|
|
|
75,456 |
|
|
|
(49 |
) |
|
2016 |
|
Exit 10 Distribution Center |
|
7 |
|
(d) |
|
|
35,289 |
|
|
|
147,492 |
|
|
|
12,715 |
|
|
|
35,289 |
|
|
|
160,207 |
|
|
|
195,496 |
|
|
|
(53,850 |
) |
|
2005, 2015 |
|
Exit 7 Distribution Center |
|
2 |
|
(d) |
|
|
35,728 |
|
|
|
117,157 |
|
|
|
753 |
|
|
|
35,728 |
|
|
|
117,910 |
|
|
|
153,638 |
|
|
|
(5,139 |
) |
|
2015 |
|
Exit 8A Distribution Center |
|
2 |
|
(d) |
|
|
21,164 |
|
|
|
85,257 |
|
|
|
4,876 |
|
|
|
21,164 |
|
|
|
90,133 |
|
|
|
111,297 |
|
|
|
(20,304 |
) |
|
2005, 2014 |
|
Franklin Commerce Center |
|
1 |
|
|
|
|
9,304 |
|
|
|
23,768 |
|
|
|
502 |
|
|
|
9,304 |
|
|
|
24,270 |
|
|
|
33,574 |
|
|
|
(4,090 |
) |
|
2011 |
|
Gourmet Lane Distribution Center |
|
1 |
|
|
|
|
13,099 |
|
|
|
23,539 |
|
|
|
1,167 |
|
|
|
13,099 |
|
|
|
24,706 |
|
|
|
37,805 |
|
|
|
(856 |
) |
|
2015 |
|
Highway 17 55 Madis |
|
1 |
|
|
|
|
2,937 |
|
|
|
13,477 |
|
|
|
1,115 |
|
|
|
2,937 |
|
|
|
14,592 |
|
|
|
17,529 |
|
|
|
(3,582 |
) |
|
2011 |
|
Interstate Distribution Center |
|
3 |
|
(d) |
|
|
30,188 |
|
|
|
76,705 |
|
|
|
902 |
|
|
|
30,188 |
|
|
|
77,607 |
|
|
|
107,795 |
|
|
|
(3,682 |
) |
|
2015 |
|
JFK Cargo Center 75_77 |
|
2 |
|
|
|
|
- |
|
|
|
35,916 |
|
|
|
5,489 |
|
|
|
- |
|
|
|
41,405 |
|
|
|
41,405 |
|
|
|
(19,902 |
) |
|
2011 |
|
Kilmer Distribution Center |
|
4 |
|
(d) |
|
|
2,526 |
|
|
|
14,313 |
|
|
|
5,007 |
|
|
|
2,526 |
|
|
|
19,320 |
|
|
|
21,846 |
|
|
|
(12,851 |
) |
|
1996 |
|
Liberty Log Center |
|
1 |
|
|
|
|
3,273 |
|
|
|
24,029 |
|
|
|
372 |
|
|
|
3,273 |
|
|
|
24,401 |
|
|
|
27,674 |
|
|
|
(3,771 |
) |
|
2011 |
|
Linden Industrial Center |
|
1 |
|
(d) |
|
|
17,332 |
|
|
|
24,264 |
|
|
|
1,397 |
|
|
|
17,332 |
|
|
|
25,661 |
|
|
|
42,993 |
|
|
|
(920 |
) |
|
2015 |
|
Lister Distribution Center |
|
1 |
|
|
|
|
16,855 |
|
|
|
21,802 |
|
|
|
1,422 |
|
|
|
16,855 |
|
|
|
23,224 |
|
|
|
40,079 |
|
|
|
(768 |
) |
|
2015 |
|
Maspeth Distribution Center |
|
1 |
|
(d) |
|
|
23,784 |
|
|
|
10,849 |
|
|
|
278 |
|
|
|
23,784 |
|
|
|
11,127 |
|
|
|
34,911 |
|
|
|
(364 |
) |
|
2015 |
|
Meadow Lane |
|
1 |
|
|
|
|
1,036 |
|
|
|
6,388 |
|
|
|
27 |
|
|
|
1,036 |
|
|
|
6,415 |
|
|
|
7,451 |
|
|
|
(1,518 |
) |
|
2011 |
|
Meadowland Distribution Center |
|
6 |
|
(d) |
|
|
26,379 |
|
|
|
83,224 |
|
|
|
7,428 |
|
|
|
26,379 |
|
|
|
90,652 |
|
|
|
117,031 |
|
|
|
(25,559 |
) |
|
2005, 2015 |
|
Meadowland Industrial Center |
|
7 |
|
(d) |
|
|
4,190 |
|
|
|
13,469 |
|
|
|
20,655 |
|
|
|
4,190 |
|
|
|
34,124 |
|
|
|
38,314 |
|
|
|
(22,140 |
) |
|
1996, 1998 |
|
Meadowlands ALFII |
|
3 |
|
|
|
|
3,972 |
|
|
|
18,895 |
|
|
|
3,427 |
|
|
|
3,972 |
|
|
|
22,322 |
|
|
|
26,294 |
|
|
|
(4,846 |
) |
|
2011 |
|
Meadowlands Park |
|
8 |
|
|
|
|
6,898 |
|
|
|
41,471 |
|
|
|
1,998 |
|
|
|
6,898 |
|
|
|
43,469 |
|
|
|
50,367 |
|
|
|
(10,405 |
) |
|
2011 |
|
Mooncreek Distribution Center |
|
1 |
|
|
|
|
3,319 |
|
|
|
13,422 |
|
|
|
15 |
|
|
|
3,319 |
|
|
|
13,437 |
|
|
|
16,756 |
|
|
|
(3,429 |
) |
|
2011 |
|
Murray Hill Parkway |
|
2 |
|
|
|
|
2,907 |
|
|
|
12,040 |
|
|
|
525 |
|
|
|
2,907 |
|
|
|
12,565 |
|
|
|
15,472 |
|
|
|
(2,655 |
) |
|
2011 |
|
Newark Airport I and II |
|
2 |
|
|
|
|
19,045 |
|
|
|
21,936 |
|
|
|
901 |
|
|
|
19,045 |
|
|
|
22,837 |
|
|
|
41,882 |
|
|
|
(1,882 |
) |
|
2011, 2015 |
|
Orchard Hill |
|
1 |
|
|
|
|
678 |
|
|
|
3,756 |
|
|
|
20 |
|
|
|
678 |
|
|
|
3,776 |
|
|
|
4,454 |
|
|
|
(955 |
) |
|
2011 |
|
Pennsauken Distribution Center |
|
2 |
|
|
|
|
192 |
|
|
|
959 |
|
|
|
655 |
|
|
|
203 |
|
|
|
1,603 |
|
|
|
1,806 |
|
|
|
(958 |
) |
|
1999 |
|
Perth Amboy Corporate Park |
|
2 |
|
(d) |
|
|
54,701 |
|
|
|
66,534 |
|
|
|
4,365 |
|
|
|
54,701 |
|
|
|
70,899 |
|
|
|
125,600 |
|
|
|
(2,554 |
) |
|
2015 |
|
Port Reading Business Park |
|
10 |
|
(d) |
|
|
211,931 |
|
|
|
256,740 |
|
|
|
119,387 |
|
|
|
201,814 |
|
|
|
386,244 |
|
|
|
588,058 |
|
|
|
(27,772 |
) |
|
2005, 2014, 2015 |
|
Ports Jersey City Distribution Center |
|
1 |
|
|
|
|
34,133 |
|
|
|
- |
|
|
|
61,057 |
|
|
|
34,504 |
|
|
|
60,686 |
|
|
|
95,190 |
|
|
|
(4,454 |
) |
|
2014 |
|
Portview Commerce Center |
|
3 |
|
(d) |
|
|
9,577 |
|
|
|
21,581 |
|
|
|
19,134 |
|
|
|
9,798 |
|
|
|
40,494 |
|
|
|
50,292 |
|
|
|
(5,710 |
) |
|
2011, 2012 |
|
Secaucus Distribution Center |
|
2 |
|
(d) |
|
|
9,603 |
|
|
|
- |
|
|
|
26,905 |
|
|
|
9,603 |
|
|
|
26,905 |
|
|
|
36,508 |
|
|
|
(3,142 |
) |
|
2012 |
|
Skyland Crossdock |
|
1 |
|
|
|
|
- |
|
|
|
9,831 |
|
|
|
1,308 |
|
|
|
- |
|
|
|
11,139 |
|
|
|
11,139 |
|
|
|
(3,018 |
) |
|
2011 |
|
South Jersey Distribution Center |
|
1 |
|
|
|
|
6,912 |
|
|
|
17,437 |
|
|
|
216 |
|
|
|
6,912 |
|
|
|
17,653 |
|
|
|
24,565 |
|
|
|
(2,317 |
) |
|
2013 |
|
Teterboro Meadowlands 15 |
|
2 |
|
|
|
|
18,169 |
|
|
|
34,604 |
|
|
|
226 |
|
|
|
18,169 |
|
|
|
34,830 |
|
|
|
52,999 |
|
|
|
(5,752 |
) |
|
2011, 2015 |
|
|
|
|
|
|
|
|
|
|
|
|
|
|
|
|
|
|
|
|
|
|
|
|
|
|
|
|
|
|
|
|
|
|
|
|
104
PROLOGIS, INC. AND PROLOGIS, L.P.
SCHEDULE III – REAL ESTATE AND ACCUMULATED DEPRECIATION
DECEMBER 31, 2016
(In thousands of U.S. dollars, as applicable)
|
|
|
|
|
|
|
Initial Cost to Prologis |
|
|
Costs Capitalized |
|
|
Gross Amounts at Which Carried at December 31, 2016 |
|
|
|
|
|
|
|
|||||||||||||||
|
Description |
|
No. of Bldgs. |
|
Encum- brances |
|
Land |
|
|
Building & Improvements |
|
|
Subsequent to Acquisition |
|
|
Land |
|
|
Building & Improvements |
|
|
Total (a,b) |
|
|
Accumulated Depreciation (c) |
|
|
Date of Construction/ Acquisition |
|||||||
|
Two South Middlesex |
|
1 |
|
|
|
|
4,389 |
|
|
|
8,410 |
|
|
|
1,030 |
|
|
|
4,389 |
|
|
|
9,440 |
|
|
|
13,829 |
|
|
|
(2,408 |
) |
|
2011 |
|
New Jersey/New York |
|
108 |
|
|
|
|
814,364 |
|
|
|
1,585,964 |
|
|
|
377,910 |
|
|
|
808,421 |
|
|
|
1,969,817 |
|
|
|
2,778,238 |
|
|
|
(314,169 |
) |
|
|
|
|
|
|
|
|
|
|
|
|
|
|
|
|
|
|
|
|
|
|
|
|
|
|
|
|
|
|
|
|
|
|
|
|
|
|
|
Orlando, Florida |
|
|
|
|
|
|
|
|
|
|
|
|
|
|
|
|
|
|
|
|
|
|
|
|
|
|
|
|
|
|
|
|
|
|
|
Beltway Commerce Center |
|
4 |
|
|
|
|
18,835 |
|
|
|
25,526 |
|
|
|
15,316 |
|
|
|
18,840 |
|
|
|
40,837 |
|
|
|
59,677 |
|
|
|
(7,093 |
) |
|
2008, 2015 |
|
Chancellor Distribution Center |
|
1 |
|
|
|
|
380 |
|
|
|
2,157 |
|
|
|
2,615 |
|
|
|
380 |
|
|
|
4,772 |
|
|
|
5,152 |
|
|
|
(3,391 |
) |
|
1994 |
|
Chancellor Square |
|
3 |
|
|
|
|
2,087 |
|
|
|
9,708 |
|
|
|
2,320 |
|
|
|
687 |
|
|
|
13,428 |
|
|
|
14,115 |
|
|
|
(2,928 |
) |
|
2011 |
|
Consulate Distribution Center |
|
5 |
|
(d) |
|
|
6,105 |
|
|
|
31,550 |
|
|
|
3,419 |
|
|
|
6,105 |
|
|
|
34,969 |
|
|
|
41,074 |
|
|
|
(16,254 |
) |
|
1999, 2014 |
|
Crowne Pointe Park |
|
1 |
|
|
|
|
3,888 |
|
|
|
7,497 |
|
|
|
1,592 |
|
|
|
3,888 |
|
|
|
9,089 |
|
|
|
12,977 |
|
|
|
(434 |
) |
|
2015 |
|
Davenport Distribution Center |
|
1 |
|
|
|
|
934 |
|
|
|
3,991 |
|
|
|
102 |
|
|
|
934 |
|
|
|
4,093 |
|
|
|
5,027 |
|
|
|
(763 |
) |
|
2012 |
|
Lake Mary Logistics Center |
|
1 |
|
|
|
|
1,374 |
|
|
|
5,101 |
|
|
|
185 |
|
|
|
1,374 |
|
|
|
5,286 |
|
|
|
6,660 |
|
|
|
(277 |
) |
|
2015 |
|
Orlando Airport Park |
|
1 |
|
|
|
|
5,259 |
|
|
|
- |
|
|
|
17,025 |
|
|
|
5,724 |
|
|
|
16,560 |
|
|
|
22,284 |
|
|
|
(104 |
) |
|
2016 |
|
Orlando Central Park |
|
1 |
|
|
|
|
1,398 |
|
|
|
5,977 |
|
|
|
416 |
|
|
|
1,398 |
|
|
|
6,393 |
|
|
|
7,791 |
|
|
|
(1,378 |
) |
|
2012 |
|
Orlando Corporate Center |
|
6 |
|
(d) |
|
|
8,061 |
|
|
|
33,030 |
|
|
|
1,544 |
|
|
|
8,061 |
|
|
|
34,574 |
|
|
|
42,635 |
|
|
|
(3,061 |
) |
|
2014 |
|
Presidents Drive |
|
6 |
|
|
|
|
6,845 |
|
|
|
31,180 |
|
|
|
4,240 |
|
|
|
6,845 |
|
|
|
35,420 |
|
|
|
42,265 |
|
|
|
(8,892 |
) |
|
2011 |
|
Sand Lake Service Center |
|
6 |
|
|
|
|
3,704 |
|
|
|
19,546 |
|
|
|
4,035 |
|
|
|
3,704 |
|
|
|
23,581 |
|
|
|
27,285 |
|
|
|
(5,793 |
) |
|
2011 |
|
Orlando, Florida |
|
36 |
|
|
|
|
58,870 |
|
|
|
175,263 |
|
|
|
52,809 |
|
|
|
57,940 |
|
|
|
229,002 |
|
|
|
286,942 |
|
|
|
(50,368 |
) |
|
|
|
|
|
|
|
|
|
|
|
|
|
|
|
|
|
|
|
|
|
|
|
|
|
|
|
|
|
|
|
|
|
|
|
|
|
|
|
Phoenix, Arizona |
|
|
|
|
|
|
|
|
|
|
|
|
|
|
|
|
|
|
|
|
|
|
|
|
|
|
|
|
|
|
|
|
|
|
|
24th Street Industrial Center |
|
2 |
|
|
|
|
503 |
|
|
|
2,852 |
|
|
|
2,042 |
|
|
|
561 |
|
|
|
4,836 |
|
|
|
5,397 |
|
|
|
(3,781 |
) |
|
1994 |
|
Alameda Distribution Center |
|
2 |
|
|
|
|
3,872 |
|
|
|
14,358 |
|
|
|
3,184 |
|
|
|
3,872 |
|
|
|
17,542 |
|
|
|
21,414 |
|
|
|
(6,945 |
) |
|
2005 |
|
Brookridge Distribution Center |
|
1 |
|
(d) |
|
|
3,897 |
|
|
|
15,153 |
|
|
|
241 |
|
|
|
3,897 |
|
|
|
15,394 |
|
|
|
19,291 |
|
|
|
(1,357 |
) |
|
2014 |
|
Hohokam 10 Business Center |
|
1 |
|
|
|
|
1,317 |
|
|
|
7,468 |
|
|
|
1,581 |
|
|
|
1,318 |
|
|
|
9,048 |
|
|
|
10,366 |
|
|
|
(5,355 |
) |
|
1999 |
|
Kyrene Commons Distribution Center |
|
3 |
|
|
|
|
1,093 |
|
|
|
5,475 |
|
|
|
2,909 |
|
|
|
1,093 |
|
|
|
8,384 |
|
|
|
9,477 |
|
|
|
(5,550 |
) |
|
1992, 1998, 1999 |
|
Papago Distribution Center |
|
3 |
|
|
|
|
4,828 |
|
|
|
20,017 |
|
|
|
5,275 |
|
|
|
4,829 |
|
|
|
25,291 |
|
|
|
30,120 |
|
|
|
(11,790 |
) |
|
1994, 2005 |
|
Phoenix Distribution Center |
|
1 |
|
|
|
|
1,441 |
|
|
|
5,578 |
|
|
|
1,026 |
|
|
|
1,441 |
|
|
|
6,604 |
|
|
|
8,045 |
|
|
|
(978 |
) |
|
2012 |
|
Sky Harbor Distribution Center |
|
3 |
|
|
|
|
- |
|
|
|
14,023 |
|
|
|
2,714 |
|
|
|
- |
|
|
|
16,737 |
|
|
|
16,737 |
|
|
|
(336 |
) |
|
2016 |
|
University Dr Distribution Center |
|
1 |
|
|
|
|
683 |
|
|
|
2,735 |
|
|
|
825 |
|
|
|
683 |
|
|
|
3,560 |
|
|
|
4,243 |
|
|
|
(1,298 |
) |
|
2005 |
|
Watkins Street Distribution Center |
|
1 |
|
|
|
|
242 |
|
|
|
1,375 |
|
|
|
801 |
|
|
|
243 |
|
|
|
2,175 |
|
|
|
2,418 |
|
|
|
(1,496 |
) |
|
1995 |
|
Wilson Drive Distribution Center |
|
1 |
|
|
|
|
1,273 |
|
|
|
5,093 |
|
|
|
992 |
|
|
|
1,273 |
|
|
|
6,085 |
|
|
|
7,358 |
|
|
|
(2,499 |
) |
|
2005 |
|
Phoenix, Arizona |
|
19 |
|
|
|
|
19,149 |
|
|
|
94,127 |
|
|
|
21,590 |
|
|
|
19,210 |
|
|
|
115,656 |
|
|
|
134,866 |
|
|
|
(41,385 |
) |
|
|
|
|
|
|
|
|
|
|
|
|
|
|
|
|
|
|
|
|
|
|
|
|
|
|
|
|
|
|
|
|
|
|
|
|
|
|
|
Portland, Oregon |
|
|
|
|
|
|
|
|
|
|
|
|
|
|
|
|
|
|
|
|
|
|
|
|
|
|
|
|
|
|
|
|
|
|
|
Clackamas Distribution Center |
|
5 |
|
(d) |
|
|
8,828 |
|
|
|
28,192 |
|
|
|
590 |
|
|
|
8,828 |
|
|
|
28,782 |
|
|
|
37,610 |
|
|
|
(2,907 |
) |
|
2012, 2014 |
|
PDX Cargo Center Airtrans |
|
2 |
|
|
|
|
- |
|
|
|
13,697 |
|
|
|
246 |
|
|
|
- |
|
|
|
13,943 |
|
|
|
13,943 |
|
|
|
(4,284 |
) |
|
2011 |
|
PDX Corporate Center East |
|
4 |
|
(d) |
|
|
7,126 |
|
|
|
21,303 |
|
|
|
352 |
|
|
|
7,126 |
|
|
|
21,655 |
|
|
|
28,781 |
|
|
|
(1,743 |
) |
|
2014 |
|
PDX Corporate Center North Phase II |
|
4 |
|
(d)(e) |
|
|
10,293 |
|
|
|
25,461 |
|
|
|
2,155 |
|
|
|
10,293 |
|
|
|
27,616 |
|
|
|
37,909 |
|
|
|
(4,266 |
) |
|
2008, 2014 |
|
Portland Northwest Corporate Park |
|
10 |
|
|
|
|
13,666 |
|
|
|
40,999 |
|
|
|
1,068 |
|
|
|
13,666 |
|
|
|
42,067 |
|
|
|
55,733 |
|
|
|
(2,171 |
) |
|
2015 |
|
Southshore Corporate Center |
|
3 |
|
(d) |
|
|
9,480 |
|
|
|
24,173 |
|
|
|
11,154 |
|
|
|
8,143 |
|
|
|
36,664 |
|
|
|
44,807 |
|
|
|
(6,029 |
) |
|
2006, 2014, 2015 |
|
Portland, Oregon |
|
28 |
|
|
|
|
49,393 |
|
|
|
153,825 |
|
|
|
15,565 |
|
|
|
48,056 |
|
|
|
170,727 |
|
|
|
218,783 |
|
|
|
(21,400 |
) |
|
|
|
|
|
|
|
|
|
|
|
|
|
|
|
|
|
|
|
|
|
|
|
|
|
|
|
|
|
|
|
|
|
|
|
|
|
|
|
Reno, Nevada |
|
|
|
|
|
|
|
|
|
|
|
|
|
|
|
|
|
|
|
|
|
|
|
|
|
|
|
|
|
|
|
|
|
|
|
Damonte Ranch Distribution Center |
|
3 |
|
(d) |
|
|
8,764 |
|
|
|
36,766 |
|
|
|
1,317 |
|
|
|
8,764 |
|
|
|
38,083 |
|
|
|
46,847 |
|
|
|
(6,238 |
) |
|
2012, 2014 |
|
Golden Valley Distribution Center |
|
1 |
|
|
|
|
940 |
|
|
|
13,686 |
|
|
|
4,237 |
|
|
|
2,415 |
|
|
|
16,448 |
|
|
|
18,863 |
|
|
|
(5,720 |
) |
|
2005 |
|
Reno Aircenter |
|
1 |
|
|
|
|
544 |
|
|
|
12,292 |
|
|
|
1,686 |
|
|
|
544 |
|
|
|
13,978 |
|
|
|
14,522 |
|
|
|
(571 |
) |
|
2015 |
|
RNO Cargo Center 10_11 |
|
2 |
|
|
|
|
- |
|
|
|
4,265 |
|
|
|
405 |
|
|
|
- |
|
|
|
4,670 |
|
|
|
4,670 |
|
|
|
(1,658 |
) |
|
2011 |
|
Sage Point Business Park |
|
1 |
|
|
|
|
1,705 |
|
|
|
6,821 |
|
|
|
457 |
|
|
|
1,705 |
|
|
|
7,278 |
|
|
|
8,983 |
|
|
|
(368 |
) |
|
2015 |
|
Stead Distribution Center |
|
1 |
|
(d) |
|
|
1,046 |
|
|
|
19,330 |
|
|
|
607 |
|
|
|
1,046 |
|
|
|
19,937 |
|
|
|
20,983 |
|
|
|
(931 |
) |
|
2015 |
|
Tahoe-Reno Industrial Center |
|
3 |
|
(d) |
|
|
6,705 |
|
|
|
30,381 |
|
|
|
59,889 |
|
|
|
6,704 |
|
|
|
90,271 |
|
|
|
96,975 |
|
|
|
(8,571 |
) |
|
2007, 2015 |
|
Vista Industrial Park |
|
6 |
|
(d) |
|
|
5,923 |
|
|
|
26,807 |
|
|
|
10,940 |
|
|
|
5,923 |
|
|
|
37,747 |
|
|
|
43,670 |
|
|
|
(20,665 |
) |
|
1994, 2001 |
|
Reno, Nevada |
|
18 |
|
|
|
|
25,627 |
|
|
|
150,348 |
|
|
|
79,538 |
|
|
|
27,101 |
|
|
|
228,412 |
|
|
|
255,513 |
|
|
|
(44,722 |
) |
|
|
|
|
|
|
|
|
|
|
|
|
|
|
|
|
|
|
|
|
|
|
|
|
|
|
|
|
|
|
|
|
|
|
|
|
|
|
|
San Antonio, Texas |
|
|
|
|
|
|
|
|
|
|
|
|
|
|
|
|
|
|
|
|
|
|
|
|
|
|
|
|
|
|
|
|
|
|
|
Coliseum Distribution Center |
|
2 |
|
(d) |
|
|
1,607 |
|
|
|
6,548 |
|
|
|
94 |
|
|
|
1,607 |
|
|
|
6,642 |
|
|
|
8,249 |
|
|
|
(565 |
) |
|
2014 |
|
Cornerstone Distribution Center |
|
1 |
|
|
|
|
2,173 |
|
|
|
- |
|
|
|
14,823 |
|
|
|
2,386 |
|
|
|
14,610 |
|
|
|
16,996 |
|
|
|
(191 |
) |
|
2016 |
|
Director Drive Distribution Center |
|
2 |
|
|
|
|
1,271 |
|
|
|
5,455 |
|
|
|
299 |
|
|
|
1,271 |
|
|
|
5,754 |
|
|
|
7,025 |
|
|
|
(1,268 |
) |
|
2012 |
|
Downtown Distribution Center |
|
1 |
|
|
|
|
579 |
|
|
|
2,347 |
|
|
|
- |
|
|
|
579 |
|
|
|
2,347 |
|
|
|
2,926 |
|
|
|
(206 |
) |
|
2014 |
|
Eisenhauer Distribution Center |
|
5 |
|
(d) |
|
|
5,042 |
|
|
|
21,383 |
|
|
|
1,592 |
|
|
|
5,042 |
|
|
|
22,975 |
|
|
|
28,017 |
|
|
|
(3,625 |
) |
|
2012, 2014 |
|
Interchange East Distribution Center |
|
1 |
|
|
|
|
1,496 |
|
|
|
6,535 |
|
|
|
234 |
|
|
|
1,496 |
|
|
|
6,769 |
|
|
|
8,265 |
|
|
|
(1,872 |
) |
|
2012 |
|
Macro Distribution Center |
|
4 |
|
|
|
|
2,535 |
|
|
|
12,395 |
|
|
|
4,887 |
|
|
|
2,535 |
|
|
|
17,282 |
|
|
|
19,817 |
|
|
|
(6,481 |
) |
|
2002, 2014 |
|
Perrin Creek Corporate Center |
|
10 |
|
(d) |
|
|
9,770 |
|
|
|
40,193 |
|
|
|
1,526 |
|
|
|
9,770 |
|
|
|
41,719 |
|
|
|
51,489 |
|
|
|
(5,552 |
) |
|
2012, 2014 |
|
Rittiman East Industrial Park |
|
2 |
|
|
|
|
4,848 |
|
|
|
19,223 |
|
|
|
3,292 |
|
|
|
4,848 |
|
|
|
22,515 |
|
|
|
27,363 |
|
|
|
(8,173 |
) |
|
2006 |
|
San Antonio Distribution Center II |
|
3 |
|
|
|
|
885 |
|
|
|
- |
|
|
|
7,893 |
|
|
|
885 |
|
|
|
7,893 |
|
|
|
8,778 |
|
|
|
(4,834 |
) |
|
1994 |
|
San Antonio Distribution Center III |
|
3 |
|
(d) |
|
|
3,154 |
|
|
|
12,876 |
|
|
|
211 |
|
|
|
3,154 |
|
|
|
13,087 |
|
|
|
16,241 |
|
|
|
(1,526 |
) |
|
2012, 2014 |
|
Tri-County Distribution Center |
|
4 |
|
(d) |
|
|
6,888 |
|
|
|
27,718 |
|
|
|
2,269 |
|
|
|
6,889 |
|
|
|
29,986 |
|
|
|
36,875 |
|
|
|
(5,729 |
) |
|
2007, 2014 |
|
San Antonio, Texas |
|
38 |
|
|
|
|
40,248 |
|
|
|
154,673 |
|
|
|
37,120 |
|
|
|
40,462 |
|
|
|
191,579 |
|
|
|
232,041 |
|
|
|
(40,022 |
) |
|
|
|
|
|
|
|
|
|
|
|
|
|
|
|
|
|
|
|
|
|
|
|
|
|
|
|
|
|
|
|
|
|
|
|
|
|
|
|
San Francisco Bay Area, California |
|
|
|
|
|
|
|
|
|
|
|
|
|
|
|
|
|
|
|
|
|
|
|
|
|
|
|
|
|
|
|
|
|
|
|
Acer Distribution Center |
|
1 |
|
(d) |
|
|
3,368 |
|
|
|
15,139 |
|
|
|
277 |
|
|
|
3,368 |
|
|
|
15,416 |
|
|
|
18,784 |
|
|
|
(3,777 |
) |
|
2011 |
|
Alvarado Business Center |
|
10 |
|
|
|
|
20,739 |
|
|
|
62,595 |
|
|
|
7,995 |
|
|
|
20,739 |
|
|
|
70,590 |
|
|
|
91,329 |
|
|
|
(27,825 |
) |
|
2005 |
105
PROLOGIS, INC. AND PROLOGIS, L.P.
SCHEDULE III – REAL ESTATE AND ACCUMULATED DEPRECIATION
DECEMBER 31, 2016
(In thousands of U.S. dollars, as applicable)
|
|
|
|
|
|
|
Initial Cost to Prologis |
|
|
Costs Capitalized |
|
|
Gross Amounts at Which Carried at December 31, 2016 |
|
|
|
|
|
|
|
|||||||||||||||
|
Description |
|
No. of Bldgs. |
|
Encum- brances |
|
Land |
|
|
Building & Improvements |
|
|
Subsequent to Acquisition |
|
|
Land |
|
|
Building & Improvements |
|
|
Total (a,b) |
|
|
Accumulated Depreciation (c) |
|
|
Date of Construction/ Acquisition |
|||||||
|
Bayshore Distribution Center |
|
1 |
|
|
|
|
6,450 |
|
|
|
15,049 |
|
|
|
2,696 |
|
|
|
6,450 |
|
|
|
17,745 |
|
|
|
24,195 |
|
|
|
(4,679 |
) |
|
2011 |
|
Bayside Corporate Center |
|
7 |
|
|
|
|
4,365 |
|
|
|
- |
|
|
|
23,031 |
|
|
|
4,365 |
|
|
|
23,031 |
|
|
|
27,396 |
|
|
|
(14,496 |
) |
|
1995, 1996 |
|
Bayside Plaza I |
|
12 |
|
|
|
|
5,212 |
|
|
|
18,008 |
|
|
|
9,688 |
|
|
|
5,216 |
|
|
|
27,692 |
|
|
|
32,908 |
|
|
|
(20,122 |
) |
|
1993 |
|
Bayside Plaza II |
|
2 |
|
|
|
|
634 |
|
|
|
- |
|
|
|
3,931 |
|
|
|
634 |
|
|
|
3,931 |
|
|
|
4,565 |
|
|
|
(2,655 |
) |
|
1994 |
|
Boyce Distribution Center |
|
2 |
|
|
|
|
21,719 |
|
|
|
- |
|
|
|
35,182 |
|
|
|
22,360 |
|
|
|
34,541 |
|
|
|
56,901 |
|
|
|
(447 |
) |
|
2016 |
|
Brennan Distribution Center |
|
1 |
|
|
|
|
1,912 |
|
|
|
7,553 |
|
|
|
125 |
|
|
|
1,912 |
|
|
|
7,678 |
|
|
|
9,590 |
|
|
|
(1,842 |
) |
|
2011 |
|
Component Drive Industrial Portfolio |
|
3 |
|
|
|
|
2,829 |
|
|
|
13,532 |
|
|
|
785 |
|
|
|
2,829 |
|
|
|
14,317 |
|
|
|
17,146 |
|
|
|
(3,489 |
) |
|
2011 |
|
Cypress |
|
1 |
|
|
|
|
1,065 |
|
|
|
5,103 |
|
|
|
252 |
|
|
|
1,065 |
|
|
|
5,355 |
|
|
|
6,420 |
|
|
|
(1,275 |
) |
|
2011 |
|
Dado Distribution Center |
|
1 |
|
|
|
|
2,194 |
|
|
|
11,079 |
|
|
|
283 |
|
|
|
2,194 |
|
|
|
11,362 |
|
|
|
13,556 |
|
|
|
(2,900 |
) |
|
2011 |
|
Doolittle Distribution Center |
|
1 |
|
|
|
|
2,843 |
|
|
|
18,849 |
|
|
|
1,672 |
|
|
|
2,843 |
|
|
|
20,521 |
|
|
|
23,364 |
|
|
|
(4,272 |
) |
|
2011 |
|
Dowe Industrial Center |
|
2 |
|
(d) |
|
|
5,884 |
|
|
|
20,400 |
|
|
|
912 |
|
|
|
5,884 |
|
|
|
21,312 |
|
|
|
27,196 |
|
|
|
(5,320 |
) |
|
2011 |
|
Dublin Industrial Portfolio |
|
1 |
|
|
|
|
3,241 |
|
|
|
15,951 |
|
|
|
1,071 |
|
|
|
3,241 |
|
|
|
17,022 |
|
|
|
20,263 |
|
|
|
(3,393 |
) |
|
2011 |
|
East Bay Doolittle |
|
1 |
|
|
|
|
4,015 |
|
|
|
15,988 |
|
|
|
1,794 |
|
|
|
4,015 |
|
|
|
17,782 |
|
|
|
21,797 |
|
|
|
(4,765 |
) |
|
2011 |
|
East Grand Airfreight |
|
10 |
|
|
|
|
43,310 |
|
|
|
43,350 |
|
|
|
7,435 |
|
|
|
43,310 |
|
|
|
50,785 |
|
|
|
94,095 |
|
|
|
(5,017 |
) |
|
2011, 2015, 2016 |
|
Edgewater Industrial Center |
|
1 |
|
|
|
|
6,630 |
|
|
|
31,153 |
|
|
|
3,340 |
|
|
|
6,630 |
|
|
|
34,493 |
|
|
|
41,123 |
|
|
|
(8,615 |
) |
|
2011 |
|
Eigenbrodt Way Distribution Center |
|
1 |
|
|
|
|
393 |
|
|
|
2,228 |
|
|
|
694 |
|
|
|
393 |
|
|
|
2,922 |
|
|
|
3,315 |
|
|
|
(2,266 |
) |
|
1993 |
|
Gateway Corporate Center |
|
10 |
|
|
|
|
6,736 |
|
|
|
24,747 |
|
|
|
11,655 |
|
|
|
6,744 |
|
|
|
36,394 |
|
|
|
43,138 |
|
|
|
(26,840 |
) |
|
1993 |
|
Hayward Commerce Center |
|
4 |
|
|
|
|
1,933 |
|
|
|
10,955 |
|
|
|
3,961 |
|
|
|
1,933 |
|
|
|
14,916 |
|
|
|
16,849 |
|
|
|
(11,363 |
) |
|
1993 |
|
Hayward Commerce Park |
|
2 |
|
|
|
|
7,131 |
|
|
|
10,519 |
|
|
|
763 |
|
|
|
7,131 |
|
|
|
11,282 |
|
|
|
18,413 |
|
|
|
(1,321 |
) |
|
2014 |
|
Hayward Distribution Center |
|
2 |
|
|
|
|
831 |
|
|
|
5,510 |
|
|
|
3,554 |
|
|
|
1,038 |
|
|
|
8,857 |
|
|
|
9,895 |
|
|
|
(7,004 |
) |
|
1993 |
|
Hayward Industrial Center |
|
20 |
|
|
|
|
13,535 |
|
|
|
48,573 |
|
|
|
13,659 |
|
|
|
13,535 |
|
|
|
62,232 |
|
|
|
75,767 |
|
|
|
(28,586 |
) |
|
1993, 2015 |
|
Junction Industrial Park |
|
4 |
|
|
|
|
7,658 |
|
|
|
39,106 |
|
|
|
2,156 |
|
|
|
7,658 |
|
|
|
41,262 |
|
|
|
48,920 |
|
|
|
(8,288 |
) |
|
2011 |
|
Laurelwood Drive |
|
3 |
|
|
|
|
18,709 |
|
|
|
34,925 |
|
|
|
1,098 |
|
|
|
18,709 |
|
|
|
36,023 |
|
|
|
54,732 |
|
|
|
(4,197 |
) |
|
2011, 2015 |
|
Lawrence SSF |
|
1 |
|
|
|
|
2,189 |
|
|
|
7,498 |
|
|
|
299 |
|
|
|
2,189 |
|
|
|
7,797 |
|
|
|
9,986 |
|
|
|
(1,813 |
) |
|
2011 |
|
Livermore Distribution Center |
|
4 |
|
|
|
|
8,992 |
|
|
|
26,976 |
|
|
|
3,841 |
|
|
|
8,992 |
|
|
|
30,817 |
|
|
|
39,809 |
|
|
|
(12,003 |
) |
|
2005 |
|
Martin-Scott Industrial Portfolio |
|
2 |
|
|
|
|
3,546 |
|
|
|
9,717 |
|
|
|
498 |
|
|
|
3,546 |
|
|
|
10,215 |
|
|
|
13,761 |
|
|
|
(2,468 |
) |
|
2011 |
|
Oakland Industrial Center |
|
3 |
|
|
|
|
8,234 |
|
|
|
24,704 |
|
|
|
2,650 |
|
|
|
8,235 |
|
|
|
27,353 |
|
|
|
35,588 |
|
|
|
(10,629 |
) |
|
2005 |
|
Overlook Distribution Center |
|
1 |
|
|
|
|
1,573 |
|
|
|
8,915 |
|
|
|
2,576 |
|
|
|
1,573 |
|
|
|
11,491 |
|
|
|
13,064 |
|
|
|
(5,981 |
) |
|
1999 |
|
Pacific Business Center |
|
2 |
|
|
|
|
6,075 |
|
|
|
26,260 |
|
|
|
4,153 |
|
|
|
6,075 |
|
|
|
30,413 |
|
|
|
36,488 |
|
|
|
(7,034 |
) |
|
2011 |
|
Pacific Commons Industrial Center |
|
5 |
|
|
|
|
25,784 |
|
|
|
77,594 |
|
|
|
2,350 |
|
|
|
25,805 |
|
|
|
79,923 |
|
|
|
105,728 |
|
|
|
(30,853 |
) |
|
2005 |
|
Pacific Industrial Center |
|
6 |
|
|
|
|
21,675 |
|
|
|
65,083 |
|
|
|
5,055 |
|
|
|
21,675 |
|
|
|
70,138 |
|
|
|
91,813 |
|
|
|
(27,280 |
) |
|
2005 |
|
San Francisco Industrial Park |
|
4 |
|
|
|
|
35,017 |
|
|
|
15,007 |
|
|
|
81 |
|
|
|
35,017 |
|
|
|
15,088 |
|
|
|
50,105 |
|
|
|
(2,641 |
) |
|
2015 |
|
San Leandro Distribution Center |
|
9 |
|
|
|
|
28,264 |
|
|
|
44,507 |
|
|
|
5,680 |
|
|
|
28,265 |
|
|
|
50,186 |
|
|
|
78,451 |
|
|
|
(11,452 |
) |
|
1993, 2015 |
|
Shoreline Business Center |
|
8 |
|
|
|
|
4,328 |
|
|
|
16,101 |
|
|
|
7,029 |
|
|
|
4,328 |
|
|
|
23,130 |
|
|
|
27,458 |
|
|
|
(16,550 |
) |
|
1993 |
|
South Bay Brokaw |
|
3 |
|
|
|
|
4,014 |
|
|
|
23,296 |
|
|
|
1,819 |
|
|
|
4,014 |
|
|
|
25,115 |
|
|
|
29,129 |
|
|
|
(5,145 |
) |
|
2011 |
|
South Bay Junction |
|
2 |
|
|
|
|
3,662 |
|
|
|
21,120 |
|
|
|
1,891 |
|
|
|
3,662 |
|
|
|
23,011 |
|
|
|
26,673 |
|
|
|
(4,702 |
) |
|
2011 |
|
South Bay Lundy |
|
2 |
|
|
|
|
6,500 |
|
|
|
33,642 |
|
|
|
2,691 |
|
|
|
6,500 |
|
|
|
36,333 |
|
|
|
42,833 |
|
|
|
(7,830 |
) |
|
2011 |
|
Spinnaker Business Center |
|
12 |
|
|
|
|
7,043 |
|
|
|
25,220 |
|
|
|
13,120 |
|
|
|
7,043 |
|
|
|
38,340 |
|
|
|
45,383 |
|
|
|
(27,323 |
) |
|
1993 |
|
Thornton Business Center |
|
4 |
|
|
|
|
2,047 |
|
|
|
11,706 |
|
|
|
4,822 |
|
|
|
2,066 |
|
|
|
16,509 |
|
|
|
18,575 |
|
|
|
(11,978 |
) |
|
1993 |
|
TriPoint Business Park |
|
4 |
|
|
|
|
9,057 |
|
|
|
23,727 |
|
|
|
4,874 |
|
|
|
9,057 |
|
|
|
28,601 |
|
|
|
37,658 |
|
|
|
(5,468 |
) |
|
2011 |
|
Utah Airfreight |
|
1 |
|
|
|
|
10,657 |
|
|
|
42,842 |
|
|
|
2,806 |
|
|
|
10,657 |
|
|
|
45,648 |
|
|
|
56,305 |
|
|
|
(9,147 |
) |
|
2011 |
|
Wiegman Road |
|
1 |
|
|
|
|
2,285 |
|
|
|
12,531 |
|
|
|
1,255 |
|
|
|
2,285 |
|
|
|
13,786 |
|
|
|
16,071 |
|
|
|
(2,320 |
) |
|
2011 |
|
Yosemite Drive |
|
10 |
|
|
|
|
31,304 |
|
|
|
65,674 |
|
|
|
295 |
|
|
|
31,304 |
|
|
|
65,969 |
|
|
|
97,273 |
|
|
|
(4,245 |
) |
|
2011, 2015 |
|
Zanker-Charcot Industrial Center |
|
5 |
|
|
|
|
4,867 |
|
|
|
28,750 |
|
|
|
2,224 |
|
|
|
4,867 |
|
|
|
30,974 |
|
|
|
35,841 |
|
|
|
(6,192 |
) |
|
2011 |
|
San Francisco Bay Area, California |
|
192 |
|
|
|
|
420,449 |
|
|
|
1,081,182 |
|
|
|
208,018 |
|
|
|
421,351 |
|
|
|
1,288,298 |
|
|
|
1,709,649 |
|
|
|
(417,808 |
) |
|
|
|
|
|
|
|
|
|
|
|
|
|
|
|
|
|
|
|
|
|
|
|
|
|
|
|
|
|
|
|
|
|
|
|
|
|
|
|
Savannah, Georgia |
|
|
|
|
|
|
|
|
|
|
|
|
|
|
|
|
|
|
|
|
|
|
|
|
|
|
|
|
|
|
|
|
|
|
|
Morgan Business Center |
|
1 |
|
|
|
|
2,161 |
|
|
|
14,680 |
|
|
|
1,260 |
|
|
|
2,161 |
|
|
|
15,940 |
|
|
|
18,101 |
|
|
|
(2,794 |
) |
|
2011 |
|
Savannah, Georgia |
|
1 |
|
|
|
|
2,161 |
|
|
|
14,680 |
|
|
|
1,260 |
|
|
|
2,161 |
|
|
|
15,940 |
|
|
|
18,101 |
|
|
|
(2,794 |
) |
|
|
|
|
|
|
|
|
|
|
|
|
|
|
|
|
|
|
|
|
|
|
|
|
|
|
|
|
|
|
|
|
|
|
|
|
|
|
|
Seattle, Washington |
|
|
|
|
|
|
|
|
|
|
|
|
|
|
|
|
|
|
|
|
|
|
|
|
|
|
|
|
|
|
|
|
|
|
|
Auburn Distribution Center |
|
1 |
|
|
|
|
2,608 |
|
|
|
5,742 |
|
|
|
33 |
|
|
|
2,608 |
|
|
|
5,775 |
|
|
|
8,383 |
|
|
|
(233 |
) |
|
2015 |
|
East Valley Warehouse |
|
1 |
|
(d)(e) |
|
|
10,472 |
|
|
|
57,825 |
|
|
|
1,012 |
|
|
|
10,472 |
|
|
|
58,837 |
|
|
|
69,309 |
|
|
|
(10,563 |
) |
|
2011 |
|
Fife Distribution Center |
|
1 |
|
|
|
|
3,245 |
|
|
|
- |
|
|
|
13,811 |
|
|
|
3,588 |
|
|
|
13,468 |
|
|
|
17,056 |
|
|
|
(1,295 |
) |
|
2013 |
|
Harvest Business Park |
|
3 |
|
|
|
|
3,541 |
|
|
|
18,827 |
|
|
|
1,002 |
|
|
|
3,541 |
|
|
|
19,829 |
|
|
|
23,370 |
|
|
|
(3,998 |
) |
|
2011 |
|
Interurban Distribution Center |
|
1 |
|
(d) |
|
|
7,233 |
|
|
|
13,958 |
|
|
|
78 |
|
|
|
7,233 |
|
|
|
14,036 |
|
|
|
21,269 |
|
|
|
(1,532 |
) |
|
2015 |
|
Kent Centre Corporate Park |
|
4 |
|
|
|
|
5,397 |
|
|
|
21,599 |
|
|
|
1,170 |
|
|
|
5,397 |
|
|
|
22,769 |
|
|
|
28,166 |
|
|
|
(4,519 |
) |
|
2011 |
|
Kent Corporate Center |
|
1 |
|
|
|
|
12,616 |
|
|
|
8,368 |
|
|
|
842 |
|
|
|
12,616 |
|
|
|
9,210 |
|
|
|
21,826 |
|
|
|
(539 |
) |
|
2015 |
|
Kent-Northwest Corporate Park |
|
18 |
|
|
|
|
71,768 |
|
|
|
139,886 |
|
|
|
3,069 |
|
|
|
71,768 |
|
|
|
142,955 |
|
|
|
214,723 |
|
|
|
(9,422 |
) |
|
2015 |
|
Kingsport Industrial Park |
|
7 |
|
|
|
|
16,605 |
|
|
|
48,942 |
|
|
|
3,139 |
|
|
|
16,800 |
|
|
|
51,886 |
|
|
|
68,686 |
|
|
|
(13,669 |
) |
|
2011 |
|
Northwest Distribution Center |
|
3 |
|
|
|
|
5,114 |
|
|
|
24,090 |
|
|
|
1,994 |
|
|
|
5,114 |
|
|
|
26,084 |
|
|
|
31,198 |
|
|
|
(5,403 |
) |
|
2011 |
|
Occidental Distribution Center |
|
1 |
|
|
|
|
1,770 |
|
|
|
1,960 |
|
|
|
471 |
|
|
|
1,770 |
|
|
|
2,431 |
|
|
|
4,201 |
|
|
|
(100 |
) |
|
2015 |
|
Portside Distribution Center |
|
5 |
|
|
|
|
111,175 |
|
|
|
71,376 |
|
|
|
2,274 |
|
|
|
112,575 |
|
|
|
72,250 |
|
|
|
184,825 |
|
|
|
(3,896 |
) |
|
2015, 2016 |
|
ProLogis Park SeaTac |
|
2 |
|
(d) |
|
|
12,230 |
|
|
|
14,170 |
|
|
|
3,752 |
|
|
|
12,457 |
|
|
|
17,695 |
|
|
|
30,152 |
|
|
|
(4,423 |
) |
|
2008 |
|
Puget Sound Airfreight |
|
1 |
|
|
|
|
1,408 |
|
|
|
4,201 |
|
|
|
450 |
|
|
|
1,408 |
|
|
|
4,651 |
|
|
|
6,059 |
|
|
|
(943 |
) |
|
2011 |
|
Renton Northwest Corporate Park |
|
4 |
|
|
|
|
5,102 |
|
|
|
17,946 |
|
|
|
1,304 |
|
|
|
5,102 |
|
|
|
19,250 |
|
|
|
24,352 |
|
|
|
(4,479 |
) |
|
2011 |
|
SEA Cargo Center North |
|
1 |
|
|
|
|
- |
|
|
|
10,279 |
|
|
|
63 |
|
|
|
- |
|
|
|
10,342 |
|
|
|
10,342 |
|
|
|
(8,842 |
) |
|
2011 |
|
Sumner Landing |
|
1 |
|
(e) |
|
|
10,332 |
|
|
|
32,545 |
|
|
|
894 |
|
|
|
10,332 |
|
|
|
33,439 |
|
|
|
43,771 |
|
|
|
(5,359 |
) |
|
2011 |
|
Van Doren's Distribution Center |
|
1 |
|
(d) |
|
|
3,166 |
|
|
|
7,339 |
|
|
|
7 |
|
|
|
3,166 |
|
|
|
7,346 |
|
|
|
10,512 |
|
|
|
(590 |
) |
|
2014 |
|
Seattle, Washington |
|
56 |
|
|
|
|
283,782 |
|
|
|
499,053 |
|
|
|
35,365 |
|
|
|
285,947 |
|
|
|
532,253 |
|
|
|
818,200 |
|
|
|
(79,805 |
) |
|
|
106
PROLOGIS, INC. AND PROLOGIS, L.P.
SCHEDULE III – REAL ESTATE AND ACCUMULATED DEPRECIATION
DECEMBER 31, 2016
(In thousands of U.S. dollars, as applicable)
|
|
|
|
|
|
|
Initial Cost to Prologis |
|
|
Costs Capitalized |
|
|
Gross Amounts at Which Carried at December 31, 2016 |
|
|
|
|
|
|
|
|||||||||||||||
|
Description |
|
No. of Bldgs. |
|
Encum- brances |
|
Land |
|
|
Building & Improvements |
|
|
Subsequent to Acquisition |
|
|
Land |
|
|
Building & Improvements |
|
|
Total (a,b) |
|
|
Accumulated Depreciation (c) |
|
|
Date of Construction/ Acquisition |
|||||||
|
South Florida |
|
|
|
|
|
|
|
|
|
|
|
|
|
|
|
|
|
|
|
|
|
|
|
|
|
|
|
|
|
|
|
|
|
|
|
Airport West Distribution Center |
|
2 |
|
(d) |
|
|
1,253 |
|
|
|
3,825 |
|
|
|
4,116 |
|
|
|
1,974 |
|
|
|
7,220 |
|
|
|
9,194 |
|
|
|
(4,260 |
) |
|
1995, 1998 |
|
Beacon Centre |
|
18 |
|
|
|
|
37,998 |
|
|
|
196,004 |
|
|
|
15,561 |
|
|
|
37,998 |
|
|
|
211,565 |
|
|
|
249,563 |
|
|
|
(40,076 |
) |
|
2011 |
|
Beacon Industrial Park |
|
9 |
|
(d) |
|
|
23,511 |
|
|
|
75,424 |
|
|
|
4,812 |
|
|
|
23,511 |
|
|
|
80,236 |
|
|
|
103,747 |
|
|
|
(14,551 |
) |
|
2011, 2015 |
|
Beacon Lakes |
|
5 |
|
|
|
|
32,911 |
|
|
|
24,691 |
|
|
|
39,333 |
|
|
|
32,658 |
|
|
|
64,277 |
|
|
|
96,935 |
|
|
|
(3,646 |
) |
|
2012, 2014, 2015 |
|
Blue Lagoon Business Park |
|
2 |
|
(d) |
|
|
9,189 |
|
|
|
29,451 |
|
|
|
2,429 |
|
|
|
9,189 |
|
|
|
31,880 |
|
|
|
41,069 |
|
|
|
(6,369 |
) |
|
2011 |
|
CenterPort Distribution Center |
|
5 |
|
(d) |
|
|
8,802 |
|
|
|
22,504 |
|
|
|
3,958 |
|
|
|
8,922 |
|
|
|
26,342 |
|
|
|
35,264 |
|
|
|
(10,623 |
) |
|
1999, 2012 |
|
Commercial Logistics Center |
|
1 |
|
|
|
|
7,938 |
|
|
|
11,083 |
|
|
|
632 |
|
|
|
7,938 |
|
|
|
11,715 |
|
|
|
19,653 |
|
|
|
(920 |
) |
|
2015 |
|
Congress Distribution Center |
|
1 |
|
(d) |
|
|
2,266 |
|
|
|
5,639 |
|
|
|
381 |
|
|
|
2,266 |
|
|
|
6,020 |
|
|
|
8,286 |
|
|
|
(375 |
) |
|
2015 |
|
Dolphin Distribution Center |
|
1 |
|
|
|
|
2,716 |
|
|
|
7,364 |
|
|
|
858 |
|
|
|
2,716 |
|
|
|
8,222 |
|
|
|
10,938 |
|
|
|
(2,263 |
) |
|
2011 |
|
Gateway Center |
|
1 |
|
(d) |
|
|
1,015 |
|
|
|
1,284 |
|
|
|
18 |
|
|
|
1,015 |
|
|
|
1,302 |
|
|
|
2,317 |
|
|
|
(91 |
) |
|
2015 |
|
Hollywood Park Distribution Center |
|
13 |
|
|
|
|
16,848 |
|
|
|
36,191 |
|
|
|
1,574 |
|
|
|
16,848 |
|
|
|
37,765 |
|
|
|
54,613 |
|
|
|
(2,597 |
) |
|
2015 |
|
International Corporate Park |
|
5 |
|
|
|
|
26,915 |
|
|
|
54,436 |
|
|
|
3,849 |
|
|
|
26,915 |
|
|
|
58,285 |
|
|
|
85,200 |
|
|
|
(6,376 |
) |
|
2010, 2015 |
|
Lyons Technology Park |
|
1 |
|
(d) |
|
|
1,988 |
|
|
|
3,651 |
|
|
|
32 |
|
|
|
1,988 |
|
|
|
3,683 |
|
|
|
5,671 |
|
|
|
(245 |
) |
|
2015 |
|
Magnolia Park Distribution Center |
|
1 |
|
(d) |
|
|
1,398 |
|
|
|
1,613 |
|
|
|
99 |
|
|
|
1,398 |
|
|
|
1,712 |
|
|
|
3,110 |
|
|
|
(108 |
) |
|
2015 |
|
Marlin Distribution Center |
|
1 |
|
|
|
|
1,844 |
|
|
|
6,603 |
|
|
|
449 |
|
|
|
1,844 |
|
|
|
7,052 |
|
|
|
8,896 |
|
|
|
(1,649 |
) |
|
2011 |
|
Miami Airport Business Center |
|
6 |
|
|
|
|
11,173 |
|
|
|
45,921 |
|
|
|
2,917 |
|
|
|
11,173 |
|
|
|
48,838 |
|
|
|
60,011 |
|
|
|
(10,456 |
) |
|
2011 |
|
North Andrews Distribution Center |
|
2 |
|
(d) |
|
|
11,327 |
|
|
|
22,330 |
|
|
|
562 |
|
|
|
11,327 |
|
|
|
22,892 |
|
|
|
34,219 |
|
|
|
(3,963 |
) |
|
1994, 2015 |
|
Pompano Beach Distribution Center |
|
3 |
|
|
|
|
11,035 |
|
|
|
15,136 |
|
|
|
3,879 |
|
|
|
11,035 |
|
|
|
19,015 |
|
|
|
30,050 |
|
|
|
(4,090 |
) |
|
2008 |
|
Pompano Center of Commerce |
|
5 |
|
|
|
|
5,171 |
|
|
|
13,930 |
|
|
|
580 |
|
|
|
5,171 |
|
|
|
14,510 |
|
|
|
19,681 |
|
|
|
(2,669 |
) |
|
2011 |
|
Port Lauderdale Distribution Center |
|
9 |
|
(d) |
|
|
40,927 |
|
|
|
73,128 |
|
|
|
11,407 |
|
|
|
42,235 |
|
|
|
83,227 |
|
|
|
125,462 |
|
|
|
(11,392 |
) |
|
1997, 2012, 2014, 2015 |
|
Port Lucie West Distribution Center |
|
2 |
|
(d) |
|
|
1,131 |
|
|
|
1,412 |
|
|
|
56 |
|
|
|
1,131 |
|
|
|
1,468 |
|
|
|
2,599 |
|
|
|
(122 |
) |
|
2015 |
|
ProLogis Park I-595 |
|
2 |
|
(d) |
|
|
1,998 |
|
|
|
11,326 |
|
|
|
1,098 |
|
|
|
1,999 |
|
|
|
12,423 |
|
|
|
14,422 |
|
|
|
(5,889 |
) |
|
2003 |
|
Prospect Park Distribution Center |
|
3 |
|
|
|
|
4,859 |
|
|
|
11,041 |
|
|
|
205 |
|
|
|
4,859 |
|
|
|
11,246 |
|
|
|
16,105 |
|
|
|
(764 |
) |
|
2015 |
|
Sawgrass International Park |
|
1 |
|
|
|
|
5,163 |
|
|
|
11,476 |
|
|
|
641 |
|
|
|
5,163 |
|
|
|
12,117 |
|
|
|
17,280 |
|
|
|
(565 |
) |
|
2015 |
|
Seneca Distribution Center |
|
3 |
|
|
|
|
16,357 |
|
|
|
46,738 |
|
|
|
327 |
|
|
|
16,357 |
|
|
|
47,065 |
|
|
|
63,422 |
|
|
|
(2,230 |
) |
|
2015 |
|
South Dade Commerce Center |
|
1 |
|
(d) |
|
|
1,791 |
|
|
|
147 |
|
|
|
22 |
|
|
|
1,791 |
|
|
|
169 |
|
|
|
1,960 |
|
|
|
(36 |
) |
|
2015 |
|
Sunshine Park Distribution Center |
|
1 |
|
|
|
|
2,822 |
|
|
|
4,857 |
|
|
|
35 |
|
|
|
2,822 |
|
|
|
4,892 |
|
|
|
7,714 |
|
|
|
(365 |
) |
|
2015 |
|
Tarpon Distribution Center |
|
1 |
|
|
|
|
1,847 |
|
|
|
6,451 |
|
|
|
337 |
|
|
|
1,847 |
|
|
|
6,788 |
|
|
|
8,635 |
|
|
|
(1,804 |
) |
|
2011 |
|
South Florida |
|
105 |
|
|
|
|
292,193 |
|
|
|
743,656 |
|
|
|
100,167 |
|
|
|
294,090 |
|
|
|
841,926 |
|
|
|
1,136,016 |
|
|
|
(138,494 |
) |
|
|
|
|
|
|
|
|
|
|
|
|
|
|
|
|
|
|
|
|
|
|
|
|
|
|
|
|
|
|
|
|
|
|
|
|
|
|
|
Southern California |
|
|
|
|
|
|
|
|
|
|
|
|
|
|
|
|
|
|
|
|
|
|
|
|
|
|
|
|
|
|
|
|
|
|
|
Activity Distribution Center |
|
4 |
|
|
|
|
10,820 |
|
|
|
27,410 |
|
|
|
421 |
|
|
|
10,820 |
|
|
|
27,831 |
|
|
|
38,651 |
|
|
|
(1,510 |
) |
|
2015 |
|
Anaheim Industrial Center |
|
12 |
|
|
|
|
31,086 |
|
|
|
57,836 |
|
|
|
4,114 |
|
|
|
31,086 |
|
|
|
61,950 |
|
|
|
93,036 |
|
|
|
(23,552 |
) |
|
2005 |
|
Anaheim Industrial Property |
|
1 |
|
|
|
|
5,096 |
|
|
|
10,816 |
|
|
|
71 |
|
|
|
5,096 |
|
|
|
10,887 |
|
|
|
15,983 |
|
|
|
(2,151 |
) |
|
2011 |
|
Arrow Industrial Park |
|
2 |
|
|
|
|
4,840 |
|
|
|
8,120 |
|
|
|
1,112 |
|
|
|
4,840 |
|
|
|
9,232 |
|
|
|
14,072 |
|
|
|
(2,029 |
) |
|
2012 |
|
Artesia Industrial Center |
|
26 |
|
(d) |
|
|
163,764 |
|
|
|
217,400 |
|
|
|
41,082 |
|
|
|
178,700 |
|
|
|
243,546 |
|
|
|
422,246 |
|
|
|
(38,492 |
) |
|
2011, 2015 |
|
Bell Ranch Distribution Center |
|
4 |
|
|
|
|
5,539 |
|
|
|
23,092 |
|
|
|
1,785 |
|
|
|
5,539 |
|
|
|
24,877 |
|
|
|
30,416 |
|
|
|
(5,635 |
) |
|
2011 |
|
Brea Industrial Center |
|
1 |
|
|
|
|
2,488 |
|
|
|
4,062 |
|
|
|
467 |
|
|
|
2,488 |
|
|
|
4,529 |
|
|
|
7,017 |
|
|
|
(888 |
) |
|
2012 |
|
California Commerce Center |
|
6 |
|
(d) |
|
|
30,127 |
|
|
|
52,094 |
|
|
|
4,781 |
|
|
|
30,127 |
|
|
|
56,875 |
|
|
|
87,002 |
|
|
|
(7,914 |
) |
|
2012, 2014, 2015 |
|
Carson Distribution Center |
|
2 |
|
(d) |
|
|
29,974 |
|
|
|
22,483 |
|
|
|
17,531 |
|
|
|
29,975 |
|
|
|
40,013 |
|
|
|
69,988 |
|
|
|
(3,568 |
) |
|
2011, 2015 |
|
Carson Industrial Center |
|
1 |
|
|
|
|
844 |
|
|
|
2,081 |
|
|
|
968 |
|
|
|
844 |
|
|
|
3,049 |
|
|
|
3,893 |
|
|
|
(747 |
) |
|
2011 |
|
Carson Town Center |
|
2 |
|
|
|
|
11,781 |
|
|
|
31,572 |
|
|
|
1,287 |
|
|
|
11,781 |
|
|
|
32,859 |
|
|
|
44,640 |
|
|
|
(5,899 |
) |
|
2011 |
|
CAT - Kaiser Commerce Center |
|
1 |
|
(e) |
|
|
4,971 |
|
|
|
- |
|
|
|
8,807 |
|
|
|
4,972 |
|
|
|
8,806 |
|
|
|
13,778 |
|
|
|
(328 |
) |
|
2015 |
|
Cedarpointe Industrial Park |
|
9 |
|
(d) |
|
|
56,349 |
|
|
|
105,792 |
|
|
|
1,518 |
|
|
|
56,349 |
|
|
|
107,310 |
|
|
|
163,659 |
|
|
|
(7,316 |
) |
|
2012, 2015 |
|
Chartwell Distribution Center |
|
3 |
|
|
|
|
55,803 |
|
|
|
77,135 |
|
|
|
4,679 |
|
|
|
55,803 |
|
|
|
81,814 |
|
|
|
137,617 |
|
|
|
(6,953 |
) |
|
2011, 2015 |
|
Chatsworth Distribution Center |
|
2 |
|
|
|
|
11,713 |
|
|
|
17,569 |
|
|
|
121 |
|
|
|
11,713 |
|
|
|
17,690 |
|
|
|
29,403 |
|
|
|
(1,159 |
) |
|
2015 |
|
Chino Industrial Center |
|
4 |
|
|
|
|
850 |
|
|
|
1,274 |
|
|
|
8,338 |
|
|
|
9,178 |
|
|
|
1,284 |
|
|
|
10,462 |
|
|
|
(1,161 |
) |
|
2012 |
|
Commerce Industrial Center |
|
1 |
|
|
|
|
11,345 |
|
|
|
17,653 |
|
|
|
2,415 |
|
|
|
11,345 |
|
|
|
20,068 |
|
|
|
31,413 |
|
|
|
(3,274 |
) |
|
2012 |
|
Crossroads Business Park |
|
9 |
|
(d) |
|
|
36,131 |
|
|
|
98,030 |
|
|
|
114,144 |
|
|
|
89,673 |
|
|
|
158,632 |
|
|
|
248,305 |
|
|
|
(44,682 |
) |
|
2005, 2010, 2014 |
|
Del Amo Industrial Center |
|
1 |
|
|
|
|
7,471 |
|
|
|
17,889 |
|
|
|
386 |
|
|
|
7,471 |
|
|
|
18,275 |
|
|
|
25,746 |
|
|
|
(4,291 |
) |
|
2011 |
|
Dominguez North Industrial Center |
|
6 |
|
(d) |
|
|
20,662 |
|
|
|
34,382 |
|
|
|
4,723 |
|
|
|
20,688 |
|
|
|
39,079 |
|
|
|
59,767 |
|
|
|
(9,587 |
) |
|
2007, 2012 |
|
Eaves Distribution Center |
|
3 |
|
|
|
|
13,914 |
|
|
|
31,041 |
|
|
|
2,748 |
|
|
|
13,914 |
|
|
|
33,789 |
|
|
|
47,703 |
|
|
|
(8,308 |
) |
|
2011 |
|
Foothill Business Center |
|
3 |
|
|
|
|
5,254 |
|
|
|
8,096 |
|
|
|
322 |
|
|
|
5,254 |
|
|
|
8,418 |
|
|
|
13,672 |
|
|
|
(1,437 |
) |
|
2012 |
|
Ford Distribution Center |
|
11 |
|
|
|
|
44,128 |
|
|
|
108,125 |
|
|
|
3,837 |
|
|
|
44,128 |
|
|
|
111,962 |
|
|
|
156,090 |
|
|
|
(22,488 |
) |
|
2011, 2015 |
|
Fordyce Distribution Center |
|
1 |
|
|
|
|
6,110 |
|
|
|
19,485 |
|
|
|
910 |
|
|
|
6,110 |
|
|
|
20,395 |
|
|
|
26,505 |
|
|
|
(5,266 |
) |
|
2011 |
|
Harris Business Center Alliance II |
|
9 |
|
|
|
|
13,134 |
|
|
|
66,195 |
|
|
|
3,076 |
|
|
|
13,134 |
|
|
|
69,271 |
|
|
|
82,405 |
|
|
|
(14,258 |
) |
|
2011 |
|
Haven Distribution Center |
|
4 |
|
(d) |
|
|
96,975 |
|
|
|
73,903 |
|
|
|
8,385 |
|
|
|
96,975 |
|
|
|
82,288 |
|
|
|
179,263 |
|
|
|
(18,460 |
) |
|
2008 |
|
Huntington Beach Distribution Center |
|
1 |
|
|
|
|
14,679 |
|
|
|
22,019 |
|
|
|
794 |
|
|
|
14,679 |
|
|
|
22,813 |
|
|
|
37,492 |
|
|
|
(981 |
) |
|
2015 |
|
Industry Distribution Center |
|
8 |
|
(e) |
|
|
54,170 |
|
|
|
99,434 |
|
|
|
8,623 |
|
|
|
54,170 |
|
|
|
108,057 |
|
|
|
162,227 |
|
|
|
(40,067 |
) |
|
2005, 2012 |
|
Inland Empire Distribution Center |
|
6 |
|
|
|
|
43,320 |
|
|
|
84,006 |
|
|
|
8,410 |
|
|
|
44,100 |
|
|
|
91,636 |
|
|
|
135,736 |
|
|
|
(26,974 |
) |
|
2005, 2012, 2015 |
|
Jack Northrup Distribution Center |
|
1 |
|
|
|
|
4,280 |
|
|
|
9,820 |
|
|
|
53 |
|
|
|
4,280 |
|
|
|
9,873 |
|
|
|
14,153 |
|
|
|
(493 |
) |
|
2015 |
|
Kaiser Distribution Center |
|
8 |
|
(d)(e) |
|
|
131,819 |
|
|
|
242,618 |
|
|
|
16,957 |
|
|
|
136,030 |
|
|
|
255,364 |
|
|
|
391,394 |
|
|
|
(92,994 |
) |
|
2005, 2008 |
|
LAX Cargo Center |
|
3 |
|
|
|
|
- |
|
|
|
19,217 |
|
|
|
379 |
|
|
|
- |
|
|
|
19,596 |
|
|
|
19,596 |
|
|
|
(7,520 |
) |
|
2011 |
|
Los Angeles Industrial Center |
|
2 |
|
|
|
|
3,777 |
|
|
|
7,015 |
|
|
|
378 |
|
|
|
3,777 |
|
|
|
7,393 |
|
|
|
11,170 |
|
|
|
(2,965 |
) |
|
2005 |
|
Main St Distribution Center |
|
1 |
|
|
|
|
13,058 |
|
|
|
20,370 |
|
|
|
853 |
|
|
|
13,058 |
|
|
|
21,223 |
|
|
|
34,281 |
|
|
|
(1,132 |
) |
|
2015 |
|
Meridian Park |
|
2 |
|
|
|
|
38,270 |
|
|
|
70,022 |
|
|
|
1,044 |
|
|
|
38,270 |
|
|
|
71,066 |
|
|
|
109,336 |
|
|
|
(9,381 |
) |
|
2008, 2015 |
|
Mid Counties Industrial Center |
|
18 |
|
(d) |
|
|
55,436 |
|
|
|
96,453 |
|
|
|
16,685 |
|
|
|
55,437 |
|
|
|
113,137 |
|
|
|
168,574 |
|
|
|
(43,364 |
) |
|
2005, 2006, 2010, 2012 |
|
Mill Street Distribution Center |
|
1 |
|
(d) |
|
|
1,825 |
|
|
|
4,306 |
|
|
|
(1 |
) |
|
|
1,825 |
|
|
|
4,305 |
|
|
|
6,130 |
|
|
|
(363 |
) |
|
2014 |
|
Mill Street Spec Distribution Center |
|
1 |
|
(d) |
|
|
15,691 |
|
|
|
36,550 |
|
|
|
188 |
|
|
|
15,691 |
|
|
|
36,738 |
|
|
|
52,429 |
|
|
|
(2,999 |
) |
|
2014 |
107
PROLOGIS, INC. AND PROLOGIS, L.P.
SCHEDULE III – REAL ESTATE AND ACCUMULATED DEPRECIATION
DECEMBER 31, 2016
(In thousands of U.S. dollars, as applicable)
|
|
|
|
|
|
|
|
|
Initial Cost to Prologis |
|
|
Costs Capitalized |
|
|
Gross Amounts at Which Carried at December 31, 2016 |
|
|
|
|
|
|
|
|||||||||||||||
|
Description |
|
No. of Bldgs. |
|
|
Encum- brances |
|
Land |
|
|
Building & Improvements |
|
|
Subsequent to Acquisition |
|
|
Land |
|
|
Building & Improvements |
|
|
Total (a,b) |
|
|
Accumulated Depreciation (c) |
|
|
Date of Construction/ Acquisition |
||||||||
|
Milliken Distribution Center |
|
1 |
|
|
|
|
|
18,831 |
|
|
|
30,811 |
|
|
|
232 |
|
|
|
18,831 |
|
|
|
31,043 |
|
|
|
49,874 |
|
|
|
(5,888 |
) |
|
2012 |
|
|
NDP - Los Angeles |
|
5 |
|
|
|
|
|
14,855 |
|
|
|
41,115 |
|
|
|
3,529 |
|
|
|
14,855 |
|
|
|
44,644 |
|
|
|
59,499 |
|
|
|
(10,837 |
) |
|
2011 |
|
|
Normandie Industrial Center |
|
1 |
|
|
|
|
|
12,297 |
|
|
|
14,957 |
|
|
|
1,989 |
|
|
|
12,297 |
|
|
|
16,946 |
|
|
|
29,243 |
|
|
|
(4,317 |
) |
|
2011 |
|
|
North County Distribution Center |
|
4 |
|
|
|
|
|
75,581 |
|
|
|
101,342 |
|
|
|
10,236 |
|
|
|
75,581 |
|
|
|
111,578 |
|
|
|
187,159 |
|
|
|
(17,449 |
) |
|
2011, 2012, 2015 |
|
|
Ontario Distribution Center |
|
1 |
|
|
|
|
|
18,823 |
|
|
|
29,524 |
|
|
|
482 |
|
|
|
18,823 |
|
|
|
30,006 |
|
|
|
48,829 |
|
|
|
(5,341 |
) |
|
2012 |
|
|
Orange Industrial Center |
|
2 |
|
|
|
|
|
19,296 |
|
|
|
9,514 |
|
|
|
706 |
|
|
|
4,157 |
|
|
|
25,359 |
|
|
|
29,516 |
|
|
|
(3,172 |
) |
|
2005, 2016 |
|
|
Pacific Business Center |
|
5 |
|
|
|
|
|
20,810 |
|
|
|
32,169 |
|
|
|
3,170 |
|
|
|
20,810 |
|
|
|
35,339 |
|
|
|
56,149 |
|
|
|
(6,205 |
) |
|
2012 |
|
|
Pomona Distribution Center |
|
1 |
|
|
(d) |
|
|
22,361 |
|
|
|
27,898 |
|
|
|
205 |
|
|
|
22,361 |
|
|
|
28,103 |
|
|
|
50,464 |
|
|
|
(2,519 |
) |
|
2015 |
|
|
ProLogis Park Ontario |
|
2 |
|
|
(d) |
|
|
25,499 |
|
|
|
47,366 |
|
|
|
1,283 |
|
|
|
25,499 |
|
|
|
48,649 |
|
|
|
74,148 |
|
|
|
(15,843 |
) |
|
2007 |
|
|
Rancho Cucamonga Distribution Center |
|
6 |
|
|
(d)(e) |
|
|
58,710 |
|
|
|
113,273 |
|
|
|
5,079 |
|
|
|
58,711 |
|
|
|
118,351 |
|
|
|
177,062 |
|
|
|
(34,842 |
) |
|
2005, 2015 |
|
|
Redlands Commerce Center |
|
1 |
|
|
(d) |
|
|
20,583 |
|
|
|
30,881 |
|
|
|
13 |
|
|
|
20,583 |
|
|
|
30,894 |
|
|
|
51,477 |
|
|
|
(2,552 |
) |
|
2014 |
|
|
Redlands Distribution Center |
|
12 |
|
|
(d) |
|
|
156,478 |
|
|
|
120,920 |
|
|
|
200,028 |
|
|
|
154,454 |
|
|
|
322,972 |
|
|
|
477,426 |
|
|
|
(32,938 |
) |
|
2006, 2007, 2012, 2013, 2014, 2015 |
|
|
Redondo Beach Distribution Center |
|
1 |
|
|
|
|
|
7,455 |
|
|
|
11,223 |
|
|
|
72 |
|
|
|
7,455 |
|
|
|
11,295 |
|
|
|
18,750 |
|
|
|
(934 |
) |
|
2015 |
|
|
Rialto Distribution Center |
|
5 |
|
|
(d) |
|
|
86,270 |
|
|
|
200,602 |
|
|
|
33,564 |
|
|
|
88,648 |
|
|
|
231,788 |
|
|
|
320,436 |
|
|
|
(30,989 |
) |
|
2012, 2014, 2015 |
|
|
Riverbluff Distribution Center |
|
1 |
|
|
(d) |
|
|
42,964 |
|
|
|
- |
|
|
|
33,014 |
|
|
|
42,964 |
|
|
|
33,014 |
|
|
|
75,978 |
|
|
|
(8,401 |
) |
|
2009 |
|
|
Santa Ana Distribution Center |
|
3 |
|
|
|
|
|
27,070 |
|
|
|
32,168 |
|
|
|
1,253 |
|
|
|
27,070 |
|
|
|
33,421 |
|
|
|
60,491 |
|
|
|
(4,699 |
) |
|
2005, 2015 |
|
|
Santa Fe Distribution Center |
|
1 |
|
|
|
|
|
12,163 |
|
|
|
9,927 |
|
|
|
84 |
|
|
|
12,163 |
|
|
|
10,011 |
|
|
|
22,174 |
|
|
|
(664 |
) |
|
2015 |
|
|
Slover Distribution Center |
|
4 |
|
|
(d) |
|
|
40,335 |
|
|
|
45,492 |
|
|
|
386 |
|
|
|
40,335 |
|
|
|
45,878 |
|
|
|
86,213 |
|
|
|
(2,319 |
) |
|
2015 |
|
|
South Bay Distribution Center |
|
4 |
|
|
(d) |
|
|
14,478 |
|
|
|
27,511 |
|
|
|
6,608 |
|
|
|
15,280 |
|
|
|
33,317 |
|
|
|
48,597 |
|
|
|
(12,633 |
) |
|
2005, 2007 |
|
|
South Bay Transport |
|
1 |
|
|
|
|
|
15,928 |
|
|
|
23,891 |
|
|
|
106 |
|
|
|
15,928 |
|
|
|
23,997 |
|
|
|
39,925 |
|
|
|
(630 |
) |
|
2015 |
|
|
Starboard Distribution Center |
|
1 |
|
|
|
|
|
18,763 |
|
|
|
53,824 |
|
|
|
386 |
|
|
|
18,763 |
|
|
|
54,210 |
|
|
|
72,973 |
|
|
|
(10,725 |
) |
|
2011 |
|
|
Terra Francesco |
|
1 |
|
|
|
|
|
11,196 |
|
|
|
- |
|
|
|
15,673 |
|
|
|
11,196 |
|
|
|
15,673 |
|
|
|
26,869 |
|
|
|
(582 |
) |
|
2012 |
|
|
Torrance Distribution Center |
|
1 |
|
|
|
|
|
25,730 |
|
|
|
40,414 |
|
|
|
1,134 |
|
|
|
25,730 |
|
|
|
41,548 |
|
|
|
67,278 |
|
|
|
(7,211 |
) |
|
2012 |
|
|
Transpark Inland Empire Distribution Center |
|
1 |
|
|
|
|
|
28,936 |
|
|
|
42,167 |
|
|
|
578 |
|
|
|
28,936 |
|
|
|
42,745 |
|
|
|
71,681 |
|
|
|
(3,339 |
) |
|
2014 |
|
|
Van Nuys Airport Industrial Center |
|
4 |
|
|
|
|
|
23,455 |
|
|
|
39,916 |
|
|
|
2,860 |
|
|
|
23,455 |
|
|
|
42,776 |
|
|
|
66,231 |
|
|
|
(8,225 |
) |
|
2011 |
|
|
Vernon Distribution Center |
|
14 |
|
|
|
|
|
23,998 |
|
|
|
44,529 |
|
|
|
4,788 |
|
|
|
24,000 |
|
|
|
49,315 |
|
|
|
73,315 |
|
|
|
(19,476 |
) |
|
2005 |
|
|
Vernon Industrial Center |
|
2 |
|
|
|
|
|
3,626 |
|
|
|
3,319 |
|
|
|
692 |
|
|
|
4,121 |
|
|
|
3,516 |
|
|
|
7,637 |
|
|
|
(2,993 |
) |
|
2011 |
|
|
Vista Distribution Center |
|
1 |
|
|
|
|
|
4,150 |
|
|
|
6,225 |
|
|
|
3,933 |
|
|
|
4,150 |
|
|
|
10,158 |
|
|
|
14,308 |
|
|
|
(3,274 |
) |
|
2012 |
|
|
Walnut Drive |
|
1 |
|
|
|
|
|
2,665 |
|
|
|
7,397 |
|
|
|
218 |
|
|
|
2,665 |
|
|
|
7,615 |
|
|
|
10,280 |
|
|
|
(1,544 |
) |
|
2011 |
|
|
Watson Industrial Center AFdII |
|
1 |
|
|
|
|
|
6,944 |
|
|
|
11,193 |
|
|
|
398 |
|
|
|
6,944 |
|
|
|
11,591 |
|
|
|
18,535 |
|
|
|
(2,345 |
) |
|
2011 |
|
|
Wilmington Avenue Warehouse |
|
2 |
|
|
|
|
|
11,172 |
|
|
|
34,723 |
|
|
|
2,952 |
|
|
|
11,172 |
|
|
|
37,675 |
|
|
|
48,847 |
|
|
|
(7,616 |
) |
|
2011 |
|
|
Workman Mill Distribution Center |
|
1 |
|
|
|
|
|
32,467 |
|
|
|
56,672 |
|
|
|
768 |
|
|
|
32,470 |
|
|
|
57,437 |
|
|
|
89,907 |
|
|
|
(2,505 |
) |
|
2015 |
|
|
Southern California |
|
271 |
|
|
|
|
|
1,961,383 |
|
|
|
3,136,328 |
|
|
|
628,810 |
|
|
|
2,029,727 |
|
|
|
3,696,794 |
|
|
|
5,726,521 |
|
|
|
(743,593 |
) |
|
|
|
|
|
|
|
|
|
|
|
|
|
|
|
|
|
|
|
|
|
|
|
|
|
|
|
|
|
|
|
|
|
|
|
|
|
|
|
|
|
|
Tampa, Florida |
|
|
|
|
|
|
|
|
|
|
|
|
|
|
|
|
|
|
|
|
|
|
|
|
|
|
|
|
|
|
|
|
|
|
|
|
|
Corporate Center Tampa |
|
6 |
|
|
|
|
|
4,458 |
|
|
|
19,166 |
|
|
|
(429 |
) |
|
|
4,458 |
|
|
|
18,737 |
|
|
|
23,195 |
|
|
|
(1,143 |
) |
|
2015 |
|
|
Tampa, Florida |
|
6 |
|
|
|
|
|
4,458 |
|
|
|
19,166 |
|
|
|
(429 |
) |
|
|
4,458 |
|
|
|
18,737 |
|
|
|
23,195 |
|
|
|
(1,143 |
) |
|
|
|
|
Subtotal United States: |
|
|
1,699 |
|
|
|
|
|
5,620,515 |
|
|
|
13,772,631 |
|
|
|
3,182,003 |
|
|
|
5,710,671 |
|
|
|
16,864,478 |
|
|
|
22,575,149 |
|
|
|
(3,521,641 |
) |
|
|
|
|
|
|
|
|
|
|
|
|
|
|
|
|
|
|
|
|
|
|
|
|
|
|
|
|
|
|
|
|
|
|
|
|
|
|
|
|
|
Canada: |
|
|
|
|
|
|
|
|
|
|
|
|
|
|
|
|
|
|
|
|
|
|
|
|
|
|
|
|
|
|
|
|
|
|
|
|
|
Toronto |
|
|
|
|
|
|
|
|
|
|
|
|
|
|
|
|
|
|
|
|
|
|
|
|
|
|
|
|
|
|
|
|
|
|
|
|
|
Airport Road Distribution Center |
|
1 |
|
|
(d) |
|
|
22,447 |
|
|
|
63,150 |
|
|
|
2,165 |
|
|
|
23,461 |
|
|
|
64,301 |
|
|
|
87,762 |
|
|
|
(10,661 |
) |
|
2011 |
|
|
Annagem Distribution Center |
|
1 |
|
|
|
|
|
3,028 |
|
|
|
10,357 |
|
|
|
763 |
|
|
|
3,164 |
|
|
|
10,984 |
|
|
|
14,148 |
|
|
|
(1,870 |
) |
|
2011 |
|
|
Annagem Distribution Center II |
|
1 |
|
|
|
|
|
1,705 |
|
|
|
4,368 |
|
|
|
1,238 |
|
|
|
1,782 |
|
|
|
5,529 |
|
|
|
7,311 |
|
|
|
(945 |
) |
|
2011 |
|
|
Bolton Distribution Center |
|
1 |
|
|
(d) |
|
|
6,861 |
|
|
|
- |
|
|
|
21,418 |
|
|
|
7,171 |
|
|
|
21,108 |
|
|
|
28,279 |
|
|
|
(3,943 |
) |
|
2009 |
|
|
Keele Distribution Center |
|
1 |
|
|
|
|
|
1,066 |
|
|
|
4,279 |
|
|
|
515 |
|
|
|
1,115 |
|
|
|
4,745 |
|
|
|
5,860 |
|
|
|
(1,214 |
) |
|
2011 |
|
|
Meadowvale Distribution Center |
|
2 |
|
|
(d) |
|
|
31,136 |
|
|
|
- |
|
|
|
47,244 |
|
|
|
31,718 |
|
|
|
46,662 |
|
|
|
78,380 |
|
|
|
(2,118 |
) |
|
2014 |
|
|
Millcreek Distribution Center |
|
2 |
|
|
|
|
|
7,427 |
|
|
|
28,251 |
|
|
|
850 |
|
|
|
7,762 |
|
|
|
28,766 |
|
|
|
36,528 |
|
|
|
(4,873 |
) |
|
2011 |
|
|
Milton 401 Business Park |
|
1 |
|
|
|
|
|
5,794 |
|
|
|
18,982 |
|
|
|
3,080 |
|
|
|
6,055 |
|
|
|
21,801 |
|
|
|
27,856 |
|
|
|
(4,627 |
) |
|
2011 |
|
|
Milton 402 Business Park |
|
3 |
|
|
(d) |
|
|
11,960 |
|
|
|
32,582 |
|
|
|
8,882 |
|
|
|
12,262 |
|
|
|
41,162 |
|
|
|
53,424 |
|
|
|
(4,193 |
) |
|
2011, 2014, 2016 |
|
|
Milton Crossings Business Park |
|
2 |
|
|
|
|
|
16,922 |
|
|
|
41,190 |
|
|
|
4,588 |
|
|
|
17,686 |
|
|
|
45,014 |
|
|
|
62,700 |
|
|
|
(7,437 |
) |
|
2011 |
|
|
Mississauga Gateway Center |
|
7 |
|
|
(d) |
|
|
51,330 |
|
|
|
118,855 |
|
|
|
532 |
|
|
|
51,673 |
|
|
|
119,044 |
|
|
|
170,717 |
|
|
|
(9,989 |
) |
|
2008, 2014, 2016 |
|
|
Pearson Logistics Center |
|
2 |
|
|
(d) |
|
|
10,796 |
|
|
|
38,698 |
|
|
|
1,526 |
|
|
|
11,283 |
|
|
|
39,737 |
|
|
|
51,020 |
|
|
|
(6,650 |
) |
|
2011 |
|
|
Tapscott Distribution Center |
|
1 |
|
|
|
|
|
4,571 |
|
|
|
- |
|
|
|
6,302 |
|
|
|
3,368 |
|
|
|
7,505 |
|
|
|
10,873 |
|
|
|
(241 |
) |
|
2015 |
|
|
Toronto |
|
25 |
|
|
|
|
|
175,043 |
|
|
|
360,712 |
|
|
|
99,103 |
|
|
|
178,500 |
|
|
|
456,358 |
|
|
|
634,858 |
|
|
|
(58,761 |
) |
|
|
|
|
Subtotal Canada: |
|
25 |
|
|
|
|
|
175,043 |
|
|
|
360,712 |
|
|
|
99,103 |
|
|
|
178,500 |
|
|
|
456,358 |
|
|
|
634,858 |
|
|
|
(58,761 |
) |
|
|
|
|
|
|
|
|
|
|
|
|
|
|
|
|
|
|
|
|
|
|
|
|
|
|
|
|
|
|
|
|
|
|
|
|
|
|
|
|
|
|
Mexico: |
|
|
|
|
|
|
|
|
|
|
|
|
|
|
|
|
|
|
|
|
|
|
|
|
|
|
|
|
|
|
|
|
|
|
|
|
|
Guadalajara |
|
|
|
|
|
|
|
|
|
|
|
|
|
|
|
|
|
|
|
|
|
|
|
|
|
|
|
|
|
|
|
|
|
|
|
|
|
Parque Opcion |
|
1 |
|
|
|
|
|
730 |
|
|
|
2,287 |
|
|
|
1,362 |
|
|
|
730 |
|
|
|
3,649 |
|
|
|
4,379 |
|
|
|
(802 |
) |
|
2011 |
|
|
Guadalajara |
|
1 |
|
|
|
|
|
730 |
|
|
|
2,287 |
|
|
|
1,362 |
|
|
|
730 |
|
|
|
3,649 |
|
|
|
4,379 |
|
|
|
(802 |
) |
|
|
|
|
|
|
|
|
|
|
|
|
|
|
|
|
|
|
|
|
|
|
|
|
|
|
|
|
|
|
|
|
|
|
|
|
|
|
|
|
|
108
PROLOGIS, INC. AND PROLOGIS, L.P.
SCHEDULE III – REAL ESTATE AND ACCUMULATED DEPRECIATION
DECEMBER 31, 2016
(In thousands of U.S. dollars, as applicable)
|
|
|
|
|
|
|
Initial Cost to Prologis |
|
|
Costs Capitalized |
|
|
Gross Amounts at Which Carried at December 31, 2016 |
|
|
|
|
|
|
|
|||||||||||||||
|
Description |
|
No. of Bldgs. |
|
Encum- brances |
|
Land |
|
|
Building & Improvements |
|
|
Subsequent to Acquisition |
|
|
Land |
|
|
Building & Improvements |
|
|
Total (a,b) |
|
|
Accumulated Depreciation (c) |
|
|
Date of Construction/ Acquisition |
|||||||
|
Reynosa |
|
|
|
|
|
|
|
|
|
|
|
|
|
|
|
|
|
|
|
|
|
|
|
|
|
|
|
|
|
|
|
|
|
|
|
El Puente Industrial Center |
|
1 |
|
|
|
|
989 |
|
|
|
- |
|
|
|
12,916 |
|
|
|
1,767 |
|
|
|
12,138 |
|
|
|
13,905 |
|
|
|
(314 |
) |
|
2015 |
|
Reynosa |
|
1 |
|
|
|
|
989 |
|
|
|
- |
|
|
|
12,916 |
|
|
|
1,767 |
|
|
|
12,138 |
|
|
|
13,905 |
|
|
|
(314 |
) |
|
|
|
Subtotal Mexico: |
|
2 |
|
|
|
|
1,719 |
|
|
|
2,287 |
|
|
|
14,278 |
|
|
|
2,497 |
|
|
|
15,787 |
|
|
|
18,284 |
|
|
|
(1,116 |
) |
|
|
|
Subtotal North American Markets: |
|
1726 |
|
|
|
|
5,797,277 |
|
|
|
14,135,630 |
|
|
|
3,295,384 |
|
|
|
5,891,668 |
|
|
|
17,336,623 |
|
|
|
23,228,291 |
|
|
|
(3,581,518 |
) |
|
|
|
|
|
|
|
|
|
|
|
|
|
|
|
|
|
|
|
|
|
|
|
|
|
|
|
|
|
|
|
|
|
|
|
|
|
|
|
European Markets |
|
|
|
|
|
|
|
|
|
|
|
|
|
|
|
|
|
|
|
|
|
|
|
|
|
|
|
|
|
|
|
|
|
|
|
Austria |
|
|
|
|
|
|
|
|
|
|
|
|
|
|
|
|
|
|
|
|
|
|
|
|
|
|
|
|
|
|
|
|
|
|
|
Himberg Distribution Center |
|
1 |
|
|
|
|
3,225 |
|
|
|
- |
|
|
|
5,473 |
|
|
|
3,551 |
|
|
|
5,147 |
|
|
|
8,698 |
|
|
|
(786 |
) |
|
2011 |
|
Austria |
|
1 |
|
|
|
|
3,225 |
|
|
|
- |
|
|
|
5,473 |
|
|
|
3,551 |
|
|
|
5,147 |
|
|
|
8,698 |
|
|
|
(786 |
) |
|
|
|
|
|
|
|
|
|
|
|
|
|
|
|
|
|
|
|
|
|
|
|
|
|
|
|
|
|
|
|
|
|
|
|
|
|
|
|
Czech Republic |
|
|
|
|
|
|
|
|
|
|
|
|
|
|
|
|
|
|
|
|
|
|
|
|
|
|
|
|
|
|
|
|
|
|
|
Prague Rudna Distribution Center |
|
1 |
|
|
|
|
2,259 |
|
|
|
11,770 |
|
|
|
3,035 |
|
|
|
2,259 |
|
|
|
14,805 |
|
|
|
17,064 |
|
|
|
(825 |
) |
|
2015 |
|
Uzice Distribution Center |
|
1 |
|
|
|
|
2,345 |
|
|
|
- |
|
|
|
15,313 |
|
|
|
2,345 |
|
|
|
15,313 |
|
|
|
17,658 |
|
|
|
(4,130 |
) |
|
2007 |
|
Czech Republic |
|
2 |
|
|
|
|
4,604 |
|
|
|
11,770 |
|
|
|
18,348 |
|
|
|
4,604 |
|
|
|
30,118 |
|
|
|
34,722 |
|
|
|
(4,955 |
) |
|
|
|
|
|
|
|
|
|
|
|
|
|
|
|
|
|
|
|
|
|
|
|
|
|
|
|
|
|
|
|
|
|
|
|
|
|
|
|
France |
|
|
|
|
|
|
|
|
|
|
|
|
|
|
|
|
|
|
|
|
|
|
|
|
|
|
|
|
|
|
|
|
|
|
|
Bonneuil Distribution Center |
|
1 |
|
|
|
|
- |
|
|
|
- |
|
|
|
11,840 |
|
|
|
- |
|
|
|
11,840 |
|
|
|
11,840 |
|
|
|
(1,293 |
) |
|
2012 |
|
Le Havre Distribution Center |
|
1 |
|
|
|
|
620 |
|
|
|
- |
|
|
|
7,439 |
|
|
|
620 |
|
|
|
7,439 |
|
|
|
8,059 |
|
|
|
(178 |
) |
|
2016 |
|
LGR Genevill. 1 SAS |
|
1 |
|
|
|
|
1,942 |
|
|
|
2,107 |
|
|
|
718 |
|
|
|
1,942 |
|
|
|
2,825 |
|
|
|
4,767 |
|
|
|
(442 |
) |
|
2011 |
|
LGR Genevill. 2 SAS |
|
1 |
|
|
|
|
1,493 |
|
|
|
3,095 |
|
|
|
44 |
|
|
|
1,493 |
|
|
|
3,139 |
|
|
|
4,632 |
|
|
|
(477 |
) |
|
2011 |
|
Moissy II Distribution Center |
|
2 |
|
|
|
|
9,562 |
|
|
|
3,555 |
|
|
|
21,878 |
|
|
|
10,250 |
|
|
|
24,745 |
|
|
|
34,995 |
|
|
|
(2,425 |
) |
|
2014, 2016 |
|
Port of Rouen |
|
1 |
|
|
|
|
- |
|
|
|
13,440 |
|
|
|
170 |
|
|
|
- |
|
|
|
13,610 |
|
|
|
13,610 |
|
|
|
(2,791 |
) |
|
2011 |
|
France |
|
7 |
|
|
|
|
13,617 |
|
|
|
22,197 |
|
|
|
42,089 |
|
|
|
14,305 |
|
|
|
63,598 |
|
|
|
77,903 |
|
|
|
(7,606 |
) |
|
|
|
|
|
|
|
|
|
|
|
|
|
|
|
|
|
|
|
|
|
|
|
|
|
|
|
|
|
|
|
|
|
|
|
|
|
|
|
Germany |
|
|
|
|
|
|
|
|
|
|
|
|
|
|
|
|
|
|
|
|
|
|
|
|
|
|
|
|
|
|
|
|
|
|
|
Hausbruch Industrial Center 4-B |
|
1 |
|
|
|
|
7,201 |
|
|
|
4,684 |
|
|
|
222 |
|
|
|
7,201 |
|
|
|
4,906 |
|
|
|
12,107 |
|
|
|
(2,096 |
) |
|
2011 |
|
Hausbruch Industrial Center 5-650 |
|
1 |
|
|
|
|
2,592 |
|
|
|
400 |
|
|
|
292 |
|
|
|
2,592 |
|
|
|
692 |
|
|
|
3,284 |
|
|
|
(210 |
) |
|
2011 |
|
Kolleda Distribution Center |
|
1 |
|
|
|
|
223 |
|
|
|
3,450 |
|
|
|
(276 |
) |
|
|
223 |
|
|
|
3,174 |
|
|
|
3,397 |
|
|
|
(605 |
) |
|
2008 |
|
Lauenau Distribution Center |
|
1 |
|
|
|
|
2,417 |
|
|
|
5,380 |
|
|
|
304 |
|
|
|
2,417 |
|
|
|
5,684 |
|
|
|
8,101 |
|
|
|
(1,120 |
) |
|
2011 |
|
Meerane Distribution Center |
|
1 |
|
|
|
|
22,214 |
|
|
|
- |
|
|
|
71,263 |
|
|
|
25,970 |
|
|
|
67,507 |
|
|
|
93,477 |
|
|
|
(983 |
) |
|
2016 |
|
Germany |
|
5 |
|
|
|
|
34,647 |
|
|
|
13,914 |
|
|
|
71,805 |
|
|
|
38,403 |
|
|
|
81,963 |
|
|
|
120,366 |
|
|
|
(5,014 |
) |
|
|
|
|
|
|
|
|
|
|
|
|
|
|
|
|
|
|
|
|
|
|
|
|
|
|
|
|
|
|
|
|
|
|
|
|
|
|
|
Hungary |
|
|
|
|
|
|
|
|
|
|
|
|
|
|
|
|
|
|
|
|
|
|
|
|
|
|
|
|
|
|
|
|
|
|
|
Hegyeshalom Distribution Center |
|
1 |
|
|
|
|
245 |
|
|
|
- |
|
|
|
2,969 |
|
|
|
- |
|
|
|
3,214 |
|
|
|
3,214 |
|
|
|
- |
|
|
2015 |
|
Hungary |
|
1 |
|
|
|
|
245 |
|
|
|
- |
|
|
|
2,969 |
|
|
|
- |
|
|
|
3,214 |
|
|
|
3,214 |
|
|
|
- |
|
|
|
|
|
|
|
|
|
|
|
|
|
|
|
|
|
|
|
|
|
|
|
|
|
|
|
|
|
|
|
|
|
|
|
|
|
|
|
|
Italy |
|
|
|
|
|
|
|
|
|
|
|
|
|
|
|
|
|
|
|
|
|
|
|
|
|
|
|
|
|
|
|
|
|
|
|
Arena Po Distribution Center |
|
2 |
|
|
|
|
7,185 |
|
|
|
19,447 |
|
|
|
605 |
|
|
|
7,185 |
|
|
|
20,052 |
|
|
|
27,237 |
|
|
|
(5,360 |
) |
|
2011 |
|
Castel San Giovanni Distribution Center |
|
1 |
|
|
|
|
2,986 |
|
|
|
9,117 |
|
|
|
321 |
|
|
|
2,986 |
|
|
|
9,438 |
|
|
|
12,424 |
|
|
|
(1,885 |
) |
|
2011 |
|
Siziano Logistics Park |
|
1 |
|
|
|
|
9,538 |
|
|
|
17,290 |
|
|
|
1,198 |
|
|
|
9,538 |
|
|
|
18,488 |
|
|
|
28,026 |
|
|
|
(3,255 |
) |
|
2011 |
|
Italy |
|
4 |
|
|
|
|
19,709 |
|
|
|
45,854 |
|
|
|
2,124 |
|
|
|
19,709 |
|
|
|
47,978 |
|
|
|
67,687 |
|
|
|
(10,500 |
) |
|
|
|
|
|
|
|
|
|
|
|
|
|
|
|
|
|
|
|
|
|
|
|
|
|
|
|
|
|
|
|
|
|
|
|
|
|
|
|
Poland |
|
|
|
|
|
|
|
|
|
|
|
|
|
|
|
|
|
|
|
|
|
|
|
|
|
|
|
|
|
|
|
|
|
|
|
Nadarzyn Distribution Center |
|
1 |
|
|
|
|
2,180 |
|
|
|
- |
|
|
|
6,905 |
|
|
|
2,180 |
|
|
|
6,905 |
|
|
|
9,085 |
|
|
|
(1,486 |
) |
|
2009 |
|
Piotrkow II Distribution Center |
|
1 |
|
|
|
|
1,418 |
|
|
|
- |
|
|
|
4,864 |
|
|
|
1,396 |
|
|
|
4,886 |
|
|
|
6,282 |
|
|
|
(1,170 |
) |
|
2009 |
|
Sochaczew Distribution Center |
|
2 |
|
|
|
|
116 |
|
|
|
10,242 |
|
|
|
2,214 |
|
|
|
750 |
|
|
|
11,822 |
|
|
|
12,572 |
|
|
|
(2,874 |
) |
|
2008 |
|
Szczecin Distribution Center |
|
2 |
|
|
|
|
925 |
|
|
|
- |
|
|
|
13,163 |
|
|
|
928 |
|
|
|
13,160 |
|
|
|
14,088 |
|
|
|
(218 |
) |
|
2014, 2015 |
|
Poland |
|
6 |
|
|
|
|
4,639 |
|
|
|
10,242 |
|
|
|
27,146 |
|
|
|
5,254 |
|
|
|
36,773 |
|
|
|
42,027 |
|
|
|
(5,748 |
) |
|
|
|
|
|
|
|
|
|
|
|
|
|
|
|
|
|
|
|
|
|
|
|
|
|
|
|
|
|
|
|
|
|
|
|
|
|
|
|
Slovakia |
|
|
|
|
|
|
|
|
|
|
|
|
|
|
|
|
|
|
|
|
|
|
|
|
|
|
|
|
|
|
|
|
|
|
|
Sered Distribution Center |
|
1 |
|
|
|
|
2,105 |
|
|
|
- |
|
|
|
11,559 |
|
|
|
2,105 |
|
|
|
11,559 |
|
|
|
13,664 |
|
|
|
(2,233 |
) |
|
2009 |
|
Slovakia |
|
1 |
|
|
|
|
2,105 |
|
|
|
- |
|
|
|
11,559 |
|
|
|
2,105 |
|
|
|
11,559 |
|
|
|
13,664 |
|
|
|
(2,233 |
) |
|
|
|
|
|
|
|
|
|
|
|
|
|
|
|
|
|
|
|
|
|
|
|
|
|
|
|
|
|
|
|
|
|
|
|
|
|
|
|
Spain |
|
|
|
|
|
|
|
|
|
|
|
|
|
|
|
|
|
|
|
|
|
|
|
|
|
|
|
|
|
|
|
|
|
|
|
Baraja MAD Logistics Center |
|
4 |
|
|
|
|
- |
|
|
|
34,100 |
|
|
|
1,040 |
|
|
|
- |
|
|
|
35,140 |
|
|
|
35,140 |
|
|
|
(7,935 |
) |
|
2011 |
|
Spain |
|
4 |
|
|
|
|
- |
|
|
|
34,100 |
|
|
|
1,040 |
|
|
|
- |
|
|
|
35,140 |
|
|
|
35,140 |
|
|
|
(7,935 |
) |
|
|
|
|
|
|
|
|
|
|
|
|
|
|
|
|
|
|
|
|
|
|
|
|
|
|
|
|
|
|
|
|
|
|
|
|
|
|
|
Sweden |
|
|
|
|
|
|
|
|
|
|
|
|
|
|
|
|
|
|
|
|
|
|
|
|
|
|
|
|
|
|
|
|
|
|
|
Orebro Distribution Center |
|
1 |
|
|
|
|
8,738 |
|
|
|
19,104 |
|
|
|
2,230 |
|
|
|
8,738 |
|
|
|
21,334 |
|
|
|
30,072 |
|
|
|
(6,267 |
) |
|
2011 |
|
Sweden |
|
1 |
|
|
|
|
8,738 |
|
|
|
19,104 |
|
|
|
2,230 |
|
|
|
8,738 |
|
|
|
21,334 |
|
|
|
30,072 |
|
|
|
(6,267 |
) |
|
|
109
PROLOGIS, INC. AND PROLOGIS, L.P.
SCHEDULE III – REAL ESTATE AND ACCUMULATED DEPRECIATION
DECEMBER 31, 2016
(In thousands of U.S. dollars, as applicable)
|
|
|
|
|
|
|
|
|
Initial Cost to Prologis |
|
|
Costs Capitalized |
|
|
Gross Amounts at Which Carried at December 31, 2016 |
|
|
|
|
|
|
|
|||||||||||||||
|
Description |
|
No. of Bldgs. |
|
|
Encum- brances |
|
Land |
|
|
Building & Improvements |
|
|
Subsequent to Acquisition |
|
|
Land |
|
|
Building & Improvements |
|
|
Total (a,b) |
|
|
Accumulated Depreciation (c) |
|
|
Date of Construction/ Acquisition |
||||||||
|
United Kingdom |
|
|
|
|
|
|
|
|
|
|
|
|
|
|
|
|
|
|
|
|
|
|
|
|
|
|
|
|
|
|
|
|
|
|
|
|
|
Grange Park |
|
1 |
|
|
|
|
|
13,258 |
|
|
|
- |
|
|
|
14,900 |
|
|
|
14,331 |
|
|
|
13,827 |
|
|
|
28,158 |
|
|
|
(519 |
) |
|
2015 |
|
|
Midpoint Park |
|
2 |
|
|
|
|
|
17,843 |
|
|
|
9,526 |
|
|
|
24,621 |
|
|
|
23,011 |
|
|
|
28,979 |
|
|
|
51,990 |
|
|
|
(2,253 |
) |
|
2008, 2015 |
|
|
United Kingdom |
|
3 |
|
|
|
|
|
31,101 |
|
|
|
9,526 |
|
|
|
39,521 |
|
|
|
37,342 |
|
|
|
42,806 |
|
|
|
80,148 |
|
|
|
(2,772 |
) |
|
|
|
|
Subtotal European Markets: |
|
35 |
|
|
|
|
|
122,630 |
|
|
|
166,707 |
|
|
|
224,304 |
|
|
|
134,011 |
|
|
|
379,630 |
|
|
|
513,641 |
|
|
|
(53,816 |
) |
|
|
|
|
|
|
|
|
|
|
|
|
|
|
|
|
|
|
|
|
|
|
|
|
|
|
|
|
|
|
|
|
|
|
|
|
|
|
|
|
|
|
Asian Markets |
|
|
|
|
|
|
|
|
|
|
|
|
|
|
|
|
|
|
|
|
|
|
|
|
|
|
|
|
|
|
|
|
|
|
|
|
|
China |
|
|
|
|
|
|
|
|
|
|
|
|
|
|
|
|
|
|
|
|
|
|
|
|
|
|
|
|
|
|
|
|
|
|
|
|
|
Dalian Industrial Park Distribution Center |
|
1 |
|
|
|
|
|
2,239 |
|
|
|
12,828 |
|
|
|
30 |
|
|
|
2,052 |
|
|
|
13,045 |
|
|
|
15,097 |
|
|
|
(2,043 |
) |
|
2011 |
|
|
Fengxian Logistics Center |
|
3 |
|
|
|
|
|
- |
|
|
|
12,149 |
|
|
|
991 |
|
|
|
- |
|
|
|
13,140 |
|
|
|
13,140 |
|
|
|
(5,073 |
) |
|
2011 |
|
|
Jiaxing Distribution Center |
|
4 |
|
|
|
|
|
10,104 |
|
|
|
9,795 |
|
|
|
15,058 |
|
|
|
8,555 |
|
|
|
26,402 |
|
|
|
34,957 |
|
|
|
(2,715 |
) |
|
2011, 2013 |
|
|
Tianjin Bonded Logistics Park |
|
2 |
|
|
|
|
|
1,380 |
|
|
|
8,367 |
|
|
|
25 |
|
|
|
1,257 |
|
|
|
8,515 |
|
|
|
9,772 |
|
|
|
(1,515 |
) |
|
2011 |
|
|
ProLogis Park Narita III |
|
10 |
|
|
|
|
|
13,723 |
|
|
|
43,139 |
|
|
|
16,104 |
|
|
|
11,864 |
|
|
|
61,102 |
|
|
|
72,966 |
|
|
|
(11,346 |
) |
|
|
|
|
|
|
|
|
|
|
|
|
|
|
|
|
|
|
|
|
|
|
|
|
|
|
|
|
|
|
|
|
|
|
|
|
|
|
|
|
|
|
Singapore |
|
|
|
|
|
|
|
|
|
|
|
|
|
|
|
|
|
|
|
|
|
|
|
|
|
|
|
|
|
|
|
|
|
|
|
|
|
Airport Logistics Center 3 |
|
1 |
|
|
|
|
|
- |
|
|
|
23,553 |
|
|
|
201 |
|
|
|
- |
|
|
|
23,754 |
|
|
|
23,754 |
|
|
|
(5,890 |
) |
|
2011 |
|
|
Changi South Distribution Center 1 |
|
1 |
|
|
|
|
|
- |
|
|
|
38,384 |
|
|
|
104 |
|
|
|
- |
|
|
|
38,488 |
|
|
|
38,488 |
|
|
|
(8,773 |
) |
|
2011 |
|
|
Changi-North Distribution Center 1 |
|
1 |
|
|
|
|
|
- |
|
|
|
14,276 |
|
|
|
140 |
|
|
|
- |
|
|
|
14,416 |
|
|
|
14,416 |
|
|
|
(3,158 |
) |
|
2011 |
|
|
Singapore Airport Logistics Center 2 |
|
1 |
|
|
|
|
|
- |
|
|
|
34,105 |
|
|
|
194 |
|
|
|
- |
|
|
|
34,299 |
|
|
|
34,299 |
|
|
|
(8,547 |
) |
|
2011 |
|
|
Tuas Distribution Center |
|
1 |
|
|
|
|
|
- |
|
|
|
17,324 |
|
|
|
278 |
|
|
|
- |
|
|
|
17,602 |
|
|
|
17,602 |
|
|
|
(6,431 |
) |
|
2011 |
|
|
Singapore |
|
5 |
|
|
|
|
|
- |
|
|
|
127,642 |
|
|
|
917 |
|
|
|
- |
|
|
|
128,559 |
|
|
|
128,559 |
|
|
|
(32,799 |
) |
|
|
|
|
Subtotal Asian Markets: |
|
15 |
|
|
|
|
|
13,723 |
|
|
|
170,781 |
|
|
|
17,021 |
|
|
|
11,864 |
|
|
|
189,661 |
|
|
|
201,525 |
|
|
|
(44,145 |
) |
|
|
|
|
Total Industrial Operating Properties |
|
|
1,776 |
|
|
|
|
|
5,933,630 |
|
|
|
14,473,118 |
|
|
|
3,536,709 |
|
|
|
6,037,543 |
|
|
|
17,905,914 |
|
|
|
23,943,457 |
|
|
|
(3,679,479 |
) |
|
|
|
|
|
|
|
|
|
|
|
|
|
|
|
|
|
|
|
|
|
|
|
|
|
|
|
|
|
|
|
|
|
|
|
|
|
|
|
|
|
Development Portfolio |
|
|
|
|
|
|
|
|
|
|
|
|
|
|
|
|
|
|
|
|
|
|
|
|
|
|
|
|
|
|
|
|
|
|
|
|
|
|
|
|
|
|
|
|
|
|
|
|
|
|
|
|
|
|
|
|
|
|
|
|
|
|
|
|
|
|
|
|
|
|
|
|
|
|
|
North American Markets |
|
|
|
|
|
|
|
|
|
|
|
|
|
|
|
|
|
|
|
|
|
|
|
|
|
|
|
|
|
|
|
|
|
|
|
|
|
United States |
|
|
|
|
|
|
|
|
|
|
|
|
|
|
|
|
|
|
|
|
|
|
|
|
|
|
|
|
|
|
|
|
|
|
|
|
|
Atlanta, Georgia |
|
|
|
|
|
|
|
|
|
|
|
|
|
|
|
|
|
|
|
|
|
|
|
|
|
|
|
|
|
|
|
|
|
|
|
|
|
Park I-75 South |
|
1 |
|
|
|
|
|
9,868 |
|
|
|
- |
|
|
|
28,881 |
|
|
|
9,868 |
|
|
|
28,881 |
|
|
|
38,749 |
|
|
|
|
|
|
|
|
|
Atlanta, Georgia |
|
1 |
|
|
|
|
|
9,868 |
|
|
|
- |
|
|
|
28,881 |
|
|
|
9,868 |
|
|
|
28,881 |
|
|
|
38,749 |
|
|
|
|
|
|
|
|
|
|
|
|
|
|
|
|
|
|
|
|
|
|
|
|
|
|
|
|
|
|
|
|
|
|
|
|
|
|
|
|
|
|
|
|
|
|
|
Central Valley, California |
|
|
|
|
|
|
|
|
|
|
|
|
|
|
|
|
|
|
|
|
|
|
|
|
|
|
|
|
|
|
|
|
|
|
|
|
|
International Park of Commerce |
|
1 |
|
|
|
|
|
3,048 |
|
|
|
- |
|
|
|
2 |
|
|
|
3,048 |
|
|
|
2 |
|
|
|
3,050 |
|
|
|
|
|
|
|
|
|
Patterson Pass Business Center |
|
2 |
|
|
|
|
|
2,922 |
|
|
|
- |
|
|
|
11,360 |
|
|
|
2,922 |
|
|
|
11,360 |
|
|
|
14,282 |
|
|
|
|
|
|
|
|
|
Central Valley, California |
|
3 |
|
|
|
|
|
5,970 |
|
|
|
- |
|
|
|
11,362 |
|
|
|
5,970 |
|
|
|
11,362 |
|
|
|
17,332 |
|
|
|
|
|
|
|
|
|
|
|
|
|
|
|
|
|
|
|
|
|
|
|
|
|
|
|
|
|
|
|
|
|
|
|
|
|
|
|
|
|
|
|
|
|
|
|
Chicago, Illinois |
|
|
|
|
|
|
|
|
|
|
|
|
|
|
|
|
|
|
|
|
|
|
|
|
|
|
|
|
|
|
|
|
|
|
|
|
|
Glendale Heights Distribution Center |
|
1 |
|
|
|
|
|
153 |
|
|
|
- |
|
|
|
9,825 |
|
|
|
153 |
|
|
|
9,825 |
|
|
|
9,978 |
|
|
|
|
|
|
2016 |
|
|
Woodridge Distribution Center |
|
1 |
|
|
|
|
|
1,424 |
|
|
|
- |
|
|
|
3,725 |
|
|
|
1,424 |
|
|
|
3,725 |
|
|
|
5,149 |
|
|
|
|
|
|
2016 |
|
|
Chicago, Illinois |
|
2 |
|
|
|
|
|
1,577 |
|
|
|
- |
|
|
|
13,550 |
|
|
|
1,577 |
|
|
|
13,550 |
|
|
|
15,127 |
|
|
|
|
|
|
|
|
|
|
|
|
|
|
|
|
|
|
|
|
|
|
|
|
|
|
|
|
|
|
|
|
|
|
|
|
|
|
|
|
|
|
|
|
|
|
|
Dallas/Fort Worth, Texas |
|
|
|
|
|
|
|
|
|
|
|
|
|
|
|
|
|
|
|
|
|
|
|
|
|
|
|
|
|
|
|
|
|
|
|
|
|
Park 121 Distribution Center |
|
2 |
|
|
|
|
|
8,546 |
|
|
|
- |
|
|
|
5,874 |
|
|
|
8,546 |
|
|
|
5,874 |
|
|
|
14,420 |
|
|
|
|
|
|
|
|
|
Dallas/Fort Worth, Texas |
|
2 |
|
|
|
|
|
8,546 |
|
|
|
- |
|
|
|
5,874 |
|
|
|
8,546 |
|
|
|
5,874 |
|
|
|
14,420 |
|
|
|
|
|
|
|
|
|
|
|
|
|
|
|
|
|
|
|
|
|
|
|
|
|
|
|
|
|
|
|
|
|
|
|
|
|
|
|
|
|
|
|
|
|
|
|
Denver, Colorado |
|
|
|
|
|
|
|
|
|
|
|
|
|
|
|
|
|
|
|
|
|
|
|
|
|
|
|
|
|
|
|
|
|
|
|
|
|
Stapleton Business Center North |
|
1 |
|
|
|
|
|
2,403 |
|
|
|
- |
|
|
|
14,430 |
|
|
|
2,403 |
|
|
|
14,430 |
|
|
|
16,833 |
|
|
|
|
|
|
2016 |
|
|
Denver, Colorado |
|
1 |
|
|
|
|
|
2,403 |
|
|
|
- |
|
|
|
14,430 |
|
|
|
2,403 |
|
|
|
14,430 |
|
|
|
16,833 |
|
|
|
|
|
|
|
|
|
|
|
|
|
|
|
|
|
|
|
|
|
|
|
|
|
|
|
|
|
|
|
|
|
|
|
|
|
|
|
|
|
|
|
|
|
|
|
Houston, Texas |
|
|
|
|
|
|
|
|
|
|
|
|
|
|
|
|
|
|
|
|
|
|
|
|
|
|
|
|
|
|
|
|
|
|
|
|
|
Greens Parkway Distribution Center |
|
1 |
|
|
|
|
|
1,246 |
|
|
|
- |
|
|
|
14,477 |
|
|
|
1,246 |
|
|
|
14,477 |
|
|
|
15,723 |
|
|
|
|
|
|
2016 |
|
|
Houston, Texas |
|
1 |
|
|
|
|
|
1,246 |
|
|
|
- |
|
|
|
14,477 |
|
|
|
1,246 |
|
|
|
14,477 |
|
|
|
15,723 |
|
|
|
|
|
|
|
|
|
|
|
|
|
|
|
|
|
|
|
|
|
|
|
|
|
|
|
|
|
|
|
|
|
|
|
|
|
|
|
|
|
|
|
|
|
|
|
Las Vegas, Nevada |
|
|
|
|
|
|
|
|
|
|
|
|
|
|
|
|
|
|
|
|
|
|
|
|
|
|
|
|
|
|
|
|
|
|
|
|
|
Ann Rd-N Sloan LN Distribution Center |
|
1 |
|
|
|
|
|
3,609 |
|
|
|
- |
|
|
|
19,749 |
|
|
|
3,609 |
|
|
|
19,749 |
|
|
|
23,358 |
|
|
|
|
|
|
|
|
|
Las Vegas Beltway Distribution Center |
|
1 |
|
|
|
|
|
7,321 |
|
|
|
- |
|
|
|
7,443 |
|
|
|
7,321 |
|
|
|
7,443 |
|
|
|
14,764 |
|
|
|
|
|
|
2016 |
|
|
Las Vegas Corporate Center |
|
2 |
|
|
|
|
|
3,936 |
|
|
|
- |
|
|
|
1,003 |
|
|
|
3,936 |
|
|
|
1,003 |
|
|
|
4,939 |
|
|
|
|
|
|
|
|
|
North 15 Freeway Distribution Center |
|
1 |
|
|
|
|
|
2,734 |
|
|
|
- |
|
|
|
10,114 |
|
|
|
2,734 |
|
|
|
10,114 |
|
|
|
12,848 |
|
|
|
|
|
|
2016 |
|
|
Sunrise Industrial Park |
|
1 |
|
|
|
|
|
5,348 |
|
|
|
- |
|
|
|
8,011 |
|
|
|
5,348 |
|
|
|
8,011 |
|
|
|
13,359 |
|
|
|
|
|
|
|
|
|
Las Vegas, Nevada |
|
6 |
|
|
|
|
|
22,948 |
|
|
|
- |
|
|
|
46,320 |
|
|
|
22,948 |
|
|
|
46,320 |
|
|
|
69,268 |
|
|
|
|
|
|
|
|
110
PROLOGIS, INC. AND PROLOGIS, L.P.
SCHEDULE III – REAL ESTATE AND ACCUMULATED DEPRECIATION
DECEMBER 31, 2016
(In thousands of U.S. dollars, as applicable)
|
|
|
|
|
|
|
Initial Cost to Prologis |
|
|
Costs Capitalized |
|
|
Gross Amounts at Which Carried at December 31, 2016 |
|
|
|
|
|
|||||||||||||||
|
Description |
|
No. of Bldgs. |
|
Encum- brances |
|
Land |
|
|
Building & Improvements |
|
|
Subsequent to Acquisition |
|
|
Land |
|
|
Building & Improvements |
|
|
Total (a,b) |
|
|
Accumulated Depreciation (c) |
|
Date of Construction/ Acquisition |
||||||
|
Memphis, Tennessee |
|
|
|
|
|
|
|
|
|
|
|
|
|
|
|
|
|
|
|
|
|
|
|
|
|
|
|
|
|
|
|
|
|
DeSoto Distribution Center |
|
1 |
|
|
|
|
4,140 |
|
|
|
- |
|
|
|
21,382 |
|
|
|
4,140 |
|
|
|
21,382 |
|
|
|
25,522 |
|
|
|
|
|
|
Memphis, Tennessee |
|
1 |
|
|
|
|
4,140 |
|
|
|
- |
|
|
|
21,382 |
|
|
|
4,140 |
|
|
|
21,382 |
|
|
|
25,522 |
|
|
|
|
|
|
|
|
|
|
|
|
|
|
|
|
|
|
|
|
|
|
|
|
|
|
|
|
|
|
|
|
|
|
|
|
|
|
|
|
New Jersey |
|
|
|
|
|
|
|
|
|
|
|
|
|
|
|
|
|
|
|
|
|
|
|
|
|
|
|
|
|
|
|
|
|
Elizabeth Seaport |
|
1 |
|
|
|
|
15,732 |
|
|
|
- |
|
|
|
3,145 |
|
|
|
15,732 |
|
|
|
3,145 |
|
|
|
18,877 |
|
|
|
|
|
|
Tri-Port Distribution Center |
|
1 |
|
|
|
|
34,102 |
|
|
|
- |
|
|
|
- |
|
|
|
34,102 |
|
|
|
- |
|
|
|
34,102 |
|
|
|
|
|
|
New Jersey |
|
2 |
|
|
|
|
49,834 |
|
|
|
- |
|
|
|
3,145 |
|
|
|
49,834 |
|
|
|
3,145 |
|
|
|
52,979 |
|
|
|
|
|
|
|
|
|
|
|
|
|
|
|
|
|
|
|
|
|
|
|
|
|
|
|
|
|
|
|
|
|
|
|
|
|
|
|
|
Phoenix, Arizona |
|
|
|
|
|
|
|
|
|
|
|
|
|
|
|
|
|
|
|
|
|
|
|
|
|
|
|
|
|
|
|
|
|
Riverside Distribution Center |
|
1 |
|
|
|
|
1,075 |
|
|
|
- |
|
|
|
274 |
|
|
|
1,075 |
|
|
|
274 |
|
|
|
1,349 |
|
|
|
|
|
|
Phoenix, Arizona |
|
1 |
|
|
|
|
1,075 |
|
|
|
- |
|
|
|
274 |
|
|
|
1,075 |
|
|
|
274 |
|
|
|
1,349 |
|
|
|
|
|
|
|
|
|
|
|
|
|
|
|
|
|
|
|
|
|
|
|
|
|
|
|
|
|
|
|
|
|
|
|
|
|
|
|
|
San Antonio, Texas |
|
|
|
|
|
|
|
|
|
|
|
|
|
|
|
|
|
|
|
|
|
|
|
|
|
|
|
|
|
|
|
|
|
Southport Distribution Center |
|
1 |
|
|
|
|
1,599 |
|
|
|
- |
|
|
|
20,594 |
|
|
|
1,599 |
|
|
|
20,594 |
|
|
|
22,193 |
|
|
|
|
|
|
San Antonio, Texas |
|
1 |
|
|
|
|
1,599 |
|
|
|
- |
|
|
|
20,594 |
|
|
|
1,599 |
|
|
|
20,594 |
|
|
|
22,193 |
|
|
|
|
|
|
|
|
|
|
|
|
|
|
|
|
|
|
|
|
|
|
|
|
|
|
|
|
|
|
|
|
|
|
|
|
|
|
|
|
San Francisco Bay Area, California |
|
|
|
|
|
|
|
|
|
|
|
|
|
|
|
|
|
|
|
|
|
|
|
|
|
|
|
|
|
|
|
|
|
Hayward Industrial Center |
|
1 |
|
|
|
|
11,287 |
|
|
|
- |
|
|
|
14,693 |
|
|
|
11,287 |
|
|
|
14,693 |
|
|
|
25,980 |
|
|
|
|
2016 |
|
Oakland Logistics Park |
|
1 |
|
|
|
|
815 |
|
|
|
- |
|
|
|
4,327 |
|
|
|
815 |
|
|
|
4,327 |
|
|
|
5,142 |
|
|
|
|
|
|
San Francisco Bay Area, California |
|
2 |
|
|
|
|
12,102 |
|
|
|
- |
|
|
|
19,020 |
|
|
|
12,102 |
|
|
|
19,020 |
|
|
|
31,122 |
|
|
|
|
|
|
|
|
|
|
|
|
|
|
|
|
|
|
|
|
|
|
|
|
|
|
|
|
|
|
|
|
|
|
|
|
|
|
|
|
Seattle, Washington |
|
|
|
|
|
|
|
|
|
|
|
|
|
|
|
|
|
|
|
|
|
|
|
|
|
|
|
|
|
|
|
|
|
Park Tacoma Distribution Center |
|
2 |
|
|
|
|
2,528 |
|
|
|
- |
|
|
|
681 |
|
|
|
2,528 |
|
|
|
681 |
|
|
|
3,209 |
|
|
|
|
|
|
Seattle, Washington |
|
2 |
|
|
|
|
2,528 |
|
|
|
- |
|
|
|
681 |
|
|
|
2,528 |
|
|
|
681 |
|
|
|
3,209 |
|
|
|
|
|
|
|
|
|
|
|
|
|
|
|
|
|
|
|
|
|
|
|
|
|
|
|
|
|
|
|
|
|
|
|
|
|
|
|
|
South Florida |
|
|
|
|
|
|
|
|
|
|
|
|
|
|
|
|
|
|
|
|
|
|
|
|
|
|
|
|
|
|
|
|
|
Beacon Lakes |
|
3 |
|
|
|
|
11,833 |
|
|
|
- |
|
|
|
8,112 |
|
|
|
11,833 |
|
|
|
8,112 |
|
|
|
19,945 |
|
|
|
|
|
|
South Florida |
|
3 |
|
|
|
|
11,833 |
|
|
|
- |
|
|
|
8,112 |
|
|
|
11,833 |
|
|
|
8,112 |
|
|
|
19,945 |
|
|
|
|
|
|
|
|
|
|
|
|
|
|
|
|
|
|
|
|
|
|
|
|
|
|
|
|
|
|
|
|
|
|
|
|
|
|
|
|
Southern California |
|
|
|
|
|
|
|
|
|
|
|
|
|
|
|
|
|
|
|
|
|
|
|
|
|
|
|
|
|
|
|
|
|
Agua Mansa |
|
3 |
|
|
|
|
15,511 |
|
|
|
- |
|
|
|
1,250 |
|
|
|
15,511 |
|
|
|
1,250 |
|
|
|
16,761 |
|
|
|
|
|
|
Meridan Park |
|
1 |
|
|
|
|
17,021 |
|
|
|
- |
|
|
|
6,951 |
|
|
|
17,021 |
|
|
|
6,951 |
|
|
|
23,972 |
|
|
|
|
|
|
Redlands Distribution Center |
|
2 |
|
|
|
|
18,136 |
|
|
|
- |
|
|
|
5,474 |
|
|
|
18,136 |
|
|
|
5,474 |
|
|
|
23,610 |
|
|
|
|
|
|
Southern California |
|
6 |
|
|
|
|
50,668 |
|
|
|
- |
|
|
|
13,675 |
|
|
|
50,668 |
|
|
|
13,675 |
|
|
|
64,343 |
|
|
|
|
|
|
Subtotal United States: |
|
34 |
|
|
|
|
186,337 |
|
|
|
- |
|
|
|
221,777 |
|
|
|
186,337 |
|
|
|
221,777 |
|
|
|
408,114 |
|
|
|
|
|
|
|
|
|
|
|
|
|
|
|
|
|
|
|
|
|
|
|
|
|
|
|
|
|
|
|
|
|
|
|
|
|
|
|
|
Canada |
|
|
|
|
|
|
|
|
|
|
|
|
|
|
|
|
|
|
|
|
|
|
|
|
|
|
|
|
|
|
|
|
|
Milton 402 Business Park |
|
2 |
|
|
|
|
7,792 |
|
|
|
|
|
|
|
20,390 |
|
|
|
7,792 |
|
|
|
20,390 |
|
|
|
28,182 |
|
|
|
|
2016 |
|
Tapscott Distribution Center |
|
2 |
|
|
|
|
7,875 |
|
|
|
- |
|
|
|
15,631 |
|
|
|
7,875 |
|
|
|
15,631 |
|
|
|
23,506 |
|
|
|
|
2016 |
|
Canada |
|
4 |
|
|
|
|
15,667 |
|
|
|
- |
|
|
|
36,021 |
|
|
|
15,667 |
|
|
|
36,021 |
|
|
|
51,688 |
|
|
|
|
|
|
|
|
|
|
|
|
|
|
|
|
|
|
|
|
|
|
|
|
|
|
|
|
|
|
|
|
|
|
|
|
|
|
|
|
Mexico |
|
|
|
|
|
|
|
|
|
|
|
|
|
|
|
|
|
|
|
|
|
|
|
|
|
|
|
|
|
|
|
|
|
Agua Fria Industrial Park |
|
1 |
|
|
|
|
4,912 |
|
|
|
- |
|
|
|
10,941 |
|
|
|
4,912 |
|
|
|
10,941 |
|
|
|
15,853 |
|
|
|
|
|
|
Arrayanes Industrial Park |
|
1 |
|
|
|
|
4,738 |
|
|
|
- |
|
|
|
6,744 |
|
|
|
4,738 |
|
|
|
6,744 |
|
|
|
11,482 |
|
|
|
|
|
|
Los Altos Industrial Park |
|
1 |
|
|
|
|
3,726 |
|
|
|
- |
|
|
|
5,712 |
|
|
|
3,726 |
|
|
|
5,712 |
|
|
|
9,438 |
|
|
|
|
2016 |
|
San Jose Distribution Center |
|
3 |
|
|
|
|
24,303 |
|
|
|
- |
|
|
|
19,060 |
|
|
|
24,303 |
|
|
|
19,060 |
|
|
|
43,363 |
|
|
|
|
2016 |
|
Toluca Distribution Center |
|
1 |
|
|
|
|
3,174 |
|
|
|
- |
|
|
|
4,485 |
|
|
|
3,174 |
|
|
|
4,485 |
|
|
|
7,659 |
|
|
|
|
2016 |
|
Mexico |
|
7 |
|
|
|
|
40,853 |
|
|
|
- |
|
|
|
46,942 |
|
|
|
40,853 |
|
|
|
46,942 |
|
|
|
87,795 |
|
|
|
|
|
|
Subtotal North American Markets: |
|
45 |
|
|
|
|
242,857 |
|
|
|
- |
|
|
|
304,740 |
|
|
|
242,857 |
|
|
|
304,740 |
|
|
|
547,597 |
|
|
|
|
|
|
|
|
|
|
|
|
|
|
|
|
|
|
|
|
|
|
|
|
|
|
|
|
|
|
|
|
|
|
|
|
|
|
|
|
European Markets |
|
|
|
|
|
|
|
|
|
|
|
|
|
|
|
|
|
|
|
|
|
|
|
|
|
|
|
|
|
|
|
|
|
Czech Republic |
|
|
|
|
|
|
|
|
|
|
|
|
|
|
|
|
|
|
|
|
|
|
|
|
|
|
|
|
|
|
|
|
|
Prague Airport Distribution Center |
|
1 |
|
|
|
|
1,858 |
|
|
|
- |
|
|
|
1,444 |
|
|
|
1,858 |
|
|
|
1,444 |
|
|
|
3,302 |
|
|
|
|
|
|
Prague Rudna Distribution Center |
|
1 |
|
|
|
|
6,540 |
|
|
|
- |
|
|
|
8,971 |
|
|
|
6,540 |
|
|
|
8,971 |
|
|
|
15,511 |
|
|
|
|
2016 |
|
Czech Republic |
|
2 |
|
|
|
|
8,398 |
|
|
|
- |
|
|
|
10,415 |
|
|
|
8,398 |
|
|
|
10,415 |
|
|
|
18,813 |
|
|
|
|
|
|
|
|
|
|
|
|
|
|
|
|
|
|
|
|
|
|
|
|
|
|
|
|
|
|
|
|
|
|
|
|
|
|
|
|
France |
|
|
|
|
|
|
|
|
|
|
|
|
|
|
|
|
|
|
|
|
|
|
|
|
|
|
|
|
|
|
|
|
|
Isle d'Abeau Distribution Center |
|
1 |
|
|
|
|
7,492 |
|
|
|
- |
|
|
|
7,348 |
|
|
|
7,492 |
|
|
|
7,348 |
|
|
|
14,840 |
|
|
|
|
2016 |
|
Le Havre Distribution Center |
|
2 |
|
|
|
|
868 |
|
|
|
- |
|
|
|
25,104 |
|
|
|
868 |
|
|
|
25,104 |
|
|
|
25,972 |
|
|
|
|
2016 |
|
Moissy II Distribution Center |
|
1 |
|
|
|
|
2,459 |
|
|
|
- |
|
|
|
2,131 |
|
|
|
2,459 |
|
|
|
2,131 |
|
|
|
4,590 |
|
|
|
|
|
|
France |
|
4 |
|
|
|
|
10,819 |
|
|
|
- |
|
|
|
34,583 |
|
|
|
10,819 |
|
|
|
34,583 |
|
|
|
45,402 |
|
|
|
|
|
|
|
|
|
|
|
|
|
|
|
|
|
|
|
|
|
|
|
|
|
|
|
|
|
|
|
|
|
|
|
|
|
|
|
|
Germany |
|
|
|
|
|
|
|
|
|
|
|
|
|
|
|
|
|
|
|
|
|
|
|
|
|
|
|
|
|
|
|
|
|
Bremen Distribution Center |
|
1 |
|
|
|
|
1,275 |
|
|
|
- |
|
|
|
5,198 |
|
|
|
1,275 |
|
|
|
5,198 |
|
|
|
6,473 |
|
|
|
|
|
|
Hamm Distribution Center 1 |
|
1 |
|
|
|
|
4,699 |
|
|
|
- |
|
|
|
- |
|
|
|
4,699 |
|
|
|
- |
|
|
|
4,699 |
|
|
|
|
|
|
Krefeld Park |
|
1 |
|
|
|
|
1,372 |
|
|
|
- |
|
|
|
3,378 |
|
|
|
1,372 |
|
|
|
3,378 |
|
|
|
4,750 |
|
|
|
|
|
|
Germany |
|
3 |
|
|
|
|
7,346 |
|
|
|
- |
|
|
|
8,576 |
|
|
|
7,346 |
|
|
|
8,576 |
|
|
|
15,922 |
|
|
|
|
|
111
PROLOGIS, INC. AND PROLOGIS, L.P.
SCHEDULE III – REAL ESTATE AND ACCUMULATED DEPRECIATION
DECEMBER 31, 2016
(In thousands of U.S. dollars, as applicable)
|
|
|
|
|
|
|
|
|
Initial Cost to Prologis |
|
|
Costs Capitalized |
|
|
Gross Amounts at Which Carried at December 31, 2016 |
|
|
|
|
|
|
|
|||||||||||||||
|
Description |
|
No. of Bldgs. |
|
|
Encum- brances |
|
Land |
|
|
Building & Improvements |
|
|
Subsequent to Acquisition |
|
|
Land |
|
|
Building & Improvements |
|
|
Total (a,b) |
|
|
Accumulated Depreciation (c) |
|
|
Date of Construction/ Acquisition |
||||||||
|
Hungary |
|
|
|
|
|
|
|
|
|
|
|
|
|
|
|
|
|
|
|
|
|
|
|
|
|
|
|
|
|
|
|
|
|
|
|
|
|
Budapest-Sziget Distribution Center |
|
3 |
|
|
|
|
|
4,250 |
|
|
|
- |
|
|
|
9,381 |
|
|
|
4,250 |
|
|
|
9,381 |
|
|
|
13,631 |
|
|
|
|
|
|
2016 |
|
|
Hungary |
|
3 |
|
|
|
|
|
4,250 |
|
|
|
- |
|
|
|
9,381 |
|
|
|
4,250 |
|
|
|
9,381 |
|
|
|
13,631 |
|
|
|
|
|
|
|
|
|
|
|
|
|
|
|
|
|
|
|
|
|
|
|
|
|
|
|
|
|
|
|
|
|
|
|
|
|
|
|
|
|
|
|
|
|
|
|
Italy |
|
|
|
|
|
|
|
|
|
|
|
|
|
|
|
|
|
|
|
|
|
|
|
|
|
|
|
|
|
|
|
|
|
|
|
|
|
Bologna Distribution Center |
|
1 |
|
|
|
|
|
2,291 |
|
|
|
- |
|
|
|
961 |
|
|
|
2,291 |
|
|
|
961 |
|
|
|
3,252 |
|
|
|
|
|
|
|
|
|
Italy |
|
1 |
|
|
|
|
|
2,291 |
|
|
|
- |
|
|
|
961 |
|
|
|
2,291 |
|
|
|
961 |
|
|
|
3,252 |
|
|
|
|
|
|
|
|
|
|
|
|
|
|
|
|
|
|
|
|
|
|
|
|
|
|
|
|
|
|
|
|
|
|
|
|
|
|
|
|
|
|
|
|
|
|
|
Netherlands |
|
|
|
|
|
|
|
|
|
|
|
|
|
|
|
|
|
|
|
|
|
|
|
|
|
|
|
|
|
|
|
|
|
|
|
|
|
Nieuwegein Distribution Center |
|
1 |
|
|
|
|
|
6,551 |
|
|
|
- |
|
|
|
7,766 |
|
|
|
6,551 |
|
|
|
7,766 |
|
|
|
14,317 |
|
|
|
|
|
|
|
|
|
Venlo Distribution Center |
|
1 |
|
|
|
|
|
13,125 |
|
|
|
- |
|
|
|
13,297 |
|
|
|
13,125 |
|
|
|
13,297 |
|
|
|
26,422 |
|
|
|
|
|
|
|
|
|
Netherlands |
|
2 |
|
|
|
|
|
19,676 |
|
|
|
- |
|
|
|
21,063 |
|
|
|
19,676 |
|
|
|
21,063 |
|
|
|
40,739 |
|
|
|
|
|
|
|
|
|
|
|
|
|
|
|
|
|
|
|
|
|
|
|
|
|
|
|
|
|
|
|
|
|
|
|
|
|
|
|
|
|
|
|
|
|
|
|
Poland |
|
|
|
|
|
|
|
|
|
|
|
|
|
|
|
|
|
|
|
|
|
|
|
|
|
|
|
|
|
|
|
|
|
|
|
|
|
Chorzow Distribution Center |
|
1 |
|
|
|
|
|
3,684 |
|
|
|
- |
|
|
|
7,096 |
|
|
|
3,684 |
|
|
|
7,096 |
|
|
|
10,780 |
|
|
|
|
|
|
2016 |
|
|
Piotrkow II Distribution Center |
|
1 |
|
|
|
|
|
2,252 |
|
|
|
- |
|
|
|
9,880 |
|
|
|
2,252 |
|
|
|
9,880 |
|
|
|
12,132 |
|
|
|
|
|
|
|
|
|
Strykow |
|
2 |
|
|
|
|
|
4,646 |
|
|
|
- |
|
|
|
6,789 |
|
|
|
4,646 |
|
|
|
6,789 |
|
|
|
11,435 |
|
|
|
|
|
|
|
|
|
Szczecin Distribution Center |
|
1 |
|
|
|
|
|
329 |
|
|
|
- |
|
|
|
2,666 |
|
|
|
329 |
|
|
|
2,666 |
|
|
|
2,995 |
|
|
|
|
|
|
|
|
|
Poland |
|
5 |
|
|
|
|
|
10,911 |
|
|
|
- |
|
|
|
26,431 |
|
|
|
10,911 |
|
|
|
26,431 |
|
|
|
37,342 |
|
|
|
|
|
|
|
|
|
|
|
|
|
|
|
|
|
|
|
|
|
|
|
|
|
|
|
|
|
|
|
|
|
|
|
|
|
|
|
|
|
|
|
|
|
|
|
Slovakia |
|
|
|
|
|
|
|
|
|
|
|
|
|
|
|
|
|
|
|
|
|
|
|
|
|
|
|
|
|
|
|
|
|
|
|
|
|
Galanta Distribution Center |
|
1 |
|
|
|
|
|
5,296 |
|
|
|
- |
|
|
|
2,569 |
|
|
|
5,296 |
|
|
|
2,569 |
|
|
|
7,865 |
|
|
|
|
|
|
|
|
|
ProLogis Park Nove Mesto |
|
1 |
|
|
|
|
|
2,473 |
|
|
|
- |
|
|
|
5,941 |
|
|
|
2,473 |
|
|
|
5,941 |
|
|
|
8,414 |
|
|
|
|
|
|
|
|
|
Slovakia |
|
2 |
|
|
|
|
|
7,769 |
|
|
|
- |
|
|
|
8,510 |
|
|
|
7,769 |
|
|
|
8,510 |
|
|
|
16,279 |
|
|
|
|
|
|
|
|
|
|
|
|
|
|
|
|
|
|
|
|
|
|
|
|
|
|
|
|
|
|
|
|
|
|
|
|
|
|
|
|
|
|
|
|
|
|
|
Spain |
|
|
|
|
|
|
|
|
|
|
|
|
|
|
|
|
|
|
|
|
|
|
|
|
|
|
|
|
|
|
|
|
|
|
|
|
|
Massalaves Distribution Center |
|
1 |
|
|
|
|
|
4,809 |
|
|
|
- |
|
|
|
303 |
|
|
|
4,809 |
|
|
|
303 |
|
|
|
5,112 |
|
|
|
|
|
|
|
|
|
San Fernando Distribution Center |
|
1 |
|
|
|
|
|
6,350 |
|
|
|
- |
|
|
|
28 |
|
|
|
6,350 |
|
|
|
28 |
|
|
|
6,378 |
|
|
|
|
|
|
|
|
|
Spain |
|
2 |
|
|
|
|
|
11,159 |
|
|
|
- |
|
|
|
331 |
|
|
|
11,159 |
|
|
|
331 |
|
|
|
11,490 |
|
|
|
|
|
|
|
|
|
|
|
|
|
|
|
|
|
|
|
|
|
|
|
|
|
|
|
|
|
|
|
|
|
|
|
|
|
|
|
|
|
|
|
|
|
|
|
Sweden |
|
|
|
|
|
|
|
|
|
|
|
|
|
|
|
|
|
|
|
|
|
|
|
|
|
|
|
|
|
|
|
|
|
|
|
|
|
Gothenburg Distribution Center |
|
2 |
|
|
|
|
|
13,142 |
|
|
|
- |
|
|
|
14,638 |
|
|
|
13,142 |
|
|
|
14,638 |
|
|
|
27,780 |
|
|
|
|
|
|
|
|
|
Sweden |
|
2 |
|
|
|
|
|
13,142 |
|
|
|
- |
|
|
|
14,638 |
|
|
|
13,142 |
|
|
|
14,638 |
|
|
|
27,780 |
|
|
|
|
|
|
|
|
|
|
|
|
|
|
|
|
|
|
|
|
|
|
|
|
|
|
|
|
|
|
|
|
|
|
|
|
|
|
|
|
|
|
|
|
|
|
|
United Kingdom |
|
|
|
|
|
|
|
|
|
|
|
|
|
|
|
|
|
|
|
|
|
|
|
|
|
|
|
|
|
|
|
|
|
|
|
|
|
Birmingham International Gateway Distribution Center |
|
4 |
|
|
|
|
|
13,835 |
|
|
|
- |
|
|
|
9,616 |
|
|
|
13,835 |
|
|
|
9,616 |
|
|
|
23,451 |
|
|
|
|
|
|
2016 |
|
|
Daventry Phase II Distribution Center |
|
1 |
|
|
|
|
|
5,524 |
|
|
|
- |
|
|
|
602 |
|
|
|
5,524 |
|
|
|
602 |
|
|
|
6,126 |
|
|
|
|
|
|
|
|
|
Dirft Distribution Center |
|
1 |
|
|
|
|
|
3,945 |
|
|
|
- |
|
|
|
123 |
|
|
|
3,945 |
|
|
|
123 |
|
|
|
4,068 |
|
|
|
|
|
|
|
|
|
Marston Gate Distribution Center |
|
2 |
|
|
|
|
|
13,735 |
|
|
|
- |
|
|
|
9,714 |
|
|
|
13,735 |
|
|
|
9,714 |
|
|
|
23,449 |
|
|
|
|
|
|
|
|
|
North Kettering Business Park |
|
1 |
|
|
|
|
|
2,367 |
|
|
|
- |
|
|
|
32 |
|
|
|
2,367 |
|
|
|
32 |
|
|
|
2,399 |
|
|
|
|
|
|
|
|
|
Stockly Park Distribution Center |
|
2 |
|
|
|
|
|
24,153 |
|
|
|
- |
|
|
|
16,910 |
|
|
|
24,153 |
|
|
|
16,910 |
|
|
|
41,063 |
|
|
|
|
|
|
2016 |
|
|
United Kingdom |
|
11 |
|
|
|
|
|
63,559 |
|
|
|
- |
|
|
|
36,997 |
|
|
|
63,559 |
|
|
|
36,997 |
|
|
|
100,556 |
|
|
|
|
|
|
|
|
|
Subtotal European Markets: |
|
37 |
|
|
|
|
|
159,320 |
|
|
|
- |
|
|
|
171,886 |
|
|
|
159,320 |
|
|
|
171,886 |
|
|
|
331,206 |
|
|
|
|
|
|
|
|
|
|
|
|
|
|
|
|
|
|
|
|
|
|
|
|
|
|
|
|
|
|
|
|
|
|
|
|
|
|
|
|
|
|
|
|
|
|
|
Asian Markets |
|
|
|
|
|
|
|
|
|
|
|
|
|
|
|
|
|
|
|
|
|
|
|
|
|
|
|
|
|
|
|
|
|
|
|
|
|
Japan |
|
|
|
|
|
|
|
|
|
|
|
|
|
|
|
|
|
|
|
|
|
|
|
|
|
|
|
|
|
|
|
|
|
|
|
|
|
Chiba New Town Distribution Center |
|
1 |
|
|
|
|
|
31,406 |
|
|
|
- |
|
|
|
124,053 |
|
|
|
31,406 |
|
|
|
124,053 |
|
|
|
155,459 |
|
|
|
|
|
|
|
|
|
Higashi Matsuyama Distribution Center |
|
1 |
|
|
|
|
|
13,402 |
|
|
|
- |
|
|
|
7,841 |
|
|
|
13,402 |
|
|
|
7,841 |
|
|
|
21,243 |
|
|
|
|
|
|
|
|
|
Ibaraki Distribution Center |
|
1 |
|
|
|
|
|
43,515 |
|
|
|
- |
|
|
|
178,641 |
|
|
|
43,515 |
|
|
|
178,641 |
|
|
|
222,156 |
|
|
|
|
|
|
2016 |
|
|
Koga Distribution Center |
|
2 |
|
|
|
|
|
8,257 |
|
|
|
- |
|
|
|
12,090 |
|
|
|
8,257 |
|
|
|
12,090 |
|
|
|
20,347 |
|
|
|
|
|
|
|
|
|
Narashino IV Distribution Center |
|
1 |
|
|
|
|
|
19,424 |
|
|
|
- |
|
|
|
66,114 |
|
|
|
19,424 |
|
|
|
66,114 |
|
|
|
85,538 |
|
|
|
|
|
|
2016 |
|
|
Shiohama Distribution Center |
|
1 |
|
|
|
|
|
35,058 |
|
|
|
- |
|
|
|
13,478 |
|
|
|
35,058 |
|
|
|
13,478 |
|
|
|
48,536 |
|
|
|
|
|
|
|
|
|
Japan |
|
7 |
|
|
|
|
|
151,062 |
|
|
|
- |
|
|
|
402,217 |
|
|
|
151,062 |
|
|
|
402,217 |
|
|
|
553,279 |
|
|
|
|
|
|
|
|
|
Subtotal Asian Markets: |
|
7 |
|
|
|
|
|
151,062 |
|
|
|
- |
|
|
|
402,217 |
|
|
|
151,062 |
|
|
|
402,217 |
|
|
|
553,279 |
|
|
|
|
|
|
|
|
|
Total Development Portfolio |
|
89 |
|
|
|
|
|
553,239 |
|
|
|
- |
|
|
|
878,843 |
|
|
|
553,239 |
|
|
|
878,843 |
|
|
|
1,432,082 |
|
|
|
|
|
|
|
|
|
|
|
|
|
|
|
|
|
|
|
|
|
|
|
|
|
|
|
|
|
|
|
|
|
|
|
|
|
|
|
|
|
|
|
|
|
|
|
GRAND TOTAL |
|
|
1,865 |
|
|
|
|
|
6,486,869 |
|
|
|
14,473,118 |
|
|
|
4,415,552 |
|
|
|
6,590,782 |
|
|
|
18,784,757 |
|
|
|
25,375,539 |
|
|
|
(3,679,479 |
) |
|
|
112
|
(a) |
The following table reconciles real estate assets per Schedule III to the Consolidated Balance Sheet in Item 8. Financial Statements and Supplementary Data at December 31, 2016 (in thousands): |
|
Total per Schedule III |
|
$ |
25,375,539 |
|
|
|
Land |
|
|
1,218,904 |
|
|
|
Other real estate investments |
|
|
524,887 |
|
|
|
Total per consolidated balance sheet |
|
$ |
27,119,330 |
|
(f) |
|
(b) |
The aggregate cost for federal tax purposes at December 31, 2016, of our real estate assets was approximately $16.1 billion (unaudited). |
|
(c) |
Real estate assets (excluding land balances) are depreciated over their estimated useful lives. These useful lives are generally 5 to 7 years for capital improvements, 10 years for standard tenant improvements, 25 years for depreciable land improvements, 30 years for operating properties acquired and 40 years for operating properties we develop. |
The following table reconciles accumulated depreciation per Schedule III to the Consolidated Balance Sheet in Item 8. Financial Statements and Supplementary Data at December 31, 2016 (in thousands):
|
Total accumulated depreciation per Schedule III |
|
$ |
3,679,479 |
|
|
Accumulated depreciation on other real estate investments |
|
|
78,893 |
|
|
Total per consolidated balance sheet |
|
$ |
3,758,372 |
|
|
(d) |
Properties with an aggregate undepreciated cost of $5.2 billion secure $2.7 billion of mortgage notes. See Note 9 to the Consolidated Financial Statements in Item 8. Financial Statements and Supplementary Data for more information related to our secured mortgage debt. |
|
(e) |
Assessment bonds of $14.5 million are secured by assessments (similar to property taxes) on various underlying real estate properties with an aggregate undepreciated cost of $737.4 million. See Note 9 to the Consolidated Financial Statements in Item 8. Financial Statements and Supplementary Data for more information related to our assessment bonds. |
|
(f) |
The following table summarizes our real estate assets and accumulated depreciation for the years ended December 31 (in thousands): |
|
|
|
2016 |
|
|
2015 |
|
|
2014 |
|
|||
|
Real estate assets: |
|
|
|
|
|
|
|
|
|
|
|
|
|
Balance at beginning of year |
|
$ |
25,608,648 |
|
|
$ |
20,109,432 |
|
|
$ |
18,822,081 |
|
|
Acquisitions of operating properties, improvements to operating properties development activity, transfers of land to CIP and net effect of changes in foreign exchange rates and other |
|
|
1,883,888 |
|
|
|
7,191,335 |
|
|
|
3,595,836 |
|
|
Basis of operating properties disposed of |
|
|
(1,359,186 |
) |
|
|
(1,719,632 |
) |
|
|
(2,713,300 |
) |
|
Change in the development portfolio balance, including the acquisition of properties |
|
|
(440,821 |
) |
|
|
398,923 |
|
|
|
452,963 |
|
|
Assets transferred to held-for-sale |
|
|
(316,990 |
) |
|
|
(371,410 |
) |
|
|
(48,148 |
) |
|
Balance at end year |
|
$ |
25,375,539 |
|
|
$ |
25,608,648 |
|
|
$ |
20,109,432 |
|
|
|
|
|
|
|
|
|
|
|
|
|
|
|
|
Accumulated depreciation: |
|
|
|
|
|
|
|
|
|
|
|
|
|
Balance at beginning of year |
|
$ |
3,207,855 |
|
|
$ |
2,748,835 |
|
|
$ |
2,540,267 |
|
|
Depreciation expense |
|
|
668,686 |
|
|
|
617,258 |
|
|
|
490,298 |
|
|
Balances retired upon disposition of operating properties and net effect of changes in foreign exchange rates and other |
|
|
(195,895 |
) |
|
|
(153,621 |
) |
|
|
(277,516 |
) |
|
Assets transferred to held-for-sale |
|
|
(1,167 |
) |
|
|
(4,617 |
) |
|
|
(4,214 |
) |
|
Balance at end of year |
|
$ |
3,679,479 |
|
|
$ |
3,207,855 |
|
|
$ |
2,748,835 |
|
113
Pursuant to the requirements of Section 13 or 15(d) of the Securities Exchange Act of 1934, the registrant has duly caused this report to be signed on its behalf by the undersigned, thereunto duly authorized.
|
PROLOGIS, INC. |
||
|
|
|
|
|
By: |
|
/s/ HAMID R. MOGHADAM |
|
|
|
Hamid R. Moghadam |
|
|
|
Chief Executive Officer |
Date: February 14, 2017
POWER OF ATTORNEY
KNOW ALL MEN BY THESE PRESENTS, that we, the undersigned officers and directors of Prologis, Inc., hereby severally constitute Hamid R. Moghadam, Thomas S. Olinger and Edward S. Nekritz, and each of them singly, our true and lawful attorneys with full power to them, and each of them singly, to sign for us and in our names in the capacities indicated below, the Form 10-K filed herewith and any and all amendments to said Form 10-K, and generally to do all such things in our names and in our capacities as officers and directors to enable Prologis, Inc. to comply with the provisions of the Securities Exchange Act of 1934, and all requirements of the U.S. Securities and Exchange Commission, hereby ratifying and confirming our signatures as they may be signed by our said attorneys, or any of them, to said Form 10-K and any and all amendments thereto.
Pursuant to the requirements of the Securities Exchange Act of 1934, this report has been signed below by the following persons on behalf of the registrant and in the capacities and on the dates indicated.
|
Signature |
|
Title |
|
Date |
|
|
|
|
|
|
|
/s/ HAMID R. MOGHADAM |
|
Chairman of the Board and Chief Executive Officer |
|
February 14, 2017 |
|
Hamid R. Moghadam |
|
|
||
|
|
|
|
|
|
|
/s/ THOMAS S. OLINGER |
|
Chief Financial Officer |
|
February 14, 2017 |
|
Thomas S. Olinger |
|
|
||
|
|
|
|
|
|
|
/s/ LORI A. PALAZZOLO |
|
Managing Director and Chief Accounting Officer |
|
February 14, 2017 |
|
Lori A. Palazzolo |
|
|
||
|
|
|
|
|
|
|
/s/ GEORGE L. FOTIADES |
|
Director |
|
February 14, 2017 |
|
George L. Fotiades |
|
|
||
|
|
|
|
|
|
|
/s/ CHRISTINE N. GARVEY |
|
Director |
|
February 14, 2017 |
|
Christine N. Garvey |
|
|
||
|
|
|
|
|
|
|
/s/ LYDIA H. KENNARD |
|
Director |
|
February 14, 2017 |
|
Lydia H. Kennard |
|
|
||
|
|
|
|
|
|
|
/s/ J. MICHAEL LOSH |
|
Director |
|
February 14, 2017 |
|
J. Michael Losh |
|
|
|
|
|
|
|
|
|
|
|
/s/ IRVING F. LYONS III |
|
Director |
|
February 14, 2017 |
|
Irving F. Lyons III |
|
|
|
|
|
|
|
|
|
|
|
/s/ DAVID P. O’CONNOR |
|
Director |
|
February 14, 2017 |
|
David P. O’Connor |
|
|
|
|
|
|
|
|
|
|
|
/s/ JEFFREY L. SKELTON |
|
Director |
|
February 14, 2017 |
|
Jeffrey L. Skelton |
|
|
|
|
|
|
|
|
|
|
|
/s/ CARL B. WEBB |
|
Director |
|
February 14, 2017 |
|
Carl B. Webb |
|
|
|
|
|
|
|
|
|
|
|
/s/ WILLIAM D. ZOLLARS |
|
Director |
|
February 14, 2017 |
|
William D. Zollars |
|
|
|
|
114
Pursuant to the requirements of Section 13 or 15(d) of the Securities Exchange Act of 1934, the registrant has duly caused this report to be signed on its behalf by the undersigned, thereunto duly authorized.
|
PROLOGIS, L.P. |
||
|
By: |
|
Prologis, Inc., its general partner |
|
|
|
|
|
By: |
|
/s/ HAMID R. MOGHADAM |
|
|
|
Hamid R. Moghadam |
|
|
|
Chief Executive Officer |
Date: February 14, 2017
POWER OF ATTORNEY
KNOW ALL MEN BY THESE PRESENTS, that we, the undersigned officers and directors of Prologis, L.P., hereby severally constitute Hamid R. Moghadam, Thomas S. Olinger and Edward S. Nekritz, and each of them singly, our true and lawful attorneys with full power to them, and each of them singly, to sign for us and in our names in the capacities indicated below, the Form 10-K filed herewith and any and all amendments to said Form 10-K, and generally to do all such things in our names and in our capacities as officers and directors to enable Prologis, L.P. to comply with the provisions of the Securities Exchange Act of 1934, and all requirements of the U.S. Securities and Exchange Commission, hereby ratifying and confirming our signatures as they may be signed by our said attorneys, or any of them, to said Form 10-K and any and all amendments thereto.
Pursuant to the requirements of the Securities Exchange Act of 1934, this report has been signed below by the following persons on behalf of the registrant and in the capacities and on the dates indicated.
|
Signature |
|
Title |
|
Date |
|
|
|
|
|
|
|
/s/ HAMID R. MOGHADAM |
|
Chairman of the Board and Chief Executive Officer |
|
February 14, 2017
|
|
Hamid R. Moghadam |
|
|
||
|
|
|
|
|
|
|
/s/ THOMAS S. OLINGER |
|
Chief Financial Officer |
|
February 14, 2017
|
|
Thomas S. Olinger |
|
|
||
|
|
|
|
|
|
|
/s/ LORI A. PALAZZOLO |
|
Managing Director and Chief Accounting Officer |
|
February 14, 2017
|
|
Lori A. Palazzolo |
|
|
||
|
|
|
|
|
|
|
/s/ GEORGE L. FOTIADES |
|
Director |
|
February 14, 2017
|
|
George L. Fotiades |
|
|
||
|
|
|
|
|
|
|
/s/ CHRISTINE N. GARVEY |
|
Director |
|
February 14, 2017
|
|
Christine N. Garvey |
|
|
||
|
|
|
|
|
|
|
/s/ LYDIA H. KENNARD |
|
Director |
|
February 14, 2017
|
|
Lydia H. Kennard |
|
|
||
|
|
|
|
|
|
|
/s/ J. MICHAEL LOSH |
|
Director |
|
February 14, 2017 |
|
J. Michael Losh |
|
|
|
|
|
|
|
|
|
|
|
/s/ IRVING F. LYONS III |
|
Director |
|
February 14, 2017 |
|
Irving F. Lyons III |
|
|
|
|
|
|
|
|
|
|
|
/s/ DAVID P. O’CONNOR |
|
Director |
|
February 14, 2017 |
|
David P. O’Connor |
|
|
|
|
|
|
|
|
|
|
|
/s/ JEFFREY L. SKELTON |
|
Director |
|
February 14, 2017 |
|
Jeffrey L. Skelton |
|
|
|
|
|
|
|
|
|
|
|
/s/ CARL B. WEBB |
|
Director |
|
February 14, 2017 |
|
Carl B. Webb |
|
|
|
|
|
|
|
|
|
|
|
/s/ WILLIAM D. ZOLLARS |
|
Director |
|
February 14, 2017 |
|
William D. Zollars |
|
|
|
|
115
Certain of the following documents are filed herewith. Certain other of the following documents that have been previously filed with the Securities and Exchange Commission and, pursuant to Rule 12b-32, are incorporated herein by reference.
|
1.1 |
|
Equity Distribution Agreement, dated as of February 5, 2015, among Prologis, Inc. and Merrill Lynch, Pierce, Fenner & Smith Incorporated, Citigroup Global Markets Inc., Goldman, Sachs & Co., J.P. Morgan Securities LLC, Morgan Stanley & Co. LLC and Wells Fargo Securities, LLC. (incorporated by reference to Exhibit 1.1 to Prologis’ Current Report on Form 8-K filed February 5, 2015).
|
|
3.1 |
|
Articles of Incorporation of Prologis (incorporated by reference to Exhibit 3.1 to Prologis’ Registration Statement on Form S-11 (No. 333-35915) filed September 18, 1997). |
|
3.2 |
|
Articles Supplementary establishing and fixing the rights and preferences of the Series Q Cumulative Redeemable Preferred Stock of Prologis (incorporated by reference to Exhibit 3.4 to Prologis’ Registration Statement on Form 8-A filed June 2, 2011). |
|
3.3 |
|
Articles of Merger of New Pumpkin Inc., a Maryland corporation, with and into Prologis, Inc., a Maryland corporation, changing the name of “AMB Property Corporation” to “Prologis, Inc.”, as filed with the Stated Department of Assessments and Taxation of Maryland on June 2, 2011, and effective June 3, 2011 (incorporated by reference to Exhibit 3.1 to Prologis’ Current Report on Form 8-K filed June 8, 2011). |
|
3.4 |
|
Articles of Amendment (incorporated by reference to Exhibit 3.1 to Prologis’ Current Report on Form 8-K filed May 8, 2012). |
|
3.5 |
|
Thirteenth Amended and Restated Agreement of Limited Partnership of the Operating Partnership (incorporated by reference to Exhibit 3.6 to Prologis’ Current Report on Form 8-K filed June 8, 2011). |
|
3.6 |
|
First Amendment to Thirteenth Amended and Restated Agreement of Limited Partnership of Prologis, L.P., dated February 27, 2014, (incorporated by reference to Exhibit 3.1 to Prologis’ Current Report on Form 8-K filed on February 27, 2014). |
|
3.7 |
|
Second Amendment to the Thirteenth Amended and Restated Agreement of the Limited Partnership of Prologis, L.P., dated October 7, 2015 (incorporated by reference to Exhibit 3.1 to Prologis’ Current Report on Form 8-K filed on October 13, 2015). |
|
3.8 |
|
Amended and Restated Certificate of Limited Partnership of the Operating Partnership (incorporated by reference to Exhibit 3.7 to Prologis’ Current Report on Form 8-K filed June 8, 2011). |
|
3.9 |
|
Articles Supplementary dated April 3, 2014, (incorporated by reference to Exhibit 3.1 to Prologis’ Current Report on Form 8-K filed on April 3, 2014). |
|
3.10 |
|
Eighth Amended and Restated Bylaws of Prologis, Inc. (incorporated by reference to Exhibit 3.1 to Prologis’ Current Report on Form 8-K filed on September 23, 2016). |
|
4.1 |
|
Form of Certificate for Common Stock of Prologis (incorporated by reference to Exhibit 4.1 to Prologis’ Registration Statement on Form S-4/A (No. 333-172741) filed April 12, 2011). |
|
4.2 |
|
Form of Certificate for the Series Q Cumulative Redeemable Preferred Stock of Prologis (incorporated by reference to Exhibit 4.2 to Prologis’ Registration Statement on Form S-4/A (No. 333-172741) filed April 28, 2011). |
|
4.3 |
|
Indenture, dated as of June 8, 2011, by and among the Operating Partnership, as issuer, Prologis, as guarantor, and U.S. Bank National Association, as trustee (incorporated by reference to Exhibit 4.2 to Prologis’ Registration Statement on Form S-3 (No. 333-177112) filed September 30, 2011). |
|
4.4 |
|
Fifth Supplemental Indenture, dated as of August 15, 2013, among Prologis, Inc., Prologis, L.P. and U.S. Bank National Association (incorporated by reference to Exhibit 4.1 to Prologis’ Current Report on Form 8-K filed August 15, 2013). |
|
4.5 |
|
Form of Sixth Supplemental Indenture among Prologis, Inc., Prologis, L.P., Elavon Financial Services Limited, UK Branch, Elavon Financial Services Limited and U.S. Bank National Association (incorporated by reference to Exhibit 4.1 to Prologis’ Current Report on Form 8-K filed |
|
4.6 |
|
Form of Seventh Supplemental Indenture among Prologis, Inc., Prologis, L.P., Elavon Financial Services Limited, UK Branch, Elavon Financial Services Limited and U.S. Bank National Association (incorporated by reference to Exhibit 4.1 to Prologis’ Current Report on Form 8-K filed February 18, 2014). |
|
4.7 |
|
Indenture, dated as of June 30, 1998, by and among the Operating Partnership, Prologis and State Street Bank and Trust Company of California, N.A., as trustee (incorporated by reference to Exhibit 4.1 to Prologis’ Current Report on Form 8-K filed August 10, 2006 and also incorporated by reference to Exhibit 4.1 to the Operating Partnership’s Current Report on Form 8-K filed August 10, 2006). |
116
|
|
First Supplemental Indenture, dated as of June 30, 1998, by and among the Operating Partnership, Prologis and State Street Bank and Trust Company of California, N.A., as trustee (incorporated by reference to Exhibit 4.2 to Prologis’ Registration Statement on Form S-11 (No. 333-49163) filed |
|
|
4.9 |
|
Second Supplemental Indenture, dated as of June 30, 1998, by and among the Operating Partnership, Prologis and State Street Bank and Trust Company of California, N.A., as trustee (incorporated by reference to Exhibit 4.3 to Prologis’ Registration Statement on Form S-11 (No. 333-49163) filed April 2, 1998). |
|
4.10 |
|
Third Supplemental Indenture, dated as of June 30, 1998, by and among the Operating Partnership, Prologis and State Street Bank and Trust Company of California, N.A., as trustee (incorporated by reference to Exhibit 4.4 to Prologis’ Registration Statement on Form S-11 (No. 333-49163) filed |
|
4.11 |
|
Seventh Supplemental Indenture, dated as of August 10, 2006, by and among the Operating Partnership, Prologis and U.S. Bank National Association, as successor-in-interest to State Street Bank and Trust Company of California, N.A., as trustee (incorporated by reference to Exhibit 4.2 to Prologis’ Current Report on Form 8-K filed August 10, 2006 and also incorporated by reference to Exhibit 4.2 to the Operating Partnership’s Current Report on Form 8-K filed August 10, 2006). |
|
4.12 |
|
Eighth Supplemental Indenture, dated as of November 20, 2009, by and among the Operating Partnership, Prologis and U.S. Bank National Association, as successor-in-interest to State Street Bank and Trust Company of California, N.A., as trustee (incorporated by reference to Exhibit 4.1 to Prologis’ Current Report on Form 8-K filed November 20, 2009). |
|
4.13 |
|
Ninth Supplemental Indenture, dated as of November 20, 2009, by and among the Operating Partnership, Prologis and U.S. Bank National Association, as successor-in-interest to State Street Bank and Trust Company of California, N.A., as trustee (incorporated by reference to Exhibit 4.2 to Prologis’ Current Report on Form 8-K filed November 20, 2009). |
|
4.14 |
|
Tenth Supplemental Indenture, dated as of August 9, 2010, by and among the Operating Partnership, Prologis and U.S. Bank National Association, as successor-in-interest to State Street Bank and Trust Company of California, N.A., as trustee (incorporated by reference to Exhibit 4.1 to Prologis’ Current Report on Form 8-K filed August 9, 2010). |
|
4.15 |
|
Eleventh Supplemental Indenture, dated as of November 12, 2010, by and among the Operating Partnership, Prologis and U.S. Bank National Association, as successor-in-interest to State Street Bank and Trust Company of California, N.A., as trustee (incorporated by reference to Exhibit 4.1 to Prologis’ Current Report on Form 8-K filed November 10, 2010). |
|
4.16 |
|
4.00% Notes due 2018 and Related Guarantee (incorporated by reference to Exhibit 4.2 to Prologis’ Current Report on Form 8-K filed November 10, 2010). |
|
4.17 |
|
Form of 2.750% Notes due 2019 (incorporated by reference to Exhibit 4.4 to Prologis’ Current Report on Form 8-K filed August 15, 2013). |
|
4.18 |
|
Form of 4.250% Notes due 2023 (incorporated by reference to Exhibit 4.5 to Prologis’ Current Report on Form 8-K filed August 15, 2013). |
|
4.19 |
|
3.350% Notes due 2021 (incorporated by reference to Exhibit 4.2 to Prologis’ Current Report on Form 8-K filed November 1, 2013). |
|
4.20 |
|
Form of 3.000% Notes due 2022 (incorporated by reference to Exhibit 4.2 to Prologis’ Current Report on Form 8-K filed December 2, 2013). |
|
4.21 |
|
Form of 3.375% Notes due 2024 (incorporated by reference to Exhibit 4.3 to Prologis’ Current Report on Form 8-K filed February 18, 2014). |
|
4.22 |
|
Form of 3.00% Notes due 2026 (incorporated by reference to Exhibit 4.2 to Prologis’ Current Report on Form 8-K filed on May 28, 2014). |
|
4.23 |
|
Form of 1.375% Notes due 2020 (incorporated by reference to Exhibit 4.2 to Prologis’ Current Report on Form 8-K filed on October 6, 2014). |
|
4.24 |
|
Officers’ Certificate related to the 2.750% Notes due 2019 (incorporated by reference to Exhibit 4.2 to Prologis’ Current Report on Form 8-K filed August 15, 2013). |
|
4.25 |
|
Officers’ Certificate related to the 4.250% Notes due 2023 (incorporated by reference to Exhibit 4.3 to Prologis’ Current Report on Form 8-K filed August 15, 2013). |
|
4.26 |
|
Officers’ Certificate related to the 3.350% Notes due 2021 (incorporated by reference to Exhibit 4.1 to Prologis’ Current Report on Form 8-K filed November 1, 2013). |
|
4.27 |
|
Form of Officers’ Certificate related to the 3.375% Notes due 2024 (incorporated by reference to Exhibit 4.2 to Prologis’ Current Report on Form 8-K filed February 18, 2014). |
117
|
|
Form of Officer’s Certificate related to the 3.00% Notes due 2026 (incorporated by reference to Exhibit 4.1 to Prologis’ Current Report on Form 8-K filed on May 28, 2014). |
|
|
4.29 |
|
Form of Officer’s Certificate related to 1.375% Notes due 2020 (incorporated by reference to Exhibit 4.1 to Prologis’ Current Report on Form 8-k filed on October 6, 2014). |
|
4.30 |
|
Form of Officers’ Certificate related to the 1.375% Notes due 2021 (incorporated by reference to Exhibit 4.1 of Prologis’ Current Report on Form 8-K filed May 12, 2015). |
|
4.31 |
|
Form of 1.375% Notes due 2021 (incorporated by reference to Exhibit 4.2 of Prologis’ Current Report on Form 8-K filed May 12, 2015). |
|
4.32 |
|
Form of Officers’ Certificate related to the 3.750% Notes due 2025 (incorporated by reference to Exhibit 4.1 to Prologis’ Current Report on Form 8-K filed on October 30, 2015). |
|
4.33 |
|
Form of 3.750% Notes due 2025 (incorporated by reference to Exhibit 4.2 of Prologis’ Current Report on Form 8-K filed October 30, 2015). |
Other debt instruments are omitted in accordance with Item 601(b)(4)(iii)(A) of Registration S-K. Copies of such instruments will be furnished to the Securities and Exchange Commission upon request.
|
10.1 |
|
Agreement of Limited Partnership of ProLogis Limited Partnership-I, dated as of December 22, 1993 (incorporated by reference to Exhibit 10.4 to the Trust’s Registration Statement (No. 33-73382)) . |
|
10.2 |
|
Amended and Restated Agreement of Limited Partnership of ProLogis Fraser, L.P., dated as of August 4, 2004 (incorporated by reference to Exhibit 10.1 to the Trust’s Quarterly Report on Form 10-Q for the quarter ended September 30, 2004). |
|
10.3 |
|
Fifteenth Amended and Restated Agreement of Limited Partnership of Prologis 2, L.P., (f/k/a AMB Property II, L.P.) dated February 19, 2010 (incorporated by reference to Exhibit 10.6 to Prologis’ Annual Report on Form 10-K for the year ended December 31, 2009). |
|
10.4* |
|
The Third Amended and Restated 1997 Stock Option and Incentive Plan of AMB Property Corporation and AMB Property, L.P. (incorporated by reference to Exhibit 10.22 to Prologis’ Annual Report on Form 10-K for the year ended December 31, 2001 and also incorporated by reference to Exhibit 10.19 to the Operating Partnership’s Annual Report on Form 10-K for the year ended December 31, 2001). |
|
10.5* |
|
Amendment No. 1 to the Third Amended and Restated 1997 Stock Option and Incentive Plan of AMB Property Corporation and AMB Property, L.P. (incorporated by reference to Exhibit 10.23 to Prologis’ Annual Report on Form 10-K for the year ended December 31, 2001 and also incorporated by reference to Exhibit 10.20 to the Operating Partnership’s Annual Report on Form 10-K for the year ended December 31, 2001). |
|
10.6* |
|
Amendment No. 2 to the Third Amended and Restated 1997 Stock Option and Incentive Plan of AMB Property Corporation and AMB Property, L.P. (incorporated by reference to Exhibit 10.5 to Prologis’ Quarterly Report on Form 10-Q for the quarter ended March 31, 2004 and also incorporated by reference to Exhibit 10.4 to the Operating Partnership’s Quarterly Report on Form 10-Q for the quarter ended March 31, 2004). |
|
10.7* |
|
Amended and Restated 2002 Nonqualified Deferred Compensation Plan (incorporated by reference to Exhibit 10.2 to Prologis’ Current Report on Form 8-K filed October 4, 2006 and also incorporated by reference to Exhibit 10.2 to the Operating Partnership’s Current Report on Form 8-K filed October 4, 2006). |
|
10.8* |
|
The Amended and Restated 2002 Stock Option and Incentive Plan of AMB Property Corporation and AMB Property, L.P. (incorporated by reference to Exhibit 10.1 to Prologis’ Current Report on Form 8-K filed May 15, 2007 and also incorporated by reference to Exhibit 10.1 to the Operating Partnership’s Current Report on Form 8-K filed May 15, 2007). |
|
10.9* |
|
Prologis Outperformance Plan (incorporated by reference to Exhibit 10.1 to Prologis’ Current Report on Form 8-K filed December 22, 2011). |
|
10.10* |
|
Prologis, Inc. 2016 Outperformance Plan (incorporated by reference to Exhibit 10.1 to Prologis’ Current Report on Form 8-K filed on August 17, 2016). |
|
10.11* |
|
Form of Prologis, Inc. 2016 Outperformance Plan LTIP Unit Award Agreement (incorporated by reference to Exhibit 10.2 to Prologis’ Current Report on Form 8-K filed on August 17, 2016). |
|
10.12* |
|
Form of Participation Points and LTIP Unit Award Agreement (incorporated by reference to Exhibit 10.1 to Prologis’ Current Report on Form 8-K filed on February 27, 2014). |
|
10.13* |
|
Second Amended and Restated Prologis Promote Plan (incorporated by reference to Exhibit 10.1 to Prologis’ Current Report on Form 8-K filed on August 1, 2014). |
118
119
120
|
* |
Management Contract or Compensatory Plan or Arrangement |
|
† |
Filed herewith |
121